Embed Size (px)
Citation preview

Excerpt from the book : Scilab from Theory to Practice – I. Fundamentals
written by Philippe Roux, translated into English by Perrine Mathieu – © 2016 Éditions D-BookeR
page 14
3The Graphical InterfaceIn addition to the console, Scilab's graphical interface is made up of several windowswhich can be added to or removed from the main window (see Figure 2.2 video). In thischapter, you will learn the basic functionalities of Scilab's main windows.
3.1. The online help
The first window to be familiar with is, without doubt, the help browser window. It canbe accessed in different ways:
• from the menu bar by clicking ? then SCILAB HELP
• by pressing the F1 key
• from the toolbar shortcut (see Figure 3.1)
Figure 3.1 : Toolbar shortcut for the online help
• from the console by entering one of the following commands:
– help which lets you know what a command does and how to use it
– apropos which lets you know which commands are relevant to a topic orkeyword
-->apropos sinus -->help sin
In either case, the window in Figure 3.2 opens up.

Excerpt from the book : Scilab from Theory to Practice – I. Fundamentals
written by Philippe Roux, translated into English by Perrine Mathieu – © 2016 Éditions D-BookeR
Scilab from Theory to Practice - I. Fundamentals
page 15
Figure 3.2 : Help window
Tip > If you wish to get help on the sin command, enter help sin. On the other hand, if you needhelp with the mathematical concept of sine, use apropos sine. In both cases, you should get a linkredirecting you towards the sine function's help page.
For each command, the help page is made up of several sections:
Calling sequence
Describes how to call a command to evaluate it in the Scilab console. In general,the calling sequence is of the form:
[output1,output2,...]=command(input1,input2,[option1,[option2]])
This sequence format means that command takes in two input values, indicated by in-put1 and input2, and two optional values, option1 et option2, enclosed in brack-ets [ and ]. The output values output1 and output2 can be retrieved by usingbrackets. There are several ways to call the command, for example:
• ouput1=command(input1,input2)
• [output1,output2]=command(input1,input2)

Excerpt from the book : Scilab from Theory to Practice – I. Fundamentals
written by Philippe Roux, translated into English by Perrine Mathieu – © 2016 Éditions D-BookeR
Scilab from Theory to Practice - I. Fundamentals
page 16
• [output1,output2]=command(input1,input2,option1)
• output1=command(input1,input2,option1,option2)
• ...
Caution > Whatever the syntax used, the value of output2 can never be retrieved without the valueof output1. Likewise, option2 cannot be specified without first specifying option1.
Arguments
Describes the type of arguments expected for the different values(input1,input2,option1,... output2) present in the calling sequence (see Chap-ter Variables, Constants and Types).
Description
Provides a more detailed explanation of what the command does.
Examples
Demonstrates how to use the command through examples of varying complexity. Thesource code displayed in the shaded box can be directly executed in the consoleor opened in the text editor by clicking the two buttons in the upper-right corner(See Figure 3.3).
Figure 3.3 : Online help source code
See also
Redirects to other help pages which may supplement the command help page.
Excerpt from the book : Scilab from Theory to Practice – I. Fundamentals
written by Philippe Roux, translated into English by Perrine Mathieu – © 2016 Éditions D-BookeR
Scilab from Theory to Practice - I. Fundamentals
page 17
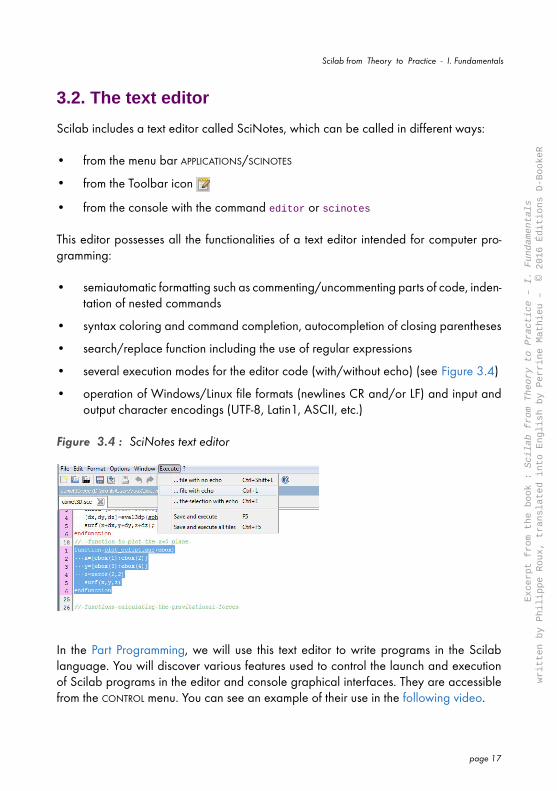
3.2. The text editor
Scilab includes a text editor called SciNotes, which can be called in different ways:
• from the menu bar APPLICATIONS/SCINOTES
• from the Toolbar icon
• from the console with the command editor or scinotes
This editor possesses all the functionalities of a text editor intended for computer pro-gramming:
• semiautomatic formatting such as commenting/uncommenting parts of code, inden-tation of nested commands
• syntax coloring and command completion, autocompletion of closing parentheses
• search/replace function including the use of regular expressions
• several execution modes for the editor code (with/without echo) (see Figure 3.4)
• operation of Windows/Linux file formats (newlines CR and/or LF) and input andoutput character encodings (UTF-8, Latin1, ASCII, etc.)
Figure 3.4 : SciNotes text editor
In the Part Programming, we will use this text editor to write programs in the Scilablanguage. You will discover various features used to control the launch and executionof Scilab programs in the editor and console graphical interfaces. They are accessiblefrom the CONTROL menu. You can see an example of their use in the following video.

Excerpt from the book : Scilab from Theory to Practice – I. Fundamentals
written by Philippe Roux, translated into English by Perrine Mathieu – © 2016 Éditions D-BookeR
Scilab from Theory to Practice - I. Fundamentals
page 18
Figure 3.5 : Controlling the execution of Scilab programs (video)

Excerpt from the book : Scilab from Theory to Practice – I. Fundamentals
written by Philippe Roux, translated into English by Perrine Mathieu – © 2016 Éditions D-BookeR
Scilab from Theory to Practice - I. Fundamentals
page 19
3.3. Other windowsOther Scilab windows have different specific purposes which are outlined here.
Graphics window
Scilab has a large range of graphical capabilities which, when used, cause a graph-ics window to open. For example, executing the plot command from the consoleopens up the graphics window shown in Figure 3.6.
Figure 3.6 : Scilab graphics window
We will study Scilab's graphics properties in detail in Part Creating Plots and you willsee how to create various figures in two as well as three dimensions! The graphicswindow lets the user interact easily with these figures. With the help of a mouse,you can for instance:
• zoom in and out, and restore the initial display scale
• modify the view angle for three-dimensional figures

Excerpt from the book : Scilab from Theory to Practice – I. Fundamentals
written by Philippe Roux, translated into English by Perrine Mathieu – © 2016 Éditions D-BookeR
Scilab from Theory to Practice - I. Fundamentals
page 20
The following video demonstrates how to use these capabilities.
Figure 3.7 : Zooming and modifying the view angle (video)
Scilab's graphics capabilities are based on a very detailed hierarchical display ofgraphics objects. This not only allows the creation of complex figures but also of newgraphical interfaces (see Section 23.4, Creating your own graphical interfaces). Agraphics editor, accessible from the menu bar in the graphics window (menu EDIT
then FIGURE PROPERTIES), lets you navigate and modify the different parameters thatconstitute the graph. The graphics window incorporates modifications in real time(see the following video).
Figure 3.8 : Using the graphics editor (video)

Excerpt from the book : Scilab from Theory to Practice – I. Fundamentals
written by Philippe Roux, translated into English by Perrine Mathieu – © 2016 Éditions D-BookeR
Scilab from Theory to Practice - I. Fundamentals
page 21
Caution > The graphics editor currently does not work on the Scilab Mac OS versions.
ATOMS
The external module manager ATOMS lets you install or uninstall supplementarymodules related to Scilab. These modules add advanced capabilities to the soft-ware, for example SIVP can be used for image processing or Metanet for graphingand network computations (see Section 5.4, Supplementary modules on Forge).
Figure 3.9 : Choosing the SIVP supplementary module from the ATOMSwindow
Xcos
The bloc-diagram editor Xcos, Scilab's equivalent of Matlab's Simulink toolbox, letsyou simulate dynamical systems. For more information on Xcos, see the manuel thatis dedicated to it.

Excerpt from the book : Scilab from Theory to Practice – I. Fundamentals
written by Philippe Roux, translated into English by Perrine Mathieu – © 2016 Éditions D-BookeR
Scilab from Theory to Practice - I. Fundamentals
page 22
Figure 3.10 : Xcos diagram of a vehicle suspension
Various tool managers
Several managers have been added to Scilab since version 5: a history manager,a variable editor and a file browser. They are loaded by default the first time Scilabis launched (see Figure 2.1). You can also launch them from the console with thecommands: filebrowser, browsevar, editvar and browsehistory.