Embed Size (px)
Citation preview
The Grand Energy Challenges: the Next Fifty Years and Beyond
Mark D. Levine, Lawrence Berkeley National Laboratory
January 18, 2007Tokyo, Japan
Grand Challenges
• Energy and energy services for poverty alleviation
• Liquid fuels for transportation
• Global climate change

I. Historical Overview of Energy Supply and Demand
A Global View

World Energy 1850-2000
050
100150200250300350400450500
1850 1875 1900 1925 1950 1975 2000
Year
EJ/
year
GasOilCoalNuclearHydro +Biomass
World Energy Supply, 1850-2000
Hydro+ means hydropower plus other renewables besides biomass
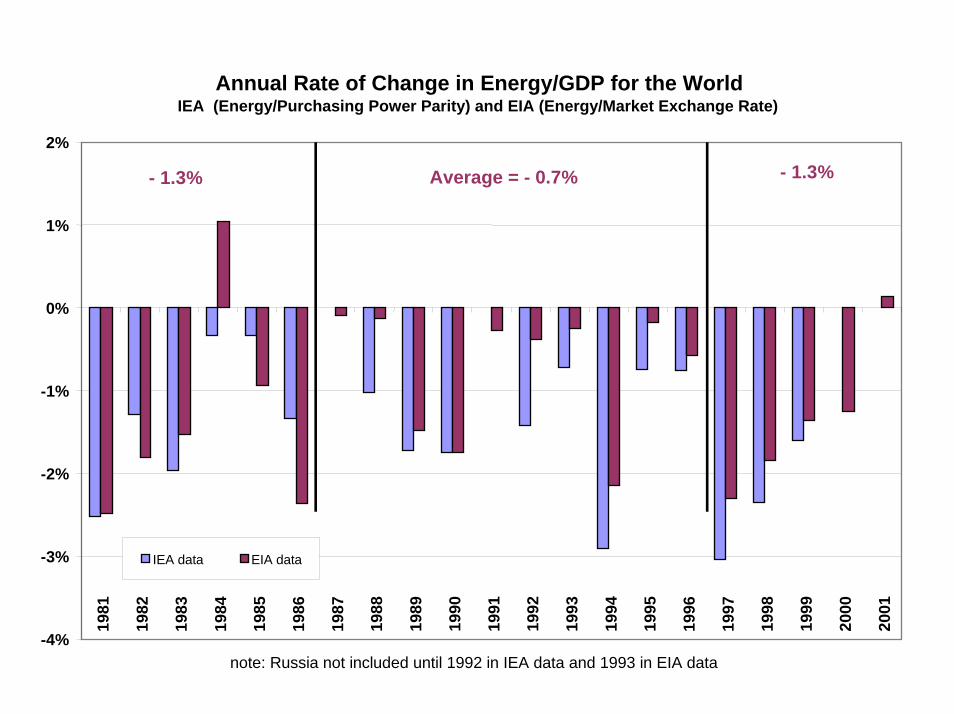
Annual Rate of Change in Energy/GDP for the World IEA (Energy/Purchasing Power Parity) and EIA (Energy/Market Exchange Rate)
-4%
-3%
-2%
-1%
0%
1%
2%
1981
1982
1983
1984
1985
1986
1987
1988
1989
1990
1991
1992
1993
1994
1995
1996
1997
1998
1999
2000
2001
IEA data EIA data
note: Russia not included until 1992 in IEA data and 1993 in EIA data
- 1.3% - 1.3%Average = - 0.7%

Industrialized Countries
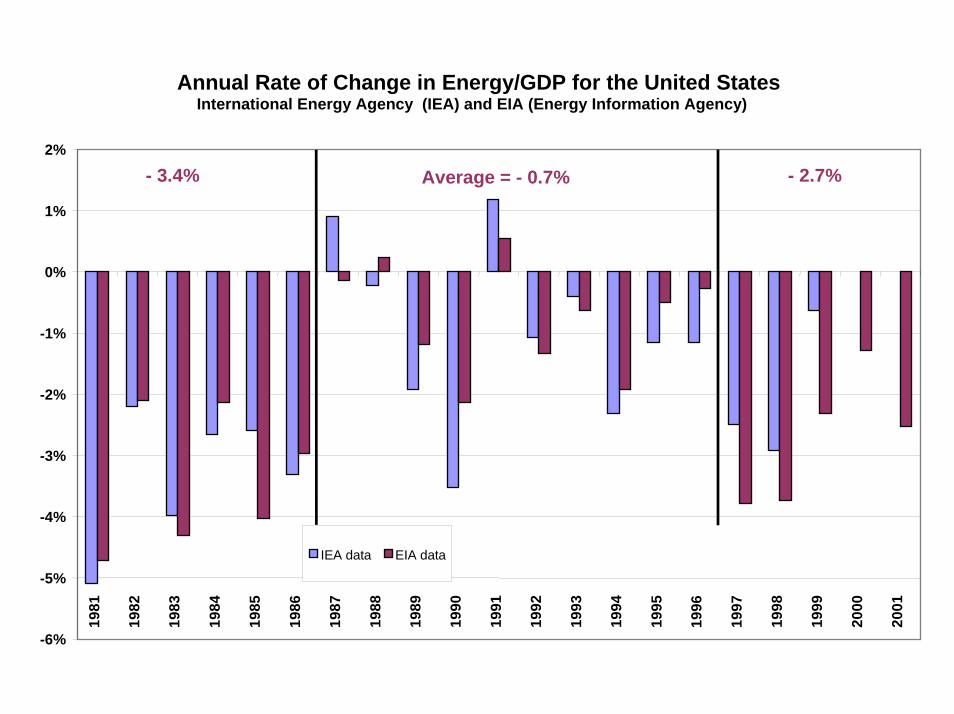
Annual Rate of Change in Energy/GDP for the United StatesInternational Energy Agency (IEA) and EIA (Energy Information Agency)
-6%
-5%
-4%
-3%
-2%
-1%
0%
1%
2%
1981
1982
1983
1984
1985
1986
1987
1988
1989
1990
1991
1992
1993
1994
1995
1996
1997
1998
1999
2000
2001
IEA data EIA data
- 2.7%Average = - 0.7%- 3.4%

Annual Rate of Change in Energy/GDP for Europe IEA (Energy/Purchasing Power Parity) for European Union and
Western Europe EIA (Energy/Market Exchange Rate)
-4%
-3%
-2%
-1%
0%
1%
2%
1981
1982
1983
1984
1985
1986
1987
1988
1989
1990
1991
1992
1993
1994
1995
1996
1997
1998
1999
2000
2001
IEA data EIA data
- 1.2% Average = - 1.3% - 1.4%

Source: World Energy Assessment 2004
The amount of energy needed per dollar of real GDP has been falling.
Grand Challenge: Can the industrialized world reduce use of energy* as well as carbon dioxide
emissions while preserving economic vitality
_______________________________________* Special concern about transportation fuels

Historical Overview
China

Annual Rate of Change in Energy/GDP for ChinaIEA (Energy/Purchasing Power Parity) and EIA (Energy/Market Exchange Rate)
-10%
-8%
-6%
-4%
-2%
0%
2%
1981
1982
1983
1984
1985
1986
1987
1988
1989
1990
1991
1992
1993
1994
1995
1996
1997
1998
1999
2000
2001
IEA data EIA data
- 4.8% Average = - 5.0% - 5.3%

0500
1,0001,5002,0002,5003,0003,5004,0004,500
1952 1957 1962 1967 1972 1977 1982 1987 1992 1997
Prim
ary E
nerg
y Use
(Mtc
e)
Consumption at 1977 Intensity, Reported GDPConsumption at 1977 Intensity, Adjusted GDPActual Consumption
Investment in energy efficiency and other policies greatly reduced China’s energy
intensity (1980-2000)
Energy Use, Actual and Projected at 1977 Intensity, 1952-1999
Source: NBS
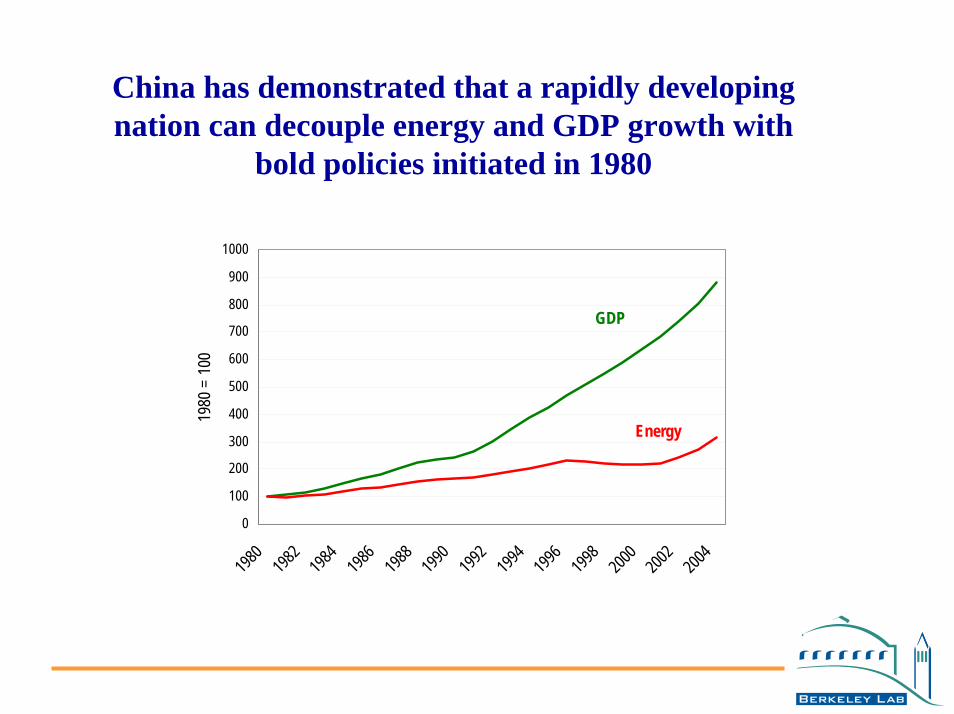
China has demonstrated that a rapidly developing nation can decouple energy and GDP growth with
bold policies initiated in 1980
0
100
200
300
400
500
600
700
800
900
1000
1980
1982
1984
1986
1988
1990
1992
1994
1996
1998
2000
2002
2004
1980
= 1
00
GDP
Energy
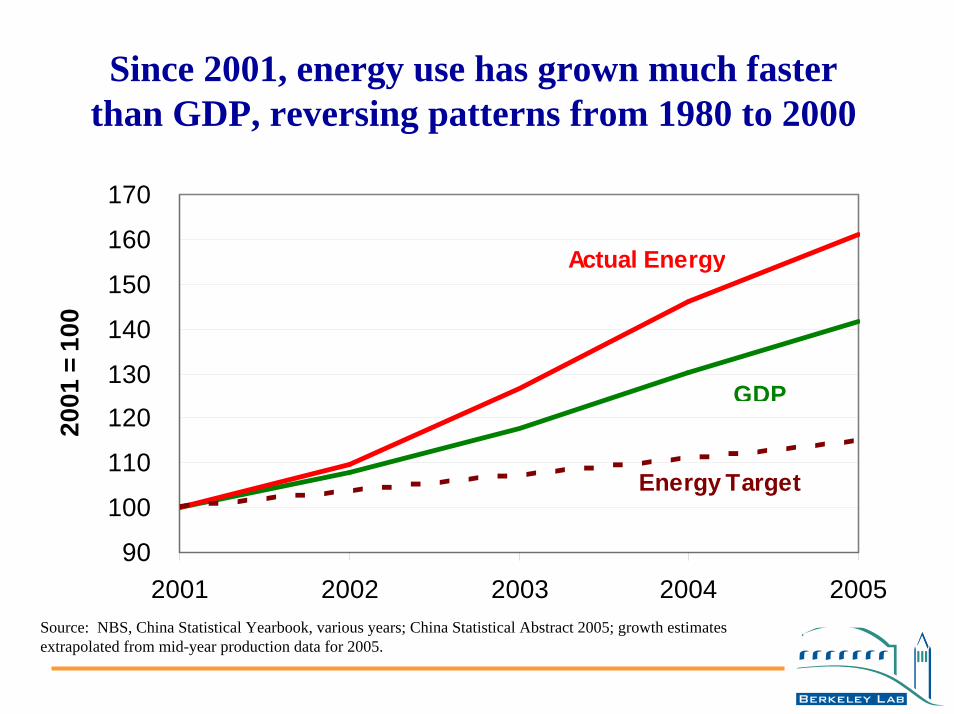
Since 2001, energy use has grown much faster than GDP, reversing patterns from 1980 to 2000
90
100
110
120
130
140
150
160
170
2001 2002 2003 2004 2005
2001
= 1
00
GDP
Actual Energy
Energy Target
Source: NBS, China Statistical Yearbook, various years; China Statistical Abstract 2005; growth estimates extrapolated from mid-year production data for 2005.

China’s government now recognizes the urgency of energy efficiency
• The reform period (1980-2000) showed that energy efficiency was essential to achieve economic goals and that it could be achieved (Deng Xiaoping)
• The current leadership recognizes the same imperative (Plenary of the Communist Party, Nov, 2005)
– Premier Wen Jiabao: “Energy use per unit of GDP must be reduced by 20% from 2005 to 2010.”
• Statement reiterated by the National Peoples Congress (March 2006), incorporated in 5-Year Plan; efforts to implement underway
Grand Challenge: Can the developing world (including China) follow the remarkable Chinese example of the 1980-2000 period, with reduced energy demand growth supporting poverty alleviation and social/economic development?
Or will the more recent period foreshadow the future

II. Transportation Fuels: the Oil Challenge

World Energy 1850-2000
050
100150200250300350400450500
1850 1875 1900 1925 1950 1975 2000
Year
EJ/
year
GasOilCoalNuclearHydro +Biomass
The world energy system is increasingly dominated by oil and gas.
World energy supply
Hydro+ means hydropower plus other renewables besides biomass
0
20
40
60
80
100
120
140
EmergingAsia
EmergingAsia
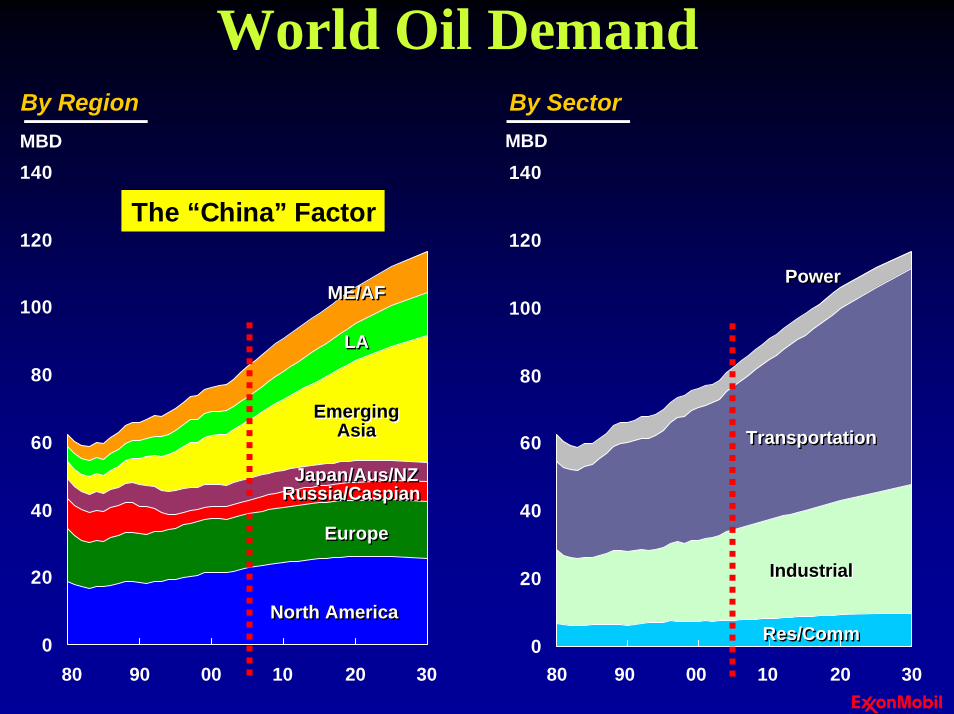
By RegionMBD
North AmericaNorth America
EuropeEurope
Japan/Aus/NZJapan/Aus/NZ
LALA
ME/AFME/AF
0
20
40
60
80
100
120
140
By SectorMBD
Res/CommRes/Comm
IndustrialIndustrial
PowerPower
Russia/CaspianRussia/Caspian
TransportationTransportation
80 90 00 10 20 30 80 90 00 10 20 30
World Oil Demand
The “China” Factor
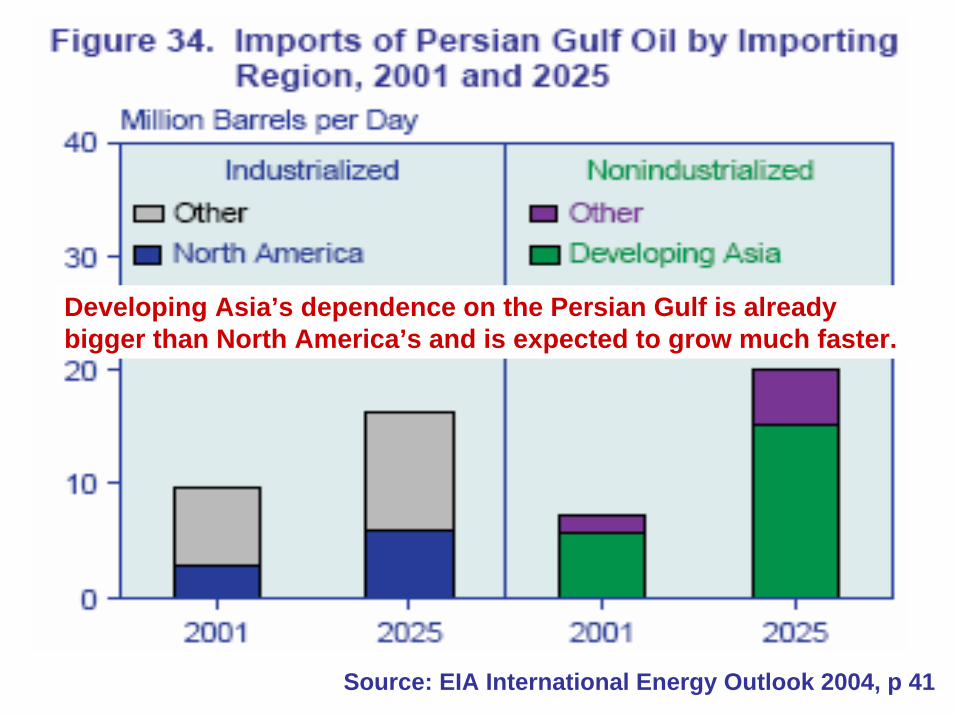
Developing Asia’s dependence on the Persian Gulf is already bigger than North America’s and is expected to grow much faster.
Source: EIA International Energy Outlook 2004, p 41
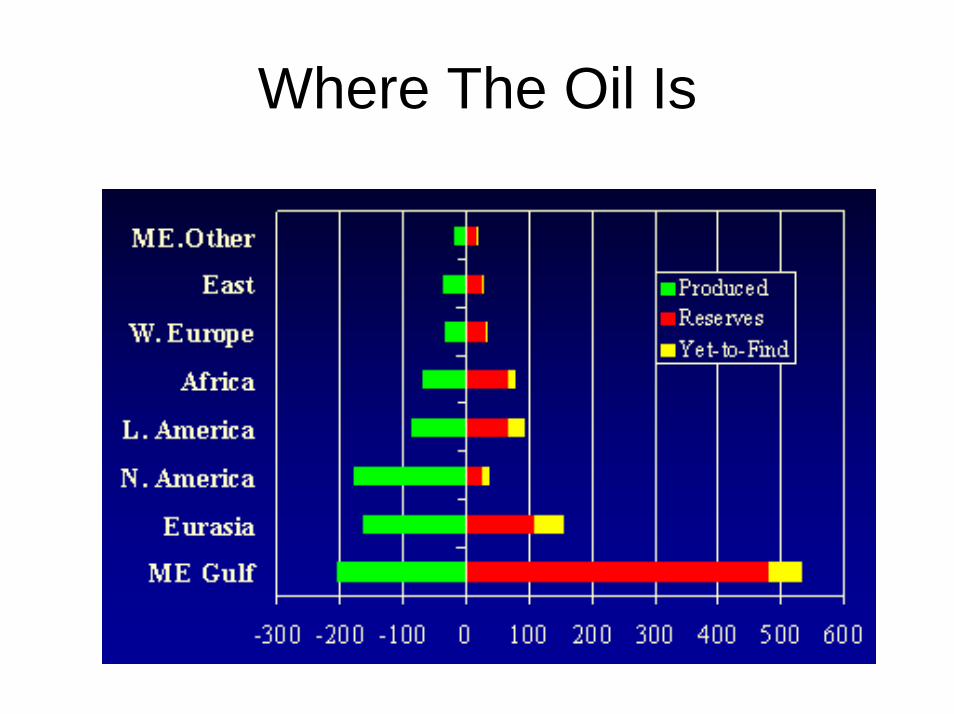
Where The Oil Is

Saudi Oil
One “super giant” field (Ghawar) contains 50% of all Saudi oil4 other super giant oilfields make up an additional 40%And 3 others are another 8%All fields are between 40 and 60 years old All are reaching point of declineHalf of “proven reserves” are questionableRemaining oil is increasingly difficult to produce.
Saudi Importance
• Can produce about 10-12 Mbpd or about 12% of current world oil demand
• Has more than 22% of reported “proven”reserves worldwide
• Will become the sole arbiter of price when remainder of world oil peaks – this is coming soon
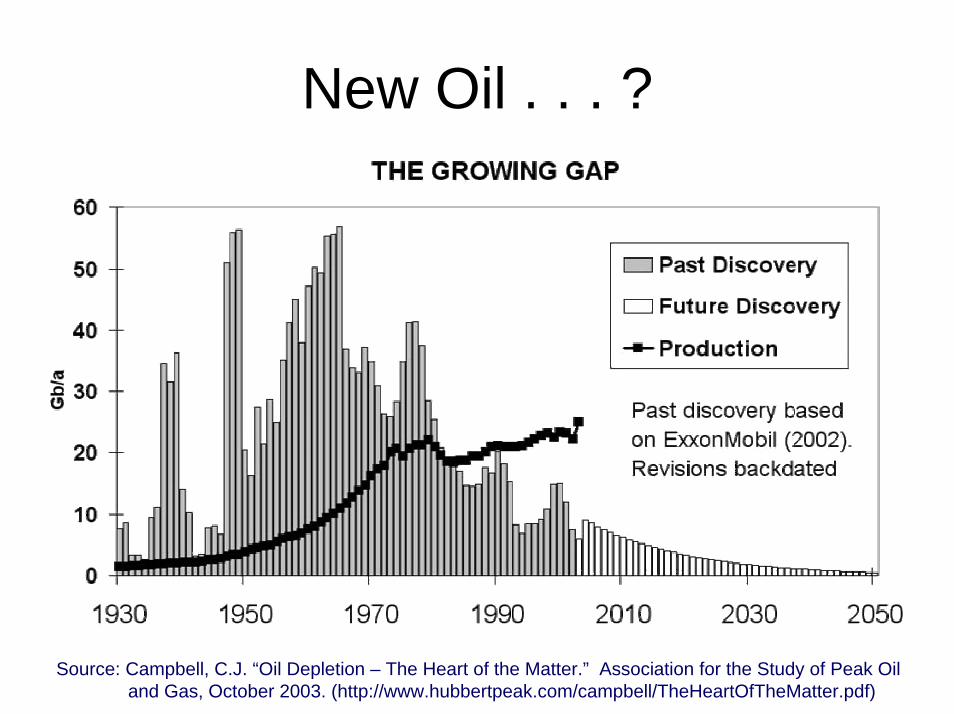
New Oil . . . ?
Source: Campbell, C.J. “Oil Depletion – The Heart of the Matter.” Association for the Study of Peak Oil and Gas, October 2003. (http://www.hubbertpeak.com/campbell/TheHeartOfTheMatter.pdf)
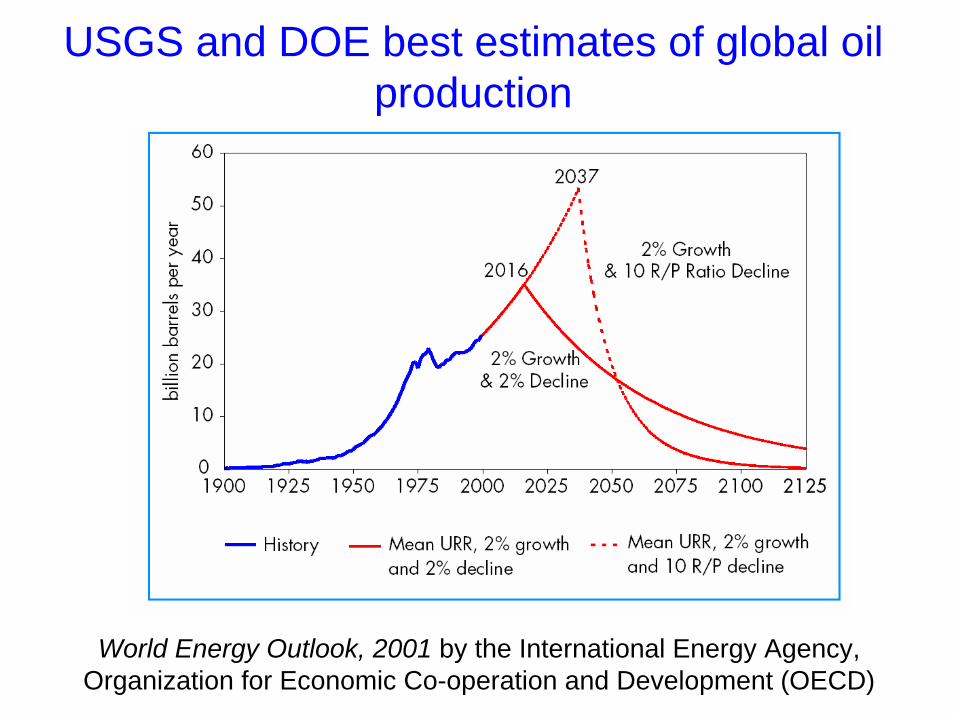
USGS and DOE best estimates of global oil production
World Energy Outlook, 2001 by the International Energy Agency, Organization for Economic Co-operation and Development (OECD)
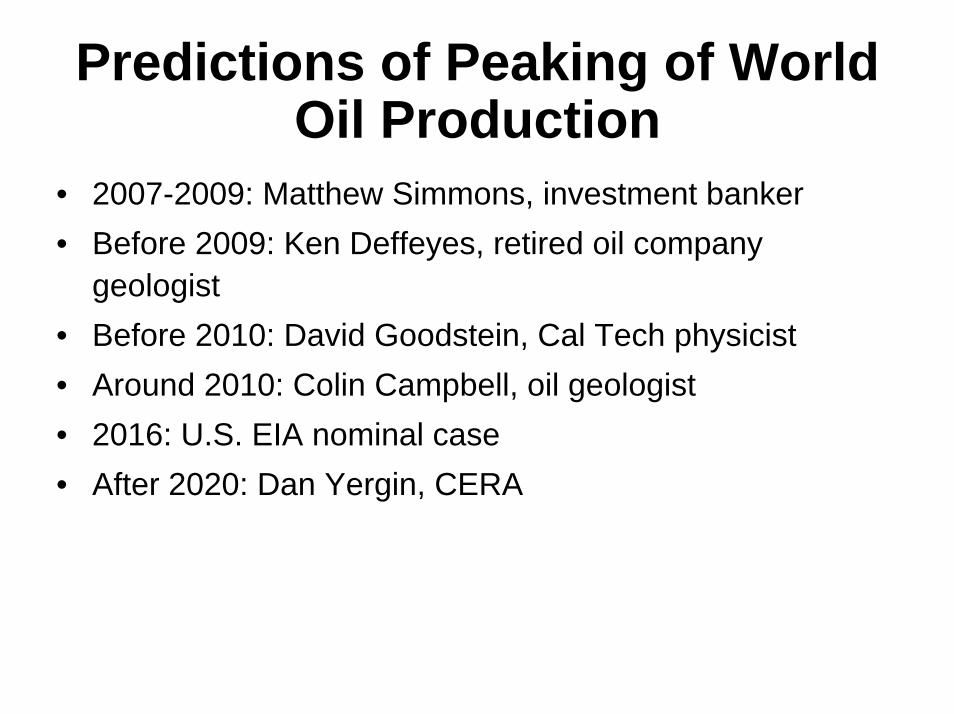
Predictions of Peaking of World Oil Production
• 2007-2009: Matthew Simmons, investment banker• Before 2009: Ken Deffeyes, retired oil company
geologist• Before 2010: David Goodstein, Cal Tech physicist• Around 2010: Colin Campbell, oil geologist• 2016: U.S. EIA nominal case• After 2020: Dan Yergin, CERA
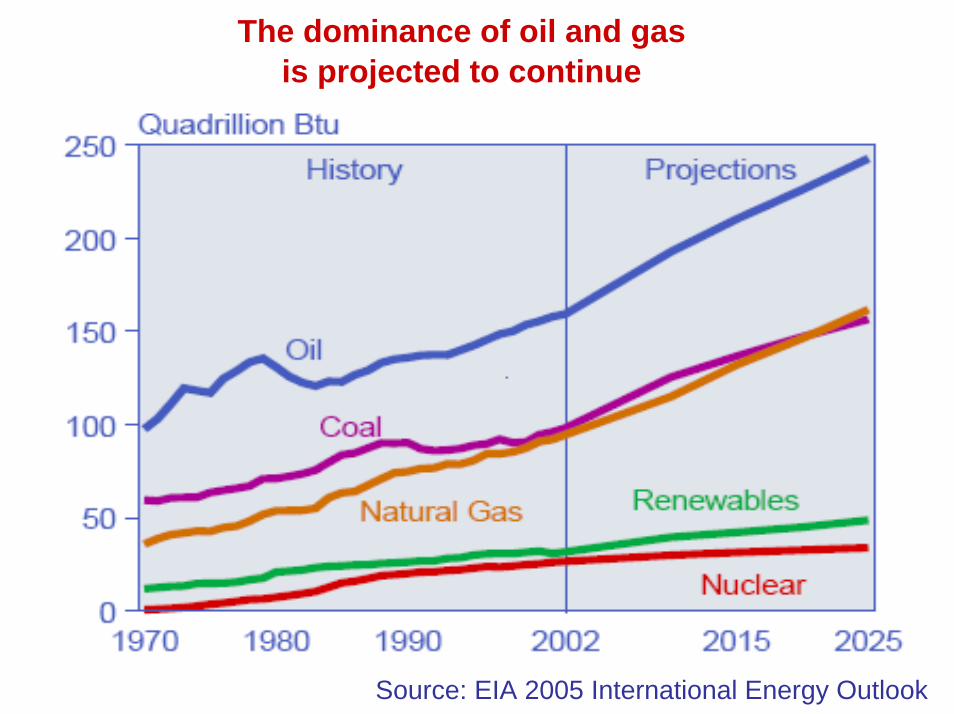
The dominance of oil and gasis projected to continue
Source: EIA 2005 International Energy Outlook

III. The Danger of Global Climate Change

The “Keeling Curve”
The sensitivity of these measurement is corroborated by the fact that peaks and valleys correspond to winter and summer in the northern hemisphere.
Mauna Loa, Hawaii (through 2004)
Source: Keeling, C.D. and T.P. Whorf, Carbon Dioxide Research Group, Scripps Institution of Oceanography, University of California, La Jolla, CA (http://cdiac.esd.ornl.gov/ftp/trends/co2/maunaloa.co2.)
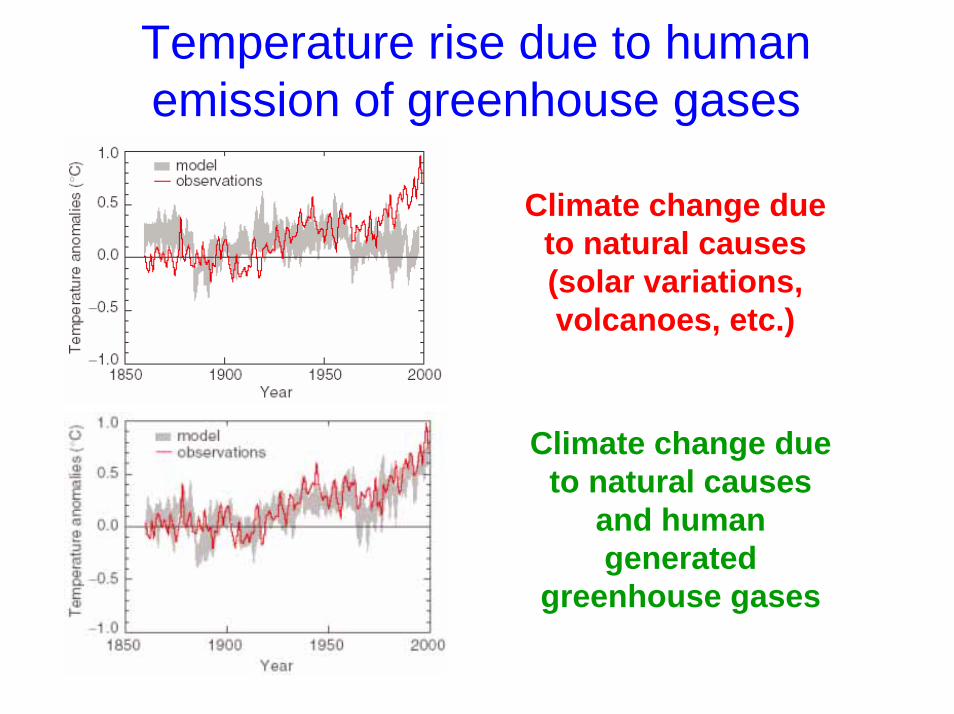
Temperature rise due to human emission of greenhouse gases
Climate change due to natural causes (solar variations, volcanoes, etc.)
Climate change due to natural causes
and human generated
greenhouse gases

IPCC 2001scenarios to 2100 ----------------
1000 years of Earth temperature history…and 100 years of projection
Global average surface temperature is an index of the state of the climate –and it’s heading for a state not only far outside the range of variation of the last 1000 years but outside the range experienced in the tenure of Homo sapiens on Earth.

400,000+ Years of Data!
Eons of data – well correlated to global temperature changeWhat will it take to tip the balance?o 550 ppm – very
scaryo +2 oC – equally
scaryAmplification is entirely possible
Before Present (PB) Limit
Evidence of Global Warming Is Mounting
• Greenhouse gases building up rapidly in the atmosphere; CO2 ~35% higher and CH4 ~170% higher than pre-industrial levels
• Average temperature increase of 0.6oC in past century; temperature rise accelerating
• More extreme weather events—drought, flooding, hurricanes
• Arctic, Antarctic and Greenland ice melt• Ocean acidification• Less snow and changes in rainfall in the West— impacts
on agriculture, water supply, wildfires, etc.

Larson Bice shelf break-up,
Antarctica, 2002
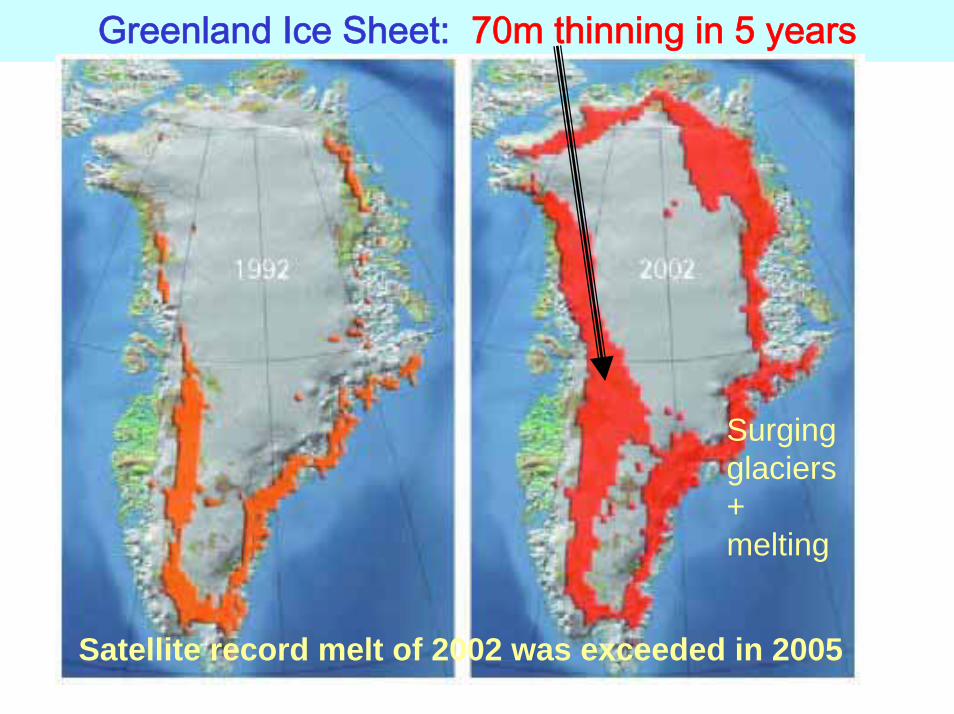
Greenland Ice Sheet: 70m thinning in 5 years
Satellite record melt of 2002 was exceeded in 2005
Surging glaciers + melting
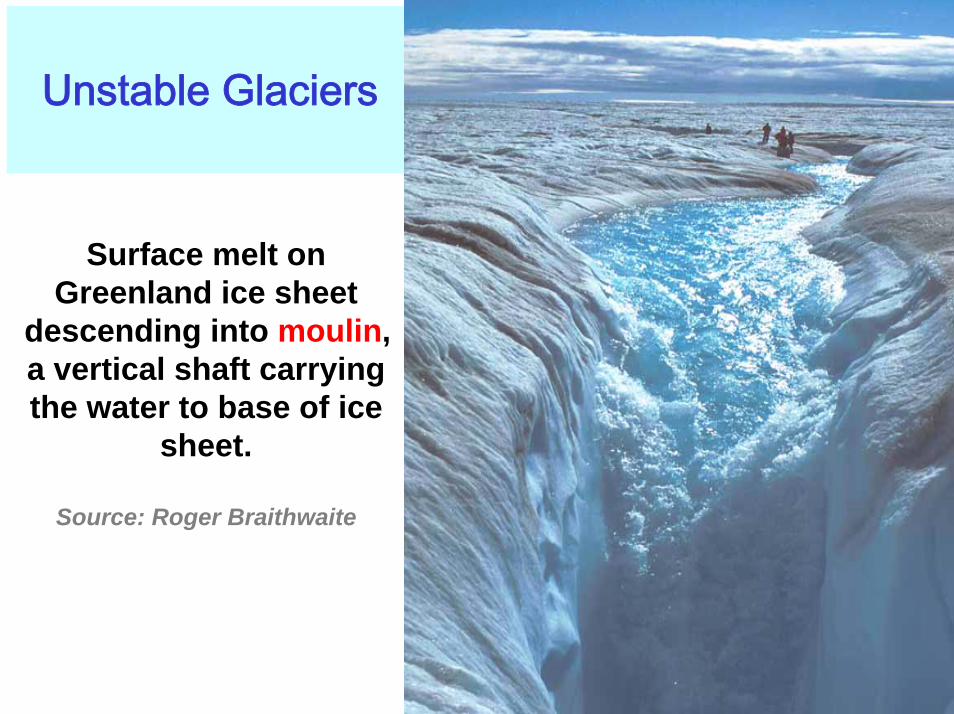
Unstable Glaciers
Surface melt on Greenland ice sheet
descending into moulin, a vertical shaft carrying the water to base of ice
sheet.
Source: Roger Braithwaite

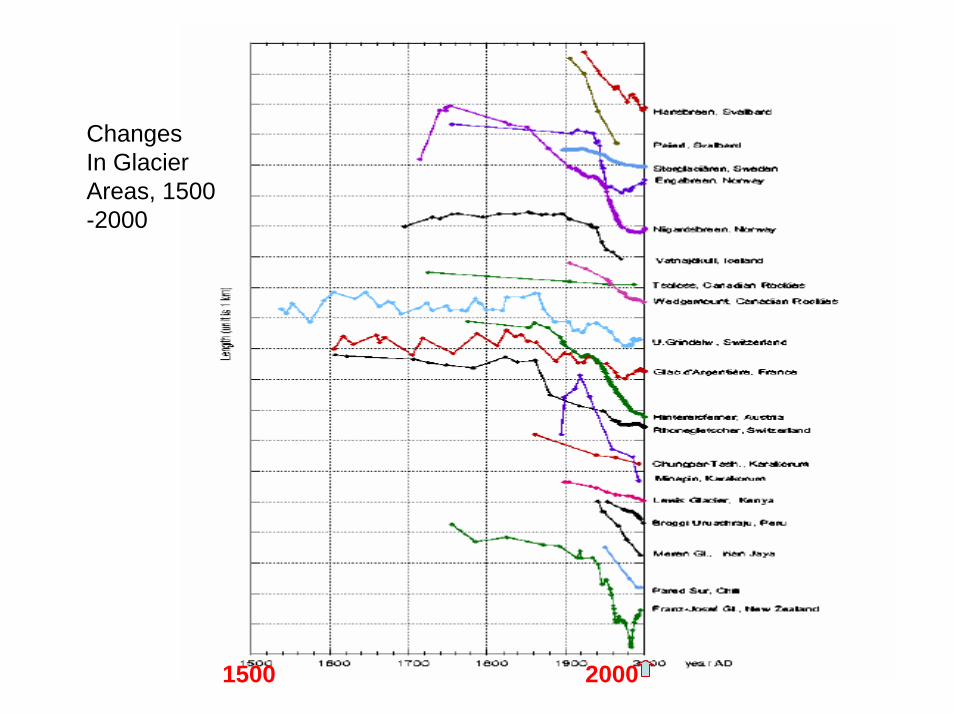
1500 2000
Changes In GlacierAreas, 1500-2000
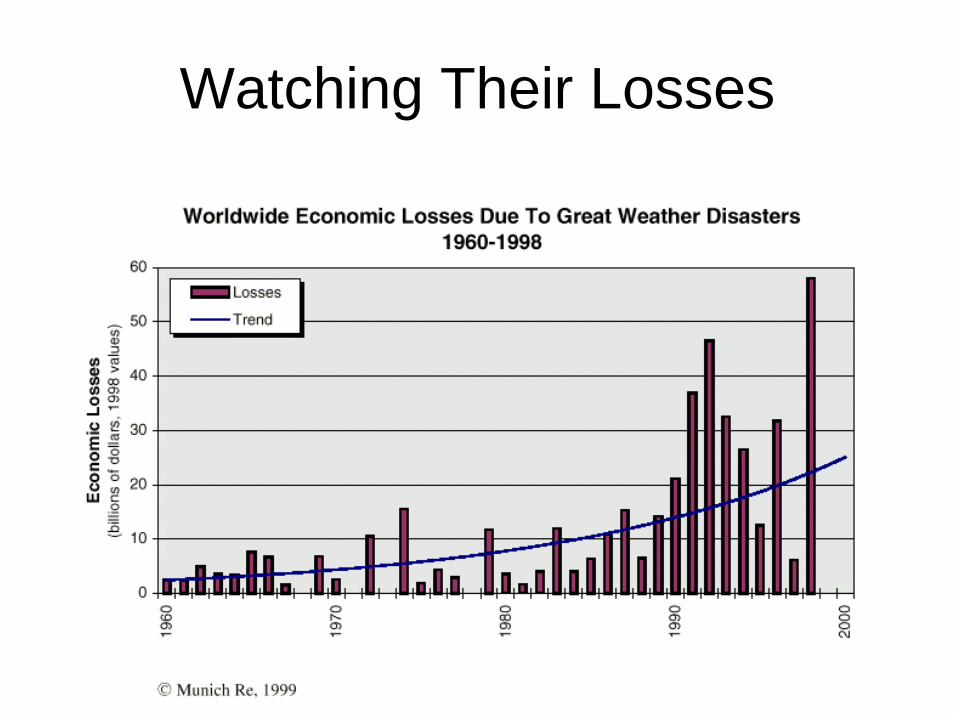
Watching Their Losses

Climate Feedbacks
Warming
Evaporation from ocean,Increase water vapor in atmEnhance greenhouse effect
Melt permafrost;Release large amounts of methane
Decrease snow cover;Decrease reflectivity of surfaceIncrease absorption of solar energy

What can be done to reduce CO2 emissions?

The Virtual Triangle: Large Carbon Savings Are Already in the Baseline
0
Historicalemissions
Emissions proportional to economic growth
205520051955
14
7
1.9
28
21
Currently projected path
Stabilization Triangle
Flat path
Virtual Triangle
GtC/yr
Models differ widely in their estimates of contributions to the virtual triangle from structural shifts (toward services), energy efficiency, and carbon-free energy.
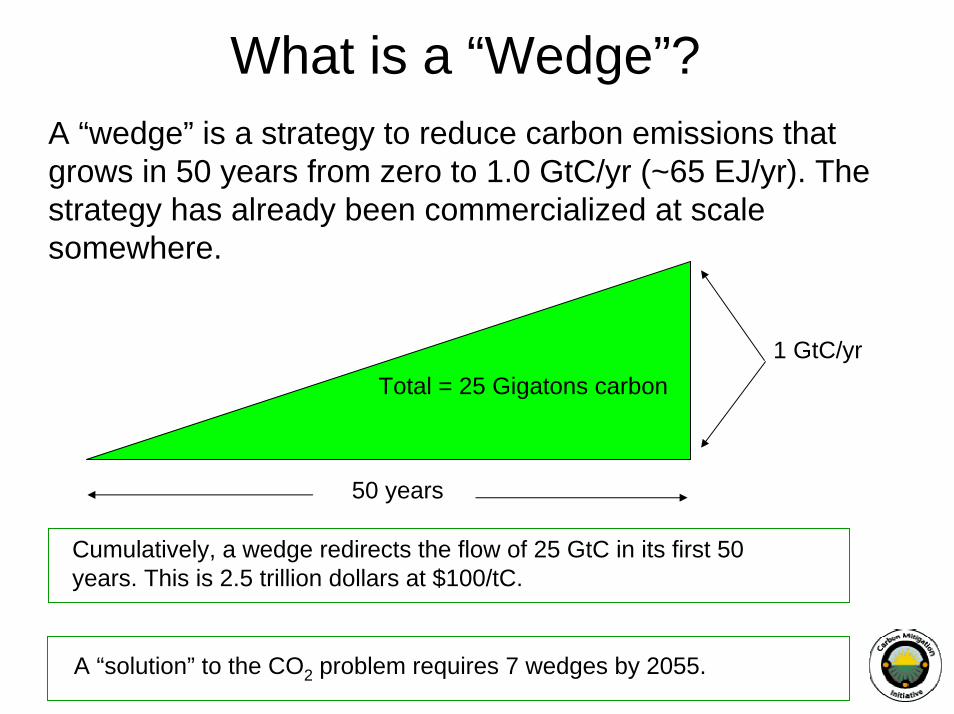
What is a “Wedge”?A “wedge” is a strategy to reduce carbon emissions that grows in 50 years from zero to 1.0 GtC/yr (~65 EJ/yr). The strategy has already been commercialized at scale somewhere.
1 GtC/yr
50 years
Total = 25 Gigatons carbon
Cumulatively, a wedge redirects the flow of 25 GtC in its first 50 years. This is 2.5 trillion dollars at $100/tC.
A “solution” to the CO2 problem requires 7 wedges by 2055.

20552005
14
7
Billion of Tons of Carbon Emitted per Year
19550
Currently
projected path
Flat path
Historicalemissions
1.9
14 GtC/y
7 GtC/y
Seven “wedges”
Wedges
O
2105

The 2°C target (yellow line) is much more challenging.

Example Wedges

At the power plant, CO2 heads for the sky, the electrons head for buildings!
1) Electricity in buildings, and 2) fossil fuel from all forms of transport are the components of CO2emissions that rise in a post-industrial society.
They are the two top places to look for wedges.
Source: U.S. EPA

Efficient Use of ElectricityEfficient Use of Electricity
lightingmotors cogeneration
Effort needed by 2055 for 1 wedge:.25% reduction in expected 2055 electricity use in commercial and residential buildings
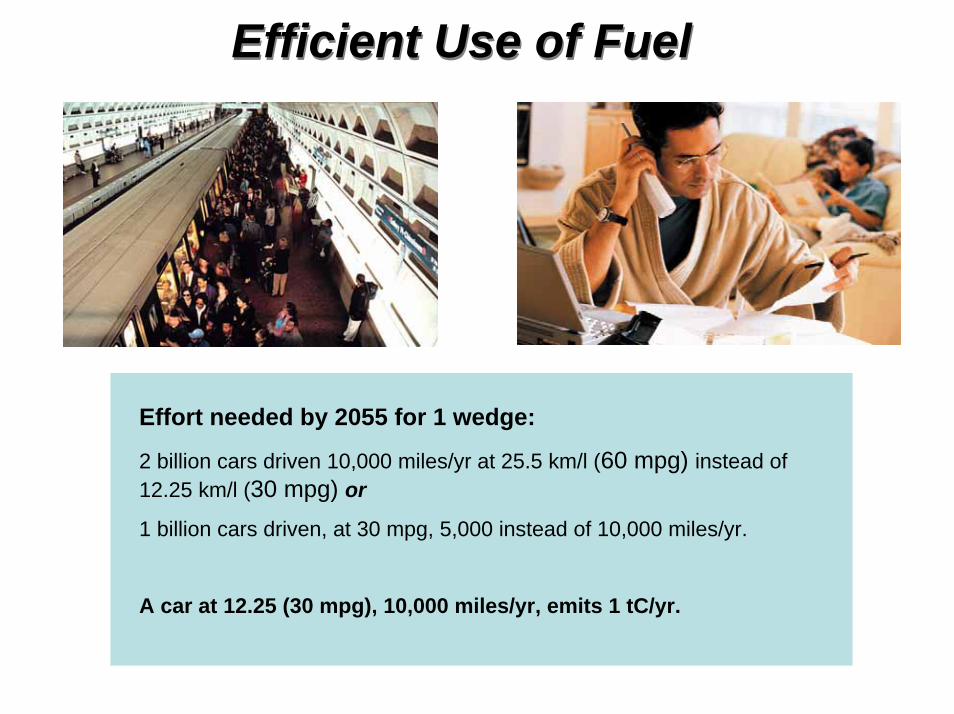
Efficient Use of FuelEfficient Use of Fuel
Effort needed by 2055 for 1 wedge:
2 billion cars driven 10,000 miles/yr at 25.5 km/l (60 mpg) instead of 12.25 km/l (30 mpg) or
1 billion cars driven, at 30 mpg, 5,000 instead of 10,000 miles/yr.
A car at 12.25 (30 mpg), 10,000 miles/yr, emits 1 tC/yr.
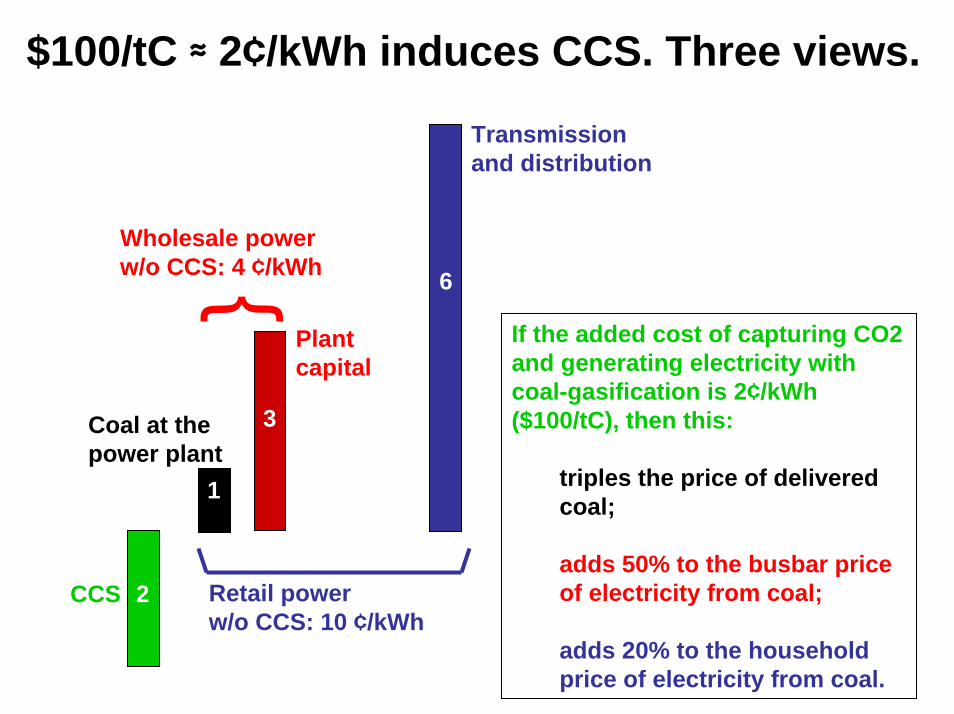
$100/tC ≈ 2¢/kWh induces CCS. Three views.
Transmission and distribution
Wholesale power w/o CCS: 4 ¢/kWh
CCS
Coal at the power plant
2
3
1
6 6
If the added cost of capturing CO2and generating electricity with coal-gasification is 2¢/kWh ($100/tC), then this:
triples the price of delivered coal;
adds 50% to the busbar price of electricity from coal;
adds 20% to the household price of electricity from coal.
Plant capital
Retail power w/o CCS: 10 ¢/kWh
Even if 7 or more wedges could be achieved by 2055 with existing resources and technology (an unlikely prospect), new carbon-neutral energy sources will be required. Transformation of energy supply is very slow, so much increased emphasis on R,D, &D is needed today.
The Long Term
Potential supply-side solutions to the Energy Problem
• Coal, tar sands, shale oil, …
• Fusion
• Fission
• Wind
• Solar photocells
• Bio-mass
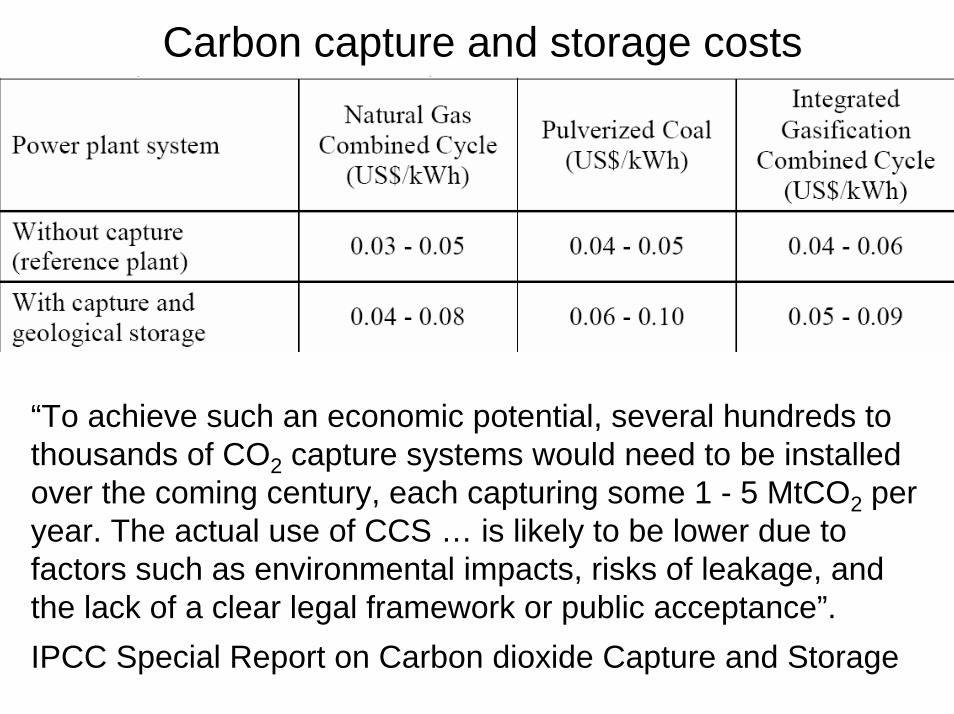
Carbon capture and storage costs
“To achieve such an economic potential, several hundreds to thousands of CO2 capture systems would need to be installed over the coming century, each capturing some 1 - 5 MtCO2 per year. The actual use of CCS … is likely to be lower due to factors such as environmental impacts, risks of leakage, and the lack of a clear legal framework or public acceptance”.IPCC Special Report on Carbon dioxide Capture and Storage
Potential supply-side solutions to the Energy Problem
• Coal, tar sands, shale oil, …
• Fusion
• Fission
• Wind
• Solar photocells
• Bio-mass
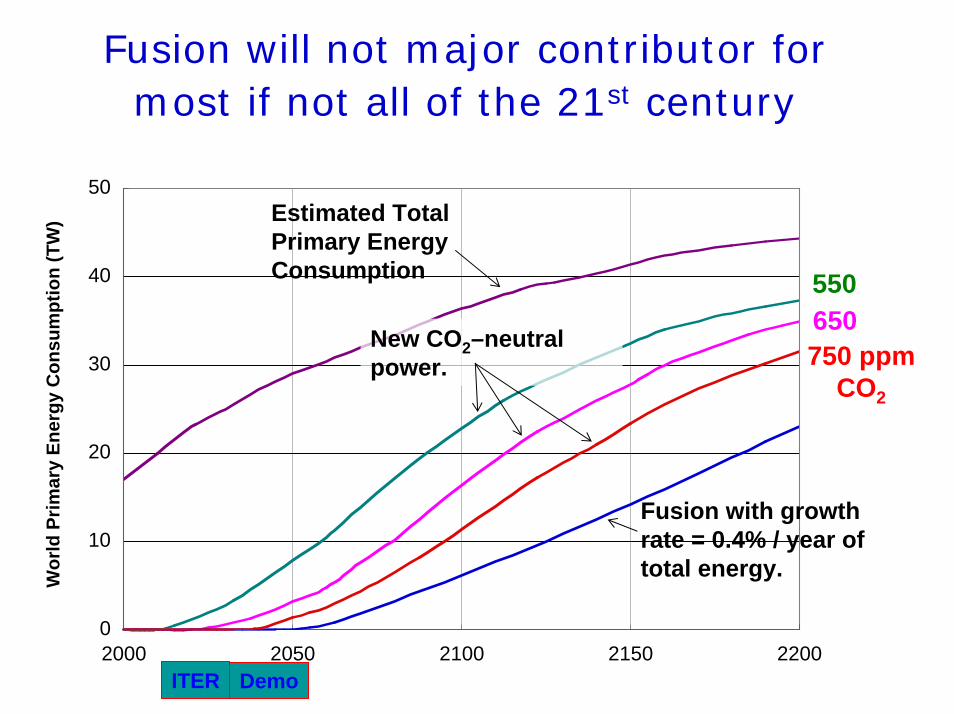
Fusion will not major contributor for most if not all of the 21st century
0
10
20
30
40
50
2000 2050 2100 2150 2200
New CO2–neutral power.
Estimated Total Primary Energy Consumption
Fusion with growth rate = 0.4% / year of total energy.
650550
750 ppmCO2
ITER Demo
Wor
ld P
rimar
y En
ergy
Con
sum
ptio
n (T
W)
Potential supply-side solutions to the Energy Problem
• Coal, tar sands, shale oil, …
• Fusion
• Fission
• Wind
• Solar photocells
• Bio-mass

Nuclear Fission
Nuclear fission has the technical and economic potential to have the greatest impact on CO2emissions today. . . but there are key issues that need to be addressed
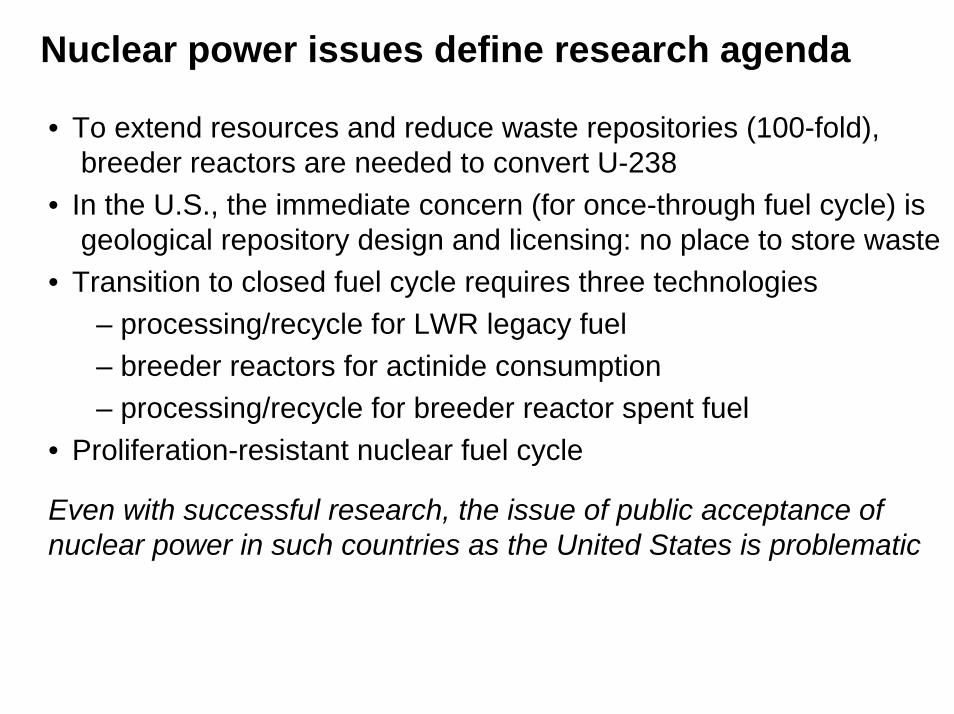
Nuclear power issues define research agenda
• To extend resources and reduce waste repositories (100-fold), breeder reactors are needed to convert U-238
• In the U.S., the immediate concern (for once-through fuel cycle) is geological repository design and licensing: no place to store waste
• Transition to closed fuel cycle requires three technologies– processing/recycle for LWR legacy fuel– breeder reactors for actinide consumption– processing/recycle for breeder reactor spent fuel
• Proliferation-resistant nuclear fuel cycle
Even with successful research, the issue of public acceptance ofnuclear power in such countries as the United States is problematic
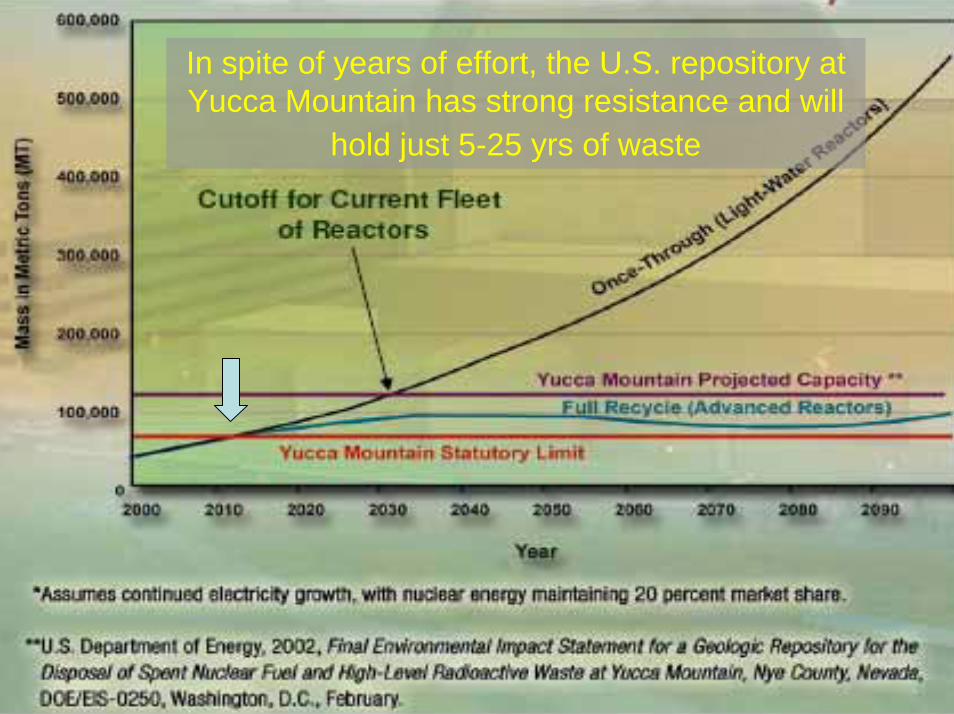
In spite of years of effort, the U.S. repository at Yucca Mountain has strong resistance and will
hold just 5-25 yrs of waste
Potential supply-side solutions to the Energy Problem
• Coal, tar sands, shale oil, …
• Fusion
• Fission
• Wind
• Solar photocells
• Bio-mass
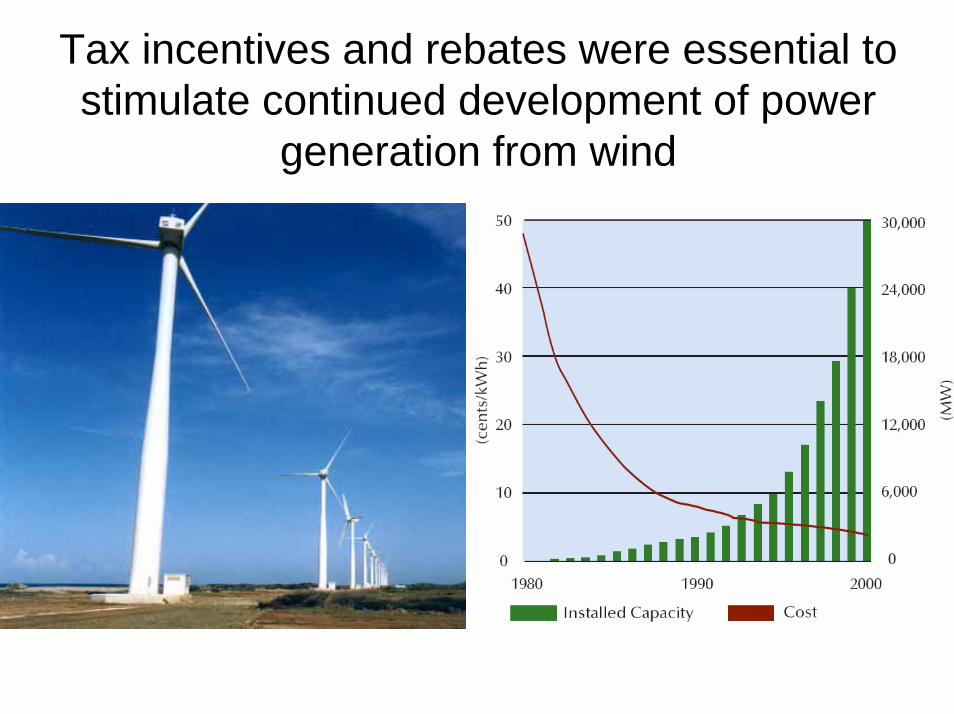
Tax incentives and rebates were essential to stimulate continued development of power
generation from wind

Is it possible to develop a new class of durable solar cells with high efficiency at 1/10th the
cost of silicon?
Potential supply-side solutions to the Energy Problem
• Coal, tar sands, shale oil, …
• Fusion
• Fission
• Wind
• Solar photocells
• Bio-mass
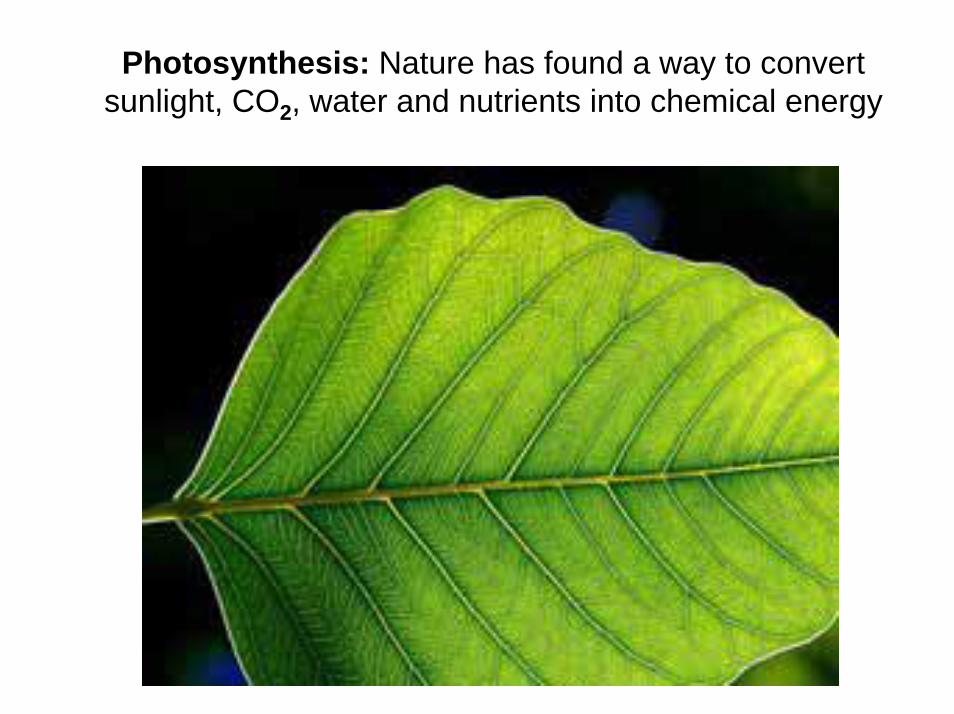
Photosynthesis: Nature has found a way to convert sunlight, CO2, water and nutrients into chemical energy

Synthetic Biology: Production of artemisinin in bacteria to produce low-cost malaria medicine:
with support from Bill Gates, project is successful
A-CoA
AA-CoA
HMG-CoA
Mev
Mev-P
Mev-PP IPP
PMK MPDMK idi ispAHMGSatoB tHMGR
DMAPP
AmorOPP
FPP
ADSIdentify the
biosynthesis pathways in
A. annua
Can synthetic organisms be engineered to produce ethanol, methanol or more suitable hydrocarbon fuel
biomass?
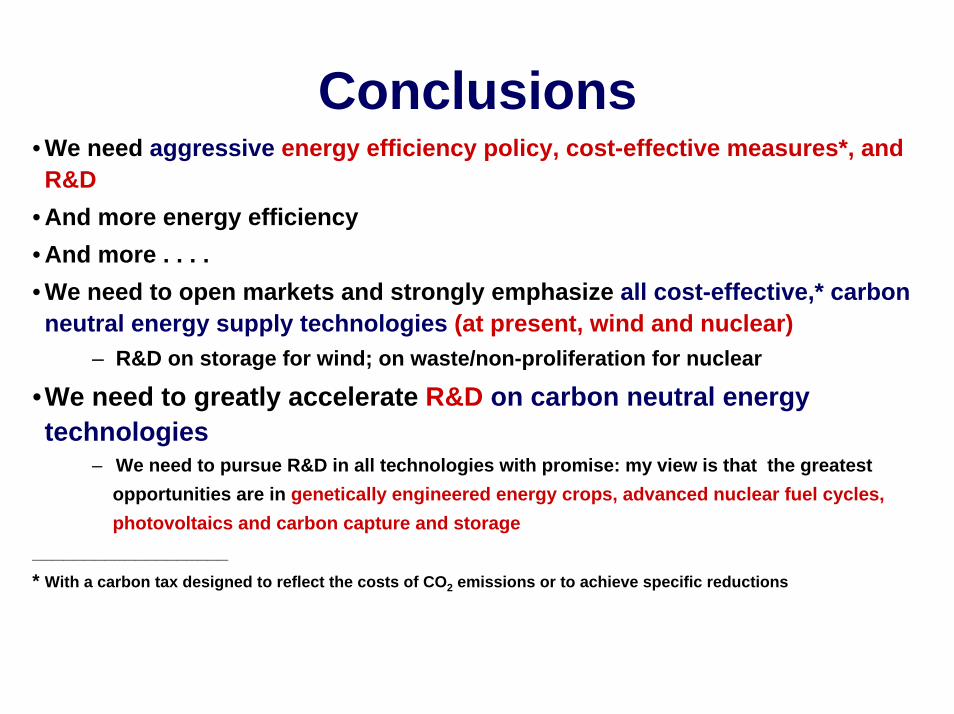
Conclusions• We need aggressive energy efficiency policy, cost-effective measures*, and R&D
• And more energy efficiency• And more . . . . • We need to open markets and strongly emphasize all cost-effective,* carbon neutral energy supply technologies (at present, wind and nuclear)
– R&D on storage for wind; on waste/non-proliferation for nuclear
•We need to greatly accelerate R&D on carbon neutral energy technologies
– We need to pursue R&D in all technologies with promise: my view is that the greatestopportunities are in genetically engineered energy crops, advanced nuclear fuel cycles,photovoltaics and carbon capture and storage
___________________* With a carbon tax designed to reflect the costs of CO2 emissions or to achieve specific reductions
Acknowledgements for Viewgraphs
Steve Chu, Director, Lawrence Berkeley National LabPhil Fairey, Florida Solar Energy CenterJohn Holdren, Professor, Harvard UniversityArt Rosenfeld, California Energy CommissionerRob Socolow, Professor, Princeton University

The EndWell, almost

Supplement:
The California Story
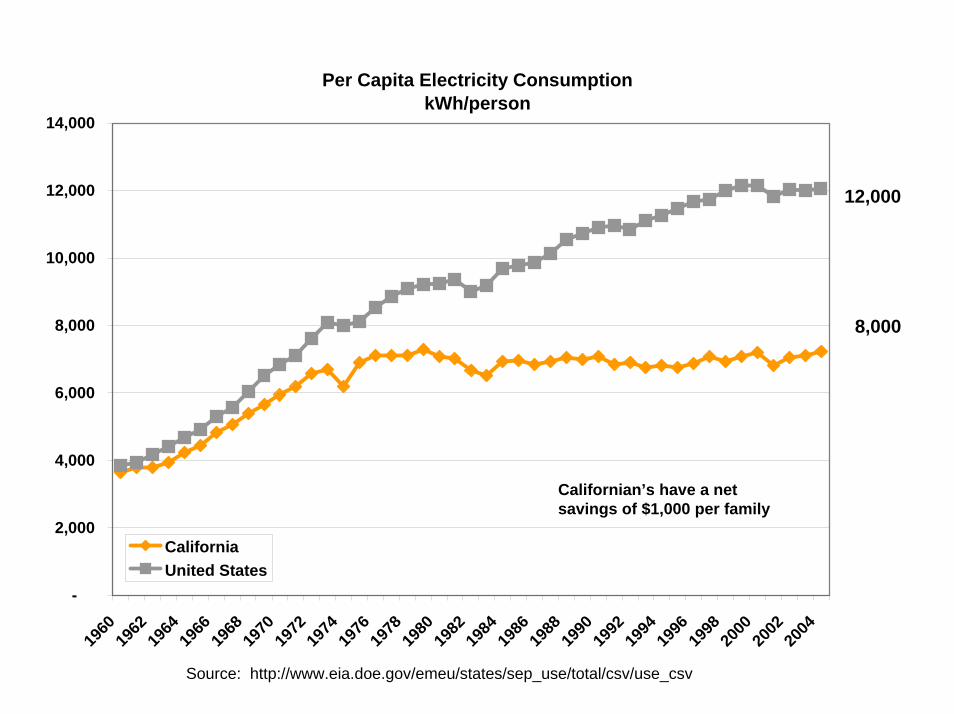
Per Capita Electricity ConsumptionkWh/person
-
2,000
4,000
6,000
8,000
10,000
12,000
14,000
1960
1962
1964
1966
1968
1970
1972
1974
1976
1978
1980
1982
1984
1986
1988
1990
1992
1994
1996
1998
2000
2002
2004
CaliforniaUnited States
12,000
8,000
Californian’s have a net savings of $1,000 per family
Source: http://www.eia.doe.gov/emeu/states/sep_use/total/csv/use_csv

Annual Energy Savings from Efficiency Programs and Standards
0
5,000
10,000
15,000
20,000
25,000
30,000
35,000
40,000
45,00019
75
1976
1977
1978
1979
1980
1981
1982
1983
1984
1985
1986
1987
1988
1989
1990
1991
1992
1993
1994
1995
1996
1997
1998
1999
2000
2001
2002
2003
GW
h/ye
ar
Appliance Standards
Building Standards
Utility Efficiency Programs at a cost of
~1% of electric bill
~15% of Annual Electricity Use in California in 2003