Embed Size (px)
Citation preview

The GRAMS Evolved Star Mass-Loss Models: CMDs,
CCDs, and Stellar Population Analysis for the LMC
Benjamin SargentCollaborators: S. Srinivasan, M. Meixner,
SAGE, and SAGE-Spec teams
Mass-Loss Return from Stars to Galaxies Workshop
May 20, 2010
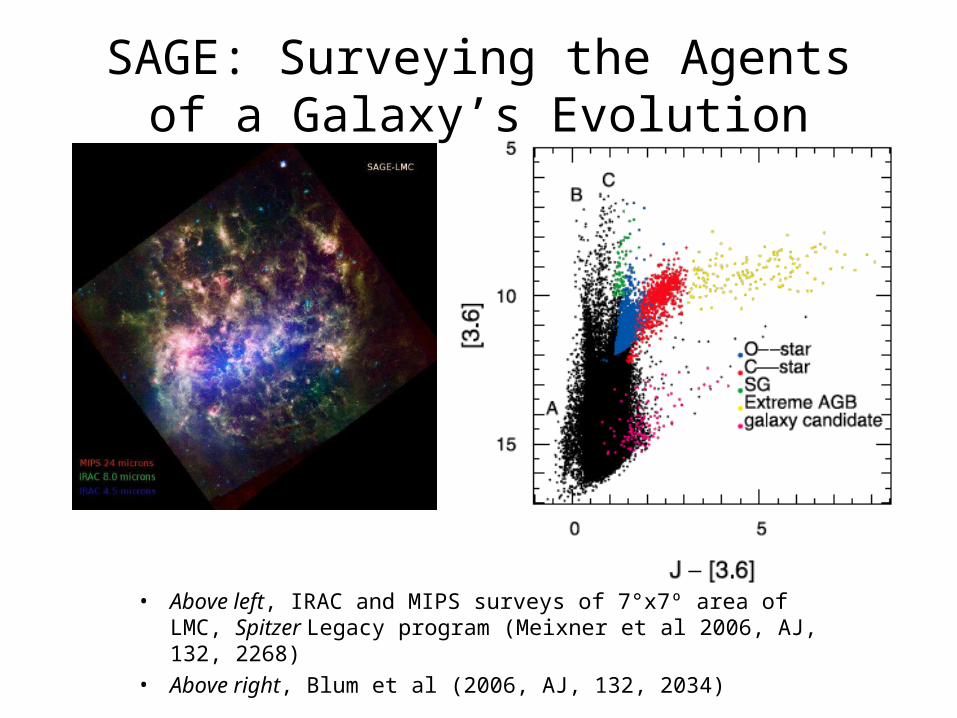
SAGE: Surveying the Agents of a Galaxy’s Evolution
• Above left, IRAC and MIPS surveys of 7°x7º area of LMC, Spitzer Legacy program (Meixner et al 2006, AJ, 132, 2268)
• Above right, Blum et al (2006, AJ, 132, 2034)

Finding Dust Properties• SEDs: U, B, V, I from
MCPS (Zaritsky et al 1997); J, H, Ks from 2MASS (Skrutskie et al 2006), IRAC and MIPS-24 from SAGE
• Above, SED of oxygen-rich (O-rich) AGB star; 2Dust (Ueta & Meixner 2003) model of O-rich AGB (Sargent et al 2010)
• Below, SED of carbon-rich (C-rich) AGB star; 2Dust model from Srinivasan et al (2010, submitted to A&A)
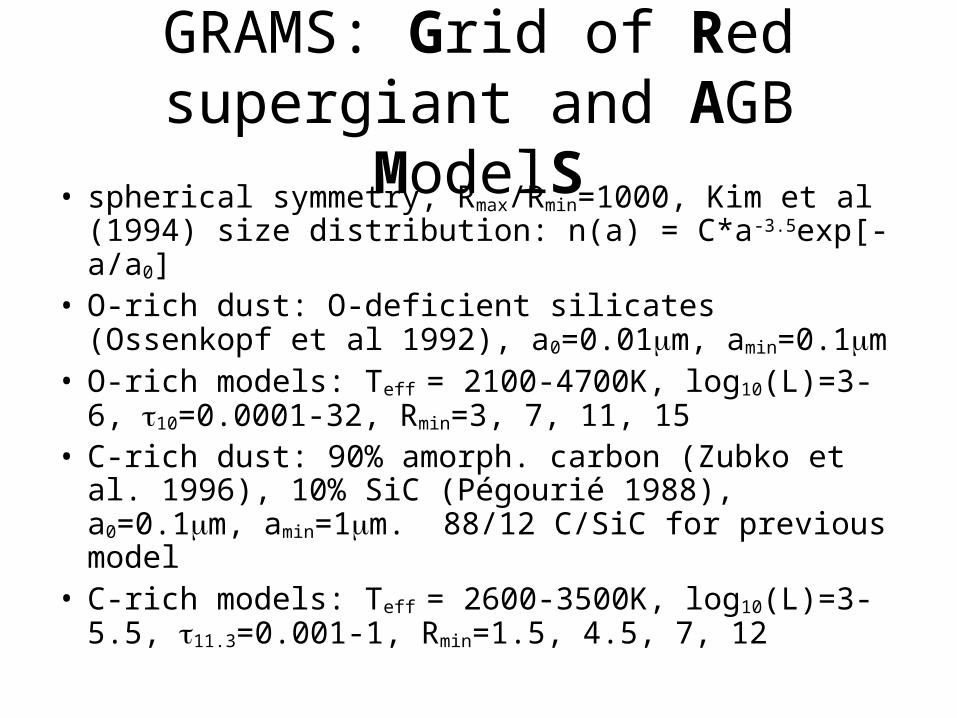
GRAMS: Grid of Red supergiant and AGB ModelS
• spherical symmetry, Rmax/Rmin=1000, Kim et al (1994) size distribution: n(a) = C*a-3.5exp[-a/a0]
• O-rich dust: O-deficient silicates (Ossenkopf et al 1992), a0=0.01m, amin=0.1m
• O-rich models: Teff = 2100-4700K, log10(L)=3-6, 10=0.0001-32, Rmin=3, 7, 11, 15
• C-rich dust: 90% amorph. carbon (Zubko et al. 1996), 10% SiC (Pégourié 1988), a0=0.1m, amin=1m. 88/12 C/SiC for previous model
• C-rich models: Teff = 2600-3500K, log10(L)=3-5.5, 11.3=0.001-1, Rmin=1.5, 4.5, 7, 12
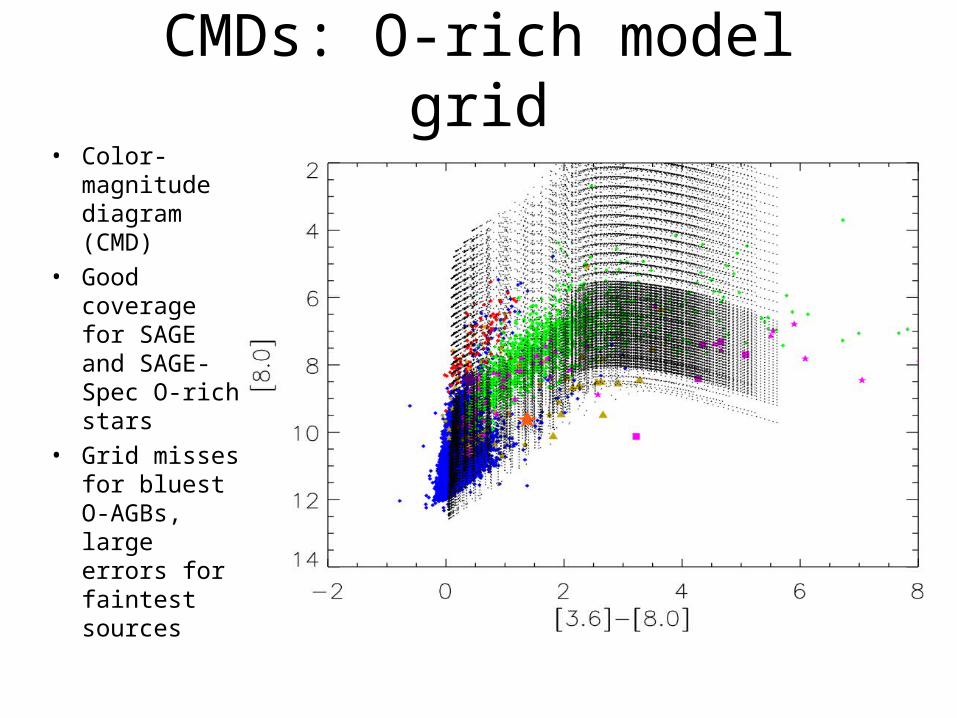
CMDs: O-rich model grid• Color-
magnitude diagram (CMD)
• Good coverage for SAGE and SAGE-Spec O-rich stars
• Grid misses for bluest O-AGBs, large errors for faintest sources
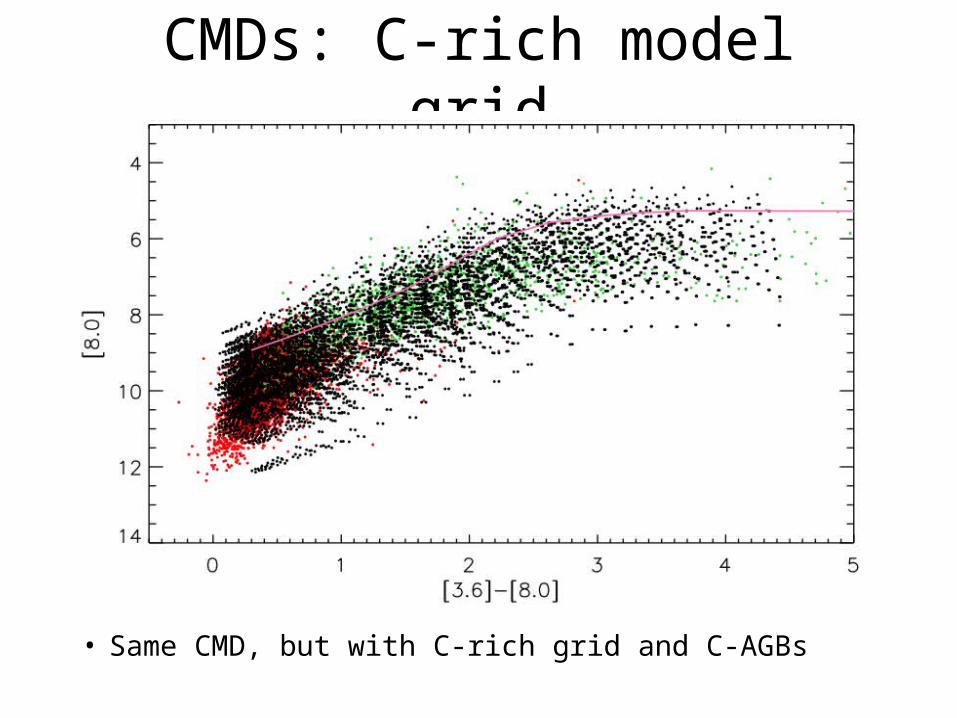
CMDs: C-rich model grid
• Same CMD, but with C-rich grid and C-AGBs
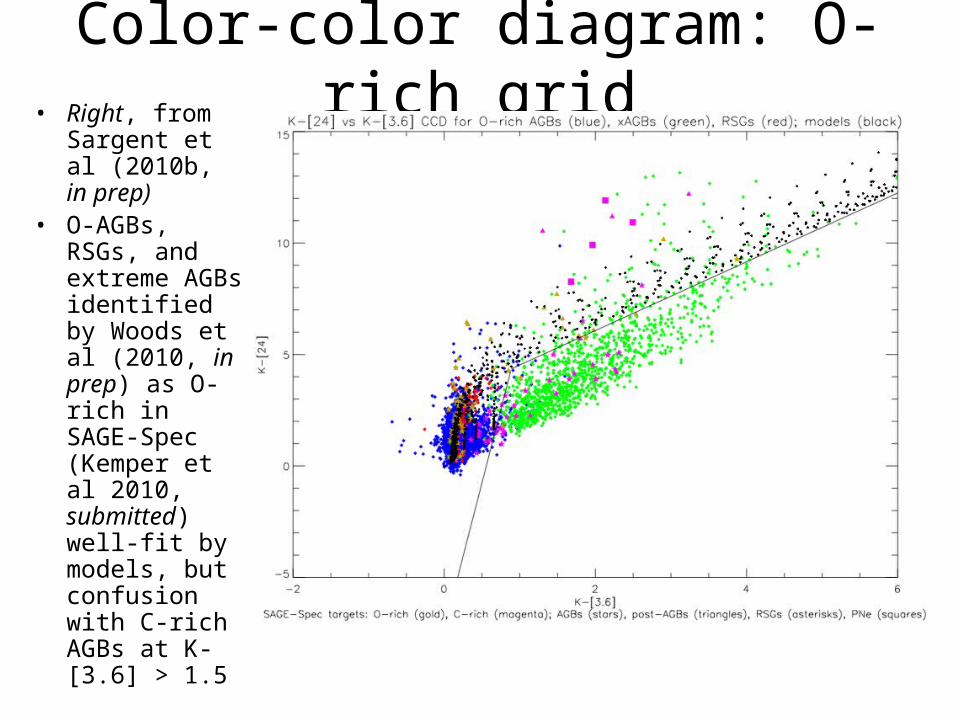
Color-color diagram: O-rich grid• Right, from
Sargent et al (2010b, in prep)
• O-AGBs, RSGs, and extreme AGBs identified by Woods et al (2010, in prep) as O-rich in SAGE-Spec (Kemper et al 2010, submitted) well-fit by models, but confusion with C-rich AGBs at K-[3.6] > 1.5

Color-color diagram: C-rich grid
• Above, from Srinivasan et al (2010, in prep)• Better coverage of extreme AGBs than O-rich
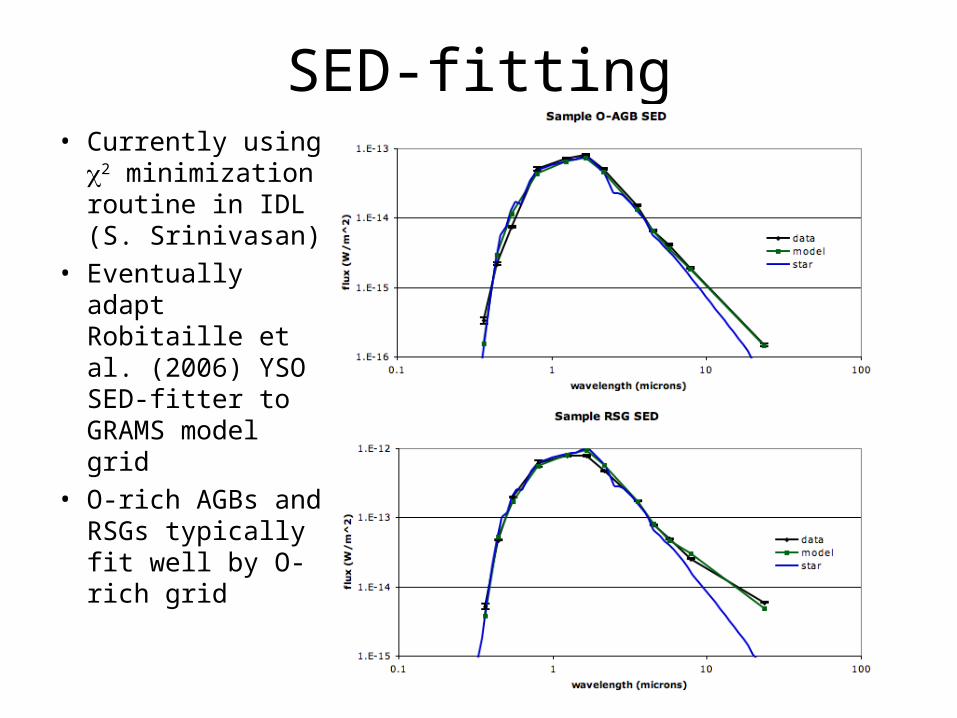
SED-fitting• Currently using
2 minimization routine in IDL (S. Srinivasan)
• Eventually adapt Robitaille et al. (2006) YSO SED-fitter to GRAMS model grid
• O-rich AGBs and RSGs typically fit well by O-rich grid
SED-fitting & Dust Chemistry
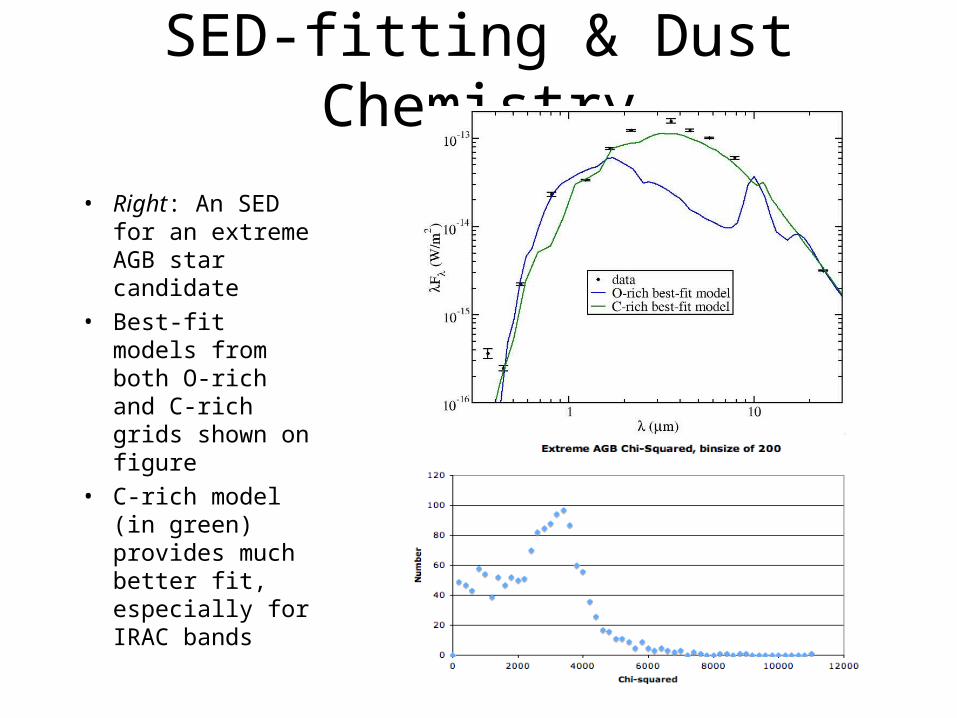
• Right: An SED for an extreme AGB star candidate
• Best-fit models from both O-rich and C-rich grids shown on figure
• C-rich model (in green) provides much better fit, especially for IRAC bands

Stellar Masses and Ages
• Right: Marigo et al. (2008) isochrones for Z=0.008 (LMC)
• O-rich AGBs and RSGs (Teff, L) from SED-fitting overplotted
• Points under 104 LSun & Teff < 103.5 K due to variability (A. Lançon, priv. communication)?
O-rich Grid & Stellar Masses
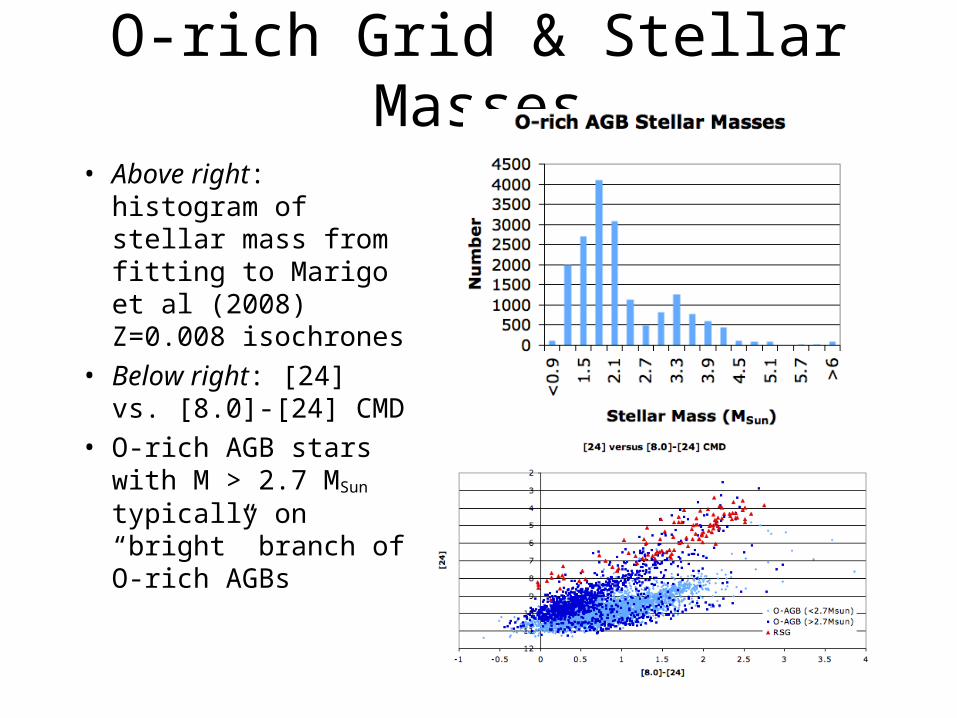
• Above right: histogram of stellar mass from fitting to Marigo et al (2008) Z=0.008 isochrones
• Below right: [24] vs. [8.0]-[24] CMD
• O-rich AGB stars with M > 2.7 MSun typically on “bright” branch of O-rich AGBs
Stellar Populations applications?
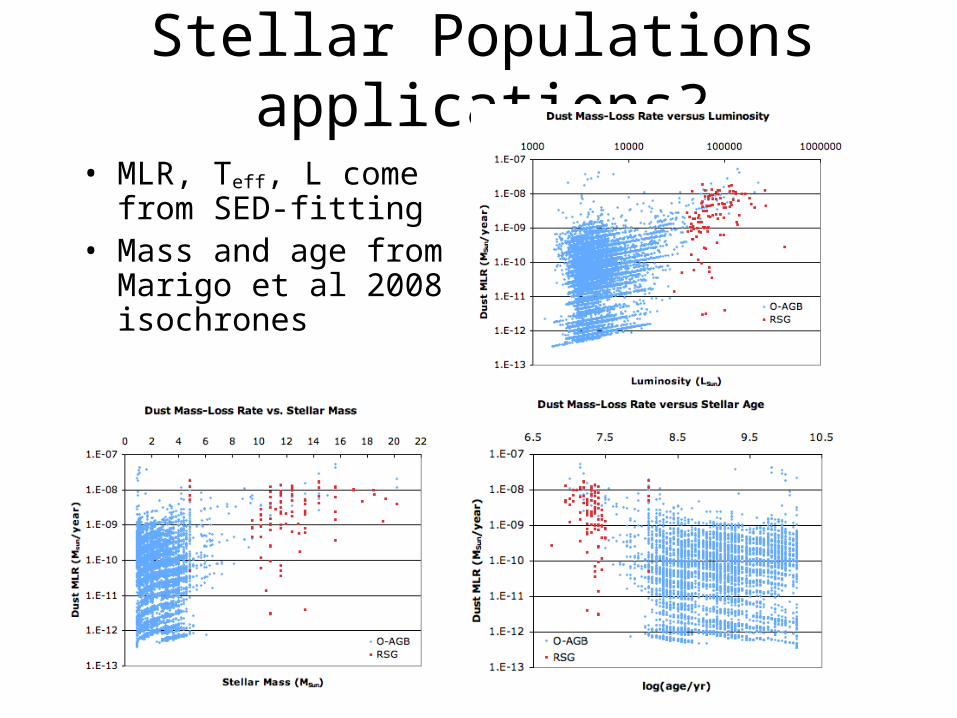
• MLR, Teff, L come from SED-fitting
• Mass and age from Marigo et al 2008 isochrones
O-, C-, & extreme AGB Mass-Loss
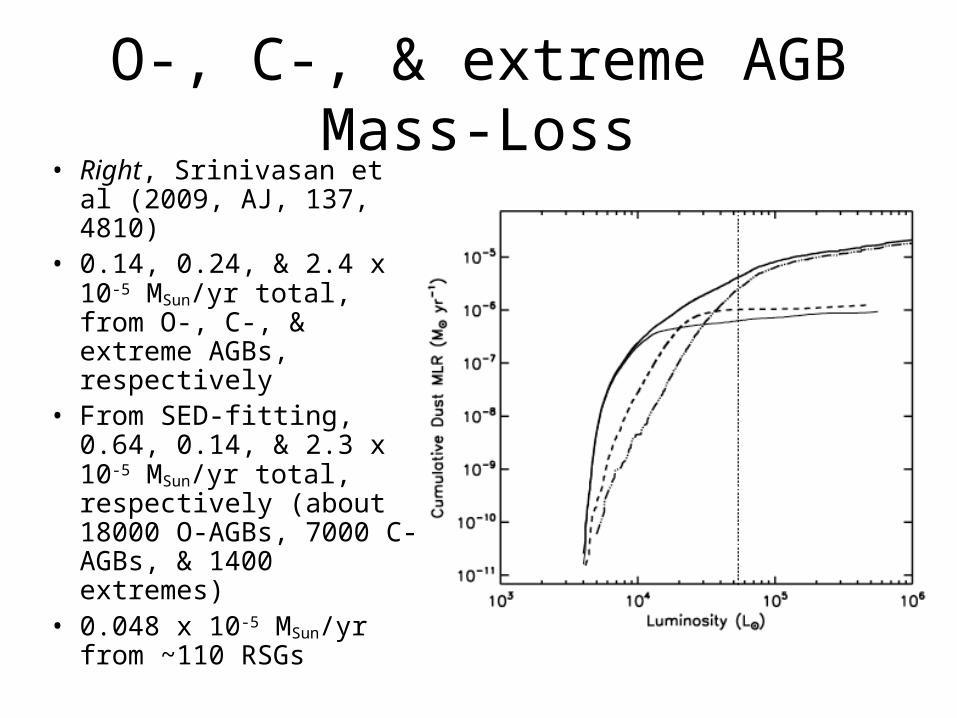
• Right, Srinivasan et al (2009, AJ, 137, 4810)
• 0.14, 0.24, & 2.4 x 10⁻⁵ MSun/yr total, from O-, C-, & extreme AGBs, respectively
• From SED-fitting, 0.64, 0.14, & 2.3 x 10⁻⁵ MSun/yr total, respectively (about 18000 O-AGBs, 7000 C-AGBs, & 1400 extremes)
• 0.048 x 10⁻⁵ MSun/yr from ~110 RSGs
Conclusions• Spitzer CMDs and CCDs better separate O- and C-rich
evolved stars than previous surveys allowed, but SED-fitting is quite powerful in this regard.
• Applications to stellar populations studies.• Extreme AGBs produce most dust, but how many C-rich
versus O-rich? Probably most have carbon dust. But, per star, RSGs really pull their weight in returning mass …
• AGB/RSG contribution to LMC mass budget comparable to SNe contribution? Masaaki Otsuka will discuss SNe contribution tomorrow morning.
• Stay tuned for further SAGE work on SMC (Karl Gordon, Martha Boyer, et al) and LMC (Sundar Srinivasan, myself, et al)


![On the zeros of Meixner and Meixner-Pollaczek polynomials · Meixner polynomials were studied in 2015 [Driver, AJ, submitted 2015] Alta Jooste On the zeros of Meixner and Meixner-Pollaczek](https://img.dokumen.tips/doc/110x75/5e236ddbd1a6be65055364b8/on-the-zeros-of-meixner-and-meixner-pollaczek-polynomials-meixner-polynomials-were.jpg)