Embed Size (px)
Citation preview

Entropy 2015, 17, 2781-2811; doi:10.3390/e17052781
entropy ISSN 1099-4300
www.mdpi.com/journal/entropy
Article
The Grading Entropy-based Criteria for Structural Stability of Granular Materials and Filters
Janos Lőrincz 1, Emöke Imre 2,*, Stephen Fityus 3, Phong Q. Trang 4, Tibor Tarnai 4,
István Talata 2 and Vijay P. Singh 5,6
1 Tengizchevroil, Farnborough, Hampshire GU14 7BF, UK; E-Mail: [email protected] 2 Ybl Miklós Faculty of Architecture and Civil Engineering, Szent István University, Budapest 1146,
Hungary; E-Mail: [email protected] 3 School of Engineering, University of Newcastle, Callaghan 2308, Australia;
E-Mail: [email protected] 4 Budapest University of Technology and Economics, Budapest 1111, Hungary;
E-Mails: [email protected] (P.Q.T.); [email protected] (T.T.) 5 Department of Biological and Agricultural Engineering, Texas A&M University, 321 Scoates Hall,
MS 2117, College Station, TX 77843, USA; E-Mail: [email protected] 6 Zachry Department of Civil Engineering, Texas A&M University, 321 Scoates Hall, MS 2117,
College Station, TX 77843, USA
* Author to whom correspondence should be addressed; E-Mail: [email protected] or
[email protected]; Tel.: +36-14631447; Fax: +36-14633006.
Academic Editor: Kevin H. Knuth
Received: 23 October 2014 / Accepted: 27 April 2015 / Published: 4 May 2015
Abstract: This paper deals with three grading entropy-based rules that describe different
soil structure stability phenomena: an internal stability rule, a filtering rule and a
segregation rule. These rules are elaborated on the basis of a large amount of laboratory
testing and from existing knowledge in the field. Use is made of the theory of grading
entropy to derive parameters which incorporate all of the information of the grading curve
into a pair of entropy-based parameters that allow soils with common behaviours to be
grouped into domains on an entropy diagram. Applications of the derived entropy-based
rules are presented by examining the reason of a dam failure, by testing against the existing
filter rules from the literature, and by giving some examples for the design of
non-segregating grading curves (discrete particle size distributions by dry weight). A
physical basis for the internal stability rule is established, wherein the higher values of base
OPEN ACCESS

Entropy 2015, 17 2782
entropy required for granular stability are shown to reflect the closeness between the mean
and maximum grain diameters, which explains how there are sufficient coarser grains to
achieve a stable grain skeleton.
Keywords: grading entropy; erosion; suffosion; filtering
1. Introduction
Granular soils are used as engineering materials in a wide variety of applications from pavements to
structural fills to granular filters to dams. The engineering performance of these soils in their different
applications depends upon achieving a stable internal granular structure in their compacted condition
(see e.g., [1–10]). Internal instability may result in various types of particle migrations like erosion,
piping and suffosion in the case of flowing water (see e.g., [10–15]). However, internal stability is not
entirely ensured by the compaction process, with many well-compacted materials being prone to
particle instability, due to the inherent behaviors determined by their distribution of particle sizes [2].
Particle size distributions are characterized by sieve analyses, to produce a frequency distribution of
sizes, which is expressed as a cumulative frequency distribution known as a grading curve. The
grading curve contains a large amount of data, which makes is use in the evaluation of soil properties
awkward [1]. To simplify the evaluation of soil behavior using grading data, rules based on a few
nominated particle diameters to represent the entire grading curve are used. There are many
suggestions in the literature to identify succesptibility of soils to internal instabilities, generally using
geometrical criteria based on some limited number of grading curve data, usually specified in terms of
particular diameters Dx (or dx), which represent the particle diameter for which x% of grains (by
weight) are smaller.
Grain structure instability through internal erosion involves the loss of particles under seepage flow,
with or without the matrix of coarse soil particles becoming unstable. Instability of the coarser
particles leads to the growth of large internal voids, known as piping [6,9,11,13,14]. If the matrix of
coarse soil particles is stable under seepage flow then suffosion (detachment and transportation of
small particles by flow of water through the largest voids of the soil) may occur if the grading is
adverse and the hydraulic gradient exceeds a certain critical value [8–10,15]. According to Khomenko [10],
the term “suffosion” is Russian in origin and was introduced to describe the process of removal and
transport of small soil particles through pores. The succeptibility to suffosion can be assessed by the
graphical approach of Lubockov [15] where a grain size distribution is compared with empirical upper
and lower bound thresholds. However, this approach is not valid for gap-graded grain size distributions.
Piping, suffosion and underground erosion give rise to a wide range of surface expressions
including caves, subsidence hollows, collapse sinks, and swallow holes, landslides and sand boils [10].
These may be of engineering significance when they occur due to problems with hydraulic
infrastructure or with natural groundwater flow in urban areas. They may be encountered in case of
heavy rains at slopes with removed biological cover, due to the unstable underlying material, and have
serious consequences in relation to dams and flood mitigation structures in rivers.

Entropy 2015, 17 2783
In the construction of earth dams or earth cores in rockfill dams, different granular earth materials
are often compacted in adjacent layers. In adverse situations, the grains of one layer can be washed
through the pores of another, causing them to become eroded. It is desirable, however, that adjacent
materials should act as filters for each other, including the base materials upon which the construction
takes place [3–5]. To assess the potential for erosion from adjacent soil layers, there are several well-known
filtering rules but these are based on only one or two pairs of grading curve points [1,16–19]. These are
acceptable for relatively uniform granular filters and granular base (protected) soils. The criterion
D15/d85 < 9 ([4]; where D and d denote the filter and base soils, respectively) proves to be satisfactory
in these cases. However, doubt may arise in their application to broadly-graded filters and also to
broadly-graded or silt-clay base materials. However, in many cases, the use of such filters is necessary,
and silty-clay base soils are unavoidable.
Another issue arising in the engineering of granular soils is segregation. Particulate solids tend to
segregate due to the differences in the size, shape and other characteristics of the particles of which
they are composed. The process of segregation occurs during processes where the particles are able to
flow freely, such as tipping and spilling. The likelihood of backward erosion is greater for segregated
soil than for non-segregated soil in embankments. Segregation is also a problem of broadly graded
filters, which may lead to excessive erosion. Segregation while placing samples into laboratory test
equipment is also a problem. Compacted earth dam and core material should resist segregation;
however, broadly graded silt-sand-gravel soils are subject to segregation during placement in dams or
levees. According to the existing rules, the amount of segregation can be decreased if the uniformity
coefficient is smaller than about 20 [20]. Sherard [4] considers that the tendency to segregate can be
linked to d90.
In this paper, data from a series of simple and effective soil testing programs (including information
from the testing programs of Lőrincz [1] and Sherard [4]), performed on artificial mixtures of natural
sand grains, are elaborated. The results of these are used in an efficient way (considering some results
in the literature including the self-filtering theory of Kézdi [8,9]) to explore the various soil structure
instability phenomena, and to give a set of rules for granular soils (an internal stability rule, a filtering
rule and a segregation rule) based on the theory of grading entropy [1]. Also, a criterion is given to
decide if the segregation of a given mixture is negligible or excessive.
The application of these rules is demonstrated through the example of the failure in 1993 of the
Gouhou dam with internally unstable dam material, by testing the reliability of the existing filter rules in
the literature, and by presenting a method to construct non-segregating, artificial mixtures of natural
soil grains.
The paper concludes by discussing how the rules derived in this paper differ from most existing
rules in that the grading entropy parameters (see e.g., [1–3,7]) are formulated to utilize the whole
grading curve data instead of some limited number of grading curve points and how they can be
implemented numerically, without any constraint on the shape of the grading curve.

Entropy 2015, 17 2784
2. Grading Entropy
2.1. Statistical Entropy and Its Application to the Grading Curve
Consider M elements in m statistical cells (Mi is the number of the elements in the i-th cell). The
statistical entropy Ss is ([16]):
sS Ms= (1)
where s is the specific entropy or the entropy of an element given by:
1
logm
i b ii=
s α α= − (2)
In Equation (2), b is the base of the logarithm, and αi is the relative frequency of the i-th cell, given by:
ii
M
Mα = (3)
2.2. Statistical Cells (Fractions and Elementary Cells)
Two statistical cell systems are used in the definition of the grading entropy [1]. The fractions are
defined by successive multiplication with a multiplication factor of 2, starting from an arbitrary d0
(primary statistical cells) as follows (j = 1, 2, …; see Table 1): j j-1
0 02 2d d d≥ > (4)
where fractions are numbered by j (serial number), d0 is the the elementary cell width. The number of
the fractions N is defined in terms of the difference of the absolute serial numbers of finest and
coarsest fractions:
max min 1N j j= − + (5)
Table 1. Definitions of fractions and elementary cells, where d0 is the elementary cell
width, based on the smallest particles likely to occur in nature.
j 1 ... 23 24 Limits d0 to 2 d0 ... 222 d0 to 223 d0 223 d0 to 224 d0 S0j [-] 1 ... 23 24
A uniform (“elementary”) cell system is defined in which the cell width is d0. It is assumed, that the
distribution in these is uniform and it is the same within a fraction. The number of the elementary cells
Ci in the fraction i is equal to:
1
0
01
0 222 −
−
=−
= iii
i d
ddC (6)
The relative frequency of any elementary cell in fraction i is equal to:
ii
i
x
Cα = (7)

Entropy 2015, 17 2785
where xi is the relative frequency of fraction i.
Now consider the simple situation of two statistical cells, with relative frequencies of α1 and α2 = 1−α1.
If the base of the logarithm is set to 2 in Equation (2) then the maximal specific entropy of this system
is equal to 1 at the point where the relative frequencies are equal to α1 = α2 = 0.5. This function, being
similar to a half-ellipse, (see Figure 1a), will determine all the important lines of the entropy diagrams.
The specific entropy is written as follows:
1
1ln
ln 2
m
i ii
s α α=
= − (8)
0.0 0.2 0.4 0.6 0.8 1.0Relative frequency of cell 1 [-]
0.0
0.4
0.8
Stat
istic
al E
ntro
py [
-]
ellipse (a=1 b=0.5)
circle(r=0.5)
entropy function
1 2 3 4 5 6 7
12 23 34 45 56 67
123 234 345 456 567
1234567
1234 2345 3456 4567
12345 23456 34567
123456 234567
(a) (b)
Figure 1. (a) The entropy for two statistical cells and, its numerical approximation with a
half-ellipse. (b) The lattice of the continuous sub- simplexes of the simplex (the integers
are the serial number of fractions).
2.3. Simplex Representation
The space of the possible grading curves can be defined as the set of the discrete probability
distribution functions, where there are N fractions and the minimum grain diameter is dmin.
There is a natural one-to-one relationship between the relative frequencies of the fractions of the
possible grading curves with N fractions and the barycentre coordinates of the points of an N-1
dimensional closed simplex, since the following equation is met for the relative frequency of the
fractions xi (i = 1, …, N):
1,0,11
minmax
min
≥≥=−+=
=
Nxx ii
Njj
ji
(9)
which is the defining equation of the N-1 dimensional closed simplex. The inner points (where the
relative frequency of every fraction is greater than zero; denoted by Δ) constitute the open simplex.
This curve appears in the image of every edge of the simplex.
The structure of the continuous sub-simplexes of a large simplex is shown in Figure 1b. This structure
appears in the image of the maximum lines of the continuous sub-simplexes in the entropy diagram.

Entropy 2015, 17 2786
2.4. The Grading Entropy and the Entropy Coordinates
The grading entropy S is the statistical entropy of the grading curve in terms of the elementary
statistical cells. It is derived by inserting the relative frequency of the secondary cell αi from Equation (7)
into Equation (8) to give:
0
1ln , 0
ln 2i
i ii i
x i i
x xS C x
C C≠
= − ≥ (10)
The grading entropy S is split into two parts: base entropy So and the entropy increment ΔS:
0S S S= +Δ (11)
The base entropy S0 is as follows:
0 00
,i
i ix
S x S≠
= (12)
where S0i is the grading entropy of the k-th fraction. The values of S0i, shown in the bottom row of
Table 1, are defined as:
ln
ln 2k
ok
CS = (13)
and, therefore:
1okS k= − (14)
It follows that the entropies of the fractions are integers and the base entropy S0 is the mean value of
the entropy of the fractions, weighted by the relative frequencies of the fractions xi (i = 1, …, N).
The entropy increment ΔS is given by:
0
1ln .
ln 2i
i ix
S x x≠
Δ = − (15)
The entropy increment ΔS is the statistical entropy of the grading curve in terms of the primary cells
(fractions). It is the concave and symmetric function of its variables. The maximum of the entropy
increment ΔS has a one-to-one relationship with the number of fractions in the grading curve N.
The entropy coordinates have normalized forms as well, being the relative base entropy A and as the
normalised entropy increment B. The normalised base entropy, the so-called relative base entropy A, is
defined as:
min
max min
o o
o o
S SA=
S S
−−
(16)
and, therefore:
min1 1
( ) ( 1)
1 1
N N
i o o ii i
x S S x iA =
N N= =
− −=
− −
(17)

Entropy 2015, 17 2787
where S0min and S0max are the entropies of the smallest and largest fractions in the mixture, respectively.
The (normalised) base entropy is a linear function which defines parallel hyperplanes in the space
generated by the simplex. (Figure 1c,d).
The normalised entropy increment is:
N
SB
ln
Δ= (18)
With regard to the fraction definition, the concept is basically insensitive to the selection of the
minimum grain diameter d0. For granular soils, the smallest particles are caused by crushing which can
produce particles which are limited to the size of some microns. For plastic (clay) soils, the size can be
much smaller. The size of the SiO4 tetrahedron (2-22 mm) is adopted here. If the minimum grain
diameter d0 is defined differently, the normalized entropy coordinates are unchanged. The range of A
and B is independent of N (B varies between 0 and 1/ln2; A varies between 0 and 1). By contrast, the
range of the entropy coordinates is dependent on N (ΔS varies between 0 and lnN/ln2; S0 varies
between S0min and S0max).
2.5. Entropy Diagrams
Perhaps the greatest advantage afforded by the grading entropy concept is that the entire
information of particle size distributions (grading curves) can be described using the entropy
coordinates: that is, by a single point on an entropy diagram. Soils with different grain size
distributions can be represented and compared with each-other in entropy diagrams (maps) where the
(normalised) base entropy is the abscissa and the (normalised) entropy increment is the ordinate.
Four kinds of maps can be defined for a specified simplex Δ, determined by the number of the
fractions N and the serial number of the smallest fraction imin. The non-normalized entropy map with
coordinates [So, ΔS], the normalized entropy map with coordinates [A, B] and the two partly
normalized entropy maps with a mixture of normalised and non-normalised coordinates; i.e., [So, B] or
[A, ΔS].
Since the normalized and the non-normalized coordinates differ by a constant factor, it is enough to
investigate one map only. These maps between the N-1 dimensional simplex for fixed N, and the two
dimensional space of the entropy coordinates, are continuous on the open simplex and can
continuously be extended to the closed simplex. Therefore, the images are compact, like the simplex. It
follows then, that the image has a maximum and a minimum value for every possible value of A or So.
These ideas are illustrated in the diagrams of Figures 2 and 3.

Entropy 2015, 17 2788
31
2
A=0.5
0.0 0.2 0.4 0.6 0.8 1.0Relative base entropy, A [-]
0.0
0.4
0.8
1.2
Entro
py in
crem
ent,
B [-
]
1' 2' 3'
(conditional) optimumat A=0.5 B=1.4 B=1
(a) The simplex and its A = 0.5 hyper-plane section. (b) The entropy diagram with 3 points on
coordinate line A = 0.5 (B = 1, 1.4 and Bmax = 1.44).
0.101.0010.00100.00d [mm]
Perc
enta
ge p
assi
ng S
[%
]
inverse image related to A=0.5, Bmax=1.44A=0.5, B=1.0A=0.5, B= 1.4
100
0
particle size d [mm]
(c) The inverse image in the simplex. (d) The space of the possible grading curves.
Figure 2. The normalized entropy map for N = 3. (a) The simplex. (b) The entropy diagram
with three points on coordinate line A = 0.5 (B = 1, 1.4 and Bmax = 1.44). (c) N = 3, the inverse
image in the simplex. (d) The inverse image in the space of the possible grading curves.
0.0 0.2 0.4 0.6 0.8 1.0Relative base entropy, A [-]
0.0
0.4
0.8
1.2
Entro
py in
crem
ent,
B [-
]
1.1
1.2
(a) (b)
Figure 3. Some properties of the entropy map. The inverse image of a constant B plane
section of the entropy diagram. (a) Normalised entropy diagram. (b) The inverse image in
the simplex.
The maximum normalized entropy increment B, for a given normalized base entropy A, assigns a
single “average” or optimal grading curve with finite fractal distribution for each given N. This maps
to a point of the maximum B line and it can be computed by conditional optimization, fixing the value
of A for a given N and finding the mixture with maximum B value (Figure 4). The solution of the
conditional optimization problem for a fixed N and A is the grading curve given by:
Entropy 2015, 17 2789
,1
11
1
11 NN
j
j a
a
ax
−−==
=
−
(19)
and:
11
−= jj axx (20)
where parameter a is the root of the following equation :
.0)]1(1[1
1 =−−−==
− NAjayN
j
j (21)
0.010.101.0010.00d [mm]
0.0Perc
enta
ge p
assi
ng S
[%
]
0.2
A=0.95
A=0.05
1/3
0.52/3
0.8
100
particle size d [mm]0.010.101.0010.00
d [mm]
Perc
eent
age
pass
ing
S [%
]
N=7 45 3 N=26
particle size d [mm]
(a) (b)
(c) (d)
Figure 4. Optimal grading curves. (a) N = 7, A varies. (b) A = 2/3, N varies. (c) The constant
A sections of the simplex and the optimal line for a 2D simplex and (d) for a 3D simplex.
Following from the Descartes rule of signs, polynomial y has one (and only one) positive root for a.
As A varies within its range [0, 1], the a varies continuously between 0 and ∞ in a one-to-one,
monotonic way. The unique grading curve is called an optimal grading curve, and it has finite fractal
distribution with fractal dimension n given by: (3 )2 na −= (22)
On a semi-logarithmic plot, the shape of the optimal grading curves is convex if A < 0.5 and it is
concave if A > 0.5. Having no inflexion points (see Figure 2d), out of the possible grading curves, the
optimal grading curve with a specified A has the shortest curve length.

Entropy 2015, 17 2790
The normalisation with respect to a coordinate results in the range being fixed in that direction. The
image of the normalized entropy map contains a single unit, as the images of all continuous simplices
nearly coincide. The image of the non- normalized entropy map contains several units, one unit for
each continuous sub-simplex, reflecting the structure of the continuous sub-simplexes of a large
simplex. This is illustrated in Figure 5 for soils with up to seven fractions.
0.0 2.0 4.0 6.0 8.0Base entropy, So [-]
0.0
0.4
0.8
1.2
1.6
2.0
2.4
2.8
Entro
py in
crem
ent,
S [-
] N=7
N=5
N=3
N=4
N=6maximum linesminimum lines
Δ
0.0 0.2 0.4 0.6 0.8 1.0Relative base entropy, A [-]
0.0
0.4
0.8
1.2
Entro
py in
crem
ent,
B [-
]
maximum line
minimum lines forN= 3, 4, 5, 6, 7
(a) (b)
Figure 5. (a) The non-normalized diagram, with the image of the edges (i.e., minimum
lines). (b) The simplified normalised entropy diagram with the image of the edges 1 to N
(i.e., minimum lines).
2.6. The Meaning of the Entropy Coordinates
The base entropy S0 is the weighted mean of the fraction entropies. It is monotonically and uniquely
related to the mean grain size, since it is basically equal to the mean fraction serial number, imean:
max
min
i
mean ii i
i = x i= (23)
0 1meanS i= − (24)
The relative base entropy A, is monotonically and uniquely related to the normalized mean grain
size (there is no such a parameter in practice, although conceptually it is important), since it is
basically equal to the mean fraction serial number (or normalized mean fraction number) kmean:
min
max min
meanmean
i ik
i i
−=−
(25)
meanA k= (26)
Its value expresses the position of the mean diameter between the smallest fraction and the largest
fraction. It varies between zero and one and its value is equal to 0.5 if the relative frequencies of all the
fractions xj are equal.
The entropy increment ΔS is a measure of the disorder of the grain system, which originates from
the mixing of the fractions. However, there is another meaning for it. According to Figure 5, the
entropy increment ΔS, as a function over the simplex, has a kind of contractive property. The major
part of the inner simplex maps close to the maximum entropy increment value. Taking into account the
Entropy 2015, 17 2791
contractive property of the entropy map, the value of ΔS is typically close to lnN/ln2 reflecting the
number of fractions N.
The lattice of the continuous sub-simplexes of the simplex (the one unit integers are the serial
number of fractions, the k-unit integers denote k-component mixtures: k ≤ N) appears in the entropy
diagrams, in the image of the optimal lines of the continuous sub- simplexes. Moreover, since the map
is contractive, the image of the grading curves is situated at a point which depends on the base entropy
S0 or imean which is the abstract mean grain diameter (or mean fraction number).
3. Elaboration of the Grading Entropy-based Rules
3.1. Approach
The grading entropy concept [1] has been used to establish three “rules”: a grain structure stability
criterion, a filter criterion and a segregation rule. Two parameters were carefully formulated from the
entropy coordinates for each rule separately, considering the basic possible ways in which the
statistical entropy of the soil grading might be affected by the different physical phenomena involved.
The chosen entropy parameters for each mixture were plotted on entropy diagrams, differentiating
points which exhibited different physical behavior so that domains of particular behavior in the figure
could be used to define the rules (criteria).
For each rule, simple soil testing programs were designed and executed by using artificial mixtures
of natural sand grains [1]. In addition, other information (e.g., existing data such as [4]) was collected
from the available literature. For the grain structure stability criterion, simple flow or suffosion tests
were carried out. Segregation susceptibility was investiged by some segregation tests [1]. Filtering
rules were derived from the data of filtration tests made by Lőrincz [1] and Sherard [4], and by
reinterpreting some of the results of the suffosion tests, as is described in the next section.
3.2. General Knowledge Implied in the Rules
Two principles from the general knowledge of particle stability were used in the formulation of this
work. The first, for the elaboration of the particle migration criterion, was the principle that two empty
size fractions in a graded soil material may cause significant particle movement, referred to as
self-suffosion (and hence, the suffosion test were mostly made on gap-graded soils to observe this
effect). The second, for the elaboration of the filter criterion, was the principle that there can be no
more than two empty particle size fractions between the filter and the base soil, before the base soil
cannot be retained by the filter.
Although one principle applies to self suffosion in a single soil and the other to suffosion of
particles from a finer (base) soil to a coarser (filter) soil, they are similar in that they both identify the
onset of soil structure instability when gaps in the soil grading become excessive. The two principles
are further related in the self-filtering theory of Kézdi [9], which is extensively used in internal
stability problems (see e.g., [8]). This theory states that if the grading curve for a particular soil can be
cut into two parts at any possible point, with the coarser part considered as the filter and the finer part
as the base soil, with the base soil part being filtered at each point, then there will be no suffosion
within the soil. Kezdi used the Terzaghi criterion [16] for this purpose. The following filter rule for

Entropy 2015, 17 2792
uniform (single fraction) filters and uniform (single fraction) granular base soils (i.e., the finer soil to
be protected) can be derived from the Terzaghi criterion for broadly-graded soils:
min
max
1 4D
d≤ ≤ (27)
Dmin and dmax denote the minimum fraction size of the filter and the maximum fraction size of the base
soil, respectively.
On the basis of these ideas, in this work it was assumed that if suffosion occurs in a suffosion test
on an artificial gap-graded soil, then if that same soil were divided into two parts at the grading gap,
the base soil part cannot be filtered in a filtering test by the filter soil part. In other words, the outcome
of a suffosion test on a gap-graded soil can also be considered as an outcome of a filter test on the
same soil divided to be a filter and a base soil.
Geometrical Explanation of Suffosion
In this section the mean of the ratio of the radius of the unit spheres and the radius of the maximum
small sphere passing the pores is determined and, it is found that this value is typically close to 4.
According to the fraction definition shown by Equation (4), this means two empty fractions between
the unit radius spheres and the wandering spheres.
Consider a loose and a dense packing of uniformly-sized, unit radius spheres (R), and the maximum
size of a smaller sphere rmax which can pass through the voids between them in each case. The loosest
regularly-packed state exists when the unit radius spheres are arranged in a primitive cubic lattice,
where spheres are stacked in layers to form a square pattern within each layer, and with spheres
perfectly aligned on above the other in successive layers. In this case, the largest spheres that can
permeate the space between them have a radius (rmax) of 2 1− = 0.4142 units (the smallest pore is on
the face of the cube), and the ratio is R/rmax = 1/0.414 = 2.41 (the largest pore diameter is
3 1− = 0.7320 units on the space diagonal, but whilst such a diameter sphere can occupy the space, it
is unable to move from it).
The densest state is the so-called hexagonal close packed state, when the unit radius spheres are
situated in a regular tetrahedral arrangement. (Hales [17] proved that no denser structure exists,
however, the random unit radius sphere packings may have similar density [18]). In this case, the
largest spheres that can permeate the space between them have a radius (rmax) of 2 / 3 1− = 0.1547
(the smallest pore is on the triangle) and the ratio is R/rmax = 1/0.1547= 6.45. (In the octahedron the
largest pore size is 12 − = 0.4142 situated on the square, in the tetrahedron the largest pore size is
3 / 2 1− , situated on the halving plane generated by an edge and the midpoint of the parallel edge).
Since the extreme values of R/rmax are 2.41 and 6.45, with an average value of R/rmax = 4.4, it is
reasonable that in a typical state, R/rmax might be approximately equal to 4. In a fraction size structure
based on a multiplication factor of two (the size of the next biggest fraction is twice that of the last) a
ratio of 4 is equivalent to two size fraction. Therefore, suffosion may occur typically where there are two
empty fractions and the precise limit of the safe and unsafe domains can be studied using gap-graded
grading curves.
Entropy 2015, 17 2793
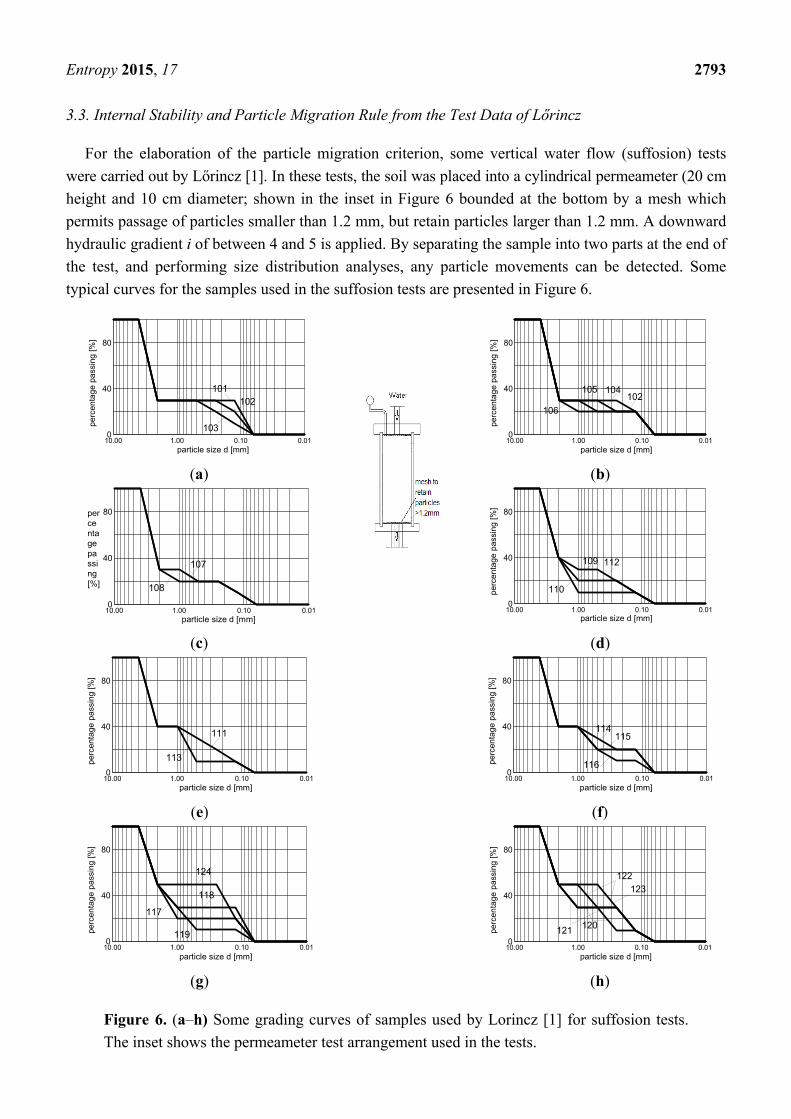
3.3. Internal Stability and Particle Migration Rule from the Test Data of Lőrincz
For the elaboration of the particle migration criterion, some vertical water flow (suffosion) tests
were carried out by Lőrincz [1]. In these tests, the soil was placed into a cylindrical permeameter (20 cm
height and 10 cm diameter; shown in the inset in Figure 6 bounded at the bottom by a mesh which
permits passage of particles smaller than 1.2 mm, but retain particles larger than 1.2 mm. A downward
hydraulic gradient i of between 4 and 5 is applied. By separating the sample into two parts at the end of
the test, and performing size distribution analyses, any particle movements can be detected. Some
typical curves for the samples used in the suffosion tests are presented in Figure 6.
0.010.101.0010.00d [mm]
0
40
80
S [%
]
101102
103
particle size d [mm]
perc
enta
ge p
assi
ng [%
]
0.010.101.0010.00d [mm]
0
40
80
S [%
]
102104105
106
particle size d [mm]
perc
enta
ge p
assi
ng [%
]
(a) (b)
0.010.101.0010.00d [mm]
0
40
80
S [%
]
107
108
particle size d [mm]
percentage passing [%]
0.010.101.0010.00
d [mm]0
40
80
S [%
]
109
110
112
particle size d [mm]
perc
enta
ge p
assi
ng [%
]
(c) (d)
0.010.101.0010.00d [mm]
0
40
80
S [%
]
113
111
particle size d [mm]
perc
enta
ge p
assi
ng [%
]
0.010.101.0010.00d [mm]
0
40
80
S [%
]
116
115114
particle size d [mm]
perc
enta
ge p
assi
ng [%
]
(e) (f)
0.010.101.0010.00d [mm]
0
40
80
S [%
] 124
119
118
117
particle size d [mm]
perc
enta
ge p
assi
ng [%
]
0.010.101.0010.00d [mm]
0
40
80
S [%
]
123122
120121
particle size d [mm]
perc
enta
ge p
assi
ng [%
]
(g) (h)
Figure 6. (a–h) Some grading curves of samples used by Lorincz [1] for suffosion tests.
The inset shows the permeameter test arrangement used in the tests.

Entropy 2015, 17 2794
In some of the tests, stable grain structures were observed (there was no particle erosion or
migration); in others there was migration of finer particles (suffosion) and in others, piping was
observed. The results are represented in Figure 7a on, a partly normalised entropy diagram, with
entropy coordinates A and ΔS. The different sample responses are represented by different symbols and
the criterion was separately set up for each specified N value.
The grouping of the different responses, indicated by the different symbols in Figure 7a, allows the
soil structure stability zones to be identified in the entropy diagram. If A < 2/3 (Zone I), the structure of
the large grains is unstable, and smaller particles can be dislodged so that piping or total erosion may
occur. This result can be interpreted as corresponding to a phenomenon where the coarser particles
“float” in the matrix of the finer ones, and become destabilized when the finer particles are removed.
If A > 2/3 the coarser particles form a resistant skeleton, and total erosion cannot occur. In Zone II,
the structure of smaller and larger particles is inherently stable, and there are no particle movements:
the larger particles retain the smaller particles, and the smaller particles support the larger ones.
In Zone III, the fines may migrate in the presence of seepage flow (“suffosion”), but they are unable
to cause collapse of the structural skeleton of coarser particles.
In Figure 7a, the lower part of the diagram, where gap-graded grading curves with self-suffosion are
mapped, is indicated by letter b. The division curve—between zones II and III—connects the
maximum entropy points where N is less than the N value related to the diagram. The identified
stability zones are shown on the normalized diagram in Figure 7b. It can be seen that they depend on N,
since the minimum B line and the line between zones II and III are dependent on N; the self-suffosion
zone is not represented.
0.6 0.8 1.0Relative base entropy A [-]
0.0
1.0
2.0
3.0
Entro
py in
crem
ent
S [
-]
suffosionpipinglimitstable
Ia
IbIIIa
IIIb
IIa
IIb
Δ
124
123
101102-106
107-113
115-119
120- 111-121 112
suffosionpipinglimitstable
(a) (b)
Figure 7. Particle migration zones (a) in half of the partly normalised entropy diagram for
mixtures with N = 6 fractions, (b) in the simplified, normalised entropy diagram. The three
digit numbers in (a) correspond to the numbers on the grading curves shown in Figure 6.
3.4. Filter Criterion
The development of a criterion to decide if a mixture acts as a filter for an adjacent layer (i.e., for
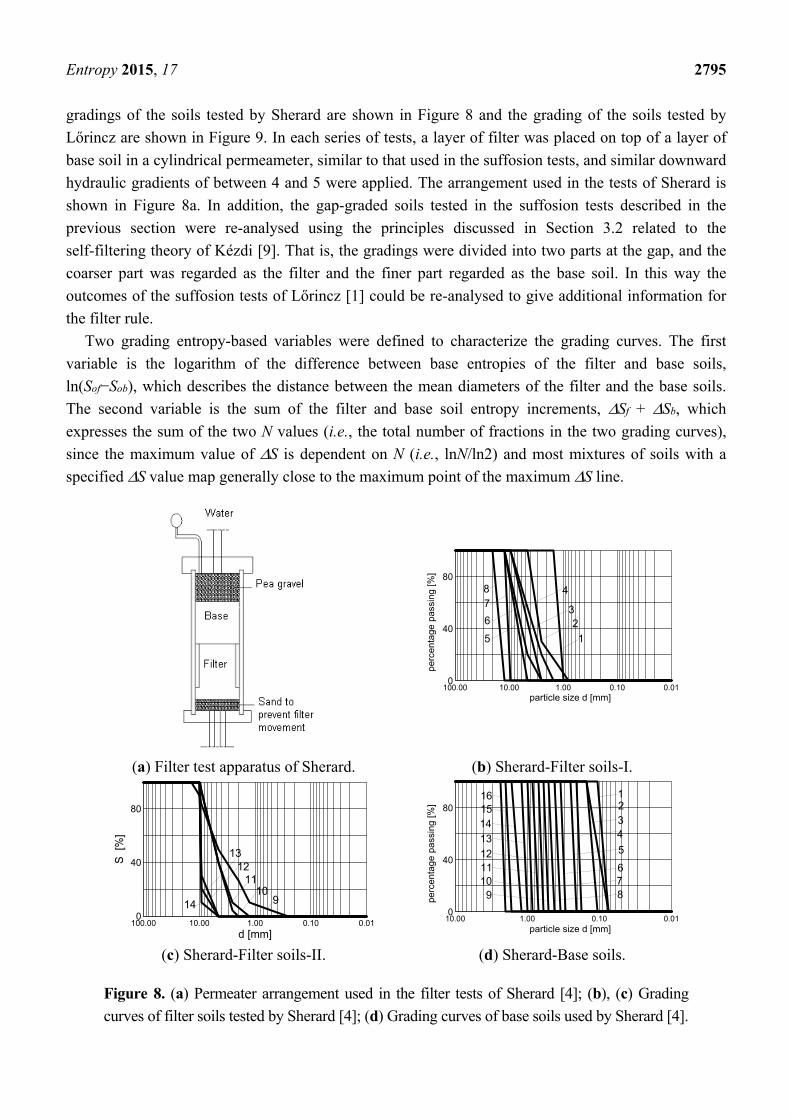
the base soil) was based on two series of tests: those of Sherard [4] and those of Lőrincz [1]. The
Entropy 2015, 17 2795
gradings of the soils tested by Sherard are shown in Figure 8 and the grading of the soils tested by
Lőrincz are shown in Figure 9. In each series of tests, a layer of filter was placed on top of a layer of
base soil in a cylindrical permeameter, similar to that used in the suffosion tests, and similar downward
hydraulic gradients of between 4 and 5 were applied. The arrangement used in the tests of Sherard is
shown in Figure 8a. In addition, the gap-graded soils tested in the suffosion tests described in the
previous section were re-analysed using the principles discussed in Section 3.2 related to the
self-filtering theory of Kézdi [9]. That is, the gradings were divided into two parts at the gap, and the
coarser part was regarded as the filter and the finer part regarded as the base soil. In this way the
outcomes of the suffosion tests of Lőrincz [1] could be re-analysed to give additional information for
the filter rule.
Two grading entropy-based variables were defined to characterize the grading curves. The first
variable is the logarithm of the difference between base entropies of the filter and base soils,
ln(Sof−Sob), which describes the distance between the mean diameters of the filter and the base soils.
The second variable is the sum of the filter and base soil entropy increments, ΔSf + ΔSb, which
expresses the sum of the two N values (i.e., the total number of fractions in the two grading curves),
since the maximum value of ΔS is dependent on N (i.e., lnN/ln2) and most mixtures of soils with a
specified ΔS value map generally close to the maximum point of the maximum ΔS line.
0.010.101.0010.00100.00d [mm]
0
40
80
S [%
]
876
5
4
321
particle size d [mm]
perc
enta
ge p
assi
ng [%
]
(a) Filter test apparatus of Sherard. (b) Sherard-Filter soils-I.
0.010.101.0010.00100.00d [mm]
0
40
80
S [%
]
14
1312
1110
90.010.101.0010.00
d [mm]0
40
80
S [%
]
161514131211109 8
7654321
particle size d [mm]
perc
enta
ge p
assi
ng [%
]
(c) Sherard-Filter soils-II. (d) Sherard-Base soils.
Figure 8. (a) Permeater arrangement used in the filter tests of Sherard [4]; (b), (c) Grading
curves of filter soils tested by Sherard [4]; (d) Grading curves of base soils used by Sherard [4].
Entropy 2015, 17 2796
0.010.101.0010.00100.00d [mm]
0
40
80
S [%
]
123
4
ABC
D
perc
enta
ge p
assi
ng [%
]
particle size d [mm]
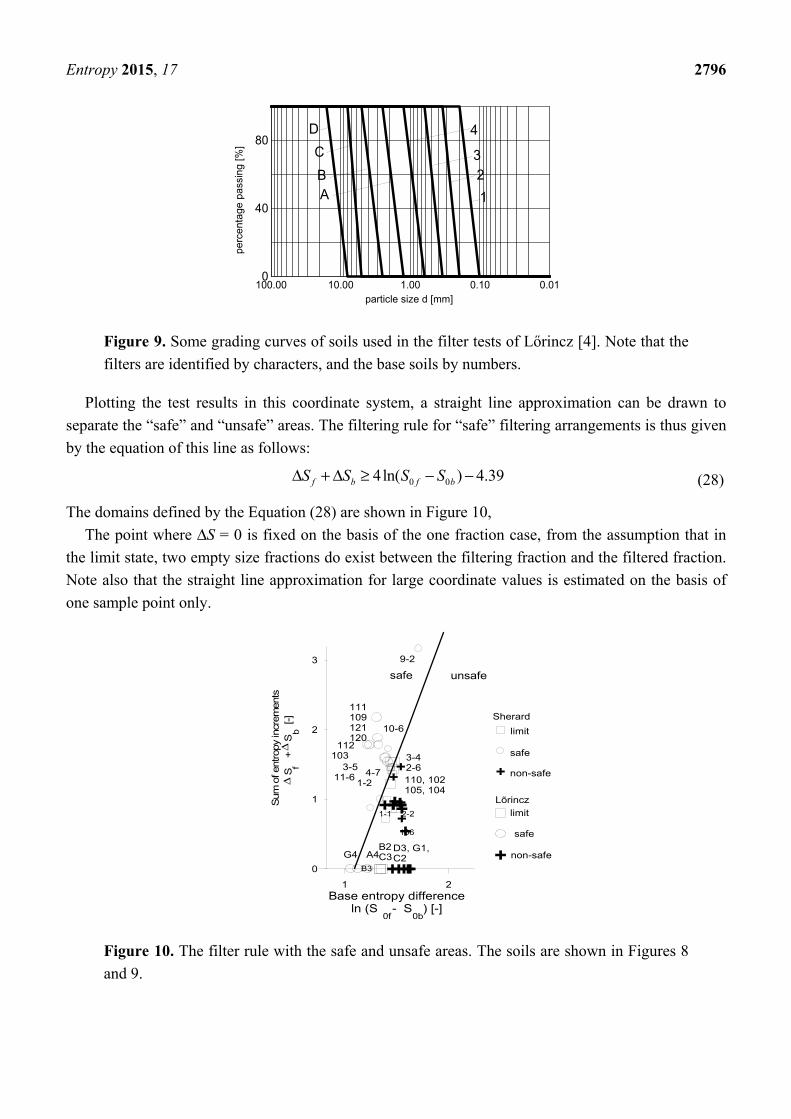
Figure 9. Some grading curves of soils used in the filter tests of Lőrincz [4]. Note that the
filters are identified by characters, and the base soils by numbers.
Plotting the test results in this coordinate system, a straight line approximation can be drawn to
separate the “safe” and “unsafe” areas. The filtering rule for “safe” filtering arrangements is thus given
by the equation of this line as follows:
0 04ln( ) 4.39f b f bS S S SΔ + Δ ≥ − − (28)
The domains defined by the Equation (28) are shown in Figure 10,
The point where ΔS = 0 is fixed on the basis of the one fraction case, from the assumption that in
the limit state, two empty size fractions do exist between the filtering fraction and the filtered fraction.
Note also that the straight line approximation for large coordinate values is estimated on the basis of
one sample point only.
1 2Base entropy difference
ln (S - S ) [-]
0
1
2
3
Sum
of e
ntro
py in
crem
ents
S
+
S
[-]
ΔΔ safe
non-safe
limit
unsafesafe
0f 0b
f
b
limit
Sherard
Lõrincz
9-2
10-6
3-42-6
111109121120
safe
1-1 2-2
106
110, 102105, 104
non-safe
4-71-2
3-511-6
112103
G4 A4B3
B2C3
D3, G1, C2
Figure 10. The filter rule with the safe and unsafe areas. The soils are shown in Figures 8
and 9.
Entropy 2015, 17 2797
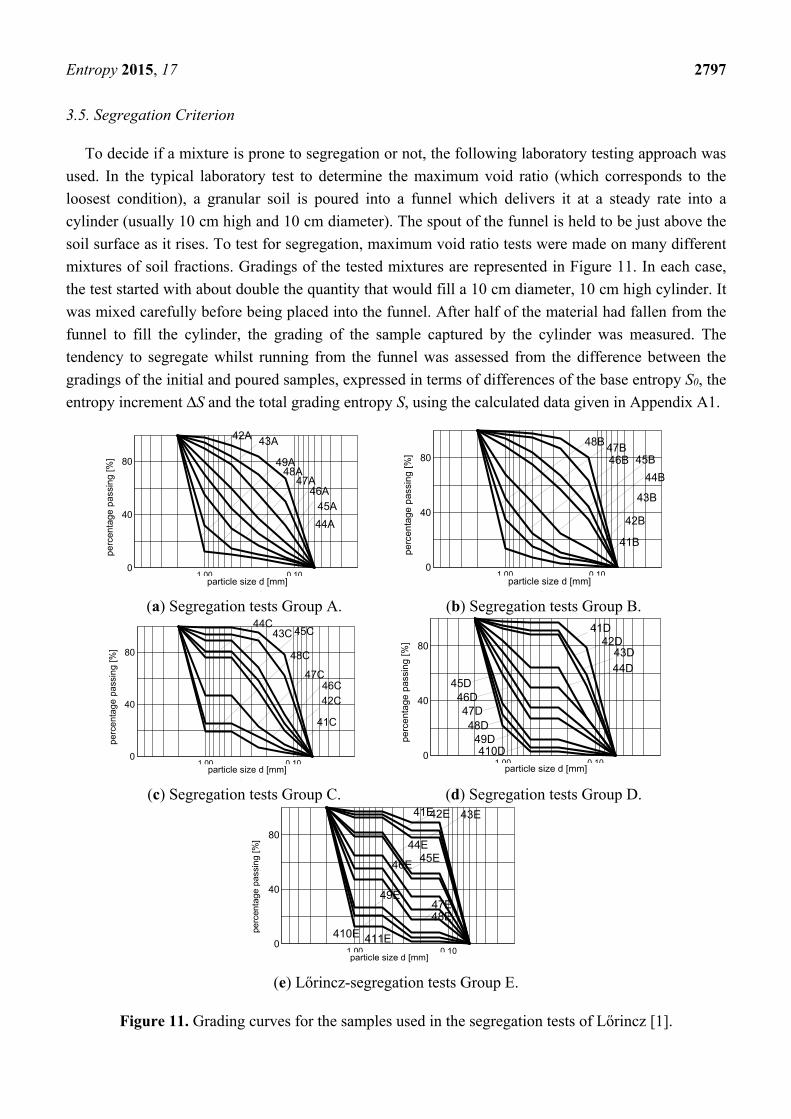
3.5. Segregation Criterion
To decide if a mixture is prone to segregation or not, the following laboratory testing approach was
used. In the typical laboratory test to determine the maximum void ratio (which corresponds to the
loosest condition), a granular soil is poured into a funnel which delivers it at a steady rate into a
cylinder (usually 10 cm high and 10 cm diameter). The spout of the funnel is held to be just above the
soil surface as it rises. To test for segregation, maximum void ratio tests were made on many different
mixtures of soil fractions. Gradings of the tested mixtures are represented in Figure 11. In each case,
the test started with about double the quantity that would fill a 10 cm diameter, 10 cm high cylinder. It
was mixed carefully before being placed into the funnel. After half of the material had fallen from the
funnel to fill the cylinder, the grading of the sample captured by the cylinder was measured. The
tendency to segregate whilst running from the funnel was assessed from the difference between the
gradings of the initial and poured samples, expressed in terms of differences of the base entropy S0, the
entropy increment ΔS and the total grading entropy S, using the calculated data given in Appendix A1.
0.101.00d [mm]
0
40
80
S [%
]
42A 43A
49A48A
47A46A
45A44A
particle size d [mm]
perc
enta
ge p
assi
ng [%
]
0.101.00d [mm]
0
40
80
S [%
]
41B
42B
43B
44B45B46B
47B48B
particle size d [mm]
perc
enta
ge p
assi
ng [%
]
(a) Segregation tests Group A. (b) Segregation tests Group B.
0.101.00d [mm]
0
40
80
S [%
]
41C
42C
44C43C
48C
47C46C
45C
particle size d [mm]
perc
enta
ge p
assi
ng [%
]
0.101.00d [mm]
0
40
80
S [%
]
410D49D
48D47D
46D45D
44D43D
42D41D
particle size d [mm]
perc
enta
ge p
assi
ng [%
]
(c) Segregation tests Group C. (d) Segregation tests Group D.
0.101.00d [mm]
0
40
80
Smal
ler S
[%
]
41E42E 43E
44E45E46E
47E48E
49E
410E 411E particle size d [mm]
perc
enta
ge p
assi
ng [%
]
(e) Lőrincz-segregation tests Group E.
Figure 11. Grading curves for the samples used in the segregation tests of Lőrincz [1].
Entropy 2015, 17 2798
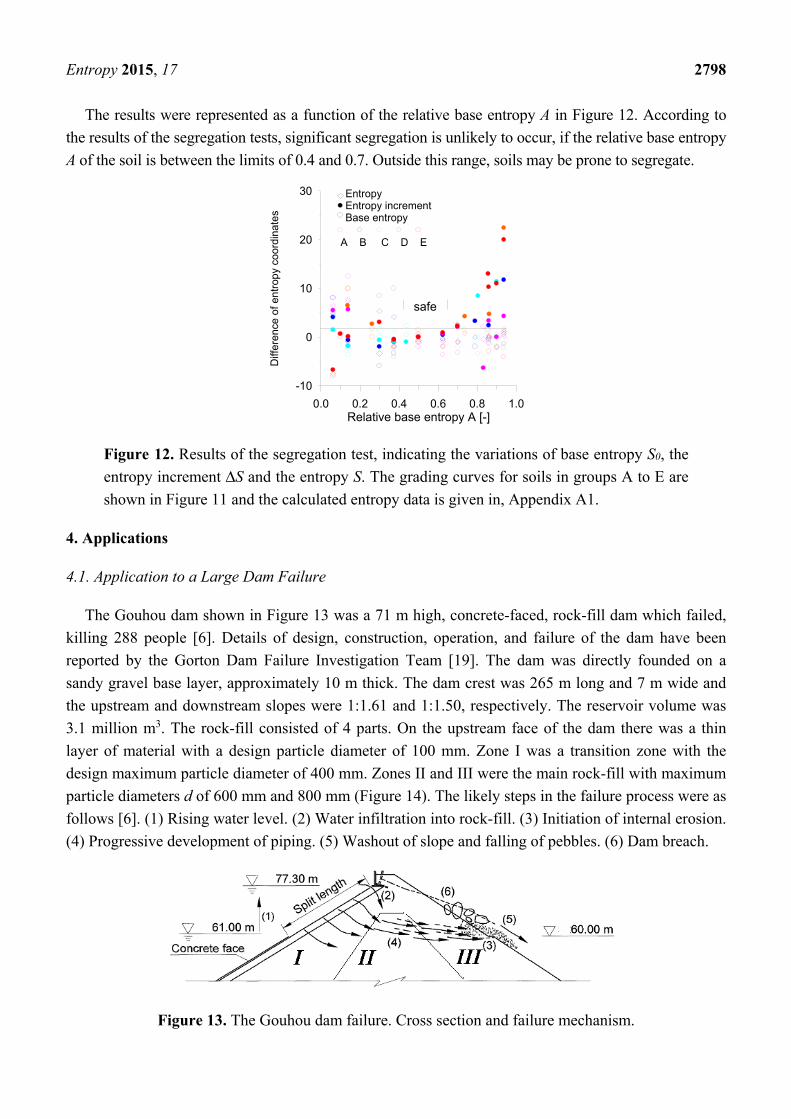
The results were represented as a function of the relative base entropy A in Figure 12. According to
the results of the segregation tests, significant segregation is unlikely to occur, if the relative base entropy
A of the soil is between the limits of 0.4 and 0.7. Outside this range, soils may be prone to segregate.
0.0 0.2 0.4 0.6 0.8 1.0Relative base entropy A [-]
-10
0
10
20
30
Diff
eren
ce o
f ent
ropy
coo
rdin
ates
EntropyEntropy incrementBase entropy
A B C D E
safe
Figure 12. Results of the segregation test, indicating the variations of base entropy S0, the
entropy increment ΔS and the entropy S. The grading curves for soils in groups A to E are
shown in Figure 11 and the calculated entropy data is given in, Appendix A1.
4. Applications
4.1. Application to a Large Dam Failure
The Gouhou dam shown in Figure 13 was a 71 m high, concrete-faced, rock-fill dam which failed,
killing 288 people [6]. Details of design, construction, operation, and failure of the dam have been
reported by the Gorton Dam Failure Investigation Team [19]. The dam was directly founded on a
sandy gravel base layer, approximately 10 m thick. The dam crest was 265 m long and 7 m wide and
the upstream and downstream slopes were 1:1.61 and 1:1.50, respectively. The reservoir volume was
3.1 million m3. The rock-fill consisted of 4 parts. On the upstream face of the dam there was a thin
layer of material with a design particle diameter of 100 mm. Zone I was a transition zone with the
design maximum particle diameter of 400 mm. Zones II and III were the main rock-fill with maximum
particle diameters d of 600 mm and 800 mm (Figure 14). The likely steps in the failure process were as
follows [6]. (1) Rising water level. (2) Water infiltration into rock-fill. (3) Initiation of internal erosion.
(4) Progressive development of piping. (5) Washout of slope and falling of pebbles. (6) Dam breach.
Figure 13. The Gouhou dam failure. Cross section and failure mechanism.
Entropy 2015, 17 2799
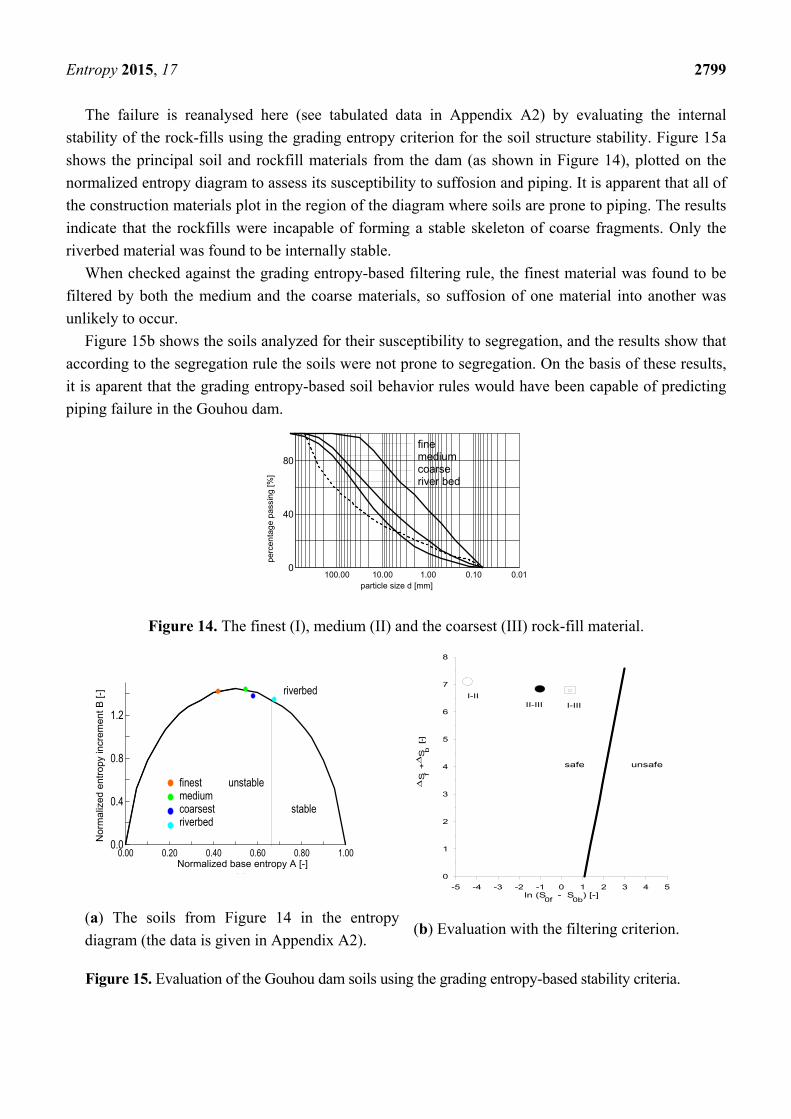
The failure is reanalysed here (see tabulated data in Appendix A2) by evaluating the internal
stability of the rock-fills using the grading entropy criterion for the soil structure stability. Figure 15a
shows the principal soil and rockfill materials from the dam (as shown in Figure 14), plotted on the
normalized entropy diagram to assess its susceptibility to suffosion and piping. It is apparent that all of
the construction materials plot in the region of the diagram where soils are prone to piping. The results
indicate that the rockfills were incapable of forming a stable skeleton of coarse fragments. Only the
riverbed material was found to be internally stable.
When checked against the grading entropy-based filtering rule, the finest material was found to be
filtered by both the medium and the coarse materials, so suffosion of one material into another was
unlikely to occur.
Figure 15b shows the soils analyzed for their susceptibility to segregation, and the results show that
according to the segregation rule the soils were not prone to segregation. On the basis of these results,
it is aparent that the grading entropy-based soil behavior rules would have been capable of predicting
piping failure in the Gouhou dam.
0.010.101.0010.00100.00d [mm]
0
40
80
Pass
ing
[%]
finemedium coarseriver bed
particle size d [mm]
perc
enta
ge p
assi
ng [%
]
Figure 14. The finest (I), medium (II) and the coarsest (III) rock-fill material.
0.00 0.20 0.40 0.60 0.80 1.00A [-]
0.0
0.4
0.8
1.2
B [-
]
riverbed
finestmediumcoarsestriverbed
unstable
stable
Normalized base entropy A [-]
Nor
mal
ized
ent
ropy
incr
emen
t B [-
]
-5 -4 -3 -2 -1 0 1 2 3 4 5
ln (S - S ) [-]
0
1
2
3
4
5
6
7
8
S
+
S
[-]Δ
Δ
I-IIII-III
safe unsafe
I-III
0f 0b
f
b
(a) The soils from Figure 14 in the entropy
diagram (the data is given in Appendix A2). (b) Evaluation with the filtering criterion.
Figure 15. Evaluation of the Gouhou dam soils using the grading entropy-based stability criteria.

Entropy 2015, 17 2800
4.2. Comparison of Filtering Rules
The general grading entropy-based filter law presented here was compared with the range of
existing filtering rules available in the literature, using some soil mixtures generated for this purpose [1].
Summaries of well-known filter rules ([4,16,20–26]) for uniformly graded filters and broadly-graded
filters are presented in Tables 2 and 3, respectively. These different filtering rules were tested by
generating soils with the special shaped grading curves shown in Figure 16 and parameterized in Table 4.
Their entropy parameters were then calculated (presented in Appendix A3), and they were plotted on
the diagram with the filtering rule (i.e., as shown by the line in Figure 10).
Table 2. Rules for uniform filters.
Rule Criterion
U.S. Bureau of Reclamation for uniform filters and base materials [24] 10550
50 −=d
D
Sichard for uniform filters and base materials 5.4350
50 −=d
D
Sherard et al. 1984 [4] 985
15 <d
D
Derived from Terzaghi [16] broadly-graded 41max
min ≤≤d
D
where D and d denotes the filter and the base soil, respectively.
Table 3. Rules for broadly-graded filters and base materials.
Rule Criterion
Terzaghi [16] for broadly-graded filters and base materials 15 15
85 15
4, 4D D
d d≤ ≥
U.S. Bureau of Reclamation [24] 50 15
50 15
12 58, 12 4D D
d d= − = −
Bertram [25] 15 15
85 15
5, 5 9D D
d d≤ = −
Cistin [26] 10 60
60 10
5, 5D
D DU
d D< = <
where D and d denotes the filter and the base soil, respectively.

Entropy 2015, 17 2801
0.010.101.0010.00d [mm]
0
40
80
S [%
]
1
I
IIIIIIV
particle size d [mm]
perc
enta
ge p
assi
ng [%
]
0.010.101.0010.00d [mm]
0
40
80
S [%
]
particle size d [mm]
perc
enta
ge p
assi
ng [%
]
(a) Mixtures for the Terzaghi’s criterion-T. (b) U.S. Bureau simple filters-U.
0.010.101.0010.00100.00d [mm]
0
40
80
S [%
]
1
particle size d [mm]
perc
enta
ge p
assi
ng [%
]
0.010.101.0010.00d [mm]
0
40
80
S [%
] 1
particle size d [mm]
perc
enta
ge p
assi
ng [%
]
(c) U.S. Bureau mixed filters-UM. (d) Mixtures for Bertram’s criterion-B.
Figure 16. The grading curves for the theoretical soils used in the testing of existing
filtering laws.
Table 4. The data of the grading curves used in evaluating the filtration rules.
D50/d50 D15/d85 D10/d60 D15/d15 S0b S0f ΔSb ΔSf
1 B1-1I 7 4.58 6.5 7.86 13 16 0 0
2 B1-1II 14 5.67 22.5 9.71 13 17 0 1.585
3 T1-1I 10.00 4.17 4.44 7.14 13 16.35 0 1.44
4 T1-1II 4 2.42 3.1 4.14 13 15 0 0
5 T1-1III 6.89 4.17 3.1 7.14 13 15.85 0 0.61
6 T1-1Iv 11.11 5.17 6.3 8.86 13 16.5 0 1
7 UM1-1I 13.9 7.3 0.8 12 13 16.8 0 0.722
8 UM1-1II 58 7.3 0.8 12 13 18.51 0 2.07
9 UM1-1III 58 25.5 2.6 40 13 19. 0 1.585
10 U1-1I 5.55 3.02 3.13 4.57 13 15.5 0 1
11 U1-1II 7.78 5.19 5.42 7.86 13 16 0 0
12 U1-1III 11.1 5.85 6.25 8.86 13 16.5 0 1
13 U1-1Iv 15.5 10.19 10.63 15.43 13 17 0 0
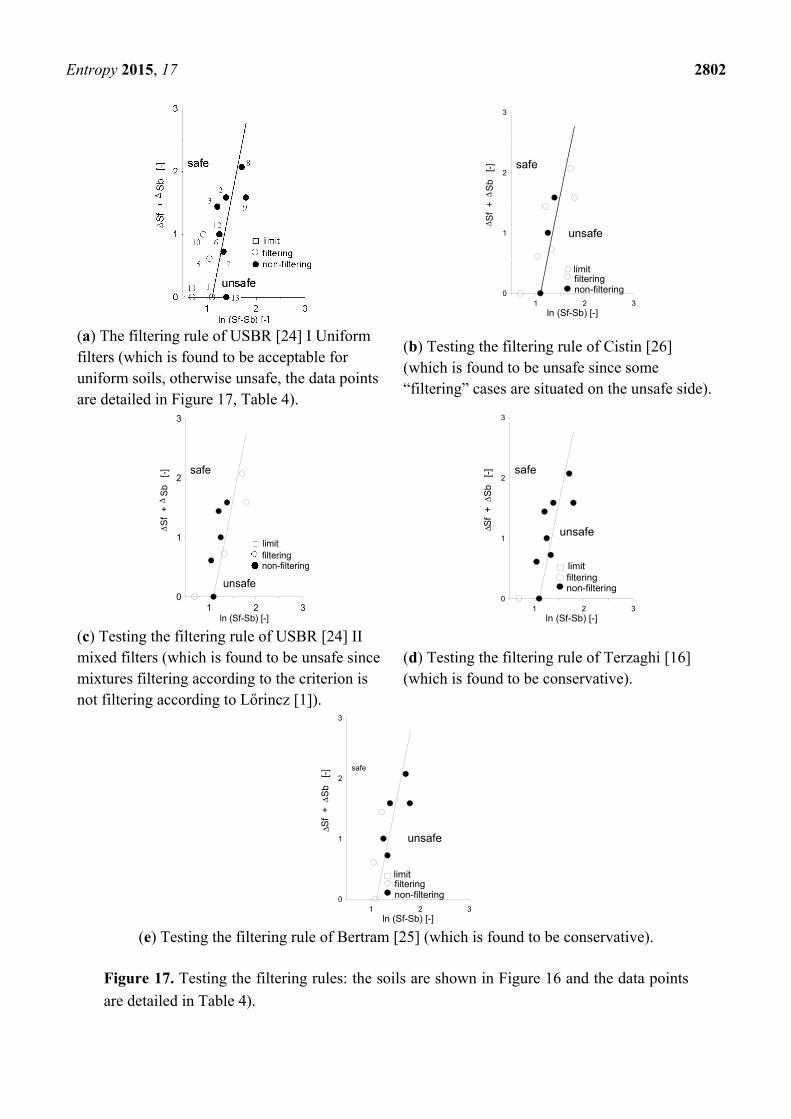
The comparisons are shown in Figure 17 for the different filtering rules of the literature. In each
case, where the rule from the literature predicted a successful filtering (i.e., safe behavior), it was
plotted with a white circle: where it predicted a failure to filter (i.e., unsafe behavior), it was plotted
with a black circle. The results are also summarized in Table 5.
Entropy 2015, 17 2802
1 2 3ln (Sf-Sb) [-]
0
1
2
3
Sf
+
Sb
[-]Δ
Δ
filteringnon-filtering
limit
unsafe
safe
(a) The filtering rule of USBR [24] I Uniform filters (which is found to be acceptable for uniform soils, otherwise unsafe, the data points are detailed in Figure 17, Table 4).
(b) Testing the filtering rule of Cistin [26] (which is found to be unsafe since some “filtering” cases are situated on the unsafe side).
1 2 3ln (Sf-Sb) [-]
0
1
2
3
Sf
+
Sb
[-]Δ
Δ
filteringnon-filtering
limit
unsafe
safe
1 2 3
ln (Sf-Sb) [-]
0
1
2
3
Sf
+
Sb
[-]Δ
Δ
filteringnon-filtering
limit
unsafe
safe
(c) Testing the filtering rule of USBR [24] II mixed filters (which is found to be unsafe since mixtures filtering according to the criterion is not filtering according to Lőrincz [1]).
(d) Testing the filtering rule of Terzaghi [16] (which is found to be conservative).
1 2 3ln (Sf-Sb) [-]
0
1
2
3
Sf
+
Sb
[-]Δ
Δ
filteringnon-filtering
limit
unsafe
safe
(e) Testing the filtering rule of Bertram [25] (which is found to be conservative).
Figure 17. Testing the filtering rules: the soils are shown in Figure 16 and the data points
are detailed in Table 4).

Entropy 2015, 17 2803
Table 5. The outcome of the evaluation of the filtration rules.
Grading curve pair for an
Individual filter criteriion
Outcome of grading
entropy-based filter rule
Outcome of Individual
filter criteriion
Property of Individual
filter criteriion
1 B1-1I fails yes unsafe
2 B1-1II filters successfully not conservative
3 T1-1I filters successfully not conservative
4 T1-1II filters successfully yes good
5 T1-1III filters successfully not conservative
6 T1-1Iv filters successfully not conservative
7 UM1-1I fails yes unsafe
8 UM1-1II fails yes unsafe
9 UM1-1III fails yes unsafe
10 U1-1I filters successfully yes good
11 U1-1II fails yes unsafe
12 U1-1III filters successfully yes good
13 U1-1Iv fails not good
According to the results, the application of the general grading entropy-based filter rule indicates
that (i) Terzaghi’s filter rule is too conservative, (ii) the same applies for Bertram’s rule and the rule
recommended by the U. S. Bureau of Reclamation (USBR) for uniform filters, and (iii) conversely, the
mixed filter rule of the USBR is not conservative and is not acceptable.
4.3. Non-segregating Mixtures
For laboratory testing of granular materials, or for the design of a filter, it is advantageous to use a
non-segregating mixture with 0.4 < A < 0.7, so that a uniformly textured body of soil is achieved.
Non-optimal mixtures can be designed by a simple algorithm fulfilling Equations (9) and (17) for fixed
A and N (N > 1). To construct an optimal mixture, where the maximum normalized entropy increment
B is a maximum for a given N and normalized base entropy A, Equations (19) and (21) must be
obeyed. Some examples are shown in Figure 18 and in Table 6.
1.0010.00100.00d [mm]
0.0
0.5
1.0
S [%
]
A= 0.7
A=0.5
5 fraction soils
particle size d [mm]
perc
enta
ge p
assi
ng [%
]
Figure 18. The non-segregating optimal 5-fraction mixtures (see additional data in
Appendix A3).
Entropy 2015, 17 2804
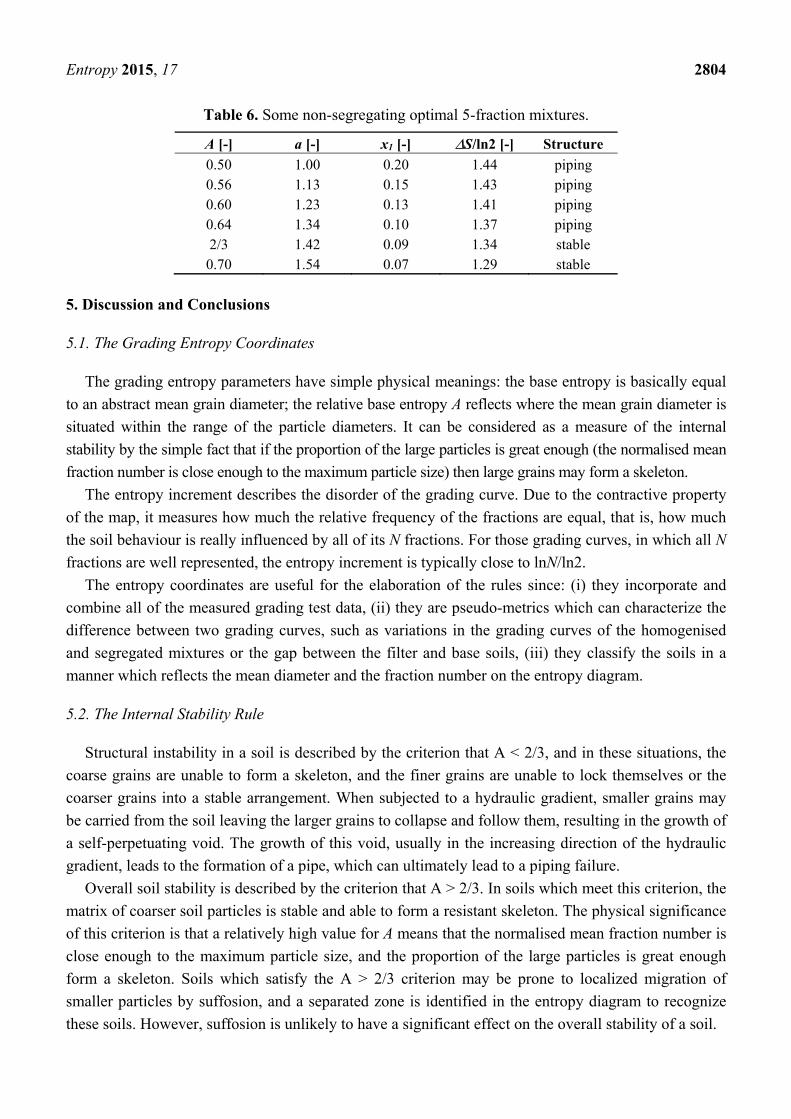
Table 6. Some non-segregating optimal 5-fraction mixtures.
A [-] a [-] x1 [-] ΔS/ln2 [-] Structure
0.50 1.00 0.20 1.44 piping 0.56 1.13 0.15 1.43 piping 0.60 1.23 0.13 1.41 piping 0.64 1.34 0.10 1.37 piping 2/3 1.42 0.09 1.34 stable 0.70 1.54 0.07 1.29 stable
5. Discussion and Conclusions
5.1. The Grading Entropy Coordinates
The grading entropy parameters have simple physical meanings: the base entropy is basically equal
to an abstract mean grain diameter; the relative base entropy A reflects where the mean grain diameter is
situated within the range of the particle diameters. It can be considered as a measure of the internal
stability by the simple fact that if the proportion of the large particles is great enough (the normalised mean
fraction number is close enough to the maximum particle size) then large grains may form a skeleton.
The entropy increment describes the disorder of the grading curve. Due to the contractive property
of the map, it measures how much the relative frequency of the fractions are equal, that is, how much
the soil behaviour is really influenced by all of its N fractions. For those grading curves, in which all N
fractions are well represented, the entropy increment is typically close to lnN/ln2.
The entropy coordinates are useful for the elaboration of the rules since: (i) they incorporate and
combine all of the measured grading test data, (ii) they are pseudo-metrics which can characterize the
difference between two grading curves, such as variations in the grading curves of the homogenised
and segregated mixtures or the gap between the filter and base soils, (iii) they classify the soils in a
manner which reflects the mean diameter and the fraction number on the entropy diagram.
5.2. The Internal Stability Rule
Structural instability in a soil is described by the criterion that A < 2/3, and in these situations, the
coarse grains are unable to form a skeleton, and the finer grains are unable to lock themselves or the
coarser grains into a stable arrangement. When subjected to a hydraulic gradient, smaller grains may
be carried from the soil leaving the larger grains to collapse and follow them, resulting in the growth of
a self-perpetuating void. The growth of this void, usually in the increasing direction of the hydraulic
gradient, leads to the formation of a pipe, which can ultimately lead to a piping failure.
Overall soil stability is described by the criterion that A > 2/3. In soils which meet this criterion, the
matrix of coarser soil particles is stable and able to form a resistant skeleton. The physical significance
of this criterion is that a relatively high value for A means that the normalised mean fraction number is
close enough to the maximum particle size, and the proportion of the large particles is great enough
form a skeleton. Soils which satisfy the A > 2/3 criterion may be prone to localized migration of
smaller particles by suffosion, and a separated zone is identified in the entropy diagram to recognize
these soils. However, suffosion is unlikely to have a significant effect on the overall stability of a soil.

Entropy 2015, 17 2805
The dam in the Gouhou reservoir failed during its first water filling. Observations of the failure are
consistent with failure due to piping. In this paper, support for this hypothesis has been provided the
application of the particle migration criterion to the materials used in the construction of the dam. The
lesson learned from this case study is that even high quality rock-fills may have unstable structure (A < 2/3)
which means that cannot achieve a stable skeleton composed of its largest grains.
A very important question arises in regard to the stability of a single fraction which does not lie in a
unique position on the entropy diagram. The case of a single fraction is unclear. It is not sure that the
formation of the stable structure is ensured, although the condition of a single fraction in an
engineering material seldom arises, as the grains are usually crushed to some degree during
construction. However, uniform, very good quality stone fills with no particle crushing during
construction may be unstable and more research is needed to better understand this situation.
Another issue which lies beyond the present discussion, but which requires further research, is
whether materials which have an unstable structure according to the grading entropy criterion may also
be prone to erosion when exposed to water flow at the ground surface.
5.3. The Filter Rule
Filtration problems for uniform filters and granular bases (i.e., soils to be protected by the filters) have
long been solved to a reasonable extent. Where doubt may arise is their application to broadly-graded
filters or to broadly-graded or silt-clay base materials. This paper gives a unified filter rule for any
filter, based on the idea that the grading entropy coordinates can be used in metrics which characterize
the difference between two grading curves; i.e., the distance between the filter and base soils. It
includes the basic observation that the entropy increment ΔS characterizes the fraction number N
which is essential for broadly-graded filters.
At present, the available filter rules are related to single fraction and broadly-graded filters and
several rules are available. In each case, these are based on a only few parameters from the grading
curve. The rule established in this paper is a general filter rule based on the data of the whole grading
curve. Using the general filter rule elaborated here, the existing rules were tested. It was found that
Terzaghi’s filter rule, Bertram’s rule [25] and the rule recommended by the U.S. Bureau of
Reclamation (USBR) for uniform filters are reliable, but the mixed filter rule of the USBR [24] and
Cistin [26] may not be reliable.
5.4. The Segregation Rule
Broadly-graded silt-sand-gravel soils are prone to segregation during placement of earthworks or in
the formation of laboratory test specimens. A segregation criterion has been elaborated on the basis of
flow tests. Using this rule, and the equations of grading entropy presented in this paper, non-segregating
artificial compositions of natural grains can be constructed.
5.5. The Use of the Rules
All of the grading entropy-based criteria can easily be implemented into any laboratory test
evaluation software and are simple to use. A similar opportunity exists for the approach which can be
Entropy 2015, 17 2806
used for the computation of non-segregating mixtures. A basic requirement is that the grading curve
information should be reliable. The rules presented here were elaborated on the basis of simple soil
tests made on relatively coarse granular mixtures (only). The criteria apply unconditionally for soils where
the solid fraction is composed of non-clay minerals, but the same criteria may be valid for silt-clayey soils
if the grading curve information is reliable. For soils with solid fraction composed of clay minerals it is
necessary that the composition of the water used for grading test is identical to the chemical
composition of the ground water ([27–30]) so that an appropriate degree of particle agglomeration is
reflected in the measurements.
5.6. Suggestions for Further Research
It is suggested that the mean grain diameter and normalized grain diameter could be introduced as
parameters into everyday geotechnical practice since these have a physical meaning and can be related
to other parameters and properties. The base entropy S0 and the relative base entropy A have one-to-one
relationships with the mean grain diameter and normalized grain diameter. Using the concept of the
fraction serial number, an abstract, mean or mean normalized fraction number can be defined in terms
of the fraction serial number i, denoted by imean and kmean respectively.
The relative base entropy A measures where the mean grain diameter is situated within the range of
the particle diameters. It was found that it can be considered as a measure of the internal stability by
the simple fact that if the proportion of the large particles is great enough (the normalised mean
fraction number is close enough to the maximum particle size) then large grains may form a skeleton.
The Discrete Element Method (DEM) would be a useful tool for further research, and work is
suggested on several aspects such as (i) the internal stability criterion concerning the formation of the
stable structure, (ii) the internal stability criterion for the one fraction case, and (iii) the reason for the
similarity between the internal stability criterion and the segregation criterion (i.e., the significance of
the A = 2/3 point).
Further experimental research is suggested on the appropriateness of the straight line approximation
of the filter rule for coarse grained mixtures and on the relationship between the internal stability
criteria and erosion criteria.
Acknowledgments
This paper is the result of a research supported by the National Research Fund OTKA 1457/86
(“Complex geotechical investigations of river dikes”) and the suggestions of László Nagy is greatly
acknowledged. The support of the National Research Fund Jedlik Ányos NKFP B1 2006 08 was used
(“Biodegradation landfill technology”).
Author Contributions
Janos Lőrincz elaborated the criteria; Emöke Imre elaborated the examples, prepared the figures in
30%, coordinated all works related to the paper, wrote the paper with Phong Q. Trang and
Stephen Fityus; Phong Q. Trang prepared the figures in 60%, worked with the description of the
original work of Janos Lőrincz; Stephen Fityus helped in writing the paper, preparing the figures in

Entropy 2015, 17 2807
10%, he will cover the fee if needed; Vijay P. Singh helped in editing the paper; Tibor Tarnai and
István Talata helped with Section 3.2. The paper was submitted when all people read the paper and
their suggestions have been included. All authors have read and approved the final manuscript.
Appendix
Appendix A1. Data for Segregation Criterion
The grading curves of Lőrincz can be found in Figure 11, the results in Table A1-1.
Table A1-1. Data of grading curves used in segregation tests.
N o Variation [%]
A [-] S0 [-] ΔS [-] S [-]
4 2 A 0.1375 9.91 6.48 7.35
4 3 A 0.2625 0 2.67 1.72
4 4 A 0.375 −4 −1.03 −2.09
4 5 A 0.5 1.5 −0.04 0.65
4 7 A 0.7375 1.36 4.24 0.84
4 8 A 0.8625 −1.31 4.7 0.43
4 9 A 0.9375 −2.13 22.42 1.61
4 1 B 0.0625 8 4.09 4.77
42B 0.14 −1.79 −0.62 −0.84
43B 0.3 −5.83 −1.97 −3.35
4 4 B 0.375 −3.33 −0.9 −1.88
4 5 B 0.625 −0.4 0.45 −0.42
4 6 B 0.79 −1.9 3.29 0
4 7 B 0.86 −0.58 2.4 0.2
48B 0.9375 −1.35 11.73 1.2
4 1 C 0.0625 4 1.46 1.75
4 2 C 0.14 −3.57 −1.85 −2.24
4 3 C 0.3 1.67 −0.63 0.19
4 4 C 0.375 4 −0.96 1.47
4 5 C 0.4375 2.28 −1 0.53
4 6 C 0.7 −2.14 2.42 −0.67
4 7 C 0.805 −3.42 8.46 0
4 8 C 0.9 −1.87 11.37 0.59
41D 0.0625 8 5.47 6.42
44D 1.14 12.5 5.67 7.72
44D 0.375 10 −0.57 4.17
45D 0.5 −2 0 −1
46D 0.625 −3.6 0.67 −1.74
44D 0.7 −3.21 2.1 −1
44D 0.86 −1.16 3.37 0
44D 0.9 0 0 0
410D 0.9375 0.53 4.28 0.22
411D 0.8325 2.1 −6.34 −0.42
Entropy 2015, 17 2808
Table A1-1. Cont.
N o Variation [%]
A [-] S0 [-] ΔS [-] S [-]
41E 0.0625 −8 −6.73 −7.48
42E 0.1 0 0.65 0.77
43E 0.14 10 0.1 0.13
44E 0.3 8.5 3.06 5.33
45E 0.375 −2 −0.46 −1.03
46E 0.5 −1 0 −0.61
47E 0.625 −2 0.92 −0.87
48E 0.7 2.5 2.2 −0.93
49E 0.86 −2.91 10.28 0
410E 0.9 −2.13 11 −1.95
411E 0.9375 −4 20 0.83
412E 0.8575 1.46 13 −0.23
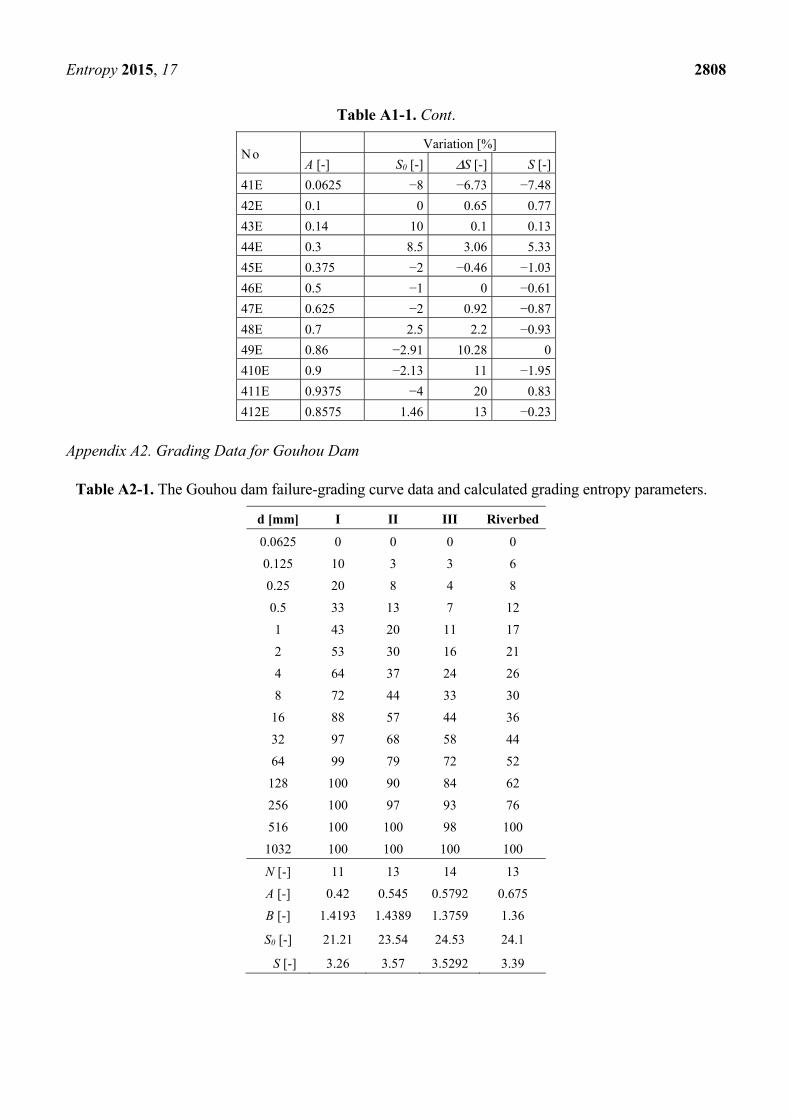
Appendix A2. Grading Data for Gouhou Dam
Table A2-1. The Gouhou dam failure-grading curve data and calculated grading entropy parameters.
d [mm] I II III Riverbed
0.0625 0 0 0 0
0.125 10 3 3 6
0.25 20 8 4 8
0.5 33 13 7 12
1 43 20 11 17
2 53 30 16 21
4 64 37 24 26
8 72 44 33 30
16 88 57 44 36
32 97 68 58 44
64 99 79 72 52
128 100 90 84 62
256 100 97 93 76
516 100 100 98 100
1032 100 100 100 100
N [-] 11 13 14 13
A [-] 0.42 0.545 0.5792 0.675
B [-] 1.4193 1.4389 1.3759 1.36
S0 [-] 21.21 23.54 24.53 24.1
S [-] 3.26 3.57 3.5292 3.39

Entropy 2015, 17 2809
Appendix A3. Data for Optimal Mixtures
Table A3-1. The fractal dimension n of optimal mixtures for a fixed N (N = 5) together
with parameter a and coordinate B in the function of coordinate A.
A [-] a [-] x1 [-] B [-] Fractal dimension
0.50 1.00 0.20 1.44 3
0.60 1.23 0.13 1.41 2.70
0.67 1.42 0.09 1.34 2.49
0.70 1.54 0.07 1.29 2.38
0.71 1.60 0.06 1.27 2.32
0.76 1.79 0.05 1.19 2.16
0.79 2.00 0.03 1.11 2.00
0.82 2.22 0.02 1.04 1.85
0.84 2.46 0.02 0.97 1.70
0.90 3.44 0.01 0.75 1.22
0.95 5.98 0.00 0.48 0.42
0.4 0.81 0.13 1.41 3.30
0.33 0.70 0.09 1.34 3.51
0.3 0.65 0.07 1.29 3.62
0.29 0.63 0.06 1.27 3.68
0.24 0.56 0.05 1.19 3.84
0.21 0.50 0.03 1.11 4.00
0.18 0.45 0.02 1.04 4.15
0.16 0.41 0.02 0.97 4.30
0.1 0.29 0.01 0.75 4.78
0.05 0.17 0.00 0.48 5.58
Conflicts of Interest
The authors declare no conflict of interest.
References
1. Lőrincz, J. Grading Entropy of Soils. Ph. D. Thesis, Technical University of Budapest, Budapest,
Hungary, 1986. (In Hungarian)
2. Lőrincz, J. On particle migration with the help of grading entropy. In Filters in Geotechnical and
Hydraulic Engineering, Proceedings of the First International Conference on “Geo-Filters”
Karlsruhe, Germany, 20–22 October 1992; pp. 63–66.
3. Lőrincz, J. On granular filters with the help of grading entropy. In Filters in Geotechnical and
Hydraulic Engineering, Proceedings of the First International Conference on “Geo-Filters”
Karlsruhe, Germany, 20–22 October 1992; pp. 67–70.
4. Sherard, J.L.; Dunningan, L.P.; Talbot, J.R. Basic properties of sand and gravel filters.
J. Geotech. Eng. 1984, 110, 684–700.
5. Kenney, T.C.; Lau, D. Internal stability of granular filters. Can. Geotech. J. 1985, 22, 215–225.

Entropy 2015, 17 2810
6. Zhang, L.M.; Chen, Q. Seepage failure mechanism of the Gouhou rock-fill dam during reservoir
water infiltration. Soils Found. 2006, 46, 557–568.
7. Imre, E.; Lőrincz, J.; Szendefy, J.; Trang, P.Q.; Nagy, L.; Singh, V.P.; Fityus, S. Case Studies and
Benchmark Examples for the Use of Grading Entropy in Geotechnics. Entropy 2012, 14, 1079–1102.
8. O’Sullivan, C. Applying Micro-mechanical Analysis to Realistic Sands. In Proceedings of the
International Symposium on Discrete Element Modelling of Particulate Media: In celebration of
the 70 Birthday of Colin Thornton, Birmingham, UK, 29–30 March 2012.
9. Kézdi, Á. Phase Movements in Granular Soils; Notes of Budapest University of Technology and
Economics, Graduate Courses; Budapest University of Technology and Economics: Budapest,
Hungary, 1975 (manuscript).
10. Khomenko, V.P. Suffosion hazard: Today’s and tomorrow’s problem for cities. In Proceedings of
IAEG2006, Nottingham, UK, 6–10 September 2006.
11. Bonelli, S., Ed. Erosion in Geomechanics Applied to Dams and Levees; Wiley-ISTE: London,
UK, 2013.
12. Bezuijen, A.; Mastbergen, D.R. Liquefaction of a sand body constructed by means of hydraulic
fill. In Proceedings of the 12th International Conference on Soil Mechanics and Foundation
Engineering, Rio de Janeiro, Brazil, 13–18 August 1989; pp. 891–894.
13. Van Beek, V.M.; Knoeff, H.; Sellmeijer, H. Observations on the process of backward erosion
piping in small-, medium- and full-scale experiments. Eur. J. Environ. Civil Eng. 2011, 15,
1115–1137.
14. Sellmeijer, H.; de la Cruz, J.L.; van Beek, V.M.; Knoeff, H. Fine-tuning of the backward erosion
piping model through small-scale, medium-scale and IJkdijk experiments. Euro. J. Environ. Civil
Eng. 2011, 15, 1139–1154.
15. Lubockov, E.A. The calculation of suffosion properties of non-cohesive soils when using the
non-suffosion analogue. In Proceedings of the International Conference on Hydraulic Research,
Brno, Czech Republic, 1965; pp. 135–148.
16. Korn, G.A.; Korn, T.M. Mathematical Handbook for Scientists and Engineers, 2nd ed.;
McGraw-Hill: New York, NY, USA, 1975.
17. Hales, T.C.; Ferguson, S.P. A Formulation of the Kepler Conjecture. In The Kepler Conjecture;
Springer-Verlag: Berlin, Germany, 2011; pp. 83–133.
18. To, H.; Torres, S.A.G.; Scheuermann, A. Primary fabric fraction analysis of granular soils. Acta
Geotech. 2014, doi:10.1007/s11440-014-0353-9.
19. Gouhou Dam Failure Investigation Team. Technical details of the Gouhou Dam. In Gouhou
Concrete-faced Rockfill Dam—Design, Construction, Operation, and Failure; Water
Conservancy and Hydropower Press: Beijing, China, 1996; pp. 111–245.
20. Cedergren, H.R. Seepage control in earth dams. In Embankment-dam Engineering; Wiley:
New York, NY, USA, 1973; pp. 21–45.
21. Schuler, U.; Brauns, J. Behaviour of coarse and well-graded filters. In Filters in Geotechnical
and Hydraulic Engineering, Proceedings of the First International Conference “Geo-Filters”,
Karlsruhe, Germany, 20–22 October 1992; pp. 3–18.
22. Fannin, J.; Terzaghi, K. From Theory to Practice in Geotechnical Filter Design. J. Geotech.
Geoenviron. Eng. 2008, 134, 267–276.

Entropy 2015, 17 2811
23. Terzaghi, K.; Peck, R.B.; Mesri, G. Soil Mechanics in Engineering Practice; Wiley: New York,
NY, USA, 1996.
24. US Bureau of Reclamation. Earth Manual Part 1, 3rd ed.; U.S. Department of the Interior
Bureau of Reclamation, Geotechnical Research Technical Service Center: Denver, CO, USA, 1998.
25. Bertram, G.E. An Experimental Investigation of Protective Filters; Harvard Soil Mechanics
Series No. 7; Graduate School of Engineering, Harvard University: Cambridge, MA, USA, 1940.
26. Cistin, J. Zum Problem mechanischer Deformationen nichtbindiger Lockergesteine durch die
Sickerwasserströmung in Erddämmen. Wasserwirtschaft Wassertechnik 1967, 2, 45–49. (In German)
27. Emerson, W.W. A classification of soil aggregates based on their coherence in water. Aust. J.
Soil Res. 1967, 5, 47–57.
28. Rengasamy, P.; Greene, R.S.B.; Ford, G.W. The role of clay fraction in the particle arrangement
and stability of soil aggregates—a review. Clay Res. 1984, 3, 53–67.
29. Yong, R.N.; Amar, I.S.; Harald, P.L.; Jorgensen, M.A. Interparticle action and rheology of
dispersive clays. J. Geotech. Eng. 1979, 105, 1193–1211.
30. ASTM 2005 C136-06. Standard Test Method for Sieve Analysis of Fine and Coarse Aggregates;
American Society for Testing and Materials: West Conshohocken, PA, USA, 2003.
© 2015 by the authors; licensee MDPI, Basel, Switzerland. This article is an open access article
distributed under the terms and conditions of the Creative Commons Attribution license
(http://creativecommons.org/licenses/by/4.0/).