Embed Size (px)
Citation preview

The authors gratefully acknowledge the helpful comments and suggestions of Milind Shrikhande,Ufuk Ince, and Anna Agapova along with those of an anonymous reviewer. We have benefited fromdiscussions with Andrei Osonenko of Swaps Monitor Publications regarding the data used in thisanalysis.*Correspondence author, Department of Finance, J. Mack Robinson College of Business, GeorgiaState University, MSC 4A1264, Gilmer Street SE, Unit 4, Atlanta, GA 30303; e-mail: [email protected]
Received September 2003; Accepted February 2004
� Ekaterina E. Emm is Genevieve Albers Visiting Fellow at Seattle University in Seattle,Washington.
� Gerald D. Gay is a Professor and Chairman in the Department of Finance at J. MackRobinson College of Business at Georgia State University in Atlanta, Georgia.
The Journal of Futures Markets, Vol. 25, No. 1, 39–77 (2005) © 2005 Wiley Periodicals, Inc.Published online in Wiley InterScience (www.interscience.wiley.com). DOI: 10.1002/fut.20138
THE GLOBAL MARKET
FOR OTC DERIVATIVES:AN ANALYSIS OF
DEALER HOLDINGS
EKATERINA E. EMMGERALD D. GAY*
We provide a descriptive examination of the trading activities of one of themost important intermediaries in global financial markets—the OTCderivatives dealer. These dealers play a central role in the provision ofderivative products and in the intermediation of market risks faced byfinancial and nonfinancial firms alike. Utilizing a unique database, weanalyze the derivatives holdings of 264 dealers spanning 34 countries overthe period 1995–2001. We document the geographic composition ofdealers on both country and regional levels as well as analyze trends indealer holdings on an aggregate and individual product level. We furtheranalyze the extent of global merger activity among dealers and resultingconsolidation effects. Finally, we investigate at the individual dealer level

40 Emm and Gay
the extent and evolution of their array of product offerings. © 2005 WileyPeriodicals, Inc. Jrl Fut Mark 25:39–77, 2005
INTRODUCTION
In this article we provide a descriptive look at the trading activities of oneof the most important intermediaries in global financial markets—theover-the-counter (OTC) derivatives dealer. The proliferation and use ofderivatives during the past two decades, especially those traded OTC,has been among the most spectacular developments in financial markets.According to recent estimates by the Bank of International Settlements(2003), as of year-end 2002 the global outstanding notional amount ofOTC derivatives (e.g., swaps, forwards, and options) had grown to over$141.7 trillion.1 Clearly, the growth in this market has been driven by theneeds of firms seeking risk management solutions and the ability offinancial engineers and dealers to respond.
This study furthers our understanding of the structure of thisimportant market and complements an existing literature that has largelyfocused on the demand for hedging services. In particular, an extensiveliterature has emerged that analyzes rationales for hedging and thedemand for derivatives, typically presented from the perspective of thecorporate end user.2 In contrast, the supply side has received little atten-tion, especially in regards to the activities of OTC derivatives dealerswho play a central role in the provision of derivative products and in theintermediation of market risks faced by financial and nonfinancial firmsalike.3 The study is also important in that it addresses the extent towhich this market has evolved along international dimensions and inspecific product offerings.
1By comparison, the BIS also reports the global exchange-traded derivatives market at $23.9 trillionnotional outstanding as of year-end 2002. A comparison of the market structures of OTC andfutures exchange trading is discussed in Kamara (1988) and Stulz (2003).2For reviews of this literature see, for example, Smithson (1998), Allayannis and Ofek (2001) andthe seminal papers of Smith and Stulz (1985), Froot, Scharfstein, and Stein (1993) and DeMarzoand Duffie (1995). Also, Bartram, Brown, and Fehle (2003) provide a recent examination of thehedging practices and determinants of derivatives usage of a comprehensive and global sample ofnonnonfinancial firms.3Studies by Sun, Sundaresan, and Wang (1993), Kambhu, Keane, and Benadon (1996), andMalhotra (1997) discuss the role of derivatives dealers in facilitating the passage of price risk fromend users to other market participants. Dodd (2002) describes various organizational forms alongwhich derivatives dealers provide intermediation services. These include traditional dealer marketswherein bids and offers are quoted (often orally over the telephone or on electronic bulletin boards)with transactions negotiated on a bilateral basis, as well as electronic trading platforms in whichbids and offers are posted and trades are executed against these quotes.

Global Market for OTC Derivatives 41
To these ends we analyze the derivatives holdings of 264 dealersspanning 34 countries over the period 1995–2001. Our analysis uses aunique database obtained from Swaps Monitor Publications, Inc. ThisDatabase of Dealer Outstandings provides what we understand to be themost comprehensive collection of disaggregated holdings information ofOTC derivatives dealers and thus permits identification of specific deal-ers and their derivatives holdings on a longitudinal basis.4 Position infor-mation includes not only total derivative holdings (measured in notionaldollars outstanding), but in most instances “asset group” breakdownsfor interest rate, currency, equity, commodity, and credit derivatives. Formany dealers, further breakdowns within these asset groups are reportedfor specific “product lines” including swaps, forwards, and optioncontracts.
Our investigation begins with a global perspective on the size of thismarket and trends that have occurred in both aggregate holdings andsubgroupings over the 1995–2001 period. We find that the overall OTCderivatives market has grown substantially, having more than doubled insize from our initial 1995 reported numbers. The growth is primarily driv-en by trade in interest rate derivatives, which make up roughly three-fourths of the market. However, despite observing growth in most of theother derivative asset groups, trade in currency derivatives has been rela-tively flat with total positions actually somewhat below peak levels of1997, a pattern we attribute to the consolidation of several currenciesinto the euro. With respect to specific product lines, we find that swapsare overall the most prevalent interest rate derivative. However, forwardcontracts are the leading instrument among the currency derivatives,whereas options lead in the case of both equity and commodityderivatives.
Next, we document the distribution of dealers by country and bygeographic region (e.g., North America, Europe, and Asia/Pacific) andmake comparisons on the basis of the number of active dealers andglobal market share. We find that although the United States is theleading country in terms of both the number of dealers and globalmarket share, there is substantial activity conducted by dealers based inGermany, Japan, Britain, and France. In fact, on a geographic basis, the
4The only other data source known to us that is similar in this regard is The Office of Comptroller ofCurrency’s (OCC) Bank Derivatives Report, which is based on information collected from Reports ofCondition and Income (call reports). The main drawback of OCC data set, however, is that it is lim-ited to banking organizations in the U.S.

42 Emm and Gay
European region has the largest contingent of dealers and marketshare.
Using individual dealer market shares, we compute levels of andshow trends in dealer concentration on both a global level and within theUnited States. On both levels, dealer concentration has grown signifi-cantly over our sample period. For example, the 4- and 20-firm concen-tration ratios for the global population of dealers have risen from 14% to28% and 48% to 67%, respectively. In the United States, the statistics areeven higher, with ratios having risen to 69% and 98%, respectively. Webriefly discuss potential concerns that these statistics may suggestregarding systemic risk in the financial system. We also analyze theextent of global merger activity that has occurred among derivatives deal-ers and discuss various effects on industry structure.
Our final set of analyses focuses on the extent of asset group andproduct line offerings of dealers. Attesting to their market breadth, thenumber of dealers making markets in the various asset groups is largeand is greatest in interest rate and currency derivatives (an average of197 and 201 dealers, respectively). This is followed by equity derivatives(116 dealers), commodity derivatives (66 dealers), and credit derivatives(27 dealers). Across each of the North American, European, andAsian/Pacific regions, comparable percentages of dealers make marketsin interest rate and currency derivatives (more than 90% of dealers ineach region) and equity derivatives (more than 50% participation).However, significant regional differences exist in commodity and creditderivatives, with North American and Asian/Pacific dealers being themost active, and European dealers the least active. Consistent with thesefindings, dealers in the North America and the Asia/Pacific regions offerthe largest array of individual product lines.
The rest of this article is organized as follows: the next section,Database Description, describes the data set on which we base ouranalysis. Aggregate Dealer Holdings provides statistics on the size andtrends of aggregate dealer holdings along with breakdowns for hold-ings in various derivative asset groups and product lines. GeographicComposition and Concentration Levels documents the geographiccomposition of dealer activity along with concentration levels, whileMerger Activity presents our merger analysis. In Extent of AssetGroup and Product Line Participation, we analyze, at the individualdealer level, the extent of participation in each of the various assetgroupings and product lines. The last section provides concludingremarks.

Global Market for OTC Derivatives 43
DATABASE DESCRIPTION
Our study uses the June 2003 edition of the Database of DealerOutstandings, published by Swaps Monitor, Inc.5 Our analysis focuses onall dealers reported in the database disclosing derivatives holdings infor-mation over the 1995–2001 period. This entails 264 dealers spanning 34countries. Swaps Monitor states that their database consists of “all reli-ably accurate data that have been publicly disclosed by all dealers since1994.” Sources used by Swaps Monitor to derive derivatives holdingsinclude “audited financial statements, regulatory filings, reports to share-holders, or other documents subject to similar standards of accuracy.”To be considered a dealer for inclusion in the database, at least one ofthree criteria must be met: The firm is a primary member of theInternational Swaps and Derivatives Association (ISDA) the firm hastotal derivatives for trading purposes of at least $10 billion; or the firmhas commodity or equity derivatives for trading purposes of at least $1billion. All positions are reported in notional U.S. dollar amounts withnon-U.S. dollar holdings converted to dollars at the prevailing exchangerate as of the balance sheet date.6
For reference to the interested reader, we present in Appendix A analphabetic listing of all dealers that appear in the database for the1995–2001 period. For each dealer, we identify their country of originand all years for which position information is reported. In addition, weindicate those years when a dealer ceased reporting because of beingacquired by or merging with another dealer (denoted by M), and in thelast column we identify the acquiring firm. We also note those dealersand years in which Swaps Monitor has indicated that either disclosure
5Swaps Monitor Publications, Inc. is a private company located at 401 Broadway, Suite 610, NewYork, NY 10013; telephone 212-625-9380. Until 1997 the firm published its annual Database ofUsers of Derivatives, which focused on the derivatives holdings of end-users. The firm has since con-tinued to serve as a leading industry vendor of derivatives data focusing primarily on the provision ofquantitative information regarding the activities of derivatives dealers.6A number of entities are now conducting regular surveys of various segments of the OTC deriva-tives markets. Unfortunately, information on individual dealer holdings is not made available assurveyed information is kept on a confidential basis with only aggregated information reported.Among the more comprehensive surveys are those conducted by the International Swaps andDerivatives Association (ISDA), the Bank for International Settlements (BIS), and the BritishBankers’ Association (BBA). Initiated in 1989, the ISDA Market Survey is conducted semiannuallyand covers the holdings of their primary membership. The BIS publishes 2 surveys: The RegularOTC Derivatives Market Statistics, which has been conducted semiannually since June 1998, andThe Triennial Central Bank Survey of Foreign Exchange and Derivatives Market Activity which hasbeen published triennially since 1995. Both surveys are based on information collected by thecentral banks of the G10 countries on major banks and dealers. Finally, the BBA has conductedtheir Credit Derivatives Survey every two years since 1996.

has ceased or is not available (denoted by DC). These omissions occurmainly in 2001 and were caused, in large part, by changes in reportingrequirements. The implementation of Financial Accounting Standard(FAS) 133 and revisions to International Accounting Standard (IAS) 39led many firms to report market or replacement values rather thannotional holdings.7 Finally, we indicate any change in name that a dealermay have experienced.
Swaps Monitor reports dealers’ OTC holdings on three levels. First,for each dealer, information is provided on their total notional outstand-ings for all derivatives positions combined. Second, for most dealers,Swaps Monitor provides breakdowns of total dealer holdings in each offive “asset” groups: interest rate, currency, equity, commodity, and creditderivatives. Third, for about three-fourths of all dealers, further break-downs of these asset group holdings are provided along three productlines: swaps, forwards, and options (with the exception of credit deriva-tives). While acknowledging that our data set does not contain anexhaustive listing and breakdown of all derivatives holdings of all dealers,we still report and discuss our findings as though it captures a reasonablerepresentation of the global OTC dealer market.
AGGREGATE DEALER HOLDINGS
To provide context to our subsequent analysis, we begin by presentingthe reader with an annual summary of global dealer holdings with break-downs for each derivative asset group and, within each group, eachproduct line.8 These annual totals for the period 1995–2001, reported interms of notional dollar holdings, are provided in Table I. Before com-menting on the findings, we note that total dealer holdings will exceedtotal actual outstanding positions resulting from interdealer transac-tions. That is, when a dealer’s counterparty is another dealer, as opposedto an end user, the derivative will show up on the books of both dealers.Although our database does not provide information about counterpar-ties, statistics reported in various editions of the ISDA OperationsBenchmarking Survey indicate that dealers consider 35% to 40% of theircustomers to be professional counterparties (e.g., other dealers). Still,
44 Emm and Gay
7To ascertain the potential magnitude of these 2001 omissions on our 2001 analysis, we computedthe year 2000 aggregate market share of these same dealers. This computed to be 8.9% of the globaltotal of which 6.1% was attributed to two dealers, Goldman Sachs and Morgan Stanley.8As discussed above, because of incomplete disclosure by some dealers, totals for product lines with-in an asset group will not necessarily equal the total reported for that asset group, nor will totalsacross asset groups equal the total reported outstanding.

TA
BL
E I
Glo
bal D
eale
r H
oldi
ngs
of O
TC
Der
ivat
ives
: 199
5–20
01 (
Not
iona
l Am
ount
s in
Mill
ions
of
U.S
. Dol
lars
)
1995
1996
1997
1998
1999
2000
2001
Pane
l (a)
: Agg
rega
te h
oldi
ngs
by a
sset
gro
up a
nd c
orre
spon
ding
pro
duct
line
s
Tota
l Der
ivat
ives
77,5
06,6
0892
,519
,317
110,
058,
173
138,
212,
369
146,
274,
676
161,
470,
977
163,
177,
229
Inte
rest
rat
e de
rivat
ives
40,6
84,0
5453
,696
,915
67,7
36,7
9795
,239
,212
107,
981,
851
121,
292,
657
120,
677,
847
Inte
rest
rat
e sw
aps
23,7
59,4
3232
,774
,316
42,0
23,4
0162
,806
,422
71,9
74,3
2985
,513
,984
89,5
40,1
72In
tere
st r
ate
forw
ards
5,69
1,17
46,
237,
371
7,91
4,90
89,
072,
842
11,1
52,7
159,
989,
006
11,3
36,6
04In
tere
st r
ate
optio
ns5,
943,
583
8,41
1,52
09,
881,
377
14,1
38,8
9315
,016
,579
14,5
01,0
6715
,954
,142
Cur
renc
y de
rivat
ives
26,1
27,6
0530
,964
,206
35,1
40,4
6634
,232
,223
26,2
88,9
8627
,252
,407
28,2
13,5
63C
urre
ncy
swap
s2,
016,
376
2,52
2,18
02,
788,
281
3,40
6,98
53,
842,
552
4,71
4,23
76,
391,
315
Cur
renc
y fo
rwar
ds18
,074
,372
20,4
80,4
3520
,356
,345
20,6
84,2
9215
,840
,683
15,4
68,3
5415
,227
,129
Cur
renc
y op
tions
2,51
0,34
53,
805,
983
5,70
6,03
74,
965,
583
3,16
7,19
93,
320,
318
3,53
3,33
1
Equ
ity d
eriv
ativ
es79
9,75
984
8,86
81,
366,
470
2,42
7,09
42,
655,
399
3,02
9,98
62,
367,
393
Equ
ity s
wap
s39
,682
53,9
7988
,325
119,
095
169,
660
190,
862
274,
759
Equ
ity fo
rwar
ds15
,423
17,7
3335
,992
51,3
7412
0,04
751
,242
56,8
94E
quity
opt
ions
640,
726
656,
335
1,03
0,51
71,
982,
536
2,04
9,30
32,
516,
334
1,89
3,70
2
Com
mod
ity d
eriv
ativ
es45
7,59
655
6,61
954
2,56
972
8,06
21,
082,
630
2,93
3,78
866
3,96
3C
omm
odity
sw
aps
27,6
0641
,617
44,1
3282
,569
95,0
5730
6,88
711
2,85
2C
omm
odity
forw
ards
121,
865
140,
339
141,
496
150,
637
210,
273
111,
785
71,1
50C
omm
odity
opt
ions
91,2
3794
,314
107,
910
158,
988
204,
549
361,
551
188,
664
Cre
dit d
eriv
ativ
es0
17,5
3854
,447
159,
486
314,
749
573,
622
785,
191
Pane
l (b)
: Agg
rega
te p
rodu
ct li
ne h
oldi
ngs
All
swap
s25
,843
,096
35,3
92,0
9244
,944
,139
66,4
15,0
7176
,081
,598
90,7
25,9
7096
,319
,098
All
forw
ards
23,9
02,8
3426
,875
,878
28,4
48,7
4129
,959
,145
27,3
23,7
1825
,620
,387
26,6
91,7
77A
ll op
tions
9,18
5,89
112
,968
,152
16,7
25,8
4121
,246
,000
20,4
37,6
3020
,699
,270
21,5
69,8
39
Not
e.T
he t
able
pre
sent
s ag
greg
ate
posi
tion
hold
ings
of
OT
C d
eriv
ativ
es d
eale
rs. T
otal
hol
ding
s as
wel
l as
brea
kdow
ns f
or v
ario
us a
sset
gro
ups
and
prod
uct
lines
are
pro
vide
d. T
hesa
mpl
e in
clud
es a
ll de
aler
s re
port
ed in
the
Dat
abas
e of
Dea
ler
Out
stan
ding
s pu
blis
hed
by S
wap
s M
onito
r P
ublic
atio
ns, I
nc.

for purposes of our analysis and comments on industry structure, it isimportant to account for all dealer holdings.
As reported in Panel A of Table I, we see that over reported globaldealer holdings grew from $77.5 trillion to over $163 trillion over the1995 through 2001 period. The largest asset group was interest ratederivatives, which, for example, in 2001 exceeded $120 trillion and com-posed about 74% of the global total. Currency derivatives composed thesecond largest group with $28 trillion in dealer holdings as of year-end2001, or 17%. However, the growth in currency derivatives (aside fromcurrency swaps) has not kept pace with that of other groups. To illus-trate, in 1997, dealer holdings of currency derivatives peaked in excess of$35 trillion and were about 32% of the global total at that time. By 1999the total had fallen to $26.2 trillion (18%). One reason for this decline isthe introduction of the euro, which has reduced trading in a number ofderivatives based on the former individual currencies of the variousEuropean Union countries.9 The third largest asset group was equityderivatives, followed by commodity and credit derivatives.
In Panel B we present the cumulative yearly totals for each of thevarious product lines (e.g., swaps, forwards, and options) after summingtheir respective totals in each asset group. Swaps have the largest annualtotals and have been the most rapidly growing product line. In 2001,dealers reported swaps totals of $96.3 trillion, or approximately 60%, ofall dealer holdings. This was followed by forward contracts, withreported holdings of $26.7 trillion, and options, with $21.6 trillion.Although swaps, in general, were the most popular overall product line,there were notable exceptions within the various asset groups. As shownin Panel A, among currency derivatives, forward contracts were consis-tently the most favored product line, and in some years, even currencyoptions had larger totals than currency swaps. Further, in the equity andcommodity groups, option totals typically exceeded both those of theirswap and forward contract counterparts.
GEOGRAPHIC COMPOSITION ANDCONCENTRATION LEVELS
We next inspect the global layout of dealer operations by first lookingat the number of dealers headquartered in each country as well as aggre-gate country-level holdings relative to global totals. We then report global
46 Emm and Gay
9A similar decline was observed during this time frame in the volume of exchange-traded currencyfutures at the Chicago Mercantile Exchange and which also has been attributed to the advent of theeuro. For a discussion, see “Back to the Futures in Chicago,” Business Week Online, July 14, 2003.

and U.S. concentration levels based on holdings of individual dealers.We also note that dealer activity levels are attributed to the home coun-try of the dealer, although many dealers will conduct trades throughoffices in other countries.10
Geographic Distribution and Market Share
Table II provides a look at dealer activity by country (and geographicregion) over the period 1995–2001. The table is presented in threepanels: In Panel A we list the number of dealers in each country byyear;11 in Panel B we report the percentage of global derivatives hold-ings of all dealers in each country by year; and in Panel C we present arank order comparison of country dealer activity using each of the twomeasures.
In reviewing Panel A, we find that the United States leads all coun-tries in terms of having the largest number of dealers with annual totalstypically ranging from the mid- to upper 40s to a peak of 49 dealers in1997 and 1998. Following the United States with the most dealers areGermany and Japan, each having comparable totals (mid-20s). Thesecountries are then followed by Britain and France, which are also bothcomparable in dealer totals (mid- to lower teens).
As shown in the bottom row of Panel A, the total number of dealersin each year has generally been in excess of 200, with a peak number ofdealers occurring in 1997 when 237 dealers reported. By region, Europehas the greatest number of dealers with roughly 50% of the global totaland approximately twice the total number of dealers found in NorthAmerica (i.e., United States and Canada). Although led by Germany,France, and Great Britain, the dominance of the European region interms of numbers of dealers is also a result of several other countries—such as Italy, Switzerland, Belgium, Denmark, and Austria—having a sig-nificant number of dealers.
Within the Asia/Pacific region, Japan has the greatest number ofdealers, followed distantly by Australia and Singapore. Initially surpris-ing to us was the absence of dealers based in Hong Kong. Though weunderstand that a significant amount of derivatives activity takes placein Hong Kong, it appears to be originated through the local-based
Global Market for OTC Derivatives 47
10To illustrate, our referee cites the case of Canadian Imperial Bank of Commerce. While the dealeris based in Toronto, Canada, it conducts many of its trades in London.11As discussed earlier, a number of U.S. and European dealers did not report notional holdings in2001, thus causing 2001 to be an exception in parts of our analysis. We have repeated much of ouranalysis both with and without the 2001 data and obtain, except where otherwise noted, qualitativelysimilar findings.

48 Emm and Gay
TABLE II
Geographic Composition of OTC Derivatives Dealers: 1995–2001
Country 1995 1996 1997 1998 1999 2000 2001
Panel A: Number of dealers by country and geographic region
North AmericaCanada 8 8 8 8 8 7 7US 47 47 49 49 46 41 29
Total 55 55 57 57 54 48 36
EuropeAustria 6 7 6 5 5 3 1Belgium 9 9 9 4 4 5 3Britain 15 16 15 15 14 12 9Czech 0 1 1 1 1 1 0Denmark 4 4 4 7 7 5 4Finland 3 3 3 3 3 3 3France 16 15 15 15 13 12 10Germany 26 28 28 26 25 25 21Greece 1 1 1 2 2 2 0Ireland 2 2 2 2 2 2 1Israel 1 1 1 1 1 1 0Italy 11 11 13 12 8 7 2Netherlands 6 5 5 5 5 4 3Norway 3 3 3 3 3 2 1Poland 0 1 2 2 2 2 1Portugal 4 4 4 5 4 4 1Russia 0 1 0 0 0 0 0Spain 5 5 5 5 4 3 3Sweden 4 4 4 3 3 3 2Switzerland 5 6 7 6 6 6 3
Total 121 127 128 122 112 102 68
Asia/PacificAustralia 6 7 7 7 7 6 6China 1 1 1 0 0 0 0Hong Kong 0 1 0 0 0 0 0Japan 22 24 27 24 24 24 23Korea 1 1 1 1 1 1 0Malaysia 0 0 1 1 1 1 1Singapore 3 4 4 4 4 4 1Thailand 1 1 1 1 1 1 0
Total 34 39 42 38 38 37 31
Other countriesBahrain 2 3 3 3 3 3 3Brazil 1 1 1 1 1 1 0Saudi Arabia 1 2 2 2 2 2 0South Africa 3 4 4 4 6 6 2
Total 7 10 10 10 12 12 5
Grand total 217 231 237 227 216 199 140

Global Market for OTC Derivatives 49
TABLE II
(Continued)
Country 1995 1996 1997 1998 1999 2000 2001
Panel B: Global market share by country and geographic region (in percentage)
North AmericaCanada 3.79 % 3.56 % 3.34 % 2.99 % 2.81 % 2.56 % 3.09 %US 27.80 28.93 32.55 34.30 35.30 37.67 33.13
Total 31.60 32.50 35.89 37.29 38.11 40.23 36.22
EuropeAustria 0.47 0.41 0.53 0.32 0.46 0.16 0.04Belgium 1.51 1.79 1.88 1.46 1.55 1.37 1.62Britain 9.43 9.69 9.06 8.57 4.76 7.98 9.50Czech – 0.00 0.00 0.01 0.01 0.00 –Denmark 1.08 1.27 1.27 1.18 1.13 0.81 0.79Finland 0.51 0.68 0.61 0.39 0.28 0.56 0.48France 13.18 12.07 11.24 10.85 12.15 11.12 11.81Germany 6.52 8.16 9.36 10.21 13.03 12.74 15.66Greece 0.01 0.00 0.00 0.02 0.02 0.02 –Ireland 0.19 0.19 0.18 0.16 0.13 0.11 0.03Israel 0.01 0.01 0.02 0.01 0.02 0.02 –Italy 1.09 1.27 1.36 1.00 1.32 1.20 0.89Netherlands 2.06 2.09 2.22 2.69 3.23 2.96 3.27Norway 0.35 0.44 0.42 0.49 0.34 0.20 0.15Poland – 0.00 0.00 0.00 0.01 0.02 0.02Portugal 0.12 0.12 0.19 0.15 0.10 0.09 0.03Russia – 0.00 – – – – –Spain 0.82 0.85 0.80 0.66 0.79 0.77 1.12Sweden 1.63 1.80 1.54 1.09 0.93 0.72 0.59Switzerland 6.89 7.27 7.07 10.39 6.26 5.56 7.42
Total 45.85 48.11 47.75 49.64 46.50 46.41 53.43
Asia/PacificAustralia 1.28 1.25 1.22 0.87 0.94 0.85 0.95China 0.03 0.03 0.03 – – – –Hong Kong – 0.03 – – – – –Japan 20.79 17.56 14.64 11.80 14.02 12.13 9.10Korea 0.04 0.05 0.08 0.04 0.04 0.02 –Malaysia – – 0.00 0.00 0.00 0.00 0.01Singapore 0.04 0.06 0.05 0.04 0.04 0.08 0.14Thailand 0.02 0.02 0.01 0.01 0.01 0.01 –
Total 22.21 19.01 16.04 12.76 15.04 13.10 10.19
Other countriesBahrain 0.05 0.07 0.04 0.03 0.13 0.03 0.05Brazil 0.02 0.09 0.05 0.03 0.03 0.05 –Saudi Arabia 0.02 0.03 0.02 0.02 0.02 0.01 –South Africa 0.26 0.19 0.22 0.23 0.17 0.16 0.11
Total 0.34 0.38 0.33 0.31 0.34 0.26 0.16
Grand total 100% 100% 100% 100% 100% 100% 100%
Note. The global market share of derivatives holdings for each dealer is calculated based on the dealer’s notional amountoutstanding of its reported total derivatives. A dash, “–”, indicates no reporting dealers, and 0.00 indicates a number lessthan 0.005%.
(Continued)

50 Emm and Gay
TABLE II
Geographic Composition of OTC Derivatives Dealers (Averaged over 1995–2001) (Continued)
Ranking
By number of dealers By market share (%)Difference
Rank Average Rank Average in rankingCountry (1) (2) (3) (4) (1–3)
Panel C: Comparison of country rankings
US 1 44.0 1 32.81 0Germany 2 25.6 4 10.81 �2Japan 3 24.0 2 14.29 1Britain 4 13.7 5 8.43 �1France 4 13.7 3 11.77 1Italy 6 9.1 11 1.16 �5Canada 7 7.7 7 3.16 0Australia 8 6.6 13 1.05 �5Belgium 9 6.1 9 1.60 0Switzerland 10 5.6 6 7.26 4Denmark 11 5.0 12 1.08 �1Austria 12 4.7 16 0.34 �4Netherlands 12 4.7 8 2.65 4Spain 14 4.3 14 0.83 0South Africa 15 4.1 18 0.19 �3Portugal 16 3.7 20 0.11 �4Singapore 17 3.4 21 0.06 �4Sweden 18 3.3 10 1.19 8Finland 19 3.0 15 0.50 4Bahrain 20 2.9 22 0.06 �2Norway 21 2.6 17 0.34 4Ireland 22 1.9 19 0.14 3Saudi Arabia 23 1.6 27 0.02 �4Poland 24 1.4 31 0.01 �7Greece 25 1.3 30 0.01 �5Israel 26 0.9 28 0.01 �2Korea 26 0.9 24 0.04 2Thailand 26 0.9 29 0.01 �3Brazil 26 0.9 23 0.04 3Czech 30 0.7 32 0.00 �2Malaysia 30 0.7 33 0.00 �3China 32 0.4 25 0.03 7Russia 33 0.1 34 0.00 �1Hong Kong 33 0.1 26 0.03 7
Note. This panel presents a rank order comparison of two measures: the average annual number of dealers and theiraverage annual global market share based on statistics reported in Panels A and B, respectively. Both measures are calcu-lated for each country over the 1995–2001 period. A positive (negative) difference in rankings indicates the degree ofimprovement (lowering) of a country’s ranking on the basis of market share relative to its ranking by number of dealers.

Global Market for OTC Derivatives 51
operations and subsidiaries of a number of U.S. and European-baseddealers, such as HSBC (originally the Hong Kong and ShanghaiBanking Corporation), Standard Chartered, JPMorganChase andDeutsche Bank (see, e.g., Farooqi, 2002). “Other” countries, whichinclude Bahrain, Brazil, Saudi Arabia, and South Africa, have a smallcontingent of dealers.
In Panel B of Table II we report for each country and year thecumulative notional holdings of all dealer positions expressed as a per-centage of the global total. Because position information is reported inthe database on a consolidated basis, we attribute the entirety of adealer’s positions to its home country, though we recognize that dealersmay engage in significant cross-border activity. Loosely speaking, we seethat dealer activity measured on the basis of market share appears some-what consistent with that using simple number of dealer totals. One dif-ference is that U.S. dealer activity becomes relatively larger. That is, theUnited States has only about one-fifth of the global number of dealers,but those dealers conduct more than one-third of the business. Usingthe year 2000 as a basis for reference, the United States is shown to haveapproximately 38% market share of the global total. Other leading coun-tries include Germany (13%) followed by Japan (12%), France (11%),Britain (8%) and Switzerland (6%). Together, these six countries accountfor roughly 88% of the global total.
By geographic region, in year 2000 Europe accounted for the largestmarket share with 46%, followed by North America with 40%, and theAsia/Pacific region with 13%. Looking at trends over our sample period,the market shares of North America and Europe have been somewhatstable with slight increases. The North American increase is driven bythe United States and, within Europe, largely by Germany. Further,these increases coincide with a decline in the market share held byJapanese dealers, which has shown a continual drop from a peak of 21%in 1995 to a 9% share in 2001. Japan’s 21% share in 1995 placed it sec-ond in the world, behind only the 28% share of U.S. dealers.
In Panel C we provide additional perspective as to the relative num-ber of dealers and global market share of each country by comparingeach of the two ranking measures. Using data from Panels A and B, wefirst calculate the average annual number of dealers and the averageannual market share for the period 1995–2001 and then report the rankordering based on each of these two measures. In the last column wecompute the difference in rankings under the two measures. A positive(negative) difference in rankings indicates the degree of improvement

52 Emm and Gay
(lowering) of a country’s ranking on the basis of market share relative toits ranking by number of dealers.
The same five countries rank in the top 5 under both measures,though Germany notably fell two spots under the market share measurerelative to the number of dealers measure. For other countries ranked inthe top 20, countries whose rankings by market share fell significantlybelow their rankings by numbers of dealers include Italy and Australia(�5 each), Austria, Portugal and Singapore (�4 each) and South Africa(�3). Countries showing sizeable positive increases in relative rankingsusing market share include Sweden (�8), Switzerland, Netherlands,Finland, and Norway (�4 each).
Global and U.S. Dealer Concentration Levels
Using our global market share percentages computed at the individualdealer level, we next estimate for each year the N-dealer concentrationratios. We repeat these calculations after restricting our sample to U.S.dealers and U.S. market totals. These statistics for years 1995 and 2000are presented graphically in Figure 1.12
As we observe in Figure 1, for both samples the levels of concen-trations have grown significantly over the years as indicated by theupward shift in the two sets of curves. To illustrate, for the global sam-ple of dealers (see the GL’95 and GL’00 curves) in 1995 the four-firmratio was 14%, the eight-firm ratio was 23%, and the 20-firm ratio was48%. In 2000 these percentages had grown to 28%, 42%, and 67%,respectively. For U.S. dealers, concentration levels (see US’95 andUS’00) are significantly higher than those measured on a global basisand have also increased over time. In 1995 the four-firm U.S. concen-tration ratio was 45%, the eight-firm ratio was 70%, and the 20-firmratio was 98%. By 2000 these had grown to 69%, 89%, and 98%,respectively.
In Table III we provide information regarding the leading dealersunderlying each pair of concentration curves illustrated in Figure 1. InPanel A we list the 10 leading dealers on a global basis along with theirrelative market shares for years 1995 and 2000.13 Similarly, Panel B liststhe 10 leading U.S. dealers in 1995 and 2000 and their U.S. market
12The results for all other years are available upon request. Also, we present results for the year 2000instead of 2001 because of the absence of holdings data in 2001 of two large dealers (GoldmanSachs and Morgan Stanley) as discussed earlier in footnote 7.13Smithson (1995, 1996) reports ranking information of leading OTC dealers for the earlier periodof 1992–1994.

Global Market for OTC Derivatives 53
shares. Comparing the 2000 rankings with those in 1995, we see largechanges reflecting, in part, several incidences of industry consolidation.The most significant of these involved Chase Manhattan Bank. In 1995Chase Manhattan had a global ranking of 21st and market share of 1.68%.Following its subsequent mergers and takeovers involving Chemical Bank,Robert Fleming (U.K.) and J.P. Morgan, JPMorganChase had become bythe year 2000 the global leader with a 13.9% global market share and36.9% U.S. market share. We explore dealer merger activity in greaterdetail in the next section.
Although the concentration numbers just presented appear high,we present them solely as another indicator of industry structure. Weacknowledge that a number of concerns have been expressed by policymakers and market observers with respect to the growth and size of thederivatives market and level of concentration therein. Many of thesehave centered on systemic risk concerns, that is, the risk that a defaultby a major dealer could cause a domino effect, affecting not only thewell-being of immediate counterparties, but spreading and ultimately
FIGURE 1 Global and U.S. dealer concentration ratios: 1995 versus 2000.
Note. The figure shows N-dealer concentration ratios for the global and U.S. samples of OTCderivatives dealers, using corresponding market share percentages computed at the individualdealer level. The concentration ratios are presented for years 1995 and 2000. The global-marketsample contains 217 dealers in 1995 and 199 in 2000. The U.S.-market sample contains 47 deal-ers in 1995 and 41 in 2000. All statistics are shown for the first 20-firm concentration ratios.GL ’95 and GL ’00 refer to the 1995 and 2000 global concentration ratios, respectively; whileUS ’95 and US ’00 refer to the 1995 and 2000 U.S. concentration ratios, respectively.
0%
10%
20%
30%
40%
50%
60%
70%
80%
90%
100%
0 1 2 3 4 5 6 7 8 9 10 11 12 13 14 15 16 17 18 19 20
N-dealer concentration ratio
Cum
ulat
ive
mar
ket s
hare
GL '95 GL '00 US '95 US '00

54 Emm and Gay
threatening the entire financial system.14 However, we note the numberof safeguards in place to help prevent such occurrences including regu-latory initiatives, such as bank examinations and capital adequacy stan-dards. More important, the dealer community has been proactive inmaking important advances with the development and use of masteragreements, bilateral netting agreements, collateral arrangements, andother risk-mitigation arrangements. For further discussion of thesemarket-based mechanisms for addressing counterparty risk, see, forexample, the Group of Thirty (1993), Gay and Medero (1996), and
TABLE III
Leading Global and U.S. Dealers: 1995 versus 2000
1995 2000
Market MarketRanking Dealer share (%) Ranking Dealer share (%)
Panel A: Global dealer rankings based on global market share
1 Chemical (US) 3.97 1 JP Morgan Chase (US) 13.902 JP Morgan (US) 3.81 2 Deutsche Bank (Germany) 5.613 Societe Generale (France) 3.02 3 Citigroup (US) 4.654 Citicorp (US) 2.76 4 Bank of America (US) 3.875 Fuji Bank (Japan) 2.47 5 BNP Paribas (France) 3.756 Credit Suisse (Switzerland) 2.44 6 Goldman Sachs (US) 3.707 NatWest Bank (Britain) 2.42 7 Royal Bank of Scotland 3.478 Credit Lyonnais (France) 2.38 (Britain)9 Swiss Bank Corporation 2.36 8 Fuji Bank (Japan) 3.19
(Switzerland) 9 UBS (Switzerland) 2.9610 Industrial Bank of Japan 2.36 10 Societe Generale (France) 2.88
(Japan)
Panel B: U.S. dealer rankings based on U.S. market share
1 Chemical 14.29 1 JP Morgan Chase 36.902 JP Morgan 13.71 2 Citigroup 12.353 Citicorp 9.93 3 Bank of America 10.274 Bankers Trust 7.03 4 Goldman Sachs 9.825 Merrill Lynch 6.45 5 Morgan Stanley 6.406 BankAmerica 6.43 6 Merrill Lynch 6.197 Goldman Sachs 6.19 7 Lehman Brothers 5.628 Chase Manhattan 6.04 8 American International 1.819 Lehman Brothers 5.61 Group
10 Salomon 4.75 9 Berkshire Hathaway 1.46(General Re)
10 Bank One Corporation 1.29
14See Hentschel and Smith (1995) for an analysis of why systemic risk concerns attributable toderivatives have been overstated.

Global Market for OTC Derivatives 55
Weinstein (2003). Also, Bomfim (2002) finds empirical evidence thatnetting agreements and other credit enhancement mechanisms used inswaps markets have been successful in mitigating counterparty creditrisk during periods of market turmoil.
MERGER ACTIVITY
We next investigate the extent and implications of merger activity amongdealers (see Appendix A for information on dealers that experienced merg-ers). During the 1995–2001 time period, we identify a total of 54 mergersamong dealers. A breakdown of the level of yearly merger activity is pro-vided in the first row of Table IV. The years 1997 and 1999 had the highestoccurrence of mergers with 14 and 15 mergers, respectively.
We alternatively measure the magnitude of merger activity by com-puting separately the cumulative premerger market shares of both targetand acquiring firms. That is, for each year, we sum the market shares oftarget firms and also that of the acquirers. These statistics are reportedin the second and third rows, respectively, of Table IV. For target firms,with the exception of 1996 and 2001, merger activity in each year wascomparable in magnitude with the cumulative premerger market sharein the 5%–6% range. For acquirers, 2000 and 1998 were particularlyactive years, with acquirers having premerger market shares of 16.9%and 9.4%, respectively.
The year 2000 results are driven largely by the completion onDecember 31, 2000. of the merger between JPMorgan and Chase
TABLE IV
Dealer Merger Activity: 1995–2001
1995 1996 1997 1998 1999 2000 2001
Number of mergers (54 in total) 5 2 14 8 15 9 1
Target firms 6.66% 0.08% 4.75% 5.68% 6.52% 5.81% 0.02%
Acquiring firms 4.64% 3.11% 6.71% 9.42% 7.93% 16.86% 0.49%
Total 11.30% 3.19% 11.46% 15.10% 14.45% 22.67% 0.52%
Note. The table presents the annual number of mergers and the corresponding cumulative pre-merger market shares ofthe acquiring and target firms. The sample is comprised of 54 dealer mergers during the period 1995–2001 as reported inthe Database of Dealer Outstandings published by Swaps Monitor Publications, Inc.
Cum
ulat
ive
prem
erge
rm
arke
t sha
re

56 Emm and Gay
Manhattan. This was by far the largest merger among derivatives deal-ers to date and served to solidify Chase’s position as the largest deriva-tives dealer in the world. To illustrate, in 1999 Chase Manhattan heldthe top position with 8.1% of the global dealer market share, while JPMorgan ranked third with 5.4%. In addition to having the highest globalmarket share based on all holdings, Chase also ranked first in interestrate derivatives, third in currency derivatives, twelfth in equity deriva-tives, fourth in commodity derivatives, and third in credit derivatives.Following the merger, JPMorganChase’s global share rose to 13.9%and it ranked first in interest rate, currency, and credit derivatives; sec-ond in equity derivatives; and seventh in commodity derivatives.
In Table V we report on the nature of the merger activity on a geo-graphic basis (i.e., U.S., European, and other). We first note that mostmerger activity has occurred among European dealers. This entailed 35of the 54 total mergers followed by nine mergers among U.S. dealers.Second, we observe only a few mergers that did not involve either U.S.or European firms (see “other”), because U.S. and European dealerswere involved in all but 3 of the 54 mergers. Third, the number of inter-regional mergers of dealers was relatively few. There were fourinstances of European acquirers taking over U.S. firms, but only twoinstances of a U.S. dealer acquiring a European target. The most sig-nificant case of the former was the Deutsche Bank acquisition ofBankers Trust in 1999. These two dealers had premarket shares of 3.4%and 1.7%, which corresponded to global rankings of fifth and eigh-teenth, respectively.
TABLE V
Geographic Breakdown of Dealer Mergers: 1995–2001
Acquirer
US European Other Total
US 9 4 0 13
European 2 35a 1b 38
Other 0 0 3c 3
Total 11 39 4 54
Note. The table provides a locational breakdown of acquirers and targets involved in 54 dealer mergers over the period1995–2001 as reported in the Database of Dealer Outstandings published by Swaps Monitor Publications, Inc.aEuropean mergers were intercountry and 26 were intracountry. Out of nine intercountry mergers, three mergers involved anon-European Union acquirer that was the same Finnish dealer.bThis was a merger between Bahraini and British derivatives dealers.cTwo mergers were between Japanese derivatives dealers and one was between Australian dealers.
Targ
et

Global Market for OTC Derivatives 57
We next investigate the extent to which merger activity had an effecton the subsequent product line offerings of the merged entity. For eachmerger we computed four statistics regarding the subsequent number ofproduct line offerings of the merged entity measured one year (or imme-diately thereafter) following the merger. These include (1) the number ofproduct lines that had been offered by the target that were subsequentlydropped by the acquirer (lines dropped), (2) the number of productlines that had been offered by the acquirer and were exited (lines exited),(3) the number of new products lines offered by the merged entity thathad not been formerly offered by the acquirer but were offered by the tar-get (lines added), and (4) the number of new product lines that had notbeen formerly offered by either the target or acquirer (lines blossomed).
We find that for product lines dropped, of the 54 mergers there wasone line dropped in five cases, and two lines dropped in two cases. In theremaining 47 mergers, there were no lines dropped. For product linesexited, three acquirers exited one of their existing product lines, whileone acquirer exited two product lines. For product lines added, there wasone addition in four mergers, and two additions in two mergers. Finally,for product lines blossomed, in nine instances there was an increase ofone new product line, and in one instance the merger was followed bythe addition of two new product lines. Thus, in sum, it appears thatneither the offering of new product lines nor savings from reducing prod-uct lines appear to be a primary motive for or a consequence of themajority of the mergers.
EXTENT OF ASSET GROUP AND PRODUCTLINE PARTICIPATION
In this section we further analyze the extent of dealer participation ineach of the various (1) asset groupings, and (2) product lines. As men-tioned earlier, Swaps Monitor reports breakdowns of dealer holdings infive asset groups: interest rate, currency, equity, commodity, and creditderivatives. Also when available, further breakdowns within each assetgroup (with the exception of credit derivatives) are also provided alongthree product lines: swaps, forwards, and options.
Asset Group Analysis
We compute and report in Table VI the average annual number of deal-ers reporting positions for each asset group over the 1995–2001 period.This is done for both the global universe of dealers as well as for each
58 Emm and Gay
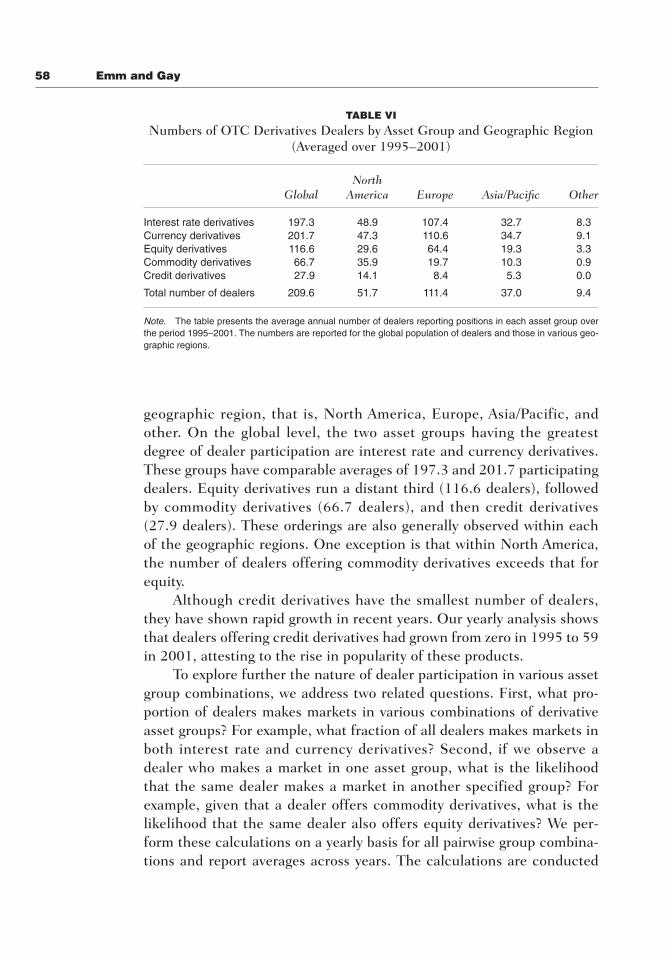
geographic region, that is, North America, Europe, Asia/Pacific, andother. On the global level, the two asset groups having the greatestdegree of dealer participation are interest rate and currency derivatives.These groups have comparable averages of 197.3 and 201.7 participatingdealers. Equity derivatives run a distant third (116.6 dealers), followedby commodity derivatives (66.7 dealers), and then credit derivatives(27.9 dealers). These orderings are also generally observed within eachof the geographic regions. One exception is that within North America,the number of dealers offering commodity derivatives exceeds that forequity.
Although credit derivatives have the smallest number of dealers,they have shown rapid growth in recent years. Our yearly analysis showsthat dealers offering credit derivatives had grown from zero in 1995 to 59in 2001, attesting to the rise in popularity of these products.
To explore further the nature of dealer participation in various assetgroup combinations, we address two related questions. First, what pro-portion of dealers makes markets in various combinations of derivativeasset groups? For example, what fraction of all dealers makes markets inboth interest rate and currency derivatives? Second, if we observe adealer who makes a market in one asset group, what is the likelihoodthat the same dealer makes a market in another specified group? Forexample, given that a dealer offers commodity derivatives, what is thelikelihood that the same dealer also offers equity derivatives? We per-form these calculations on a yearly basis for all pairwise group combina-tions and report averages across years. The calculations are conducted
TABLE VI
Numbers of OTC Derivatives Dealers by Asset Group and Geographic Region (Averaged over 1995–2001)
NorthGlobal America Europe Asia/Pacific Other
Interest rate derivatives 197.3 48.9 107.4 32.7 8.3Currency derivatives 201.7 47.3 110.6 34.7 9.1Equity derivatives 116.6 29.6 64.4 19.3 3.3Commodity derivatives 66.7 35.9 19.7 10.3 0.9Credit derivatives 27.9 14.1 8.4 5.3 0.0
Total number of dealers 209.6 51.7 111.4 37.0 9.4
Note. The table presents the average annual number of dealers reporting positions in each asset group overthe period 1995–2001. The numbers are reported for the global population of dealers and those in various geo-graphic regions.

Global Market for OTC Derivatives 59
TABLE VII
Derivatives Dealers Offerings: Pair-wise Product Proportions (Averaged over 1995–2001)
Asset group Interest rate Currency Equity Commodity Credit
Panel A: Global
Interest rate 94.14Currency 92.64 96.25Equity 55.42 55.01 55.62Commodity 31.42 31.02 25.02 31.83Credit 13.22 13.09 12.61 9.34 13.29
Panel B: North America
Interest rate 94.48Currency 89.23 91.44Equity 57.18 55.52 57.18Commodity 68.51 66.85 49.17 69.34Credit 27.07 26.52 26.24 26.24 27.35
Panel C: Europe
Interest rate 96.41Currency 96.41 99.23Equity 57.82 57.82 57.82Commodity 17.69 17.69 14.74 17.69Credit 7.56 7.56 7.31 1.67 7.56
Panel D: Asia/Pacific
Interest rate 88.42Currency 87.26 93.82Equity 50.97 50.97 52.12Commodity 26.64 26.64 26.25 27.80Credit 14.29 14.29 12.74 11.20 14.29
Panel E: Other
Interest rate 87.88Currency 87.88 96.97Equity 34.85 34.85 34.85Commodity 9.09 9.09 9.09 9.09Credit 0.00 0.00 0.00 0.00 0.00
Note. The table presents the average fraction of dealers who make markets in various pair-wise derivative asset groupcombinations over the 1995–2001 period. The panels are constructed using the global sample of dealers and those in eachof the geographic regions.
using the global population of dealers and separately for each geographicregion. The results for both questions are presented in Tables VII andVIII, respectively.
In Panel A of Table VII, for the global set of dealers, we see that92.6% of all dealers offered both interest rate and currency derivatives,

60 Emm and Gay
which is by far the highest reported pairwise combination. (Note thatnumbers along the diagonal simply represent the fraction of dealersoffering derivatives in one specific asset group.) More than one-half ofall dealers (55%) made markets in both interest rate and equity deriva-tives as well as in both currency and equity derivatives. Approximately31% offered both commodity and interest rate derivatives as well as com-modity and currency derivatives, whereas only 25% of dealers offeredboth equity and commodity products.
Across each of the geographic regions (Panels B–E), we see a fairlyhigh percentage of dealers offering both interest rate and currencyderivatives. These products appear to be staple offerings of most dealersanywhere. Comparable fractions of dealers (more than 50%) in
TABLE VIII
Derivatives Dealers Offerings: Conditional Product Proportions(Averaged over 1995–2001)
Asset groupNorth
Conditioned Paired Global America Europe Asia/Pacific Other
Interest rate Currency 98.41 94.35 100.00 98.45 100.00Equity 59.34 60.41 60.59 53.03 41.96Commodity 34.08 72.35 18.51 29.42 12.63Credit 15.72 30.42 9.66 16.39 0.00
Currency Interest rate 96.29 97.33 97.37 92.20 90.48Equity 57.79 60.58 59.07 52.43 37.30Commodity 32.96 72.73 18.04 28.83 10.71Credit 15.41 30.80 9.56 16.08 0.00
Equity Interest rate 99.62 100.00 100.00 84.10 85.71Currency 98.90 97.25 100.00 84.10 85.71Commodity 45.72 86.93 25.54 36.49 24.29Credit 22.94 49.27 14.21 18.01 0.00
Commodity Interest rate 98.79 98.53 100.00 97.94 57.14Currency 97.57 96.01 100.00 97.94 57.14Equity 78.64 71.50 83.17 70.16 57.14Credit 28.65 39.60 11.39 19.15 0.00
Credit Interest rate 85.47 84.92 57.14 71.43 –Currency 84.77 83.33 57.14 71.43 –Equity 82.00 82.53 55.09 39.25 –Commodity 66.91 82.53 10.04 35.15 –
Note. The table reports the average fraction of dealers who, given that they make markets in one asset group, also makea market in a second asset group. These proportions are averaged over the 1995–2001 period for the global sample ofdealers and those in each geographic region.

Global Market for OTC Derivatives 61
North America, Europe, and Asia/Pacific are also offering combinationsof equity and interest rate as well as equity and currency derivatives.Notable differences between regions emerge in the areas of commodityand credit derivatives. For example, about two-thirds of North Americandealers offered both commodity and interest rate derivatives and com-modity and currency derivatives. However, only one-fourth (27%) ofAsia/Pacific dealers offered these combinations as did only one-sixth(18%) of European dealers. About one-fourth of North American dealersoffered credit derivatives in combination with other derivative groups.These fractions fall to about 14% for Asia/Pacific dealers and to only 7%for European dealers. In the region labeled other, although a reasonableamount of equity derivative activity was observed, dealers otherwise pri-marily offered only interest rate and currency derivatives.
In Table VIII we report on the fraction of dealers who, given thatthey make markets in one asset group, also make a market in a secondgroup. These percentages are again reported for dealers composing ourglobal population as well as those in each geographic region. Our overallfindings are consistent with those in our discussion of Table VII, but wewould add a few comments. First, it appears that if a dealer is observedto offer equity derivatives, there is a very high probability that the dealeralso offers interest rate and currency derivatives. Second, if a dealeroffers commodity derivatives, there is a high probability that the samedealer also offers interest rate, currency, and equity derivatives. Third, asomewhat similar result is also found with respect to credit derivatives inNorth America. We further explore the various arrays of products offeredby dealers in the following section.
Product Lines Analysis
For each year we identify those dealers who provided a complete disclo-sure of their level of participation in swaps, forwards, and options in allasset groups. For each dealer disclosing such information, we then tallythe number of individual product lines that the dealer reported posi-tions in. For example, a dealer making markets in interest rate swaps,forwards, and options (three product lines), currency swaps and for-wards (two product lines), and commodity options (one product line)would be said to make markets in a total of six product lines. The maxi-mum number of product lines for years 1996–2001 would be 13: threeeach for interest rate, currency, equity, and commodity derivatives, andone for credit derivatives for which no further breakdowns are provided.

62 Emm and Gay
In 1995, prior to the advent of credit derivatives, the maximum numberof product lines would be 12. We are able to make these determinationsfor approximately 75% of all dealers in each year and thus can drawinsights into the array of dealer offerings at the individual product leveland structural differences in such offerings over time and acrossregions.
In Panel A of Table IX we report the annual means and standarddeviations of the number of derivative product lines for our global sampleand each regional set of dealers. As shown in the first row, dealer productlines for the global sample have steadily increased from an average of6.7 in 1995 to 8.6 in 2001, an increase of 1.9 product lines. Within
TABLE IX
Trends in Product Line Offerings of Dealers by Geographic Region: 1995–2001
1995 1996 1997 1998 1999 2000 2001
Panel A: Average number of product lines offered by year (standard deviation in parentheses)
Global 6.7 6.7 7.3 7.4 7.8 7.9 8.6(3.2) (3.1) (3.1) (3.1) (3.3) (3.4) (3.6)
Number of observations 157 174 186 180 168 151 108
North America 9.3 9.3 9.9 9.7 9.3 9.0 10.1(3.7) (3.7) (4.2) (4.2) (4.3) (4.5) (4.0)
Europe 6.5 6.6 6.7 6.6 7.0 7.1 7.2(2.2) (2.2) (2.1) (2.2) (2.3) (2.3) (2.2)
Asia/Pacific 3.8 4.1 7.0 7.8 8.9 9.8 10.8(2.0) (2.1) (2.6) (2.2) (3.4) (3.6) (3.7)
Other 3.0 4.8 3.2 4.4 3.9 4.0 2.7(1.0) (3.1) (3.0) (3.6) (1.8) (2.3) (2.1)
Panel B: Number of dealers offering the full array of all product lines
Global 25 2 22 21 23 25 31
North America 24 2 22 21 18 16 15Europe 1 0 0 0 1 0 0Asia/Pacific 0 0 0 0 4 9 16Other 0 0 0 0 0 0 0
Note. The table reports in Panel A the average number of product lines offered by dealers globally and in each geographicregion and, in Panel B, the number of dealers offering the full array of all 13 product lines (12 in 1995 prior to the advent ofcredit derivatives). For computing the number of product line offerings, the total sample of dealers available from the SwapsMonitor Database of Dealer Outstandings was restricted to dealers who provided complete disclosure of their level of par-ticipation in swaps, forwards and options in each asset group.

Global Market for OTC Derivatives 63
regions, dealers in North America and, in later periods, the Asia/Pacificregion typically offer the most products. In North America product offer-ings have expanded slightly from an average of 9.3 per dealer in 1995 to10.1 in 2001. The offerings of Asian/Pacific dealers have grown remark-ably, rising from 3.8 product lines in 1995 to 10.8 in 2001. Europeandealers have shown only a slight growth, from 6.5 product lines in 1995to 7.2 in 2001.
In Panel B of Table IX we tabulate the number of dealers in eachyear who offered the full array of all 13 product lines. Until recently,these dealers have been primarily North American (specifically, U.S.dealers). However, Japanese dealers are now making significant advancesin this respect. To illustrate, in 2001 we find 31 dealers who offered thefull array of all 13 product lines, including 16 Japanese dealers and 15from the United States. No other country had a dealer offering the fullarray of product lines. By comparison, in 1995 there were a global totalof 25 dealers who offered all 12 products then available (prior to theintroduction of credit derivatives). Of these 25 dealers, 24 were from theUnited States, and the only other was from Austria. Japan had no dealersoffering all 12 products, although there were five Japanese dealers offer-ing 11 products at the time.
To further identify the source of the changes in the number of prod-uct line offerings between 1995 and 2001, we next compute and com-pare the fraction of dealers that offered each individual product line ineach of these two years. These are reported in Table X both for the globalsample and each of the three primary geographic regions. To help illus-trate how to interpret this table, consider first the results for the globalsample of dealers. In 1995 for the asset group “Interest RateDerivatives,” 0.89, or 89%, of all dealers offered interest rate swaps (S),75% offered interest rate forwards, and 82% offered interest rate options(O). Summing these three fractions gives 2.46, which can be interpretedas the average number of interest rate product lines offered by dealers in1995. Comparing these numbers to those in 2001, we see that the per-centage of dealers offering interest rate swaps increased to 95%, anincrease of 6% over 1995. This increase of 6% can also be interpreted ascontributing 0.06 to the cumulative overall increase in average productlines offered of 1.94 (see last column), a relatively small proportion. Forall interest rate derivatives (swaps, forwards, and options combined), thechange totaled 0.29, again a small component. For the entire globalsample, the asset group providing the largest contribution to the 1.94overall product line increase was equity derivatives (0.54) followed by

TA
BL
E X
Cha
nges
in D
eale
r P
rodu
ct L
ine
Off
erin
gs: 1
995
vers
us 2
001
Inte
rest
rat
e de
riva
tive
sC
urre
ncy
deri
vati
ves
Equ
ity
deri
vati
ves
Com
mod
ity
deri
vati
ves
Cre
dit
Cum
ulat
ive
Year
SF
OTo
tal
SF
OTo
tal
SF
OTo
tal
SF
OTo
tal
deri
vati
ves
tota
l
Pane
l A: B
reak
dow
n of
the
num
ber
of o
ffer
ings
by
prod
uct
line
and
ass
et g
roup
Glo
bal
1995
0.89
0.75
0.82
2.46
0.80
0.89
0.82
2.51
0.30
0.34
0.43
1.07
0.18
0.22
0.24
0.64
0.00
6.68
2001
0.95
0.87
0.93
2.75
0.89
0.89
0.89
2.67
0.45
0.49
0.67
1.61
0.33
0.37
0.41
1.11
0.48
8.62
Ch
ang
e0.
060.
120.
110.
290.
090.
000.
070.
160.
150.
150.
240.
540.
150.
150.
170.
470.
481.
94
No
rth
1995
0.92
0.87
0.92
2.72
0.85
0.92
0.90
2.67
0.69
0.64
0.72
2.05
0.62
0.64
0.62
1.87
0.00
9.31
Am
eric
a20
010.
960.
920.
922.
800.
960.
920.
922.
800.
640.
640.
641.
920.
640.
640.
681.
960.
6410
.12
Ch
ang
e0.
040.
050.
000.
080.
110.
000.
020.
13�
0.05
0.00
�0.
08�
0.13
0.02
0.00
0.06
0.09
0.64
0.81
Eu
rop
e19
950.
950.
860.
842.
650.
830.
860.
852.
540.
240.
310.
430.
980.
060.
100.
160.
320.
006.
4920
010.
960.
850.
962.
780.
870.
870.
872.
610.
240.
330.
651.
220.
020.
090.
150.
260.
337.
20
Ch
ang
e0.
01�
0.01
0.12
0.13
0.04
0.01
0.02
0.07
0.00
0.02
0.22
0.24
�0.
04�
0.01
�0.
01�
0.06
0.33
0.71
Asi
a/19
950.
690.
230.
611.
530.
650.
960.
612.
230.
000.
000.
000.
000.
000.
000.
000.
000.
003.
76P
acifi
c20
010.
960.
920.
922.
800.
960.
960.
922.
850.
770.
730.
772.
270.
730.
730.
732.
190.
6910
.80
Ch
ang
e0.
270.
690.
311.
270.
310.
000.
310.
620.
770.
730.
772.
270.
730.
730.
732.
190.
697.
04
Not
e.F
or e
ach
deriv
ativ
es a
sset
gro
up,
we
repo
rt t
he p
ropo
rtio
n of
all
deal
ers
repo
rtin
g po
sitio
ns in
eac
h sp
ecifi
ed p
rodu
ct li
ne.
In a
dditi
on,
with
in e
ach
of t
he fi
ve a
sset
gro
ups,
we
pres
ent t
he a
vera
ge to
tal n
umbe
r of
pro
duct
line
s of
fere
d by
dea
lers
. The
last
col
umn
repo
rts
the
aver
age
cum
ulat
ive
tota
l of p
rodu
ct li
nes
offe
red
per
deal
er. I
n th
e ta
ble,
“S
” st
ands
for
swap
s, “
F”
stan
ds fo
r fo
rwar
ds, a
nd “
O”
stan
ds fo
r op
tions
. Our
sam
ple
cons
ists
of 1
57 d
eale
rs in
199
5 an
d 10
8 in
200
1.

Global Market for OTC Derivatives 65
credit derivatives (0.48) and commodity derivatives (0.47). Currencyderivatives provided the smallest incremental change, as dealers showedan average increase of only 0.16 product lines.
For North American dealers, apart from the offering of credit deriv-atives, there was little expansion in the number of other offerings. Of the0.81 overall increase in average product lines offered, 0.64 can be attrib-uted to credit derivatives. For European dealers, the overall increase was0.71 primarily a consequence of credit derivatives (0.33) and equityoptions (0.22). Asia/Pacific dealers showed by far the greatest overallincrease. Significant increases occurred in all asset groups and individ-ual product lines (with the exception of currency forwards). A most sig-nificant development among Asian/Pacific dealers related to completeabsence in 1995 of the offering of either equity or commodity deriva-tives. However, by 2001, approximately 75% of dealers in this regionwere offering a full array of equity and commodity derivatives.
CONCLUSION
An extensive literature has emerged that offers theoretical rationales forcorporate hedging as well as attempts to provide empirical validationthrough inspection of firms’ derivatives usage. We complement this liter-ature by focusing on an important supplier of such hedging services, theOTC derivatives dealer. Our analysis is facilitated by a unique longitu-dinal database, which allows us to inspect and track individual dealerpositions. Specifically, we analyze the structure of the OTC derivativesmarket during the 1995–2001 period with respect to dealer holdings andmarket share, geographic differentials, merger activity, and the mix ofproduct offerings.
The market for OTC derivatives, which had its fledgling beginningsin the early 1980s, has grown into a truly global market. This growth wasevidenced by global dealer holdings having more than doubled duringthe 1995–2001 period of our investigation, a development, we believe,that can be attributed to a regulatory framework that has focused largelyon self-regulation and market discipline and that in turn has played avital part in promoting financial innovation.
We observe that the growth in dealer holdings has primarilyoccurred in interest rate derivatives that now consist of approximatelythree-fourths of the OTC market. With respect to specific product lineswithin the various derivative asset groups, we find that swaps are themost prevalent interest derivative, while forward contracts lead amongcurrency derivatives, and options lead in the case of both equity and

66 Emm and Gay
commodity derivatives. On a geographic basis, the United States is theleading country in terms of both the number of dealers and global mar-ket share. Among regions, however, Europe has the largest contingent ofdealers and market share, led by dealers in Germany, Britain, andFrance. As a result of merger activity and other factors, dealer concen-tration levels rose significantly over our sample period. To illustrate, thefour- and 20-firm concentration ratios for the global population of deal-ers rose from 14% to 28% and 48– to 67%, respectively, and were evenhigher in the %.
We find that the breadth of asset group and product line offerings ofdealers is large and growing. Globally, the number of dealers making mar-kets in interest rate and currency derivatives averaged 197 and 201 deal-ers, respectively. This was followed by equity derivatives (116 dealers),commodity derivatives (66 dealers), and credit derivatives (27 dealers).Across each of the North American, European, and Asian/Pacific regions,comparable percentages of dealers make markets in interest rate and cur-rency derivatives (more than 90% of dealers) and equity derivatives (morethan 50% participation). However, significant regional differences existin commodity and credit derivatives, with North American andAsian/Pacific dealers being the most active, and European dealers theleast active. Consistent with these findings, dealers in the North Americaand the Asia/Pacific regions offer the largest array of individual productlines.
We conclude by noting that studies such as this should provide addi-tional guidance, and to some extent restraint, to policy makers and othermarket observers who have expressed concerns over the growing size ofthis market. Certainly, additional analysis regarding levels of creditexposure and replacement values of positions held by dealers are logicalextensions of the work presented here. Further, analysis of the degree towhich increasing product line diversification may ameliorate systemicrisk concerns would be beneficial. Still, we share the belief that thegrowth of the global economy has been and will continue to be greatlyassisted by the wide availability of OTC derivative products that enableparticipants to better manage risks.

AP
PE
ND
IX A
Th
is a
ppen
dix
(Tab
le A
.I)
prov
ides
a c
ompl
ete
alph
abet
ic l
isti
ng
of a
ll d
eriv
ativ
es d
eale
rs t
hat
app
ear
in t
he
Sw
aps
Mon
itor
Dat
abas
e of
Dea
ler
Out
stan
ding
s fo
r th
e 19
95–2
001
peri
od.
To b
e co
nsid
ered
a d
eale
r in
the
Sw
aps
Mon
itor
Dat
abas
e, a
dea
ler
mus
t m
eet
at le
ast
of o
ne o
f th
ree
crit
eria
: The
firm
is a
pri
mar
y m
embe
r of
IS
DA
; the
firm
has
tot
alde
riva
tive
s fo
r tr
adin
g pu
rpos
es o
f at
lea
st $
10 b
illio
n; o
r th
e fir
m h
as c
omm
odit
y or
equ
ity
deri
vati
ves
for
trad
ing
pur-
pose
s of
at
leas
t $1
bill
ion.
The
sam
ple
incl
udes
264
der
ivat
ives
dea
lers
tha
t re
pres
ent
34 c
ount
ries
. In
the
appe
ndix
, DC
indi
cate
s th
at d
iscl
osur
e ha
s si
nce
ceas
ed, a
nd M
indi
cate
s th
at t
he d
eale
r m
erge
d or
was
acq
uire
d.
TA
BL
E A
.I
Dea
ler
Nam
eC
ount
ryYe
ars
Lis
ted
Mer
ged
Wit
h
1A
bbey
Nat
iona
lB
ritai
n19
9519
9619
9719
9819
9920
0020
012
AB
N-A
mro
Net
herla
nds
1995
1996
1997
1998
1999
2000
2001
3A
llied
Iris
h B
anks
Irel
and
1995
1996
1997
1998
1999
2000
DC
4A
mal
gam
ated
Ban
ks o
f Sou
th A
fric
aS
outh
Afr
ica
1995
1996
1997
1998
1999
2000
2001
5A
MB
Hol
ding
sS
outh
Afr
ica
1999
2000
DC
6A
mba
cU
S19
9519
9619
9719
9819
9920
0020
017
Am
erad
a H
ess
US
1996
1997
1998
1999
2000
2001
8A
mer
ican
Ele
ctric
Pow
erU
S19
9819
9920
00D
C9
Am
eric
an E
xpre
ssU
S19
9519
9619
9719
9819
9920
00D
C10
Am
eric
an In
tern
atio
nal G
roup
US
1995
1996
1997
1998
1999
2000
2001
11A
on C
orpo
ratio
nU
S19
9519
9619
9719
9819
99D
CD
C12
Aoz
ora
Ban
k1Ja
pan
1995
1996
2000
2001
13A
quila
, Inc
.2U
S19
9519
9619
9719
9819
9920
0020
0114
Ara
b B
anki
ng C
orpo
ratio
nB
ahra
in19
9519
9619
9719
9819
9920
0020
0115
Arg
enta
riaS
pain
1995
1996
1997
1998
1999
MM
Ban
co B
ilbao
Viz
caya
16A
rtes
ia3
Bel
gium
1995
1996
1997
1998
1999
2000
MD
exia
17A
sahi
Ban
kJa
pan
1995
1996
1997
1998
1999
2000
2001
18A
SLK
-CG
ER
Ban
kB
elgi
um19
9519
9619
97M
MM
MF
ortis
19A
ustr
alia
and
New
Zea
land
Ban
kA
ustr
alia
1995
1996
1997
1998
1999
2000
2001
20A
vist
a E
nerg
yU
S19
9719
9819
9920
0020
0121
Bac
ob B
ank
Bel
gium
1995
1996
1997
MM
MM
Art
esia
22B
aden
-Wur
ttem
berg
isch
e B
ank
Ger
man
y19
9519
9619
9719
9819
9920
0020
0123
Ban
ca C
omm
erci
ale
Italia
naIta
ly19
9519
9619
9719
9819
99M
MB
anca
Inte
sa (Con
tinue
d)

TA
BL
E A
.I
(Con
tinu
ed)
Dea
ler
Nam
eC
ount
ryYe
ars
Lis
ted
Mer
ged
Wit
h
24B
anca
di R
oma
Italy
1995
1996
1997
1998
1999
2000
2001
25B
anca
Inte
saIta
ly19
9719
9819
9920
0020
0126
Ban
ca M
onte
dei
Pas
chi d
i Sie
naIta
ly19
9519
9619
9719
9819
9920
00D
C27
Ban
ca N
azio
nale
del
Lav
oro
Italy
1995
1996
1997
1998
1999
2000
DC
28B
anca
Naz
iona
le d
ell’A
gric
oltu
raIta
ly19
9519
9619
9719
98D
CD
CD
C29
Ban
co B
ilbao
Viz
caya
Arg
enta
ria4
Spa
in19
9519
9619
9719
9819
9920
0020
0130
Ban
co C
entr
al H
ispa
noam
eric
ano
Spa
in19
9519
9619
9719
98M
MM
San
tand
er31
Ban
co C
omer
cial
Por
tugu
esP
ortu
gal
1995
1996
1997
1998
1999
2000
DC
32B
anco
di N
apol
iIta
ly19
9519
9619
9719
9819
99M
M
33B
anco
Esp
irito
San
toP
ortu
gal
1995
1996
1997
1998
1999
2000
2001
34B
anco
Por
tugu
es d
o A
tlant
ico
Por
tuga
l19
9519
9619
9719
98M
MM
35B
anco
San
tand
er C
entr
al H
ispa
no5
Spa
in19
9519
9619
9719
9819
9920
0020
0136
Ban
co T
otta
& A
core
sP
ortu
gal
1995
1996
1997
1998
1999
2000
DC
37B
angk
ok B
ank
Tha
iland
1995
1996
1997
1998
1999
2000
DC
38B
ank
Aus
tria
Aus
tria
1995
1996
1997
1998
1999
2000
MH
ypoV
erei
nsba
nk39
Ban
k B
russ
els
Lam
bert
Bel
gium
1995
1996
1997
MM
MM
ING
Gro
up40
Ban
k D
egro
ofB
elgi
um20
0041
Ban
k fu
r Arb
eit u
nd W
irtsc
haft
Aus
tria
1995
1996
1997
1998
1999
2001
42B
ank
Han
dlow
yP
olan
d19
9619
9719
9819
9920
00M
Citi
grou
p43
Ban
k H
apoa
limIs
rael
1995
1996
1997
1998
1999
2000
DC
44B
ank
of A
mer
ica6
US
1995
1996
1997
1998
1999
2000
2001
45B
ank
of C
hina
Chi
na19
9519
9619
97D
CD
CD
CD
C46
Ban
k of
Irel
and
Irel
and
1995
1996
1997
1998
1999
2000
2001
47B
ank
of M
ontr
eal
Can
ada
1995
1996
1997
1998
1999
2000
2001
48B
ank
of N
ew Y
ork
US
1995
1996
1997
1998
1999
2000
2001
49B
ank
of N
ova
Sco
tiaC
anad
a19
9519
9619
9719
9819
9920
0020
0150
Ban
k of
Sco
tland
Brit
ain
1995
1996
1997
1998
1999
2000
2001
51B
ank
of T
okyo
Japa
n19
95M
MM
MM
MM
itsub
ishi
Ban
k52
Ban
k of
Yok
oham
aJa
pan
1996
1997
1998
1999
2000
2001
53B
ank
One
Cor
pora
tion7
US
1995
1996
1997
1998
1999
2000
2001
54B
ank
Roz
woj
u E
kspo
rtu
Pol
and
1997
1998
1999
2000
2001
Istit
uto
Ban
cario
San
Pao
lo d
i Tor
ino
Ban
co C
omer
cial
Por
tugu
es

55B
anke
rs T
rust
US
1995
1996
1997
1998
1999
MM
Deu
tsch
e B
ank
56B
ankg
esel
lsch
aft B
erlin
Ger
man
y19
9519
9619
9719
9819
9920
0020
0157
Ban
que
Can
tona
le V
oudo
ise
Sw
itzer
land
1995
1996
1997
1998
1999
2000
2001
58B
anqu
e In
dosu
ezF
ranc
e19
95M
MM
MM
MC
redi
t Agr
icol
e59
Ban
que
Pop
ulai
reF
ranc
e19
9519
9619
9719
9819
9920
0020
0160
Ban
que
Wor
ms
Fra
nce
1995
1996
1997
1998
1999
2000
DC
61B
arcl
ays
Brit
ain
1995
1996
1997
1998
1999
2000
2001
62B
ayer
isch
e H
ypot
heke
n-un
d W
echs
el B
ank
Ger
man
y19
9519
9619
97M
MM
MH
ypoV
erei
nsba
nk
63B
ayer
isch
e La
ndes
bank
Ger
man
y19
9519
9619
9719
9819
9920
0020
0164
Bea
r S
tear
nsU
S19
9519
9619
9719
9819
9920
0020
0165
Ber
kshi
re H
atha
way
8U
S19
9519
9619
9719
9819
9920
00D
C
66B
fG B
ank
Ger
man
y19
9519
9619
9719
98M
MM
Ska
ndin
avis
kaE
nski
lda
Ban
ken
67B
HF
-Ban
kG
erm
any
1995
1996
1997
1998
1999
2000
2001
68B
NP
Par
ibas
9F
ranc
e19
9519
9619
9719
9819
9920
0020
0169
BP
Am
oco
Brit
ain
1997
1998
1999
2000
DC
70C
aiss
e C
entr
ale
des
Ban
ques
N
atex
is B
anqu
esP
opul
aire
sF
ranc
e19
9519
9619
9719
98M
MM
Pop
ulai
res
71C
aiss
e d’
Epa
rgne
10F
ranc
e19
9519
9619
9719
9819
9920
0020
0172
Cai
sse
des
Dep
ots
Fra
nce
1995
1996
1997
1998
1999
2000
2001
73C
aixa
Ger
al d
e D
epos
itos
Por
tuga
l19
9819
9920
00D
C74
Caj
a de
Mad
ridS
pain
1995
1996
1997
1998
1999
2000
2001
75C
anad
ian
Impe
rial B
ank
of
Com
mer
ceC
anad
a19
9519
9619
9719
9819
9920
0020
01
76C
assa
di R
ispa
rmio
del
le
Pro
vinc
ie L
omba
rde
Italy
1995
1996
1997
MM
MM
Ban
ca In
tesa
77C
era
Ban
kB
elgi
um19
9519
9619
97M
MM
MK
redi
etba
nk78
Ces
kosl
oven
kaC
zech
1996
1997
1998
1999
2000
DC
79C
hart
erho
use
Brit
ain
1996
MM
MM
MC
redi
t Com
mer
cial
de
Fra
nce
80C
hem
ical
US
1995
MM
MM
MM
JPM
orga
n C
hase
81C
hris
tiani
a B
ank
Nor
way
1995
1996
1997
1998
1999
MM
Nor
dea
82C
huo
Mits
ui T
rust
& B
anki
ng11
Japa
n19
9719
9819
9920
0020
0183
Chu
o Tr
ust &
Ban
king
Japa
n19
9719
9819
99M
MM
itsui
Trus
t&B
anki
ng84
Ciro
fiS
IM S
.p.A
.Ita
ly19
98D
CD
CD
C85
Citi
grou
p12U
S19
9519
9619
9719
9819
9920
0020
01
(Con
tinue
d)

TA
BL
E A
.I
(Con
tinu
ed)
Dea
ler
Nam
eC
ount
ryYe
ars
Lis
ted
Mer
ged
Wit
h
86C
olon
ial13
Aus
tral
ia19
9519
9619
9719
9819
99M
MC
omm
onw
ealth
Ban
kof
Aus
tral
ia87
Com
mer
ce A
sset
-Hol
ding
Ber
had
Mal
aysi
a19
9719
9819
9920
0020
0188
Com
mer
zban
kG
erm
any
1995
1996
1997
1998
1999
2000
2001
89C
omm
onw
ealth
Ban
k of
Aus
tral
iaA
ustr
alia
1995
1996
1997
1998
1999
2000
2001
90C
orpc
apita
l Ban
kS
outh
Afr
ica
1999
2000
91C
PR
Fra
nce
1995
1996
1997
1998
1999
2000
DC
92C
redi
t Agr
icol
eF
ranc
e19
9519
9619
9719
9819
9920
0020
0193
Cre
dit C
omm
erci
al d
e F
ranc
eF
ranc
e19
9519
9619
9719
9819
99M
MH
SB
C H
oldi
ngs
94C
redi
t Lyo
nnai
sF
ranc
e19
9519
9619
9719
9819
9920
0020
0195
Cre
dit S
uiss
eS
witz
erla
nd19
9519
9619
9719
9819
9920
0020
0196
Cre
dita
nsta
ltA
ustr
ia19
9519
9619
97M
MM
MB
ank
Aus
tria
97C
redi
to It
alia
noIta
ly19
9519
9619
9719
9819
9920
00D
C98
Dai
-Ich
i Kan
gyo
Ban
kJa
pan
1995
1996
1997
1998
1999
2000
2001
99D
aiw
a B
ank
Japa
n19
9719
9819
9920
0020
0110
0D
aiw
a S
ecur
ities
Japa
n19
9519
9619
97D
CD
CD
CD
C10
1D
en D
ansk
e B
ank
Den
mar
k19
9519
9619
9719
9819
9920
0020
0110
2D
en N
orsk
e B
ank
Nor
way
1995
1996
1997
1998
1999
2000
2001
103
DeP
faG
erm
any
1995
1996
1997
1998
1999
2000
2001
104
Deu
tsch
e B
ank
Ger
man
y19
9519
9619
9719
9819
9920
0020
0110
5D
euts
che
Giro
zent
rale
Ger
man
y19
9519
9619
9719
9819
9920
00D
C10
6D
evel
opm
ent B
ank
of S
inga
pore
Sin
gapo
re19
9519
9619
9719
9819
9920
0020
0110
7D
exia
14B
elgi
um19
9519
9619
9719
9819
9920
0020
0110
8D
onal
dson
Luf
kin
& J
enre
tteU
S19
9519
9619
9719
9819
9920
00M
Cre
dit S
uiss
e10
9D
resd
ner
Ban
kG
erm
any
1995
1996
1997
1998
1999
2000
2001
110
Duk
e E
nerg
yU
S19
9519
9619
9719
9819
9920
00D
C11
1D
yneg
yU
S19
9519
9619
9719
9819
9920
0020
0111
2D
Z B
ank15
Ger
man
y19
9519
9619
9719
9819
9920
0020
0111
3E
FG
Eur
oban
kG
reec
e19
9819
9920
00D
C11
4E
l Pas
o E
nerg
y16U
S19
9519
9619
9719
9819
9920
0020
0111
5E
nron
Cor
pU
S19
9519
9619
9719
9819
9920
00D
C11
6E
rste
Ban
k17A
ustr
ia19
9519
9619
9719
9819
9920
00D
C11
7F
irst N
atio
nal B
ank
of S
outh
Afr
ica
Sou
th A
fric
a19
9519
9619
97D
CD
CD
CD
C

118
Firs
t Sec
urity
US
1995
1996
1997
1998
1999
2000
MW
ells
Far
go11
9F
irst U
nion
US
1995
1996
1997
1998
1999
2000
2001
Wac
hovi
a12
0F
leet
Fin
anci
alU
S19
9519
9619
9719
9819
99M
MF
leet
Bos
ton
121
Fle
etB
osto
n18U
S19
9519
9619
9719
9819
9920
0020
0112
2F
ortis
Bel
gium
1995
1996
1997
1998
1999
2000
2001
123
Fuj
i Ban
kJa
pan
1995
1996
1997
1998
1999
2000
2001
124
Gen
eral
e B
ank
Bel
gium
1995
1996
1997
MM
MM
For
tis12
5G
iro C
redi
tA
ustr
ia19
9519
96M
MM
MM
Ers
te B
ank
126
Gol
dman
Sac
hsU
S19
9519
9619
9719
9819
9920
00D
C12
7G
rupp
o C
RT
Italy
1995
1996
1997
1998
MM
MC
redi
to It
alia
no12
8G
rupp
o G
ener
ali
Italy
2000
129
Gul
f Int
erna
tiona
l Ban
kB
ahra
in19
9519
9619
9719
9819
9920
0020
0113
0G
ulf I
nves
tmen
t Ban
kB
ahra
in19
9619
9719
9819
9920
0020
0113
1H
ambr
os B
ank
Brit
ain
1995
1996
1997
MM
MM
Soc
iete
Gen
eral
e13
2H
ambu
rgis
che
Land
esba
nkG
erm
any
1995
1996
1997
1998
1999
2000
2001
133
HB
OS
19B
ritai
n19
9519
9619
9719
9819
9920
0020
0113
4H
okka
ido
Taku
shok
uJa
pan
1995
1996
1997
DC
DC
DC
DC
135
HS
BC
Hol
ding
sB
ritai
n19
9519
9619
9719
9819
9920
0020
0113
6H
ypoV
erei
nsba
nk20
Ger
man
y19
9519
9619
9719
9819
9920
0020
0113
7IK
B D
euts
che
Indu
strie
bank
Ger
man
y19
9519
9619
9719
9819
9920
0020
0113
8IN
AIta
ly19
9719
98D
CD
CD
C13
9In
dust
rial B
ank
of J
apan
Japa
n19
9519
9619
9719
9819
9920
0020
0114
0IN
G G
roup
Net
herla
nds
1995
1996
1997
1998
1999
2000
2001
141
Inve
stec
Gro
upS
outh
Afr
ica
1996
1997
1998
1999
2000
2001
142
Istit
uto
Ban
cario
San
Pao
lo d
i Tor
ino
Italy
1995
1996
1997
1998
1999
2000
DC
143
Istit
uto
Mob
iliar
e Ita
liano
Italy
1995
1996
1997
MM
MM
Istit
uto
Ban
cario
San
Pao
lo d
i Tor
ino
144
Joyo
Ban
kJa
pan
1996
1997
1998
1999
2000
2001
145
JPM
orga
nU
S19
9519
9619
9719
9819
9920
00M
JPM
orga
n C
hase
146
JPM
orga
n C
hase
21U
S19
9519
9619
9719
9819
9920
0020
0114
7Ju
lius
Bae
r G
roup
Sw
itzer
land
1997
1998
1999
2000
DC
148
Jysk
e B
ank
Den
mar
k19
9519
9619
9719
9819
9920
0020
0114
9K
apita
l Hol
ding
22D
enm
ark
1995
1996
1997
1998
1999
MM
Den
Dan
ske
Ban
k15
0K
BC
Ban
k23B
elgi
um19
9519
9619
9719
9819
9920
0020
0115
1K
eyC
orp
US
1995
1996
1997
1998
1999
2000
2001
152
Kor
ean
Dev
elop
men
t Ban
k24K
orea
1995
1996
1997
1998
1999
2000
DC
153
Kre
dita
nsta
lt fu
r W
iede
rauf
bau
Ger
man
y19
9519
9619
9719
9819
9920
0020
0115
4La
bouc
here
Net
herla
nds
1995
1996
1997
1998
1999
MM
Dex
ia
(Con
tinue
d)

TA
BL
E A
.I
(Con
tinu
ed)
Dea
ler
Nam
eC
ount
ryYe
ars
Lis
ted
Mer
ged
Wit
h
155
Land
esba
nk B
aden
-Wur
ttem
berg
25G
erm
any
1995
1996
1997
1998
1999
2000
2001
156
Land
esba
nk H
esse
n-T
hurin
gen
Ger
man
y19
9519
9619
9719
9819
9920
0020
0115
7La
ndes
bank
Rhe
inla
nd-P
falz
Ger
man
y19
9519
9619
9719
9819
9920
0020
0115
8La
ndes
bank
Sac
hsen
Giro
zent
rale
Ger
man
y19
9619
9719
9819
9920
00D
C15
9La
ndes
giro
kass
eG
erm
any
1995
1996
1997
MM
MM
Sud
wes
tdeu
tsch
eLa
ndes
bank
160
Lehm
an B
roth
ers
US
1995
1996
1997
1998
1999
2000
2001
161
LG &
E E
nerg
yU
S19
9519
9619
9719
9819
99D
CD
C16
2Ll
oyds
TS
B26
Brit
ain
1995
1996
1997
1998
1999
2000
2001
163
Mac
quar
ie B
ank
Aus
tral
ia19
9519
9619
9719
9819
9920
0020
0116
4M
aple
Par
tner
s27C
anad
a19
9519
9619
9719
9819
99D
CD
C16
5M
CN
Ene
rgy
US
1995
1996
1997
1998
1999
2000
DC
166
Mee
s P
iers
onN
ethe
rland
s19
95M
MM
MM
MF
ortis
167
Mel
lon
Ban
kU
S19
9519
9619
9719
9819
9920
0020
0116
8M
erril
l Lyn
chU
S19
9519
9619
9719
9819
9920
0020
0116
9M
itsub
ishi
Tok
yo F
inan
cial
Gro
up28
Japa
n19
9519
9619
9719
9819
9920
0020
0117
0M
itsub
ishi
Tru
st &
Ban
king
Japa
n19
9519
9619
9719
9819
9920
0020
0117
1M
orga
n S
tanl
eyU
S19
9519
9619
9719
9819
9920
00D
C17
2M
osco
w N
arod
ny B
ank
Brit
ain
1995
1996
1997
1998
1999
2000
DC
173
Nat
exis
Ban
ques
Pop
ulai
res29
Fra
nce
1995
1996
1997
1998
1999
2000
2001
174
Nat
iona
l Aus
tral
ia B
ank
Aus
tral
ia19
9519
9619
9719
9819
9920
0020
0117
5N
atio
nal B
ank
of C
anad
aC
anad
a19
9519
9619
9719
9819
9920
0020
0117
6N
atio
nal B
ank
of G
reec
eG
reec
e19
9519
9619
9719
9819
9920
00D
C17
7N
atio
nal C
ity C
orpo
ratio
nU
S19
9519
9619
9719
9819
9920
0020
0117
8N
atio
nsB
ank
US
1995
1996
1997
1998
MM
MB
ank
of A
mer
ica
179
Nat
Wes
t Ban
kB
ritai
n19
9519
9619
9719
9819
99M
MR
oyal
Ban
k of
Sco
tland
180
Ned
cor
Sou
th A
fric
a19
9819
9920
00D
C18
1N
iaga
ra M
ohaw
k H
oldi
ngs
US
2000
DC
182
NIB
Cap
ital B
ank30
Net
herla
nds
1995
1996
1997
1998
1999
2000
DC
183
Nik
ko S
ecur
ities
Japa
n19
9519
9619
9719
9819
9920
0020
0118
4N
M R
oths
child
& S
ons
Brit
ain
1995
1996
1997
1998
1999
2000
2001
185
Nom
ura
Hol
ding
s31Ja
pan
1995
1996
1997
1998
1999
2000
2001
186
Nor
d LB
Ger
man
y19
9519
9619
9719
9819
9920
0020
01

187
Nor
dban
ken
Sw
eden
1995
1996
1997
MM
MM
Nor
dea
188
Nor
dea32
Fin
land
1995
1996
1997
1998
1999
2000
2001
189
Nor
inch
ukin
Ban
kJa
pan
1995
1996
1997
1998
1999
2000
2001
190
Nor
ther
n Tr
ust
US
1995
1996
1997
1998
1999
2000
2001
191
Nyk
redi
tD
enm
ark
1998
1999
2000
2001
192
Oko
bank
Fin
land
1995
1996
1997
1998
1999
2000
2001
193
Ost
erre
ichi
sche
Pos
tspa
rkas
seA
ustr
ia19
9619
9719
9819
9920
00D
C19
4O
vers
eas
Chi
nese
Ban
king
S
inga
pore
1995
1996
1997
1998
1999
2000
DC
Cor
pora
tion
195
Ove
rsea
s U
nion
Ban
kS
inga
pore
1996
1997
1998
1999
2000
DC
196
Pai
ne W
ebbe
rU
S19
9519
9619
9719
9819
9920
00M
Uni
on B
ank
ofS
witz
erla
nd19
7P
anE
nerg
y C
orp
US
1995
MM
MM
MM
Duk
e E
nerg
y19
8P
arib
as33
Fra
nce
1995
1996
1997
1998
MM
MB
NP
Par
ibas
199
Per
egrin
e In
vest
men
tsH
ong
Kon
g19
96D
CD
CD
CD
CD
C20
0P
G&
E C
orpo
ratio
nU
S19
9819
9920
00D
C20
1P
NC
US
1995
1996
1997
1998
1999
2000
2001
202
Pos
tban
k34G
erm
any
1995
1996
1997
1998
1999
2000
DC
203
Pru
dent
ial
US
1995
1996
1997
1998
1999
2000
2001
204
Rab
oban
kN
ethe
rland
s19
9519
9619
9719
9819
9920
0020
0120
5R
aiffe
isen
Zen
tral
bank
Ost
erre
ich
Aus
tria
1995
1996
1997
1998
1999
2000
DC
206
Rel
iant
Ene
rgy35
US
1996
1997
1998
1999
2000
DC
207
Rep
ublic
New
Yor
kU
S19
9519
9619
9719
9819
99M
MH
SB
C H
oldi
ngs
208
Riy
ad B
ank
Sau
di A
rabi
a19
9619
9719
9819
9920
00D
C20
9R
ober
t Fle
min
gB
ritai
n19
9519
9619
9719
9819
9920
00M
JPM
orga
n C
hase
210
Ros
siys
kiy
Kre
dit B
ank
Rus
sia
1996
DC
DC
DC
DC
DC
211
Roy
al B
ank
of C
anad
aC
anad
a19
9519
9619
9719
9819
9920
0020
0121
2R
oyal
Ban
k of
Sco
tland
Brit
ain
1995
1996
1997
1998
1999
2000
2001
213
Sak
ura
Ban
kJa
pan
1995
1996
1997
1998
1999
2000
2001
214
Sal
. Opp
enhe
im jr
Ger
man
y19
9519
9619
9719
9819
9920
0020
0121
5S
alom
on S
mith
Bar
ney36
US
1995
1996
1997
1998
MM
MC
itigr
oup
216
Sam
po37
Fin
land
1995
1996
1997
1998
1999
2000
2001
217
Sau
di A
mer
ican
Ban
kS
audi
Ara
bia
1995
1996
1997
1998
1999
2000
DC
218
Sau
di In
tern
atio
nal B
ank
Brit
ain
1995
1996
1997
1998
1999
MM
Gul
f Int
erna
tiona
lB
ank
219
Sch
rode
rsB
ritai
n19
9519
9619
9719
9819
9920
00D
C22
0S
empr
a E
nerg
yU
S19
9719
9819
9920
0020
01
(Con
tinue
d)

TA
BL
E A
.I
(Con
tinu
ed)
Dea
ler
Nam
eC
ount
ryYe
ars
Lis
ted
Mer
ged
Wit
h
221
SG
Z B
ank
Ger
man
y19
9619
9719
9819
9920
00M
DZ
Ban
k22
2S
hink
in C
entr
al B
ank38
Japa
n19
9519
9619
9719
9819
9920
0020
0122
3S
hins
ei B
ank39
Japa
n19
9519
9619
9719
9819
9920
0020
0122
4S
hoko
Chu
kin
Ban
kJa
pan
1997
1998
1999
2000
DC
225
Ska
ndin
avis
ka E
nski
lda
Ban
ken
Sw
eden
1995
1996
1997
1998
1999
2000
2001
226
Sm
ith B
arne
yU
S19
9519
9619
97M
MM
MS
alom
on S
mith
B
arne
y22
7S
ocie
te G
ener
ale
Fra
nce
1995
1996
1997
1998
1999
2000
2001
228
Spa
r N
ord
Ban
kD
enm
ark
1998
1999
2000
DC
229
St.
Geo
rge
Ban
kA
ustr
alia
1996
1997
1998
1999
2000
2001
230
Sta
ndar
d B
ank
of S
outh
Afr
ica
Sou
th A
fric
a19
9519
9619
9719
9819
9920
00D
C23
1S
tand
ard
Cha
rter
edB
ritai
n19
9519
9619
9719
9819
9920
0020
0123
2S
tate
Str
eet
US
1995
1996
1997
1998
1999
2000
2001
233
Sum
itom
o B
ank
Japa
n19
9519
9619
9719
9819
9920
0020
0123
4S
umito
mo
Trus
t & B
anki
ngJa
pan
1995
1996
1997
1998
1999
2000
2001
235
Sun
Life
Fin
anci
al40
Can
ada
1995
1996
1997
1998
1999
2000
2001
236
Sun
Trus
t Ban
ksU
S19
9519
9619
9719
9819
9920
0020
0123
7S
vens
ka H
ande
lsba
nken
Sw
eden
1995
1996
1997
1998
1999
2000
2001
238
Sw
edba
nkS
wed
en19
9519
9619
9719
9819
9920
00D
C23
9S
wis
s B
ank
Cor
pora
tion
Sw
itzer
land
1995
1996
1997
MM
MM
Uni
on B
ank
of
Sw
itzer
land
240
Syd
bank
Gro
upD
enm
ark
1998
1999
2000
2001
241
Texa
s U
tiliti
esU
S19
9719
9819
9920
0020
0124
2To
kai B
ank
Japa
n19
9619
9719
9819
9920
0020
01D
C24
3To
ront
o-D
omin
ion
Ban
kC
anad
a19
9519
9619
9719
9819
9920
0020
0124
4To
tal F
ina
Elf41
Fra
nce
1995
1996
1997
1998
1999
2000
2001
245
Toyo
Tru
st &
Ban
king
Japa
n19
9519
9619
9719
9819
9920
0020
0124
6Tr
inka
us &
Bur
khar
dtG
erm
any
1995
1996
1997
1998
1999
2000
2001
247
UB
S42
Sw
itzer
land
1995
1996
1997
1998
1999
2000
2001
248
UF
J H
oldi
ngs43
Japa
n19
9519
9619
9719
9819
9920
0020
0124
9U
niba
nco
Bra
zil
1995
1996
1997
1998
1999
2000
DC
250
Uni
bank
Den
mar
k19
9519
9619
9719
9819
99M
MN
orde
a25
1U
nion
Ban
k of
Nor
way
Nor
way
1995
1996
1997
1998
1999
2000
DC

252
Uni
on E
urop
eenn
e de
CIC
Fra
nce
1995
1996
1997
1998
1999
2000
2001
253
Uni
ted
Ove
rsea
s B
ank
Gro
upS
inga
pore
1995
1996
1997
1998
1999
2000
DC
254
Wac
hovi
aU
S19
9519
9619
9719
9819
9920
0020
0125
5W
ells
Far
goU
S19
9519
9619
9719
9819
9920
0020
0125
6W
estd
euts
che
Gen
osse
nsch
afts
Ger
man
y19
9519
9619
9719
9819
9920
0020
01Z
entr
alba
nk25
7W
estd
euts
che
Land
esba
nkG
erm
any
1995
1996
1997
1998
1999
2000
2001
258
Wes
tpac
Aus
tral
ia19
9519
9619
9719
9819
9920
0020
0125
9W
illia
ms
Com
pani
esU
S19
9519
9619
9719
9819
9920
0020
0126
0Y
amai
chi S
ecur
ities
Japa
n19
9519
9619
97D
CD
CD
CD
C26
1Y
asud
a Tr
ust &
Ban
king
Japa
n19
9519
9619
9719
9819
9920
0020
0126
2Z
urch
er K
anto
nalb
ank
Sw
itzer
land
1995
1996
1997
1998
1999
2000
DC
263
Zur
ich
Fin
anci
al S
ervi
ces
Sw
itzer
land
1998
1999
2000
DC
264
Zur
ich
Gro
upS
witz
erla
nd19
9619
97D
CD
CD
CD
C
Not
e.1 fo
rmer
ly, N
ippo
n C
redi
t Ban
k2 fo
rmer
ly, U
tiliC
orp
Uni
ted
3 form
erly
, Ban
que
Par
ibas
Bel
giqu
e4 fo
rmer
ly, B
anco
Bilb
ao V
izca
ya5 fo
rmer
ly, S
anta
nder
6 form
erly
, Ban
kAm
eric
a7 fo
rmer
ly, F
irst C
hica
go N
BD
8 form
erly
, Gen
eral
Re
Cor
pora
tion
9 form
erly
, Ban
que
Nat
iona
le d
e P
aris
10fo
rmer
ly, C
CC
EP
11fo
rmer
ly, M
itsui
Tru
st &
Ban
king
12fo
rmer
ly, C
itico
rp
13fo
rmer
ly, S
tate
Ban
k of
New
Sou
th W
ales
14fo
rmer
ly, C
redi
t Com
mun
al15
form
erly
, DG
Ban
k16
form
erly
, El P
aso
Nat
ural
Gas
17fo
rmer
ly, D
ie E
rste
Ost
erre
ichi
sche
S
par-
Cas
se18
form
erly
, Ban
kBos
ton
19fo
rmer
ly, H
alifa
x20
form
erly
, Bay
eris
che
Ver
eins
bank
21fo
rmer
ly, C
hase
Man
hatta
n22
form
erly
, BG
Ban
k an
d B
ikub
en B
ank
23fo
rmer
ly, K
redi
etba
nk24
form
erly
, Kor
ea D
evel
opm
ent B
ank
25fo
rmer
ly, S
udw
estd
euts
che
Land
esba
nk26
form
erly
, Llo
yds
27fo
rmer
ly, F
irst M
arat
hon
28fo
rmer
ly,
Ban
k of
Tok
yo-M
itsub
ishi
and
Mits
ubis
hi B
ank
29fo
rmer
ly,
Nat
exis
, C
redi
t N
atio
nal B
FC
E,
and
Cre
dit N
atio
nal
30fo
rmer
ly, D
e N
atio
nale
Inve
ster
ings
bank
31fo
rmer
ly, N
omur
a S
ecur
ities
32fo
rmer
ly,
Mer
ita N
ordb
anke
n an
d M
erita
Gro
up33
form
erly
, C
ompa
gnie
F
inan
cier
e de
Par
ibas
34fo
rmer
ly, D
euts
che
Sie
dlun
gs-u
ndLa
ndes
rent
enba
nk35
form
erly
, Hou
ston
Indu
strie
s36
form
erly
, Sal
omon
37fo
rmer
ly, L
eoni
a an
d P
ostip
ankk
i38
form
erly
, Zen
shin
ren
Ban
k39
form
erly
, Lon
g-Te
rm C
redi
t Ban
k40
form
erly
, Cla
rica
and
Mut
ual G
roup
41fo
rmer
ly, E
lf A
quita
ine
42fo
rmer
ly, U
nion
Ban
k of
Sw
itzer
land
43fo
rmer
ly, S
anw
a B
ank

76 Emm and Gay
BIBLIOGRAPHY
Abken, P. A. (1993, March/April). Over-the-counter financial derivatives: Riskybusiness? Federal Reserve Bank of Atlanta Economic Review, 1–22.
Allayannis, G., & Ofek, E. (2001, April). Exchange rate exposure, hedging, andthe use of foreign currency derivatives. Journal of International Money andFinance, 20, 273–296.
Bank of International Settlements. (2003, May 8). OTC derivativesmarket activity in the second half of 2002. Basel, Switzerland: Monetaryand Economic Department.
Bartram, S. M., Brown, G. W., & Fehle, F. R. (2003). International evidenceon financial derivatives usage. Working paper, University of NorthCarolina, Chapel Hill, North Carolina.
Bomfim, A. N. (2002). Counterparty credit risk in interest rate swaps duringtimes of market stress. Working paper, Board of Governors of the FederalReserve System, Washington, D.C.
DeMarzo, P. M., & Duffie, D. (1995). Corporate incentives for hedging andhedge accounting. Review of Financial Studies, 8, 743–771.
Dodd, R. (2002). The structure of OTC derivatives markets. The Financier, 9,1–5.
Farooqi, S. (2002, December). Interbank derivatives survey 2002: On top of themarket. Asia Risk, 17–26.
Froot, K. A., Scharfstein, D. S., & Stein, J. C. (1993). Risk management:Coordinating corporate investment and financing policies. Journal ofFinance, 48, 1629–1658.
Gay, G. D., & Medero, J. (1996). The economics of derivatives documentation:Private contracting as a substitute for government regulation. Journal ofDerivatives, 3, 78–89.
Group of Thirty. (1993, July). Derivatives: Practices and principles. Washington,DC: Global Derivatives Study Group.
Hentschel, L., & Smith, C. W., Jr. (1995). Controlling risks in derivatives mar-kets. Journal of Financial Engineering, 4, 101–125.
Kamara, A. (1988, Winter). Market trading structures and asset pricing:Evidence from the treasury-bill markets. The Review of Financial Studies,357–375.
Kambhu, J., Keane, F., & Benadon, C. (1996, April). Price risk intermediation inthe over-the-counter derivatives markets: Interpretation of a global survey.FRBNY Economic Policy Review, 1–15.
Malhotra, D. K. (1997, Spring). An empirical examination of the interest rateswap market. Quarterly Journal of Business and Economics, 19–29.
Smith, C. W., Jr., & Stulz, R. M. (1985, December). The determinants of firms’hedging policies. Journal of Financial and Quantitative Analysis, 391–405.
Smithson, C. W. (1995). Managing financial risk 1995 yearbook. CIBC WoodGundy, 55–59.
Smithson, C. W. (1996). Managing financial risk 1996 yearbook. CIBC WoodGundy, 91–94.

Smithson, C. W. (1998). Questions regarding the use of price risk management byindustrial corporations. Working paper, CIBC World Markets, New York.
Stulz, R. M. (2003). Risk management & derivatives. Mason, OH: Thompson-Southwestern.
Sun, T., Sundaresan, S., & Wang, C. (1993, August). Interest rate swaps: Anempirical investigation. Journal of Financial Economics, 77–99.
Weinstein, J. D. (2003, May). Master netting agreement developments in energyindustry. Futures and Derivatives Law Report, 1–6.
Global Market for OTC Derivatives 77