Embed Size (px)
Citation preview

The global market for fortified complementary infant foods:
Evidence from 108 locally-produced, commercially marketed products in 22 countries
William A. Masterswith Winnie Bell and Marc Nene
Friedman School of Nutrition Science and Policy, Tufts Universityhttp://sites.tufts.edu/willmasters | http://www.nutritioninnovationlab.org
29th International Conference of Agricultural Economists, MilanSymposium on Nutritional Gains for the Poor from Agri-food Value Chains
10 August 2015
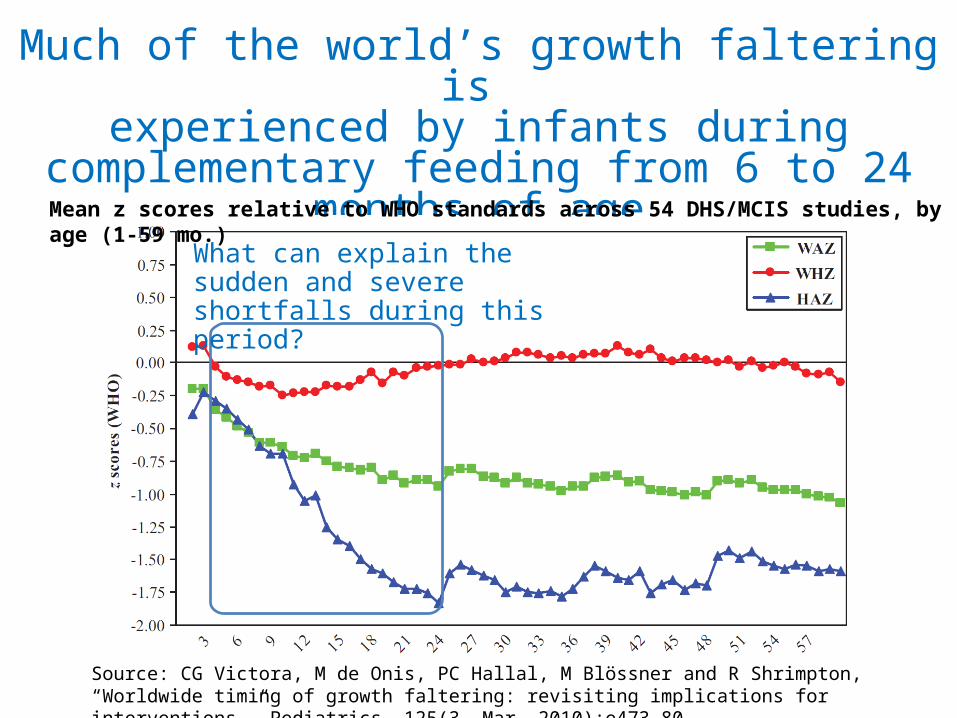
Much of the world’s growth faltering is experienced by infants during complementary feeding
from 6 to 24 months of age
Source: CG Victora, M de Onis, PC Hallal, M Blössner and R Shrimpton, “Worldwide timing of growth faltering: revisiting implications for interventions.” Pediatrics, 125(3, Mar. 2010):e473-80.
Mean z scores relative to WHO standards across 54 DHS/MCIS studies, by age (1-59 mo.)
What can explain the sudden and severe shortfalls during this period?

Many factors could cause this patternof onset and duration
• For example:– Exposure to water-borne pathogens, air pollution etc.– Expression of gestational deficits
• ...and also inadequate total nutrient intake:
6–8 months 9–11 months 12–18 monthsEnergy (kcal) 84% 90% 91%Protein (g) 89% 99% 88%Calcium (mg) 66% 69% 78%Iron (mg) 33% 44% 75%Vitamin A (IU) 535% 663% 443%Vitamin B1 (mg) 59% 67% 60%Vitamin B2 (mg) 48% 50% 35%Niacin (mg) 53% 41% 44%
Note: Data shown are mean values for a sample of 400 children in Eastern Ghana.Source: C.A. Nti and A. Lartey (2007). “Young child feeding practices and child nutritional status in rural Ghana.” International Journal of Consumer Studies, 31: 326-332.
Mean intake as a percentage of WHO recommended needs, by age

Why might sufficient nutrient intake be difficult to achieve?
• Total quantity is small and inexpensive relative to family budget
...but nutrient density and digestibility must be higher than family diet
• Complementary foods have high-cost ingredients and processing– Starchy staple must be fortified with protein, fats and micronutrients
– Processing at home using traditional methods is labor intensive
– Availability from artisanal or industrial manufacturers is limited
• Since Incaparina in the 1960s, donors have funded startups to produce and sell high-quality complementary foods at lowest possible cost– Many different recipes and production methods are possible
– Locally-adapted products are readily acceptable, have proven efficacy, and cost much less than either home production or imports from industrialized countries
• So what products do we now see in places with widespread malnutrition?

Accra, Ghana (2010)
Low-income country markets arestill dominated by Nestle’s Cerelac

There are many alternatives:
Kenya MaliSenegal
Generics, e.g. “weanimix” in Ghana:
Many small-scale local start-ups, e.g. these from around Africa:
And various multinationals, typically sold in
supermarkets and pharmacies:
Tanzania
Cameroon

This project asks:What’s for sale, and is it any good?
• A global catalog of marketed complementary foods:– Step 1: Invite collaborators to identify products on local markets in 2014
• Criterion: marketed as complement to breastmilk, for >6 months of age• Typical product: a fortified composite flour
– Step 2: Pay them to send us a random sample for nutrient testing• Goal: at least 20 countries, averaging 5 products from each country• Test for protein, fats, calories, iron, zinc, and phosphorus (for phytates)
– Step 3: Test predictions from the economics of product quality• Hypothesis: Consumers cannot detect nutrients, so composition will vary widely• Remedy would be third-party quality assurance
• If products can be good but often aren’t, quality assurance can help– both plant inspections and product sampling with nutrient testing– 3rd-party label, e.g. “INQAP—OK for babies over 6 months”– local advertising to establish this third-party brand

For now:Results from 109 products in 22 countries
380
400
420
440
460
En
erg
y d
ensi
ty (
kca
l/10
0g d
ry m
atte
r)
Benin
Botsw
ana
Burkin
a Fas
o
Camer
oon
China
Cote
d'Ivo
ire
DR Con
go
Ethio
pia
Ghana
Haiti
Indo
nesia
Kenya
Mad
agas
car
Mala
wiM
ali
Mau
ritan
ia
Mor
occo
Nepal
Rwanda
Seneg
al
South
Afri
ca
Ugand
a
Energy density by country of purchaserelative to the WFP SuperCereal+ benchmark
Energy density varies widely within and across countries

For now:Results from 109 products in 22 countries
01
02
03
04
0P
rote
in c
ont
ent (
g/10
0g d
ry m
atte
r)
Benin
Botsw
ana
Burkin
a Fas
o
Camer
oon
China
Cote
d'Ivo
ire
DR Con
go
Ethio
pia
Ghana
Haiti
Indo
nesia
Kenya
Mad
agas
car
Mala
wiM
ali
Mau
ritan
ia
Mor
occo
Nepal
Rwanda
Seneg
al
South
Afri
ca
Ugand
a
Protein content by country of purchaserelative to the WFP SuperCereal+ benchmark
05
10
15
20
Fat
co
nten
t (g/
100g
dry
ma
tter)
Benin
Botsw
ana
Burkin
a Fas
o
Camer
oon
China
Cote
d'Ivo
ire
DR Con
go
Ethio
pia
Ghana
Haiti
Indo
nesia
Kenya
Mad
agas
car
Mala
wiM
ali
Mau
ritan
ia
Mor
occo
Nepal
Rwanda
Seneg
al
South
Afri
ca
Ugand
a
Fat content by country of purchaserelative to the WFP SuperCereal+ benchmark
Macronutrients typically fall short of international standards

For now:Results from 109 products in 22 countriesZinc and Iron also often fall short of international standards
02
04
06
0Ir
on c
ont
ent (
mg/
100g
dry
ma
tter)
Benin
Botsw
ana
Burkin
a Fas
o
Camer
oon
China
Cote
d'Ivo
ire
DR Con
go
Ethio
pia
Ghana
Haiti
Indo
nesia
Kenya
Mad
agas
car
Mala
wiM
ali
Mau
ritan
ia
Mor
occo
Nepal
Rwanda
Seneg
al
South
Afri
ca
Ugand
a
Iron content by country of purchaserelative to the WFP SuperCereal+ benchmark
05
10
15
20
Zin
c co
nten
t (m
g/10
0g d
ry m
atte
r)
Benin
Botsw
ana
Burkin
a Fas
o
Camer
oon
China
Cote
d'Ivo
ire
DR Con
go
Ethio
pia
Ghana
Haiti
Indo
nesia
Kenya
Mad
agas
car
Mala
wiM
ali
Mau
ritan
ia
Mor
occo
Nepal
Rwanda
Seneg
al
South
Afri
ca
Ugand
a
Zinc content by country of purchaserelative to the WFP SuperCereal+ benchmark

For now:Results from 109 products in 22 countries
Energy density depends mainly on fat content
02
04
06
08
01
00
380 400 420 440 460Energy density (kcal/100g dry matter)
Fat content (g/100g dry matter) Protein content (g/100g dry matter)Carbohydrate content (g/100g dry matter)
Macronutrients by level of energy densityrelative to WFP SuperCereal+ benchmark levels

For now:Results from 109 products in 22 countries
For zinc and iron, both typically fall below international standards0
51
01
52
0Z
inc
cont
ent (
mg/
100g
dry
ma
tter)
0 20 40 60Iron content (mg/100g dry matter)
Zinc content by level of iron contentrelative to WFP SuperCereal+ benchmark levels

Packaging lists the product’s energy content for 75 products in 18 countries
Actual energy content often exceeds labelled energy, and varies less3
003
504
004
505
00A
ctua
l en
erg
y d
ensi
ty (
kca
l/10
0g
300.00 350.00 400.00 450.00Labeled energy density (kcal/100g)
Energy density by labeled value
Note: the WFP’s SuperCereal Plus has minimum energy content of 410 kcal/100g
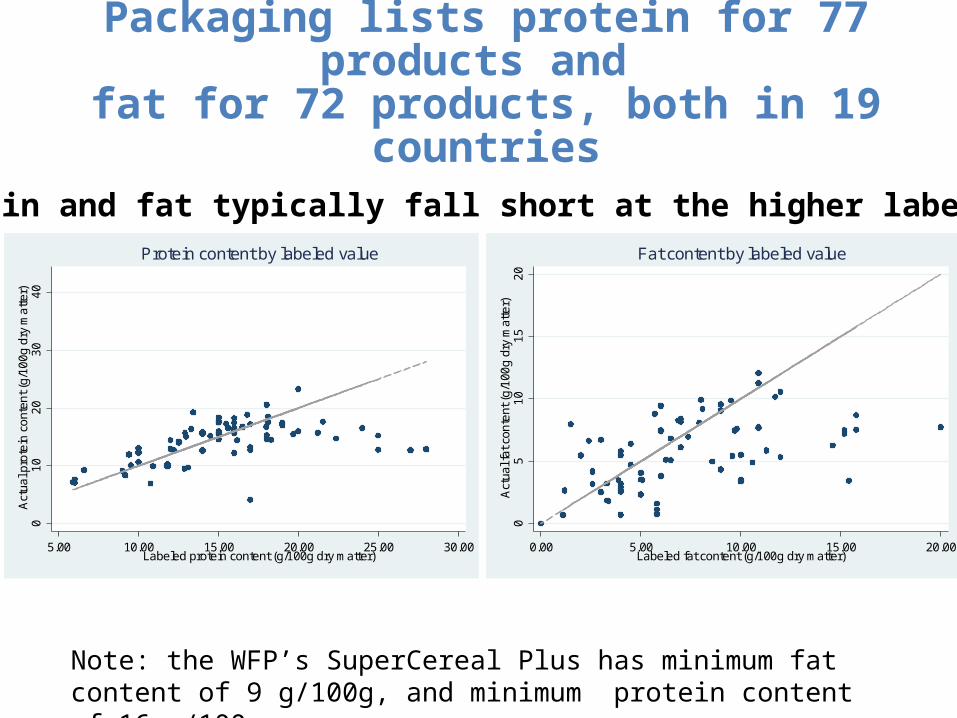
Packaging lists protein for 77 products and fat for 72 products, both in 19 countries
Both protein and fat typically fall short at the higher labeled values
01
02
03
04
0A
ctua
l pro
tein
co
nten
t (g/
100g
dry
ma
tter)
5.00 10.00 15.00 20.00 25.00 30.00Labeled protein content (g/100g dry matter)
Protein content by labeled value
05
10
15
20
Act
ual f
at c
onte
nt (
g/1
00g
dry
mat
ter)
0.00 5.00 10.00 15.00 20.00Labeled fat content (g/100g dry matter)
Fat content by labeled value
Note: the WFP’s SuperCereal Plus has minimum fat content of 9 g/100g, and minimum protein content of 16 g/100g.
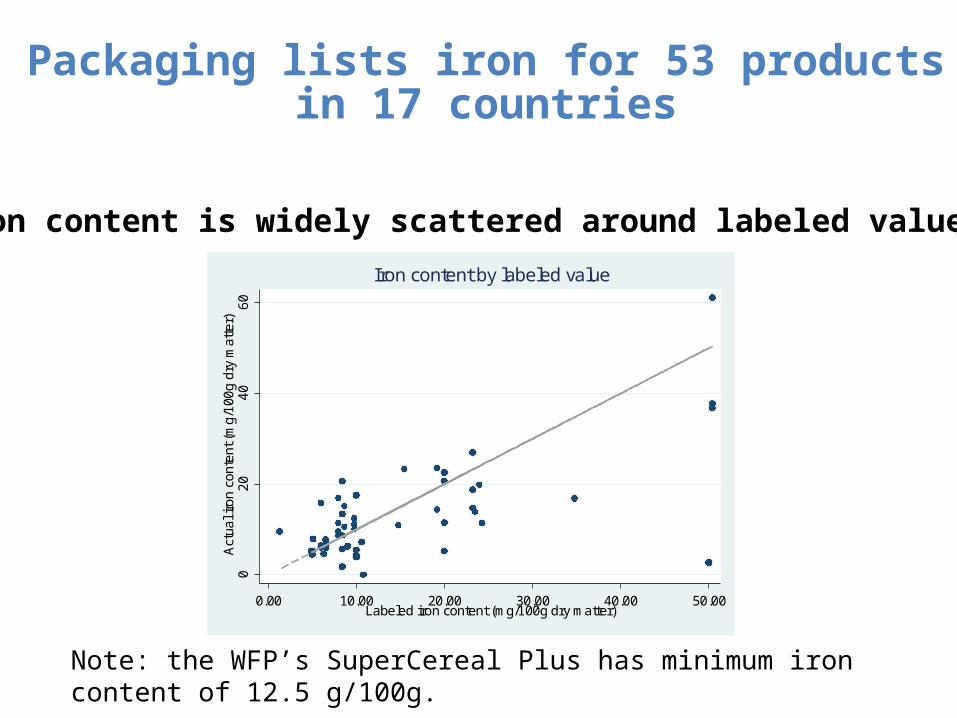
Packaging lists iron for 53 products in 17 countries
Iron content is widely scattered around labeled values
Note: the WFP’s SuperCereal Plus has minimum iron content of 12.5 g/100g.
02
04
06
0A
ctua
l iro
n co
nte
nt (
mg
/100
g dr
y m
atte
r)
0.00 10.00 20.00 30.00 40.00 50.00Labeled iron content (mg/100g dry matter)
Iron content by labeled value

To remedy this market failure, would need quality assuranceIts effectiveness could be measured by an RCT:1) Establish an Infant Nutrition Quality Assurance Project (INQAP)2) Recruit manufacturers to participate, and issue time limited
INQAP-OK stickers3) Roll out billboards and demonstrations at randomly-chosen
market locations4) Use household surveys and growth monitoring to track food
purchases & infant bodyweights5) Use child’s age at the time of market advertisements to identify
causal effect of certification on growth
but they usually don’t
Conclusions: These products can have adequate nutrients

AcknowledgementsFor funding: USAID, for an International Food Policy Research Institute
Linkage Grant and the Feed the Future Nutrition Innovation Lab.
For samples: Ambroise Agbota, Jean-Paul Anoh, Mahaman Bamba, Aaron Cheng, Gnangbo Christian, Amelia Darrouzet-Nardi, Claude Emile, Issa Fadiga, Matt Hazel, Dorothy Nzembi Kimanthi, Yolande Kouame, Emmanuel Kouame, Rachid Laajaj, Perrine Loock, Janeen Madan, Will Masters, Menno Mulder-Sibanda, Fatouman Ouattara, Galase Ramolefhe, Marianne Santoso and Robin Shretha.
For testing: Midwest Labs, Omaha.
Thank you!