Embed Size (px)
Citation preview
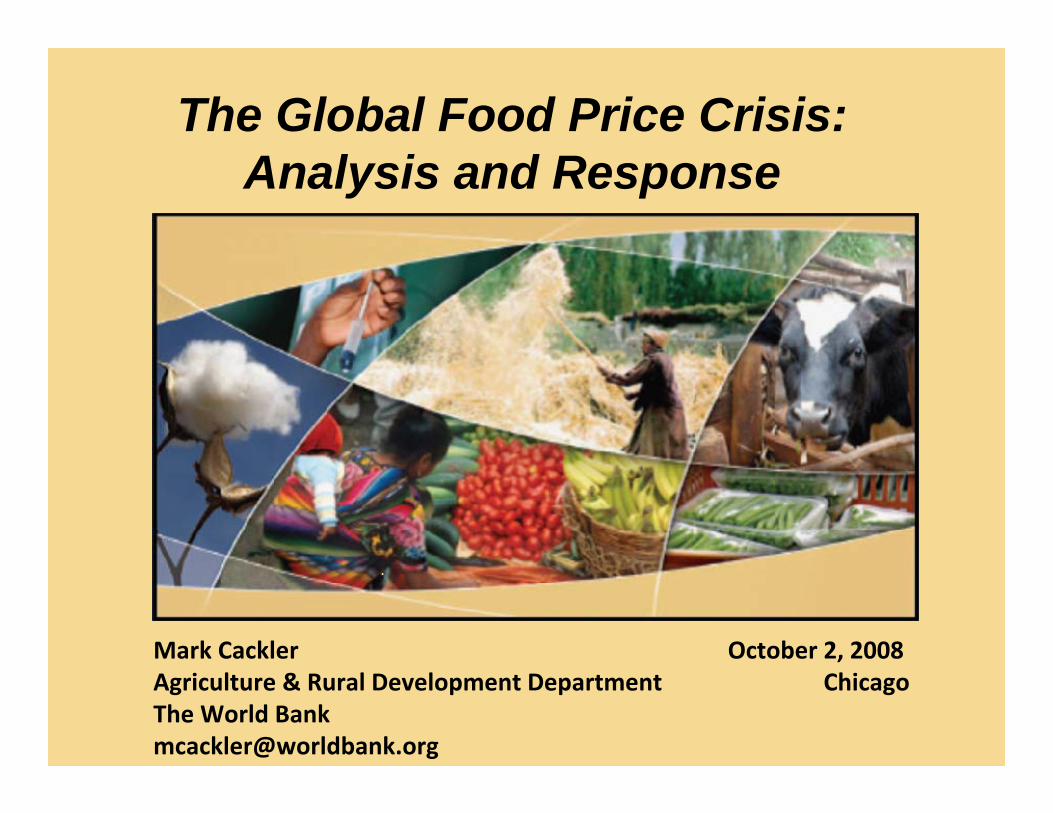
The Global Food Price Crisis: Analysis and Response
Mark Cackler October 2, 2008Agriculture & Rural Development Department ChicagoThe World [email protected]

World Development Report 2008:75% of the world’s poor are rural and most are involved in farming. In the 21st century agriculture remains fundamental for poverty reduction, economic growth and environmental sustainability.
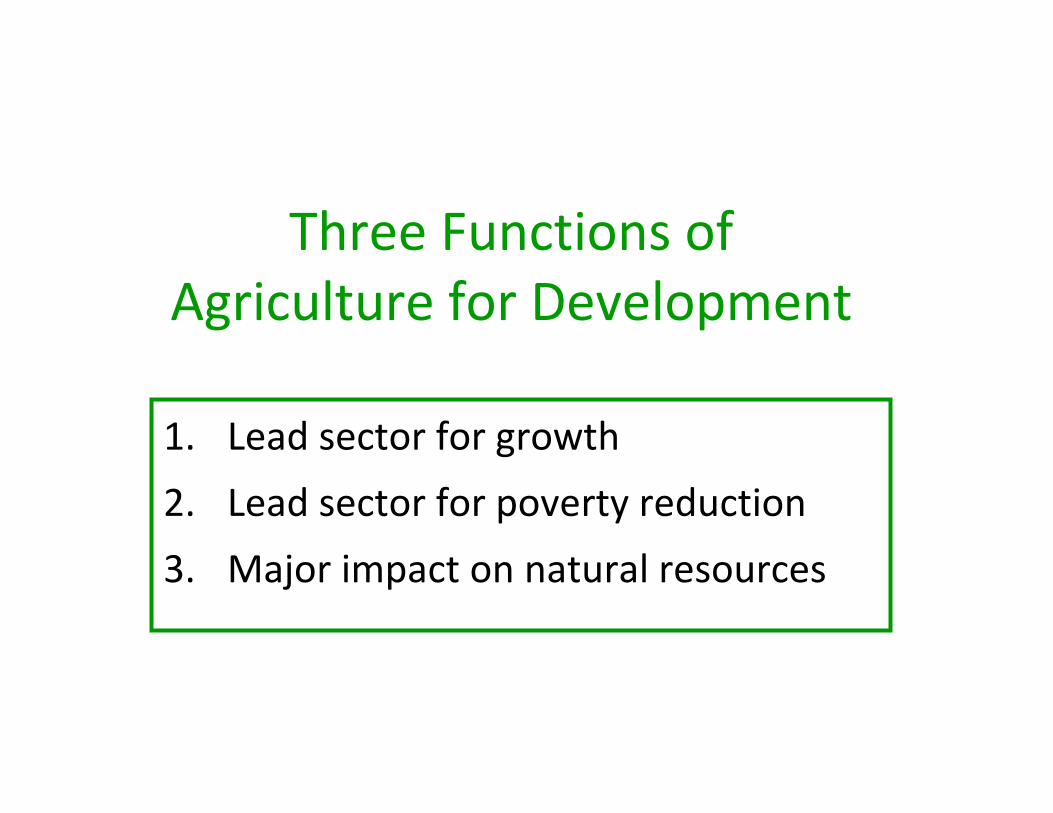
Three Functions of Agriculture for Development
1. Lead sector for growth
2. Lead sector for poverty reduction
3. Major impact on natural resources

4
2.3
3.33.5
0.0
0.5
1.0
1.5
2.0
2.5
3.0
3.5
4.0
1980-1990 1990-2000 2000-2005
Ave
rage
ann
ual r
eal a
gric
ultu
ral g
row
th(%
)
– Large sector for GDP growth– Affordable food and wage competitiveness– Comparative advantage in trade– Strong growth linkages
1. A source of economic growth
Accelerating agricultural growth in AfricaAccelerating agricultural growth in Africa
The Millennium Development Goals cannot be met without higher agricultural productivity, especially in Africa
The Millennium Development Goals cannot be met without higher agricultural productivity, especially in Africa

– 2.5 billion people depend directly on agriculture
– 800 m smallholders
– 75% of poor are rural and the majority will be rural to about 2040
Global extreme poverty 2002, $1.08 a dayGlobal extreme poverty 2002, $1.08 a day
GlobalUrban poor
287 mill. South Asia rural 407 mill.
Sub-SaharanAfrica rural
229 mill.
East Asia rural
218 mill.LAC rural27 mill.
ECA rural5 mill.
MENA rural5 mill.
2. Poverty reduction

6
Agriculture
Non-agriculture-2
0
2
4
6
8
Low est 2 3 4 5 6 7 8 9 Highest
Expenditure deciles
Expe
nditu
re g
ains
indu
ced
by 1
%
GD
P gr
owth
(%)
GDP growth from agriculture benefits the income of the poor 2-4 times more than
GDP growth from non-agriculture (43 countries)
GDP growth from agriculture benefits the income of the poor 2-4 times more than
GDP growth from non-agriculture (43 countries)
Growth from agriculture is especially effective for poverty reduction

7
Many Opportunities:Sustainable farming systems and
environmental services(conservation farming, agroforestry,
managing landscapes for climate resilience)
Many Opportunities:Sustainable farming systems and
environmental services(conservation farming, agroforestry,
managing landscapes for climate resilience)
3. A source of environmental sustainability
Important user of natural resources: 75% of fresh water resources40% of land area21+ % of greenhouse gas emissions
Contributions to greenhouse gas emissions
Developing country
agriculture & deforestation
21%
Developing country
other sources
15%
Industrialized countries
64%

8
Traditional exports
Meat
Horticulture
0
50
100
150
200
250
300
350
1980 1990 2000 2004
Val
ue o
f exp
orts
(198
0=10
0)
0
50
100
150
200
250
1981 1984 1987 1990 1993 1996 1999 2002
Kca
l con
sum
ptio
n/ca
pita
/day
(1
981=
100)
Changing diets ̶ a new agriculture of high value products and non‐traditional exports
Developing country exports
Developing country consumption
Agriculture for Development: Improved Opportunities
Meat
Cereals
Horticulture

9
• Technological innovations: – Intensification technologies, e.g. conservation farming,
precision farming, improved and resilient varieties –NERICA rice, Bt cotton
– Information technology
• Risk management innovations (weather insurance)• Stronger producer organizations • Public-private-civil society partnerships
Agriculture for Development: Improved Opportunities

10
Real international commodity prices have been suppressed by current global trade
policies (% of price)
Trade share losses to developing countries due to current global trade policies
(% point loss to developing country trade shares)
Global trade distortions remain pervasive
-3
-4
-4
-5
-7
-12
-15
-21
Sugar
Rice
Processed meat
Wheat
Other grains
Dairy products
Oilseed
Cotton
But Major Challenges…
-9
-2
-18
-21
-5
-7
-34
-27
Sugar
Rice
Processed meat
Wheat
Coarse grains
Dairy products
Oilseed
Cotton

11
Increasing land and water constraints
LACECA
MENA
EAP
SA
SSA
0
20
40
60
80
100
120
140
160
180
1961
1967
1973
1979
1985
1991
1997
2003
Inde
x of
cro
plan
d pe
r ag
popu
latio
n (1
961=
100)
-
10
20
30
40
50
60
70
SSA SA EAP MENA ECA LAC
Perc
ent
(%)
% of population in absolute water scarcity
Cropland per capita of agricultural population
Challenges

12
Challenges
• Making growth pro-poor– Connecting smallholders to new markets
– Improving assets of the poor, especially women
• Weaknesses in governance– New state roles, coordination, decentralization
– Global governance issues (trade, standards, animal health, biodiversity, climate change, donor support)

13
Agricultural‐based countries spend too little on agriculture (and R&D)
Ag GDP/GDP
29
16
10
0
5
10
15
20
25
30
35
Agriculture-based Transforming Urbanized
perc
ent
0
2
4
6
8
10
12
14
Agriculture based Transforming Urbanized
perc
ent
Public Spending on Ag (% of Ag GDP)Spending on Ag R&D (% of Ag GDP)
Challenges

14
0
1
2
3
4
5
6
7
1975-79 1980-84 1985-89 1990-94 1995-99 2000-02
Per
cent
of A
g. G
DP
“Misinvestment” is also pervasive
Subsidies
Public Investment
Challenges

ChallengesRising rural-urban disparities
1
1.5
2
2.5
3
3.5
Gua
tem
ala
1989
-200
2
Thai
land
1990
-200
2
Cam
bodi
a19
97-2
004
Chi
na
19
85-2
001
Vie
tnam
1992
-200
1
Indo
nesi
a19
93-2
002
Ban
glad
esh
1991
-200
0
Indi
a
1989
-199
9
Paki
stan
1999
-200
1
Rat
io o
f ur
ban
to r
ural
med
ian
inco
me
Initial year End year

16
-102030405060708090
100
1990 1992 1994 1996 1998 2000 2002 2004
% p
over
ty in
rur
al a
reas
0
2
4
6
8
10
12
14
% O
DA
to a
gric
ultu
re
Donor support to agriculture
% rural poverty
% ODA to Ag
Challenges

Early 1980s
Early 1990s
Early 2000s
Official development assistance (ODA): 17%
World Bank lending: 30%
Official development assistance (ODA): 12%
World Bank lending: 15%
Official development assistance (ODA): 4%
World Bank lending: <10%…but overall ODA has not recovered
World Bank lending is recovering …..
Donor Support to Agriculture1980‐2007

OFFICIAL DEVELOPMENT
ASSISTANCE
(12% in 1990)
PUBLIC SPENDING(Sub-Saharan Africa)
AGRICULTURE
4%
RURAL
75%
AGRICULTURE
4%
Challenges
WORLD POOR

So, what should we do?1. Accelerate smallholder productivity increases for
agricultural growth and food security in Africa
2. Follow a comprehensive approach to reduce sectoral disparities and poverty in transforming countries of Asia
3. Enhance sustainability and environmental services from agriculture
4. Pursue multiple pathways out of poverty: smallholder farming, labor market, rural non‐farm employment, migration
5. Improve the quality of governance in agriculture at local, national, and global levels

WDR recommendations on “hot topics”
• Trade liberalization must progress – with attention to transitional issues in developing countries
• Subsidies can be used – with attention to market development and equity
• GMOs have unrealized potential for the poor –with attention to bio-safety
• Biofuels will be important – but need more productive and sustainable technologies
• Climate change requires urgent attention–both adaptation and mitigation

Food Prices: Why the alarm?
• Rising food prices risk losing recent gains in reducing malnutrition. Malnutrition threatens this ‐‐ and future ‐‐ generations.
• Already hunger and malnutrition are the underlying causes of death of over 3.5 million children every year.
• Not a temporary phenomenon – high food prices are expected to stay high in the medium term (above 2004 levels through to 2015).

Why have food prices risen?‐‐Demand
Fundamentals -Supply and
Demand
Sustained food demand from emerging markets (of the 73 million net additional persons in the global population each year, 97.5% are in developing countries)Diet changes, from grain to more diversified diet, meats and dairy with higher derived demand for grains and oilseedsBiofuel mandates => demand shift, particularly in the United States (corn-based ethanol), and Europe (rapeseed for biodiesel), Argentina (soybeans for biodiesel)
Figure 1. Food prices (Nominal $ Index, Jan 1995=100)
0
50
100
150
200
250
Jan-95 Jan-97 Jan-99 Jan-01 Jan-03 Jan-05 Jan-07
Source: DECPG

Why have food prices risen?‐‐Supply• Competition for land from biofuels, esp. in OECD
• Increasing production costs, sharply increasing costs of energy, transport, and fertilizer
• Drought, flooding, pests and disease in key grain regions, these shocks are hard to deal with when stocks are low
• Disappearance due to policy reforms of stabilizing sales from large intervention stocks in USA and EU that had been built up to support producer prices

Food Prices: Major Policy Messages
• Avoid short‐term policies to short‐term food insecurity that have difficult longer‐term implications
• Short‐run policies require planning exit strategies in advance
• Different countries need different policies, depending on:– institutions, capacity– governance requirements – size of country and history of trade, etc.
• Promote longer‐term agricultural growth

Food Prices: Short‐Run Options
• Reduce Food Grain Taxes/Tariffs • School Feeding Programs• Conditional Cash Transfers to the Poor• Targeted Food Subsidies• Cash for Work • Food for Work and Food Aid• Build‐up Government Buffer Stocks for
Distribution• Food Rationing • Price Controls • Export Restrictions/Taxes• Export Bans Worse policy choices
Better policy choices

Food Prices: International Action
Finance Ministers at the April 2008 World Bank‐IMF Spring Meetings endorsed a “new deal” for a global food policy to embrace a short, medium and long‐term response:
• Support for safety nets • Work and conditional cash transfer programs• Increased agricultural productivity• Better understanding of the impact of biofuels• Action on the trade to reduce distorting subsidies and trade barriers

Food Prices: World Bank Group Action• With UN system and others, identifying countries most in need and provide rapid assessments, concessional financing and support
• Supporting World Food Programme call for $755 million in emergency assistance
• Closely coordinating with the UN Task Force on the Global Food Crisis
• Investing in Policy and Analytical Work and encouraging constructive policy responses in rich and poor countries
• Analyses to better understand impact of biofuels• Policy reforms to reduce protectionism• Gender impact• Nutrition impacts

Food Prices: World Bank Group Action• Global Food Crisis Response Program: An umbrella for providing rapid Bank support for a comprehensive response to the crisis– Provides balance between short run food stabilization and measures to ensure countries able to cope better in medium term
– Facilitates adaptation to new realities of high and more volatile food prices
• In parallel, increase longer term action and lending to enhance agricultural productivity
• Work with CGIAR for major scale‐up of agriculture research

GFRP: Menu of Program Components
• Component 1: Food price policy and market stabilization– Examples: Support for grain stock management, improved use of market‐based
instruments to manage food prices, tax and trade policies
• Component 2: Social protection actions to ensure food access and minimize the nutritional impact of the crisis on the poor and vulnerable
– Examples: Conditional cash transfer program, food stamps, school feeding, targeted food supplements and micronutrients
• Component 3: Enhancing domestic food production & marketing response
– Examples: Seed and fertilizer supply and market development, Rehabilitation of small‐scale irrigation, Strengthening access to finance and risk management tools
• Component 4: Implementation support, communications and monitoring and evaluation

World Bank lending for food and agriculture since April 2008
US$ million, over 5 months
214365939582271160Total
5555Global
2576012017168SAR
643830230MNA
23813616112748LCR
393219836598ECA
361790056226EAP
7757204439620AFR
GrandTotalIFC
SocialRiskMitiga‐
tion
Nutri‐tion& FoodSecurity
SocialSafetyNets
Agricult‐ureRegion
31

Examples of GFRP projects
• Reduction in food prices through trade and tax policy measures (reduction or suspension of import tariffs, domestic taxes, etc): Djibouti, Haiti, Madagascar, Burundi, Sierra Leone, Guinea
• Social protection programs and emergency interventions: Djibouti, Haiti, Madagascar, Burundi, Honduras
• Support to agricultural production: Madagascar, Rwanda, Honduras
32

Examples of GFRP projects
• Social protection including school feeding, cash for work, nutrition, health, and cash transfers: Liberia, Sierra Leone, Kyrgyz Rep., Tajikistan, Moldova and others
• Agriculture including seeds, fertilizers, rehabilitation of irrigation infrastructure, livestock and post‐harvest infrastructure: Liberia, Kyrgyz Rep., Tajikistan, Afghanistan, Somalia and others
33

Results to date• In Djibouti and Burundi grant funding has supported the suspension of tariffs/taxes on basic food staples; consumers have benefited from lower food prices
• In Rwanda, $10 million grant has helped fill an unanticipated financing gap; this was critical to being able to import sufficient fertilizer and also helped maintain the Govt’s overall reform program, including a more private sector oriented fertilizer distribution system
34

Results to date
• In Liberia, support to pre‐school and primary school feeding programs, and to provide rations for pregnant and lactating women
• In Kyrgyz Republic, provision of seeds and fertilizers and training, and mobilization of community seed‐funds
35

Global food prices: recent trends and outlook
• International food prices are declining, but likely to remain high relative to 2004 levels– Between June and August 2008, maize prices fell by 11%; rice by 8%; wheat by 6%
• But…….. Domestic prices have not declined to the same extent as international prices in many countries – Food price inflation remains very high (92% in Ethiopia, 22.5% in Liberia, 23.7% in Togo, 76.4% in Afghanistan)
36

Global food prices: recent trends and outlook
• Fertilizer prices continue to surge upwards, despite recent declines in energy and natural gas prices
• Increased volatility in food prices anticipated, as grain stocks are still at record lows– FAO estimates that grain stocks will be 3.8% higher than in 2007, but global stocks will still be very low
• Biofuel policies and high energy prices likely to keep grain & oilseed prices high for years– 70% of increase in global grain production from 2004‐2007 went for ethanol in US
– Biodiesel will use 9 million tons of vegetable oils (7% of global supplies)
37

Fiscal impacts of high food prices
• The fiscal cost of responses to higher food and fuel prices is more than 1% of GDP for more than 20 poor countries
• Most highly vulnerable poor countries have little or no debt headroom to increase borrowing & aid is the only remaining option to handle the fiscal cost of twin shocks
• In the absence of larger aid flows, poor countries will divert fiscal resources from growth‐enhancing expenditures in infrastructure, health, education and other social sectors
38

75% of the world’s poor are rural and most are involved in farming. In the 21st century agriculture remains fundamental for poverty reduction, economic growth and environmental sustainability.
www.worldbank.org/wdr2008 www.worldbank.org/ardwww.worldbank.org/html/extdr/foodprices/