Embed Size (px)
Citation preview

The global
economic impact
of anti-microbial
resistance
KPMG LLP
11 December 2014
www.kpmg.co.uk
ABCD
The global economic impact of anti-microbial resistance
KPMG LLP
1
© 2014 KPMG LLP, a UK limited liability partnership and a member firm of the KPMG network of independent member firms affiliated with KPMG International Cooperative (“KPMG International”),
a Swiss entity. All rights reserved.
Readers of this report may copy and use this report or extracts from it, provided that the following
acknowledgement is included:
Extracted from a report prepared by KPMG LLP in the UK, derived from research commissioned by
the Wellcome Trust, as part of an independent review into anti-microbial resistance supported by the
Department of Health and the Wellcome Trust.

ABCD
The global economic impact of anti-microbial resistance
KPMG LLP
2
© 2014 KPMG LLP, a UK limited liability partnership and a member firm of the KPMG network of independent member firms affiliated with KPMG International Cooperative (“KPMG International”),
a Swiss entity. All rights reserved.
Contents
1 Executive summary 3
2 Preface and acknowledgements 6
3 Introduction 7
3.1 Main objectives 7
3.2 Further areas to explore 7
4 Analysis 10
4.1 Methodology 10
4.2 Data 19
4.3 Assumptions and limitations of the analysis 22
5 Health impacts of AMR 24
5.1 Current health impact 24
5.2 Current financial impact 28
5.3 Future AMR scenarios 28
6 Potential future economic impact of AMR 30
6.1 Economic impact with constant infection rates 30
6.2 Economic impact with doubling infection rates 31
7 Conclusions 34
8 Annex: Key statistics for 156 countries 35

ABCD
The global economic impact of anti-microbial resistance
KPMG LLP
3
© 2014 KPMG LLP, a UK limited liability partnership and a member firm of the KPMG network of independent member firms affiliated with KPMG International Cooperative (“KPMG International”),
a Swiss entity. All rights reserved.
1 Executive summary
There has been increasing concern about the harm anti-microbial resistance (AMR) could cause to
people and to the world economy, with rising AMR levels partially exacerbated by the overuse of
antibiotics.
This report aims to quantify some of the consequences of higher AMR levels, looking at the impact
different AMR scenarios could have on the economies of 156 countries by 2050. Economic impact
was captured through an increased level of mortality and some of the estimated rise in morbidity and
their impact on GDP, as a result of a smaller labour force and lower productivity respectively.
Given the complexity involved in estimating the full impact of AMR, the analysis was limited to a
selection of three bacteria and three diseases with reasonable incidence and coverage and with
relevant available data. These were Staphylococcus aureus (best known in its methicillin resistant
form – MRSA), Escherichia coli (widely known as E. coli), and Klebsiella pneumoniae, HIV,
Tuberculosis and Malaria.
The analysis also excluded a noteworthy part of the effect of morbidity and other secondary health
effects, as well as wider economic effects from the analysis. As a result, projections in this report are
likely to underestimate the full impact.
Economic impact projections used four potential AMR scenarios:
■ Scenario A - an absolute increase in current rates of resistance by 40%
■ Scenario B - 100% resistance rate applied across all countries
■ Scenario C - Doubling of current infection rates for the three bacteria, HIV and Tuberculosis, and
an absolute rise in current rates of resistance by 40%
■ Scenario D - Doubling of current infection rates for the three bacteria, HIV and Tuberculosis, and
100% resistance rate in all countries
ABCD
The global economic impact of anti-microbial resistance
KPMG LLP
4
© 2014 KPMG LLP, a UK limited liability partnership and a member firm of the KPMG network of independent member firms affiliated with KPMG International Cooperative (“KPMG International”),
a Swiss entity. All rights reserved.
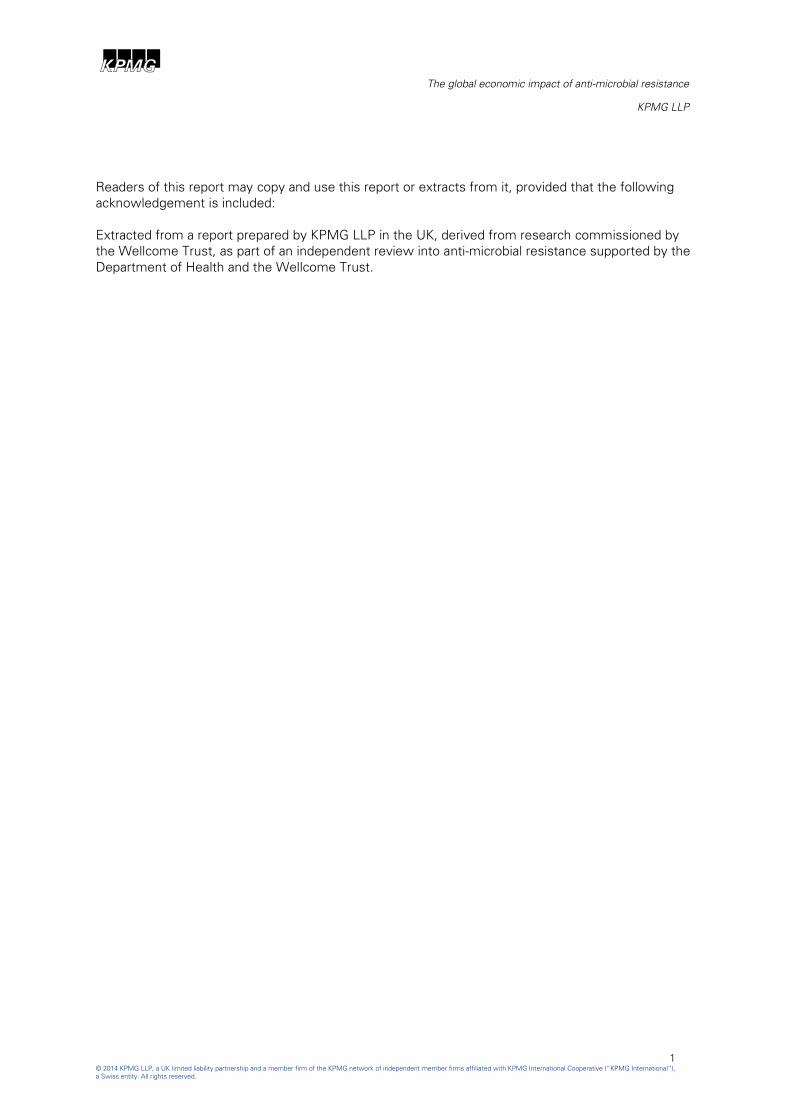
The impact on world population is expected to be significant, with world population projected to be
lower by just under 700 million in Scenario D in 2050, as highlighted in Chart 1 below.
Chart 1: Estimated reduction in world population in 2050 under each scenario
Source: KPMG analysis
Scenario D is projected to cause world GDP to be $US14,228 billion lower in 20501 as highlighted in
Chart 2 below, the equivalent of more than the whole economies of China, Russia and India wiped
out together based on their current size, or the whole continent of Africa disappearing based on its
projected size in 2050 in our baseline scenario. The largest relative economic impact is projected to
be suffered by Africa with a fall in GDP of US$2,895 billion in 2050 in Scenario D, representing 20%
of the region’s total economic output.
Chart 2: Potential loss in GDP under different scenarios in 2050
Source: KPMG analysis
1 Measured in 2013 US$.
0
0.2
0.4
0.6
0.8
A B C D
Po
pula
tio
n (billions), 2
050
Difference vs m
ain
scenario
Europe Africa LATAM Asia MENA North America
0
5000
10000
15000
AB
CD
2013U
S$bn
Europe Africa LATAM Asia MENA North America
ABCD
The global economic impact of anti-microbial resistance
KPMG LLP
5
© 2014 KPMG LLP, a UK limited liability partnership and a member firm of the KPMG network of independent member firms affiliated with KPMG International Cooperative (“KPMG International”),
a Swiss entity. All rights reserved.
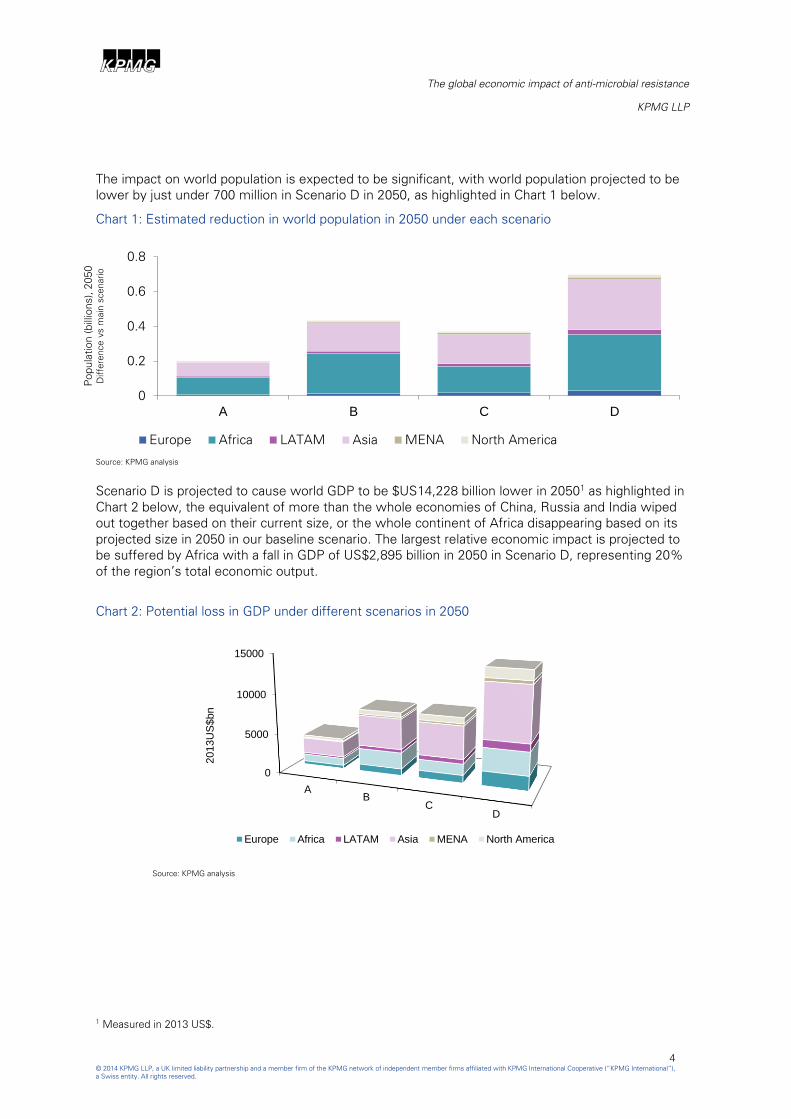
The impact of higher AMR is unlikely to be spread equally, with those more vulnerable likely to pay
the highest price, as low income countries suffer the biggest proportionate loss of population and
economic output.
As highlighted in Chart 3 below, Africa is projected to be significantly affected by our most severe
AMR scenario, Scenario D, followed by Asia. World GDP is projected to be 6.08% lower in 2050 in
this scenario, and variations in loss are projected to be large.
Chart 3: Potential loss in GDP in Scenario D; % fall compared to baseline scenario in 2050
Source: KPMG analysis
The rise in AMR and its potential real damage to society and to the world economy should encourage
the development of new antibiotics and increase efforts to ensure future social and economic
impacts are minimised.
Key: <5 5-10 >10

ABCD
The global economic impact of anti-microbial resistance
KPMG LLP
6
© 2014 KPMG LLP, a UK limited liability partnership and a member firm of the KPMG network of independent member firms affiliated with KPMG International Cooperative (“KPMG International”),
a Swiss entity. All rights reserved.
2 Preface and acknowledgements
In 1945 Alexander Fleming received the Nobel Prize for the invention of Penicillin, the world’s first
antibiotic. During his acceptance speech, Fleming warned of the dangers that bacteria could evolve
and may with time become resistant to Penicillin and render the drug ineffective. Almost seventy
years on, with multiple different types of antibiotics now in existence, Fleming’s warnings are being
fully realised. The world has not created a novel class of antibiotics in more than 25 years, and
bacteria are becoming increasingly resistant to those that exist. As this publication goes on to discuss
there is a real danger that the world may soon face a situation where antibiotics fail, people die of
what are currently considered mild infections and that routine operations can no longer take place.
In July of this year the British Prime Minister established the Anti-Microbial Resistance Review (the
“Review”) to examine ways to reduce anti-microbial resistance (AMR); this is co-funded by the UK
Government and the Wellcome Trust. The Review has a global outlook and seeks to examine how
the world as a whole can deal with AMR. It is investigating ways to improve the drug pipeline in order
to facilitate the creation of new, more effective antibiotics, to examine the best ways to conserve
existing antibiotics and decrease unnecessary resistance building up. Its recommendations are
independent of both the UK Government and the Wellcome Trust.
The Anti-Microbial Resistance Review commissioned KPMG to carry out research into the potential
global economic impact of AMR.
Acknowledgements
We are very grateful to the following organisations for their invaluable contributions to the analysis:
■ European Centre for Disease Prevention and Control
■ World Health Organisation
■ Centres for Disease Control and Prevention
■ London School of Hygiene and Tropical Medicine
■ University College London Hospitals
■ Public Health England
■ UK Department of Health
■ Wellcome Trust
■ People’s Hospital, Peking University, Beijing
■ University of Sao Paulo
■ Federal University of Rio Grande Sol and Rio de Janeiro
■ Brazilian Ministry of Health
■ ANVISA – Brazilian Health Surveillance Agency
■ KPMG in Australia
■ KPMG in South Africa
■ KPMG in India
■ KPMG in China
■ KPMG in Brazil

ABCD
The global economic impact of anti-microbial resistance
KPMG LLP
7
© 2014 KPMG LLP, a UK limited liability partnership and a member firm of the KPMG network of independent member firms affiliated with KPMG International Cooperative (“KPMG International”),
a Swiss entity. All rights reserved.
3 Introduction
AMR is becoming a growing health issue on a global scale.
AMR is the natural process of bacteria and other infectious agents adapting to the antibiotics treating
them, which causes antibiotics to have a limited effective lifespan and requires new antibiotics to be
developed in order to successfully treat resistant agents.
Over the past few decades we have witnessed an increase in AMR levels, partially exacerbated by
overuse of antibiotics.
At the same time, a shortage of new antibiotics arriving in the market is leading to microbial
resistance which causes relatively minor and common infections to inflict increasing harm on our
society and on the global economy.
3.1 Main objectives
Rising resistance levels across the world represent real costs to society.
Loss of life and reduced quality of life, as a result of more prolonged and more severe illnesses, will
exert a toll on societies across the world. At the same time, a reduced labour force, together with
potential measures to contain infections through diminished cross-border movements, could see
economic output significantly curtailed. As AMR rises, additional changes to behaviours and practices
are likely to emerge, which will impact our way of life, welfare and wealth.
It is important to understand the scale of AMR’s threat so measures can be taken to combat it before
it escalates further. However, given that the impact of AMR on society is potentially vast and diverse
assessing the overall impact of AMR is highly complex.
This report aims to quantify some of the consequences of rising AMR. It focuses on a number of key
bacteria and diseases affected by AMR and looks at the economic impact on 156 countries that
different AMR scenarios could have as a result of increased mortality levels reducing each country’s
labour force and productivity.
Estimations in this report therefore only capture some of the impacts AMR could have on the world
economy and its citizens. The full impact is likely to be far higher.
3.2 Further areas to explore
3.2.1 Coverage of microbial causes of disease
The analysis focused on three bacteria with resistance to specific antibiotics:
■ Staphylococcus aureus which is a bacteria that can cause disease, particularly if there is an
opportunity for the bacteria to enter the body. It can cause mild to life-threatening illnesses such
as wound infections, joint infections, pneumonia and blood stream infections. Methicillin resistant
Staphylococcus aureus (MRSA) is a particularly difficult to treat infection.
■ Escherichia coli (better known as E. coli) is a bacteria that normally lives in the intestines. Some
types can cause intestinal infections leading to diarrhoea, abdominal pain and fever. More severe
cases can lead to bloody diarrhoea, dehydration and kidney failure.

ABCD
The global economic impact of anti-microbial resistance
KPMG LLP
8
© 2014 KPMG LLP, a UK limited liability partnership and a member firm of the KPMG network of independent member firms affiliated with KPMG International Cooperative (“KPMG International”),
a Swiss entity. All rights reserved.
■ Klebsiella pneumoniae is a bacteria that can cause different types of infections, including
pneumonia, bloodstream infections, wound or surgical site infections, and meningitis.
In addition, the following well known and widespread diseases were also covered:
■ Human Immunodeficiency Virus (HIV), that causes the acquired immunodeficiency syndrome
(AIDS), a condition in humans in which progressive failure of the immune system allows life-
threatening opportunistic infections and cancers to thrive.
■ Tuberculosis (TB), a widespread and in many cases fatal infectious disease caused by various
strains of mycobacteria. TB typically attacks the lungs but can also affect other parts of the body.
■ Malaria, a mosquito borne infectious disease caused by parasitic protozoan which can cause
fever, fatigue, vomiting, headaches and is sometimes fatal.
This selection was based on the availability of current AMR rates and infection rates.
Further analysis, as data becomes available, could incorporate all possible global microbial causes of
disease and resistance to their treatments.
3.2.2 Secondary healthcare costs
The analysis outlined in this report focused on the changes to each country’s GDP based on the
changes to productivity and to its labour force as a result of varying AMR rates.
With continued rising AMR there may develop a future scenario where the risk of developing an
infection, which is untreatable due to AMR, during an elective healthcare treatment outweighs the
risk of not having the treatment in the first place. That is, it may be ‘safer’ to live with a managed
longer term morbidity than to risk an operation if the chance of developing an untreatable resistant
infection is high. These secondary effects, if they materialise, could significantly add to health costs
through prolonged treatment costs and further reduce future GDP as more people are unable to
work.
An increase in AMR may also change the supply and demand of healthcare across high, middle, and
low income countries.

ABCD
The global economic impact of anti-microbial resistance
KPMG LLP
9
© 2014 KPMG LLP, a UK limited liability partnership and a member firm of the KPMG network of independent member firms affiliated with KPMG International Cooperative (“KPMG International”),
a Swiss entity. All rights reserved.
Chart 4 below provides an example of an elective treatment in a high income country, with the
following potential impact:
Chart 4: Supply and demand effects of increase in AMR
■ Changes in demand: the decision node at point A represents the decision to undertake surgery
or to accept a permanent level of discomfort and morbidity. As AMR increases, an increased
number of patients is expected to decide against surgery. All other things being equal, rates of
morbidity are expected to rise within the community as a result.
■ Changes in supply: the decision node at point B represents the decision to have a traditional
operation or an innovative operation such as laparoscopic surgery, which involves a lower risk of
infection. Point C would have an increased risk of infection compared to point D, and therefore as
AMR increases the number of innovative surgeries and other alternative treatments are expected
to rise.
3.2.3 Economic impact
The analysis captures the impact of increased AMR on the labour force and human capital, and the
consequent effect on economic output under alternative AMR scenarios.
Other economic relationships are likely to be affected by the AMR scenarios, which have not been
modelled here due to the complexity involved and the uncertain nature and scale of the behaviours
that increased AMR levels could trigger.
These include changes in trade and cross border transit patterns, as well as potential local
substitution effects in production.

ABCD
The global economic impact of anti-microbial resistance
KPMG LLP
10
© 2014 KPMG LLP, a UK limited liability partnership and a member firm of the KPMG network of independent member firms affiliated with KPMG International Cooperative (“KPMG International”),
a Swiss entity. All rights reserved.
4 Analysis
The analysis in this report looks to capture the impact AMR could have on the world economy.
Given the complexities involved, the impact measured was limited to the three key bacteria and three
major diseases listed above, which are likely to be globally affected by rising AMR levels.
The analysis captured the impact increased levels of mortality could have on world GDP levels
through their effect on the labour force and productivity, but excluded potential additional effects as a
result of changes in behaviours and practices, such as potential reduced trade and cross border
transit.
As such, estimates published in this report are likely to underestimate the total impact AMR could
have on the world economy.
As part of the analysis, data was collected from a variety of sources to capture the current global
prevalence of AMR, and future AMR scenarios were then developed in consultation with experts in
order to capture the potential future AMR paths to 2050.
Future AMR scenarios were then transformed into alternative labour force scenarios which were
incorporated into a long term global economic growth model to arrive at long term GDP projections
for 156 countries under different AMR scenarios.
4.1 Methodology
The approach used to capture the global impact of AMR on the global economy involved four phases:
■ Assessment of the current health costs associated with AMR
■ Estimation of potential future AMR scenarios
■ Analysis of the potential impact AMR scenarios could have on productivity
■ Projections of long term economic growth under the different AMR scenarios
The first two phases centred on the health costs associated with AMR, and focused primarily on the
change in mortality levels expected under each scenario. These estimates were transformed into
adjusted labour force projections for each country.
The second part of the analysis, comprising phases 3 and 4 above, looked to translate the health
costs of AMR in terms of increased mortality into economic impact.
The results of the analysis comprise projections of GDP to 2050 in 156 countries. These outline the
impact the different AMR scenarios could have on the world economy, as well as on individual
regions and countries.
A more detailed description of the methodology used in this analysis is presented below.
ABCD
The global economic impact of anti-microbial resistance
KPMG LLP
11
© 2014 KPMG LLP, a UK limited liability partnership and a member firm of the KPMG network of independent member firms affiliated with KPMG International Cooperative (“KPMG International”),
a Swiss entity. All rights reserved.
4.1.1 Capturing AMR impact on health
Infectious diseases are one of the main causes of death globally and the development of resistance
to certain infectious disease treatments compounds this issue, with increasing AMR being seen
globally for many diseases.
In order to assess the economic impact of AMR, its health impact was estimated through rising
global mortality rates under possible future scenarios of increased AMR.
The analysis presented in this report centred on three bacteria and related antibiotics, using data
provided by the European Centre for Disease Prevention and Control (ECDC) and the World Health
Organisation (WHO):
■ Staphylococcus aureus resistance to Methicillin, commonly known as Methicillin resistant
Staphylococcus aureus (MRSA)
■ Escherichia coli resistance to third generation Cephalosporins
■ Klebsiella pneumoniae resistance to third generation Cephalosporins
Reflecting the global nature of this analysis, the following diseases were also incorporated into the
assessment, due to the high rate of mortality and in particular resistance to treatments of these
diseases in low and middle income countries:
■ Malaria
■ HIV
■ Tuberculosis
Mortality calculations
Estimations of mortality were carried out using total number of estimated infections in each country
and multiplying those by countries’ resistance rates, which resulted in an estimated number of
infections that are resistant to treatment.
An adjustment rate, representing attributable mortality rate was then applied to determine patient
mortality per country of those patients with resistance to the treatment.
Chart 5: Mortality calculations
Infection scenarios
An anti-microbial database2 was used as part of the analysis. It provides data on the number of
infections and level of AMR for all countries within the EU, Norway and Iceland. The data was
available for a range of bacteria and a corresponding antibiotic for which the bacteria may have a level
of resistance. The laboratories in the countries providing information to the database serve a variety
of health-care institutions (e.g. university or specialised hospitals; general and district hospitals;
2 ECDC, Antimicrobial resistance interactive database, 2012.
# Infections Resistance rate Attributable
mortality rate Mortality
ABCD
The global economic impact of anti-microbial resistance
KPMG LLP
12
© 2014 KPMG LLP, a UK limited liability partnership and a member firm of the KPMG network of independent member firms affiliated with KPMG International Cooperative (“KPMG International”),
a Swiss entity. All rights reserved.
rehabilitation centres; nursing homes). However, sample sizes and coverage vary considerably
between countries, with the latest available data from 2012.
Data from the database on the number of bloodstream infections for the bacteria and antibiotic group
of interest was extracted.
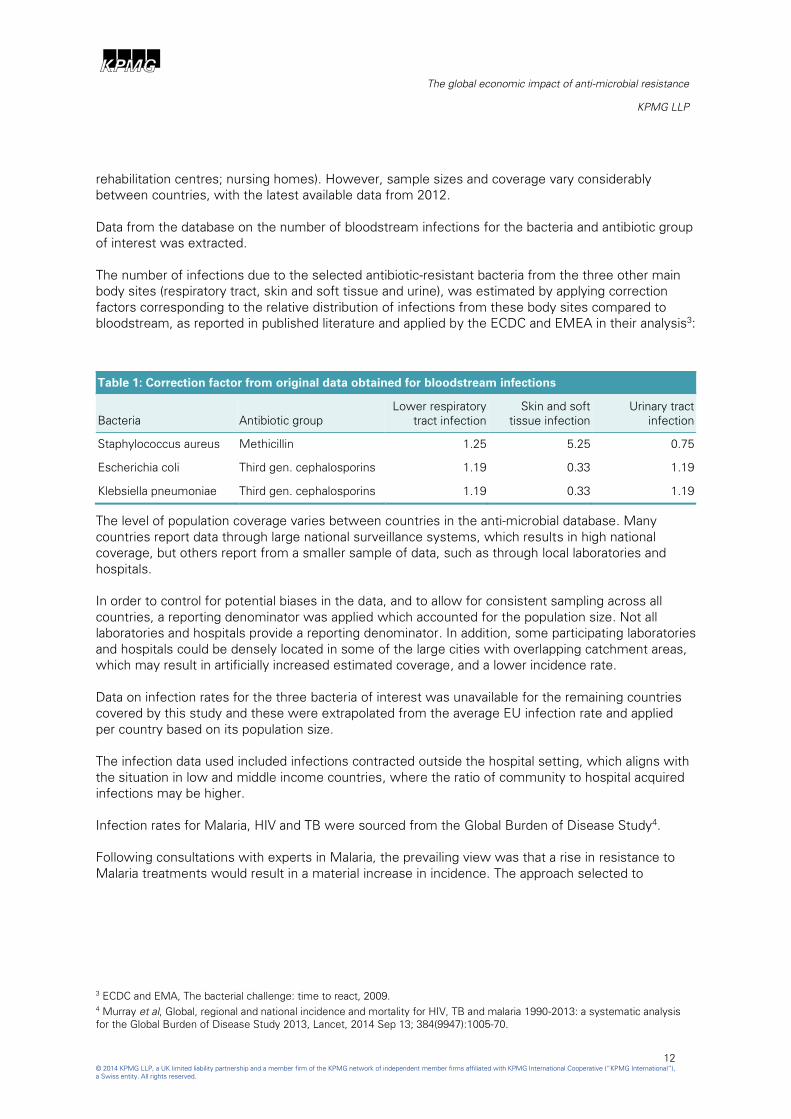
The number of infections due to the selected antibiotic-resistant bacteria from the three other main
body sites (respiratory tract, skin and soft tissue and urine), was estimated by applying correction
factors corresponding to the relative distribution of infections from these body sites compared to
bloodstream, as reported in published literature and applied by the ECDC and EMEA in their analysis3:
Table 1: Correction factor from original data obtained for bloodstream infections
Bacteria Antibiotic group
Lower respiratory
tract infection
Skin and soft
tissue infection
Urinary tract
infection
Staphylococcus aureus Methicillin 1.25 5.25 0.75
Escherichia coli Third gen. cephalosporins 1.19 0.33 1.19
Klebsiella pneumoniae Third gen. cephalosporins 1.19 0.33 1.19
The level of population coverage varies between countries in the anti-microbial database. Many
countries report data through large national surveillance systems, which results in high national
coverage, but others report from a smaller sample of data, such as through local laboratories and
hospitals.
In order to control for potential biases in the data, and to allow for consistent sampling across all
countries, a reporting denominator was applied which accounted for the population size. Not all
laboratories and hospitals provide a reporting denominator. In addition, some participating laboratories
and hospitals could be densely located in some of the large cities with overlapping catchment areas,
which may result in artificially increased estimated coverage, and a lower incidence rate.
Data on infection rates for the three bacteria of interest was unavailable for the remaining countries
covered by this study and these were extrapolated from the average EU infection rate and applied
per country based on its population size.
The infection data used included infections contracted outside the hospital setting, which aligns with
the situation in low and middle income countries, where the ratio of community to hospital acquired
infections may be higher.
Infection rates for Malaria, HIV and TB were sourced from the Global Burden of Disease Study4.
Following consultations with experts in Malaria, the prevailing view was that a rise in resistance to
Malaria treatments would result in a material increase in incidence. The approach selected to
3 ECDC and EMA, The bacterial challenge: time to react, 2009.
4 Murray et al, Global, regional and national incidence and mortality for HIV, TB and malaria 1990-2013: a systematic analysis
for the Global Burden of Disease Study 2013, Lancet, 2014 Sep 13; 384(9947):1005-70.
ABCD
The global economic impact of anti-microbial resistance
KPMG LLP
13
© 2014 KPMG LLP, a UK limited liability partnership and a member firm of the KPMG network of independent member firms affiliated with KPMG International Cooperative (“KPMG International”),
a Swiss entity. All rights reserved.
approximate this effect was to model some convergence in current incidence rates within
geographical regions.
Countries were grouped into the following regions:
■ Middle East and North Africa (MENA)
■ Africa (excluding North Africa)
■ Europe
■ North America
■ Latin America
■ Southern, South-Eastern and Eastern Asia, together with Oceania
■ Central Asia
Those countries whose current incidence rate was lower than their region’s average were assigned
the population weighted average for each region.
Countries whose current incidence rate was higher than the average in their region kept their current
incidence level unchanged.
The regional convergence-based incidence rate for Malaria was applied to all countries with lower
current incidence rate than their region’s average across the four scenarios.
For the three bacteria, HIV and Tuberculosis, future infection scenarios were modelled as:
■ Current rates of infections remain constant to 2050
■ Doubling of current infection rates for the three bacteria, HIV and TB between 2014 and 2050
Resistance rate scenarios
Latest available resistance rates for the bacteria and antibiotic combinations for the EU, Norway and
Iceland were obtained from ECDC database5. Resistance rates for the same bacteria and antibiotic
combinations for the remaining countries were obtained from the WHO6. In those countries where
data on the resistance rate was unavailable, a simple average for the region was assumed.
The current multi-drug resistance rates for TB per world region was sourced from the WHO TB
Database7. The current Artemisinin resistance rates for Malaria was sourced from published literature
and is confined to certain countries in South East Asia and Africa8. The current antiretroviral
resistance rates for HIV was informed by the WHO HIV drug resistance report9.
5 ECDC, Antimicrobial resistance interactive database, 2012.
6 WHO, Anti-microbial Resistance Global Report on Surveillance, 2014.
7 WHO, Tuberculosis database, 2011.
8 Ashley et al, Spread of Artemisinin Resistance in Plasmodium falciparum Malaria. N Engl J Med 2014; 371:411-423.
9 WHO, HIV drug resistance report, 2012.

ABCD
The global economic impact of anti-microbial resistance
KPMG LLP
14
© 2014 KPMG LLP, a UK limited liability partnership and a member firm of the KPMG network of independent member firms affiliated with KPMG International Cooperative (“KPMG International”),
a Swiss entity. All rights reserved.
Future AMR resistance scenarios were modelled as:
■ an increase in current rates of resistance by 40%
■ 100% resistance rate across all countries
These scenarios were applied across the bacteria and diseases covered by the analysis to represent a
medium and high change in resistance rates globally. Scenarios were partially based on examples of
countries with current resistance rates that are already at similar levels, implying that as global AMR
increases, these could apply in all countries across the world.
For simplicity the resistance rate was assumed to be constant for each of the different future
scenarios as they are extrapolated through to 2050. Future scenarios therefore assumed a sharp
initial rise of resistance which remained at the new level up to 2050.
Attributable mortality rate
Attributable mortality applied in this analysis corresponds to the percentage of deaths that are
attributable to infection which is resistant to treatment as compared with infection with a susceptible
infection when all other causes of death have been controlled for.
Attributable mortality rate was applied to estimates of the number of bacterial infections in order to
estimate the number of extra deaths due to the antibiotic resistant bacteria analysed. It was sourced
from ECDC/EMEA10
:
Table 2: Attributable mortality rate
Bacteria Antibiotic group
Bloodstream
infections
Lower
respiratory
tract infection
Skin and soft
tissue
infection
Urinary tract
infection
Staphylococcus aureus Methicillin 9.8% 7.0% 1.4% 0.2%
Escherichia coli Third gen. cephalosporins 30% 21% 4% 1%
Klebsiella pneumoniae Third gen. cephalosporins 30% 21% 4% 1%
Attributable mortality rates per world region used for TB AMR were sourced from WHO11
and shown
in Table 3 below:
Table 3: Attributable mortality rates for resistance to TB treatment
Africa 28.3%
America 15.9%
Eastern Mediterranean 20.1%
Europe 23.9%
South East Asia 25.4%
Western Pacific 16.3%
10 ECDC and EMA, The bacterial challenge: time to react, 2009.
11 WHO, Tuberculosis database, 2011.

ABCD
The global economic impact of anti-microbial resistance
KPMG LLP
15
© 2014 KPMG LLP, a UK limited liability partnership and a member firm of the KPMG network of independent member firms affiliated with KPMG International Cooperative (“KPMG International”),
a Swiss entity. All rights reserved.
For Malaria, attributable mortality due to resistance was applied based on consultation with experts,
allowing for a fatality rate for those with malaria of 1.5% to be used in the analysis.
For HIV, attributable mortality due to resistance was consulted with relevant experts, and a rate of
15% was applied in the analysis.
Short term morbidity
Short term morbidity resulting from AMR was estimated as the extra length of hospital stay. An
adjustment factor to the total number of AMR infections was applied in order to estimate this effect.
The extra length of hospital stay for each infection was estimated as the difference between average
length of stay for patients infected with bacteria that are resistant to the antibiotic, and patients
infected with bacteria that are not resistant to the antibiotic.
Chart 6: Short term morbidity calculations
The extra length of hospital stay was calculated allowing for other factors affecting length of hospital
stay and varied depending on the main body sites where infection occurred (i.e. blood stream,
respiratory tract, skin and soft tissue, or urine). It was sourced from ECDC/EMEA12
.
Table 4: Extra length of hospital stay in days
Bacteria Antibiotic group
Bloodstream
infections
Lower
respiratory
tract
infection
Skin and soft
tissue
infection
Urinary tract
infection
Staphylococcus aureus Methicillin 8.0 9.4 5.0 6.1
Escherichia coli Third gen. cephalosporins 11.0 11.0 11.0 11.0
Klebsiella pneumoniae Third gen. cephalosporins 11.0 11.0 11.0 11.0
Due to limited availability of data, analysis focused on the three bacteria analysed and covered only
the EU, Iceland and Norway.
Financial impact of AMR
As resistance rates increase, the burden on health systems is expected to increase globally through
efforts to treat those with resistance, with associated additional treatments costs, emanating from
expensive alternative treatments, increased use of combination therapy and increased length of stay
in hospital.
12 ECDC and EMA, The bacterial challenge: time to react, 2009.
# Infections Resistance rate Extra length of
hospital stay
Short term
morbidity
ABCD
The global economic impact of anti-microbial resistance
KPMG LLP
16
© 2014 KPMG LLP, a UK limited liability partnership and a member firm of the KPMG network of independent member firms affiliated with KPMG International Cooperative (“KPMG International”),
a Swiss entity. All rights reserved.
The costs are likely to vary depending on the structure of the health system in each country, with the
largest impact expected in high income countries where health treatment costs are higher and more
patients are expected to be covered by the formal health system.
In this report, the costs due to additional hospital stay in high income countries was estimated by
applying the average cost of a hospital day in Europe to the extra length of hospital stay due to
resistance to treatments for the three bacteria analysed.
4.1.2 Capturing AMR impact on economic output
The analysis looked to capture the impact anti-microbial resistance would have on economic output
through changes in productivity as well as changes to the size of the labour force.
Production function
Projections of real economic output to 2050 under the different AMR scenarios were prepared using
a production function approach.
Under this approach, GDP at PPP (Y) was modelled as a function of inputs of capital (K) and labour (L)
and a residual scale factor (A), also referred to as Total Factor Productivity (TFP).
In this model human capital was included in the determinants of TFP, rather than as a distinct input
alongside capital and labour, or as a labour-augmenting factor. TFP was therefore adjusted within the
Life Expectancy category to reflect the AMR scenarios as outlined above.
The production function used in the analysis was of the standard Cobb-Douglas form, which imposes
constant returns to scale, with ∝=1/3:
Y=AK∝ L
1-∝
This can be rewritten in terms of labour and the capital-output ratio as follows:
Y=(A(K⁄Y)∝
)1/1-∝
L
Historical data on capital stocks at PPP was obtained from the Penn World Table (PWT). Some
datasets absent from the PWT were estimated by using IMF data on gross capital formation,
accounting for depreciation based on data from a comparator country.
The future evolution of countries’ capital stock was modelled in terms of the capital-output ratio (K/Y).
In line with other studies, no systematic relationship was found between this ratio and the level of
GDP per capita or per worker. The K/Y ratio was therefore projected on the basis of the recent level
and trend in the ratio for each country, with the trend component declining to zero in the first ten
years of the projection period and the K/Y ratio stabilising after that point. K/Y ratios in 2013 ranged
from 1.1 at the 5th percentile to 5.0 at the 95th, with a median of 3.1 and a mean of 3. The
distribution over the projection period was slightly narrower.
Average long-term growth for the US economy was projected at 2.1%, based on examination of US
historical TFP and economic growth. US TFP was projected accordingly.
Projections of TFP of the other countries were modelled as a process of convergence towards that of
the US, where the speed of convergence was based on the 2013 TFP scores generated by the TFP
model, with a fixed effect included to represent specific factors affecting different country groups.

ABCD
The global economic impact of anti-microbial resistance
KPMG LLP
17
© 2014 KPMG LLP, a UK limited liability partnership and a member firm of the KPMG network of independent member firms affiliated with KPMG International Cooperative (“KPMG International”),
a Swiss entity. All rights reserved.
Total GDP was then projected according to the output equation, incorporating the projected values
for the capital-income ratio, labour, and TFP score under each scenario.
Productivity
Productivity was modelled using a Total Factor Productivity (TFP) model, which captured key
productivity drivers grouped into five pillars:
■ Macroeconomic stability
■ Economy’s openness to catch up in technology and best practice
■ Quality of infrastructure
■ Human capital
■ Strength of public institutions
Each pillar included data on key areas affecting business and economic performance, as outlined in
Table 5 below:
Table 5: Components of the TFP model
Weights used to aggregate the series, sub-series and pillars were derived from the results of
econometric analysis in conjunction with results of previous studies and business surveys output.
The life expectancy series in the TFP model was used as a proxy to measure the physical quality of
human capital. Adjustments were made to each country’s life expectancy score in order to account
for a deterioration in the physical quality of human capital as a result of a more elevated incidence of
AMR. The adjustment to TFP’s life expectancy data was done in the following way:
For each country i a yearly additional mortality due to AMR was calculated at 𝑚𝑖, while the life
expectancy was 𝐿𝑖.
Probability of survival to the age of L was therefore calculated as:
(1 − 𝑚𝑖)𝐿𝑖

ABCD
The global economic impact of anti-microbial resistance
KPMG LLP
18
© 2014 KPMG LLP, a UK limited liability partnership and a member firm of the KPMG network of independent member firms affiliated with KPMG International Cooperative (“KPMG International”),
a Swiss entity. All rights reserved.
While the probability of not surviving to the age of L was:
1 − (1 − 𝑚𝑖)𝐿𝑖
It was assumed that the expected age at death from an AMR disease was distributed evenly over the
lifetime of the individual so the expected age at death was 𝐿𝑖
2.
Therefore, the new life expectancy, AdjL, was given by:
𝐴𝑑𝑗𝐿𝑖 = [1 − (1 − 𝑚𝑖)𝐿𝑖]
𝐿𝑖
2+ (1 − 𝑚𝑖)
𝐿𝑖𝐿𝑖
This simplifies to:
𝐴𝑑𝑗𝐿𝑖 = [1 + (1 − 𝑚𝑖)𝐿𝑖]
𝐿𝑖
2
𝑚𝑖 was adjusted to reflect the four AMR scenarios, producing a separate life expectancy estimate for
each scenario.
Two key assumptions were made in calculating AMR’s impact on life expectancy:
■ L is non-stochastic, implicitly assuming that people in a country with expectancy L all live to L
years and then die; unless AMR is present and they die before reaching L. The effect of this
assumption is difficult to evaluate.
■ expected age at death from AMR was L/2. This arrived at an estimated age that may be too low in
a number of countries, as the elderly generally face higher risks from disease.
However, the estimations above did not take directly into account the increased rates of morbidity
due to elevated resistance rates, with higher rates of anti-microbial resistance also likely to reduce
the working life of individuals in affected economies, which will serve to reduce the quality of human
capital and therefore act in the opposite direction.
Labour force
The remaining impact on the economy was modelled through a change in the labour force.
Labour input, both historical and projected to 2050 under our main scenario, was based on the
working age population (15-64), and was sourced from the UN. Current total population figures and
projections were also taken from this source.
In order to assess the effect of AMR on the economic output of a country, the labour force was
adjusted in line with the mortality rate of the country due to AMR.
Projections of both the labour force and the total population used in the base scenario were therefore
adjusted as follows:
𝐴𝑑𝑗𝐿𝐹𝑖,𝑡 = 𝐿𝐹𝑖,𝑡(1 − 𝑚𝑖,𝑡)𝑡
𝐴𝑑𝑗𝑃𝑖,𝑡 = 𝑃𝑖,𝑡(1 − 𝑚𝑖,𝑡)𝑡
Where LF represents the labour force, P population, and 𝑚𝑖,𝑡 mortality rate.

ABCD
The global economic impact of anti-microbial resistance
KPMG LLP
19
© 2014 KPMG LLP, a UK limited liability partnership and a member firm of the KPMG network of independent member firms affiliated with KPMG International Cooperative (“KPMG International”),
a Swiss entity. All rights reserved.
4.2 Data
4.2.1 Desk based review
An extensive desk based review of current literature on the healthcare aspects of AMR across high,
medium, and low income countries was carried out in order to identify prevalence, epidemiology,
resistance rates and care costs.
This included use of the KPMG global network to access information on projects relating to AMR
surveillance systems. A number of countries have surveillance programmes in place, however these
seem limited to higher income countries.
Key reports summarising European and global AMR rates, along with infection rates in some
instances, were identified:
ECDC and EMA Joint Technical Report13
The report gives an account of the data that would allow reasonable predictions of the gap between
bacterial resistance in the EU and the likely availability of new treatments that would be effective
against multidrug resistant bacteria in the near future. It utilises data from the European Anti-
microbial Resistance Surveillance System (EARSS) to calculate current resistance rates and
prevalence of pathogenic infections.
WHO anti-microbial resistance report14
The report examines, for the first time, the current status of surveillance and information on AMR, in
particular anti-bacterial resistance, at a country level worldwide. The report provides information
primarily for public health policy makers and managers, and for the wider medical and public health
community, as a support for informing strategic actions and programme planning.
Global, regional and national incidence and mortality for HIV, TB and malaria15
The study provides a consistent and comprehensive approach to disease estimation for 1990-2013,
and an opportunity to assess whether accelerated progress has occurred since the Millennium
Declaration.
4.2.2 Expert input
Where data was not available through desk based research, in particular on global infection rates for
the bacteria selected, specific requests were made for data from relevant experts in some of the
larger economies.
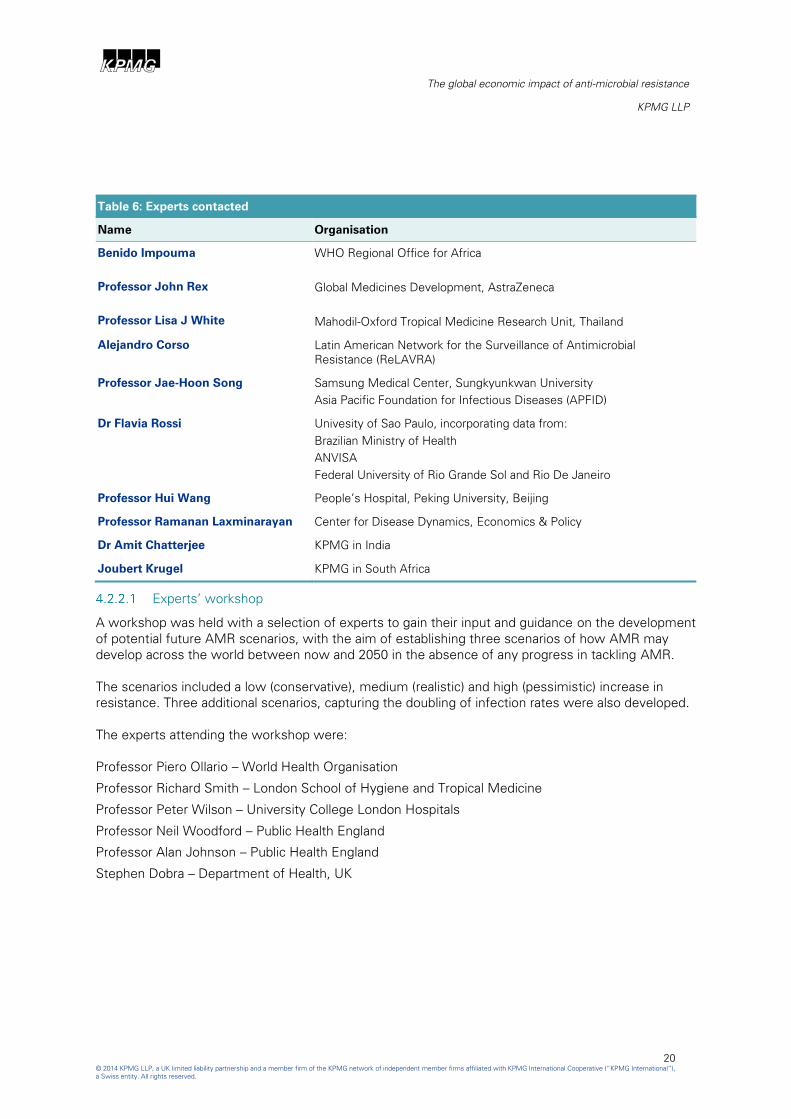
Table 6 lists the experts contacted in order to inform estimates of current impact and to provide input
on the suitability of the proposed future AMR scenarios, including verification of infection rates,
attributable mortality, and average length of hospital stay for patients with resistance. The information
received is outlined in section 4.2.3.
13 ECDC and EMA, The bacterial challenge: time to react, 2009.
14 WHO, Anti-microbial Resistance Global Report on Surveillance, 2014.
15 Murray et al, Global, regional and national incidence and mortality for HIV, TB and malaria 1990-2013: a systematic analysis
for the Global Burden of Disease Study 2013, Lancet, 2014 Sep 13; 384(9947):1005-70.
ABCD
The global economic impact of anti-microbial resistance
KPMG LLP
20
© 2014 KPMG LLP, a UK limited liability partnership and a member firm of the KPMG network of independent member firms affiliated with KPMG International Cooperative (“KPMG International”),
a Swiss entity. All rights reserved.
Table 6: Experts contacted
Name Organisation
Benido Impouma
Professor John Rex
Professor Lisa J White
WHO Regional Office for Africa
Global Medicines Development, AstraZeneca
Mahodil-Oxford Tropical Medicine Research Unit, Thailand
Alejandro Corso Latin American Network for the Surveillance of Antimicrobial
Resistance (ReLAVRA)
Professor Jae-Hoon Song Samsung Medical Center, Sungkyunkwan University
Asia Pacific Foundation for Infectious Diseases (APFID)
Dr Flavia Rossi Univesity of Sao Paulo, incorporating data from:
Brazilian Ministry of Health
ANVISA
Federal University of Rio Grande Sol and Rio De Janeiro
Professor Hui Wang People’s Hospital, Peking University, Beijing
Professor Ramanan Laxminarayan Center for Disease Dynamics, Economics & Policy
Dr Amit Chatterjee KPMG in India
Joubert Krugel KPMG in South Africa
Experts’ workshop
A workshop was held with a selection of experts to gain their input and guidance on the development
of potential future AMR scenarios, with the aim of establishing three scenarios of how AMR may
develop across the world between now and 2050 in the absence of any progress in tackling AMR.
The scenarios included a low (conservative), medium (realistic) and high (pessimistic) increase in
resistance. Three additional scenarios, capturing the doubling of infection rates were also developed.
The experts attending the workshop were:
Professor Piero Ollario – World Health Organisation
Professor Richard Smith – London School of Hygiene and Tropical Medicine
Professor Peter Wilson – University College London Hospitals
Professor Neil Woodford – Public Health England
Professor Alan Johnson – Public Health England
Stephen Dobra – Department of Health, UK

ABCD
The global economic impact of anti-microbial resistance
KPMG LLP
21
© 2014 KPMG LLP, a UK limited liability partnership and a member firm of the KPMG network of independent member firms affiliated with KPMG International Cooperative (“KPMG International”),
a Swiss entity. All rights reserved.
4.2.3 Countries and regions focus
We conducted additional desk based research to uncover more detailed information and experiences
encountered in some of the larger low and middle income countries.
Brazil
The experts contacted from Brazil confirmed that the scenarios developed for the analysis would be
relevant to Brazil due to the prevalence of AMR being a global concern. According to Flávia Rossi16
Brazil, and Latin American countries more generally, have higher levels of bacterial resistance among
most of the key bacteria compared with Europe and the United States, particularly among non-
fermentative gram-negative bacilli and extended-spectrum β-lactamase (ESBL)–producing
Enterobacteriaceae, but also among some gram-positive organisms (including Staphylococcus
aureus).
According to data from 201017
, Brazil is facing an increase in infections caused by Klebsiella
pneumoniae, with the overall 30-day mortality rate being 42% in 201018
and the average length of
stay in hospital for those with resistance between eight and 14 days19
.
The first five Staphylococcus aureus that were resistant to vancomycin were found in Brazil in 201020
.
Rates of MRSA were up to 60% and were related to an endemic Brazilian clone. Infections caused by
MRSA were no longer unique issues associated with the hospital environment and were becoming a
growing problem in the Brazilian community. To date, the risk factors associated with MRSA
infections have not fully been established in the community and the influx of outpatients in health
facilities could affect in-hospital epidemiology of this bacteria.
The scarcity of prevalence studies is a limiting factor of knowledge of local epidemiology or deaths
related to community acquired MRSA. An important aspect that can facilitate knowledge of the
existence of these circulating strains is the laboratory cultivation of infections of skin and soft tissue
in primary care. Due to scarcity of data, there were no data available on cases of MRSA being
currently treated in Brazil.
China
Information on China was provided by Professor Wang21
. Professor Wang explained that AMR was a
large issue in China and outlined some of the resistance rates they were experiencing:
■ Escherichia coli: 60~70% resistance rate to third generation cephalosporins. 70% resistant to
Fluoroquinolones.
■ Klebsiella pneumoniae: 40% resistance rate to third generation cephalosporins. 30% resistant to
Fluoroquinolones, 10% to carbapenem.
16 Flávia Rossi, Pathology Department, DLC_LIM 03, Hospital das Clínicas da Universidade de São Paulo, São Paulo, Brazil.
17 Source: ANVISA.
18 M.D. Bergamasco et al, Infection with Klebsiella pneumoniae carbapenemase (KPC)-producing K. pneumoniae in solid organ
transplantation, 2012.
19 Source: ANVISA.
20 See Note 13 above.
21 Professor Wang, Director of Clinical Lab, People’s Hospital, Peking University.
ABCD
The global economic impact of anti-microbial resistance
KPMG LLP
22
© 2014 KPMG LLP, a UK limited liability partnership and a member firm of the KPMG network of independent member firms affiliated with KPMG International Cooperative (“KPMG International”),
a Swiss entity. All rights reserved.
■ MRSA accounted for 46.9% of all the Staphylococcus aureus. The prevalence of MRSA in
abdominal infections (55.2%) and respiratory infections (54.4%) were higher than that in blood
stream infections (35.0%).
Professor Wang confirmed that the AMR future scenarios used in this analysis would be relevant to
China and stated that unfortunately no data was available for the current infection rates of these
bacteria in China, nor the average length of stay in hospital for those with AMR.
The attributable mortality rate for patients with AMR for each of these bacteria was not specifically
available but generally, the overall mortality is 20-30%, with some higher than 50%. This would
support the use of the attributable mortality values applied in this analysis, as shown in section
4.1.1.4, and may even underestimate the situation globally.
India
Experts contacted22
stated that AMR was a very sensitive issue in India and data availability across
hospitals may not be complete and therefore impossible to comprehensively collate. However,
estimations were provided based primarily on experience in the field. Experts were unable to
comment on the current infection rates in India but did add that the majority of Gram negative
infections were contributed by Escherichia coli, Klebsiella pneumoniae and Acinetobacter. While
Staphylococcus infections were generally seen in the hospital setting and in skin and soft tissue
infections from the community.
In terms of resistance, a high level of resistance in Klebsiella to third 3rd generation cephalosprins
and even carbapenems have been detected. The projected resistance rates for Escherichia coli to 3rd
generation cephalosporins and fluoroquinolones in India appeared reasonable as per the data outlined
in the proposed scenarios in the analysis, although these rates may be even higher in hospital
settings.
The prevalence of MRSA in hospitals vary from 25 – 60%. Moreover, there was preponderance of
infections due to Gram negatives in the hospitalised patients. Gram positives were more common in
skin and soft tissue infections from the community. Not much population based studies were
available regarding community acquired MRSA.
This information from India would seem to support the choice of bacteria in this analysis and their
resistance to treatments applied globally.
4.3 Assumptions and limitations of the analysis
This report presents best-efforts estimates of the health and economic effects of rising AMR levels.
It is likely that any such exercise will necessarily involve large margins of error due to limitations in
data surveillance and availability of relevant country level information.
The projections in this report are subject to considerable uncertainty arising from the problems
outlined in this report and also due to the unusually high degree of uncertainty associated with the
future path of AMR rates, combined with the response from society and the development of
22 Provided by Dr Amit Chatterjee, KPMG India, in consultation with other local health experts.

ABCD
The global economic impact of anti-microbial resistance
KPMG LLP
23
© 2014 KPMG LLP, a UK limited liability partnership and a member firm of the KPMG network of independent member firms affiliated with KPMG International Cooperative (“KPMG International”),
a Swiss entity. All rights reserved.
technology. For this reason, the margins of error associated with these projections are inevitably
large and therefore should be read and interpreted accordingly.
4.3.1 Data availability
The availability of infection data for the bacteria and diseases covered in this report was dependent
on surveillance structures that are in place in each country.
There was a particular lack of data for infection rates in low and middle income countries for the
bacteria selected and where this was the case, following the literature review and engagement of
sector experts, the European average infection rates was applied to countries where specific data
was not available.
As part of the scenarios, two alternative scenarios were modelled incorporating a doubling of current
infection rates, which served to mitigate somewhat the uncertainties emanating from lack of current
infection data in some of the countries.
4.3.2 Development of new anti-microbial medicines
Future AMR scenarios used in the analysis included an assumption that no further development of
new anti-microbial drugs would take place between now and 2050.
The development of new effective anti-microbial treatments would allow for a decreased future AMR
rate. The analysis partially accounted for this by presenting low and medium increases in AMR as
alternative future scenarios.
4.3.3 Infection rate
With an increase in AMR it is feasible that infection rates will increase, as people with resistant
infection may have more opportunities to pass this on to others.
On the other hand, an increase in AMR may eventually see decreasing future infection rates as global
health systems develop, with better sanitation and infection control measures being implemented,
and more emphasis is given to improved sanitation and hygiene due to the increased threat of
infection.
The future AMR scenarios developed allowed for some sensitivity around the infection rate, applying
a doubling of the future infection rate for the 40% and 100% future AMR scenarios as additional two
scenarios, in order to allow for a possible future case where infection rates rise. The Malaria infection
rate was also increased across the four scenarios, as outlined in the methodology section 4.1.1.2.
4.3.4 Economic scenarios
The modelling approach used in this analysis assumed that the current environment, including
economic and business policies, would continue to evolve favourably as incomes rise.
The projections in the baseline economic scenario should therefore be viewed as potential future
growth scenarios under such conditions rather than precise forecasts. Similar assumptions were
used for the AMR scenarios.

ABCD
The global economic impact of anti-microbial resistance
KPMG LLP
24
© 2014 KPMG LLP, a UK limited liability partnership and a member firm of the KPMG network of independent member firms affiliated with KPMG International Cooperative (“KPMG International”),
a Swiss entity. All rights reserved.
5 Health impacts of AMR
AMR poses a threat to global public health as infections are developing that increasingly cannot be
treated. The current health impacts include increased global mortality due to resistance to
treatments, as well as short and long term morbidity experienced by patients with resistance.
The section below outlines some of the key incidences for the selected bacteria and diseases which
are currently observed around the worlds, and serves to provide an indication of the base from which
future AMR scenarios were developed.
In addition, estimates of the financial impacts of AMR on health services in those countries where
relevant data was available were also presented below.
5.1 Current health impact
5.1.1 Global infection rates
TB, Malaria and HIV are amongst the leading causes of death in the world, with resistance to
treatments of these diseases adding to the complexity of handling these diseases. These diseases
were included in the analysis because of their global impact.
Infection rates per region are outlined below for the three diseases. There are currently high infection
rates for TB and Malaria across Africa and South East Asia along with high incidence of HIV in Africa.
Table 7: Current number of infections by region for TB23
, HIV and Malaria24
, number of infections
World region TB HIV Malaria
Africa 2,261,117 1,475,693 90,515,866
America 276,153 99,592 368,009
Eastern Mediterranean 650,710 30,282 3,873,418
Europe 353,127 74,489 1,231
South East Asia 3,456,040 95,619 67,769,063
Western Pacific 1,603,844 68,824 1,944,276
5.1.2 Global AMR rates
AMR is a real and current issue, with AMR rates for certain bacterial strains in some countries
approaching 100%.
23 WHO, Tuberculosis database, 2011.
24 Murray et al, Global, regional and national incidence and mortality for HIV, TB and malaria 1990-2013: a systematic analysis
for the Global Burden of Disease Study 2013, Lancet, 2014 Sep 13; 384(9947):1005-70.

ABCD
The global economic impact of anti-microbial resistance
KPMG LLP
25
© 2014 KPMG LLP, a UK limited liability partnership and a member firm of the KPMG network of independent member firms affiliated with KPMG International Cooperative (“KPMG International”),
a Swiss entity. All rights reserved.
Chart 7 below depicts global resistance rates for Staphylococcus aureus to methicillin25
, showing high
resistance rates in South America and in particular Chile and Peru.
Chart 7: Global resistance rates for Staphylococcus aureus to methicillin
25 Data sourced from WHO, Anti-microbial Resistance Global Report on Surveillance, 2014.
Key: (% of resistance) 0-20 20-40 40-60 60-80 80-100

ABCD
The global economic impact of anti-microbial resistance
KPMG LLP
26
© 2014 KPMG LLP, a UK limited liability partnership and a member firm of the KPMG network of independent member firms affiliated with KPMG International Cooperative (“KPMG International”),
a Swiss entity. All rights reserved.
Chart 8 below highlights global resistance rates for Escherichia coli to third generation
cephalosporins26
and shows in particular relatively increased resistance in Africa with high resistance
rates in India and China and higher rates of resistance being seen in Guinea, Ethiopia, Oman and
Myanmar.
Chart 8: Global resistance rates for Escherichia coli to third generation cephalosporins
26 Data sourced from WHO, Anti-microbial Resistance Global Report on Surveillance, 2014.
Key: (% of resistance) 0-20 20-40 40-60 60-80 80-100

ABCD
The global economic impact of anti-microbial resistance
KPMG LLP
27
© 2014 KPMG LLP, a UK limited liability partnership and a member firm of the KPMG network of independent member firms affiliated with KPMG International Cooperative (“KPMG International”),
a Swiss entity. All rights reserved.
Chart 9 below highlights global resistance rates for to third generation cephalosporins27
and shows
high resistance in Russia, India, China and South America.
Chart 9: Global resistance rates for Klebsiella pneumoniae to third generation cephalosporins
27 Data sourced from WHO, Anti-microbial Resistance Global Report on Surveillance, 2014.
Key: (% of resistance) 0-20 20-40 40-60 60-80 80-100

ABCD
The global economic impact of anti-microbial resistance
KPMG LLP
28
© 2014 KPMG LLP, a UK limited liability partnership and a member firm of the KPMG network of independent member firms affiliated with KPMG International Cooperative (“KPMG International”),
a Swiss entity. All rights reserved.
5.2 Current financial impact
The financial impact on global health services of an increased AMR rate lies in the increased length of
stay in hospital and care required for the patients. This will vary greatly globally, especially between
low, middle and high income countries, due to the healthcare provisions in each country and the
variation in the cost of providing these services, an example being the treatment of patients with
multi drug resistant TB, where patients can undergo a two year treatment programme.
In this analysis, the burden of additional care was estimated using the extra length of hospital stay
that those patients with AMR need. Due to restrictions on global data availability, the analysis was
limited to the three bacteria analysed and covered only the EU, Iceland and Norway.
It is estimated that infections due to the three selected antibiotic-resistant bacteria resulted in
approximately 4 million extra hospital days in 2012.
An estimate of the average cost of a hospital day was used from the European Commission28
and
converted to 2012 prices using the health component of the harmonised index of consumer prices
(HICP)29
. The average cost of a hospital day was estimated at €405.
This was then multiplied by the estimated extra number of hospital days, arriving at an estimated
cost of approximately €1.6bn attributed to AMR in 2012.
5.3 Future AMR scenarios
Future AMR increases will raise the number of those dying from infections globally.
Four future AMR scenarios were developed in order to estimate the potential rise in mortality:
■ Scenario A - an absolute increase in current rates of resistance by 40%
■ Scenario B - 100% resistance rate applied across all countries
■ Scenario C - Doubling of current infection rates for the three bacteria, HIV and TB, and an absolute
increase in current rates of resistance by 40%
■ Scenario D - Doubling of current infection rates for the three bacteria, HIV and TB, and 100%
resistance rate applied across all countries
Chart 10 below illustrates the difference in 2050 population compared to the base scenario that is
associated with the four future AMR scenarios, implying a projected increase in global mortality with
rising resistance and infection rates.
The impact on world population is projected to be significant, with 700 million fewer people expected
as a result of Scenario D in 2050.
28European Commission, Proposal for a Council Recommendation on patient safety, including the prevention and control of
healthcare associated infections, 2008.
29 European Commission, Harmonised Index of Consumer Prices, 2012.

ABCD
The global economic impact of anti-microbial resistance
KPMG LLP
29
© 2014 KPMG LLP, a UK limited liability partnership and a member firm of the KPMG network of independent member firms affiliated with KPMG International Cooperative (“KPMG International”),
a Swiss entity. All rights reserved.
Chart 10: Estimated reduction in world population by 2050 under each scenario
Source: KPMG analysis.
Chart 11 below outlines the effect Scenario D could have on current population in different
geographical regions. This scenario results in a high mortality rate globally, in particular for TB and
Malaria due to the already relatively high infection rates for these diseases in certain parts of the
world such as Africa and South East Asia.
Some causes of death are prevalent in particular regions such HIV in Africa, whereas others are more
widespread across the world such as Escherichia coli and Klebsiella pneumoniae infections.
Chart 11: Estimated additional mortality by region and infection for Scenario D in 2014
Source: KPMG analysis.
0
0.2
0.4
0.6
0.8
A B C D
Po
pula
tio
n (billions), 2
050
Difference vs m
ain
scenario
Europe Africa LATAM Asia MENA North America
-
1
2
3
4
5
6
7
North
America
Europe LATAM Africa Asia MENA
Estim
ated additio
nal m
ortality (m
illions)
Staphylococcus aureus (MRSA) Escherichia coli (3rd gen. cephalosporins)
Klebsiella pneumoniae (3rd gen. cephalosporins) TB
HIV Malaria
ABCD
The global economic impact of anti-microbial resistance
KPMG LLP
30
© 2014 KPMG LLP, a UK limited liability partnership and a member firm of the KPMG network of independent member firms affiliated with KPMG International Cooperative (“KPMG International”),
a Swiss entity. All rights reserved.
6 Potential future economic impact of
AMR
6.1 Economic impact with constant infection rates
The current prevalence of AMR varies significantly across countries, as highlighted in Chapter 5
above. This is likely to cause divergence in the future incidence of AMR and in the economic costs
associated with it.
In this section of the report the potential economic impact of alternative AMR scenarios is presented
under alternative resistance scenarios, keeping infection rates constant.
Scenarios modelled were:
■ Scenario A - an absolute increase in current rates of resistance by 40%
■ Scenario B - 100% resistance rate applied across all countries
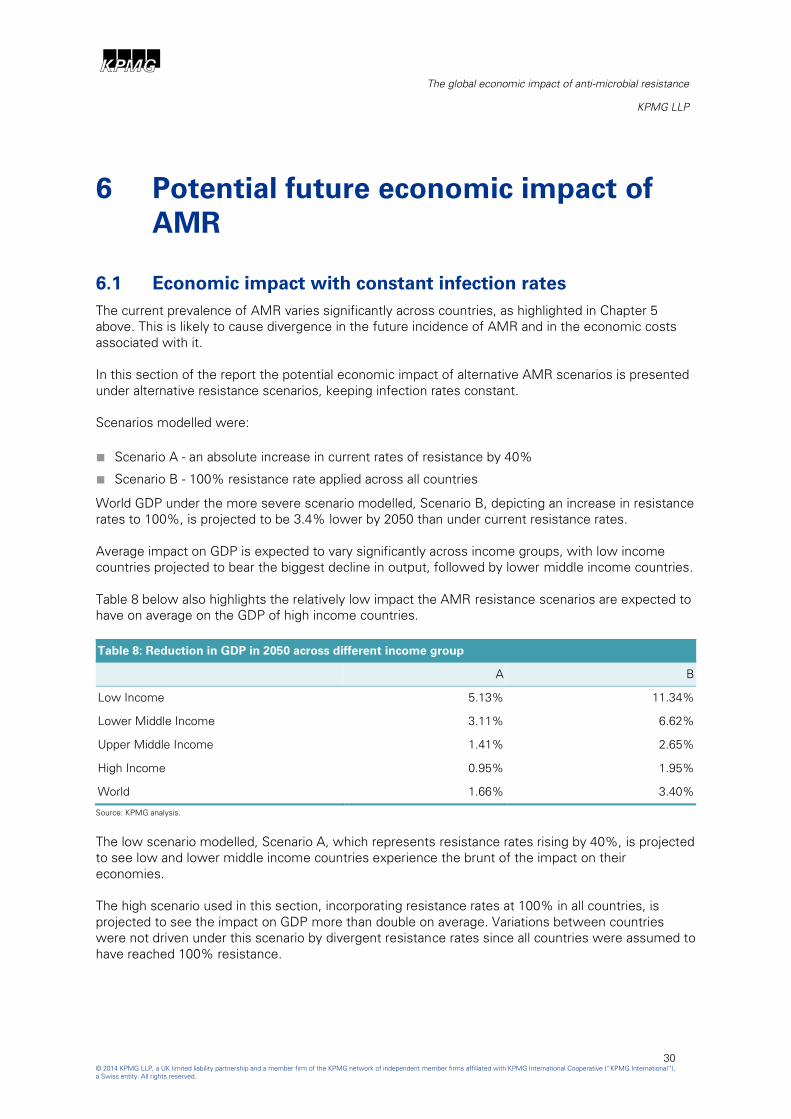
World GDP under the more severe scenario modelled, Scenario B, depicting an increase in resistance
rates to 100%, is projected to be 3.4% lower by 2050 than under current resistance rates.
Average impact on GDP is expected to vary significantly across income groups, with low income
countries projected to bear the biggest decline in output, followed by lower middle income countries.
Table 8 below also highlights the relatively low impact the AMR resistance scenarios are expected to
have on average on the GDP of high income countries.
Table 8: Reduction in GDP in 2050 across different income group
A B
Low Income 5.13% 11.34%
Lower Middle Income 3.11% 6.62%
Upper Middle Income 1.41% 2.65%
High Income 0.95% 1.95%
World 1.66% 3.40%
Source: KPMG analysis.
The low scenario modelled, Scenario A, which represents resistance rates rising by 40%, is projected
to see low and lower middle income countries experience the brunt of the impact on their
economies.
The high scenario used in this section, incorporating resistance rates at 100% in all countries, is
projected to see the impact on GDP more than double on average. Variations between countries
were not driven under this scenario by divergent resistance rates since all countries were assumed to
have reached 100% resistance.
ABCD
The global economic impact of anti-microbial resistance
KPMG LLP
31
© 2014 KPMG LLP, a UK limited liability partnership and a member firm of the KPMG network of independent member firms affiliated with KPMG International Cooperative (“KPMG International”),
a Swiss entity. All rights reserved.
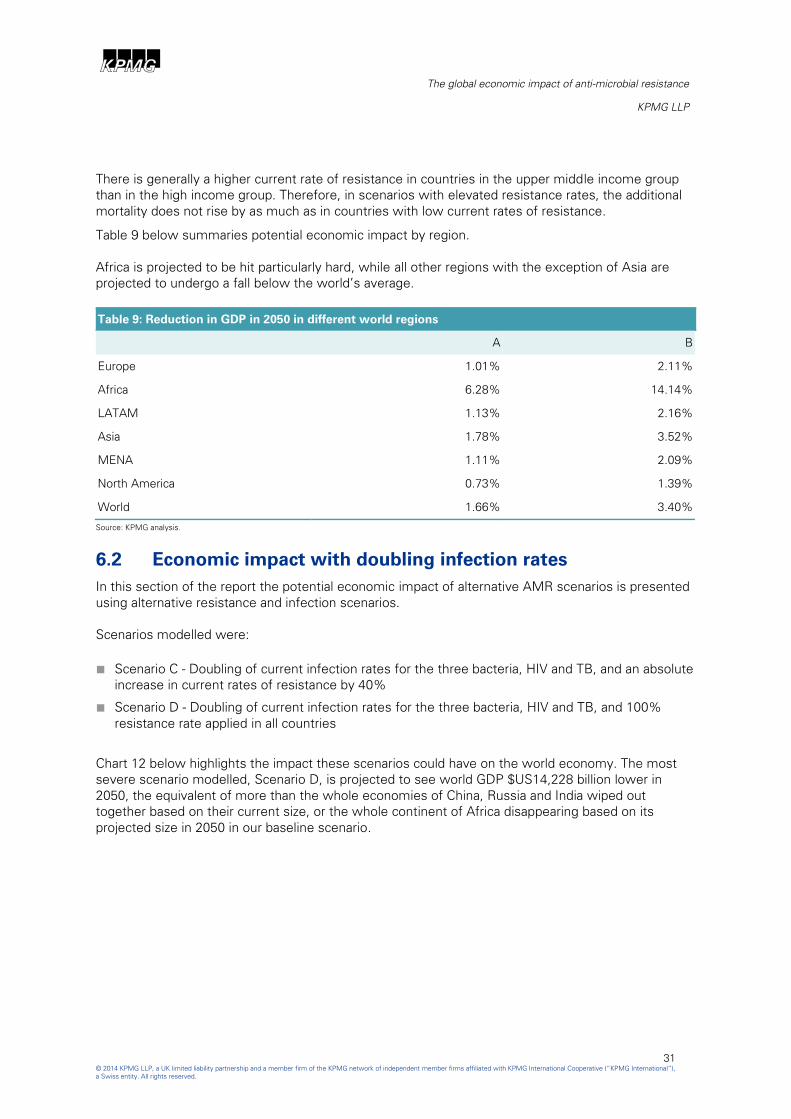
There is generally a higher current rate of resistance in countries in the upper middle income group
than in the high income group. Therefore, in scenarios with elevated resistance rates, the additional
mortality does not rise by as much as in countries with low current rates of resistance.
Table 9 below summaries potential economic impact by region.
Africa is projected to be hit particularly hard, while all other regions with the exception of Asia are
projected to undergo a fall below the world’s average.
Table 9: Reduction in GDP in 2050 in different world regions
A B
Europe 1.01% 2.11%
Africa 6.28% 14.14%
LATAM 1.13% 2.16%
Asia 1.78% 3.52%
MENA 1.11% 2.09%
North America 0.73% 1.39%
World 1.66% 3.40%
Source: KPMG analysis.
6.2 Economic impact with doubling infection rates
In this section of the report the potential economic impact of alternative AMR scenarios is presented
using alternative resistance and infection scenarios.
Scenarios modelled were:
■ Scenario C - Doubling of current infection rates for the three bacteria, HIV and TB, and an absolute
increase in current rates of resistance by 40%
■ Scenario D - Doubling of current infection rates for the three bacteria, HIV and TB, and 100%
resistance rate applied in all countries
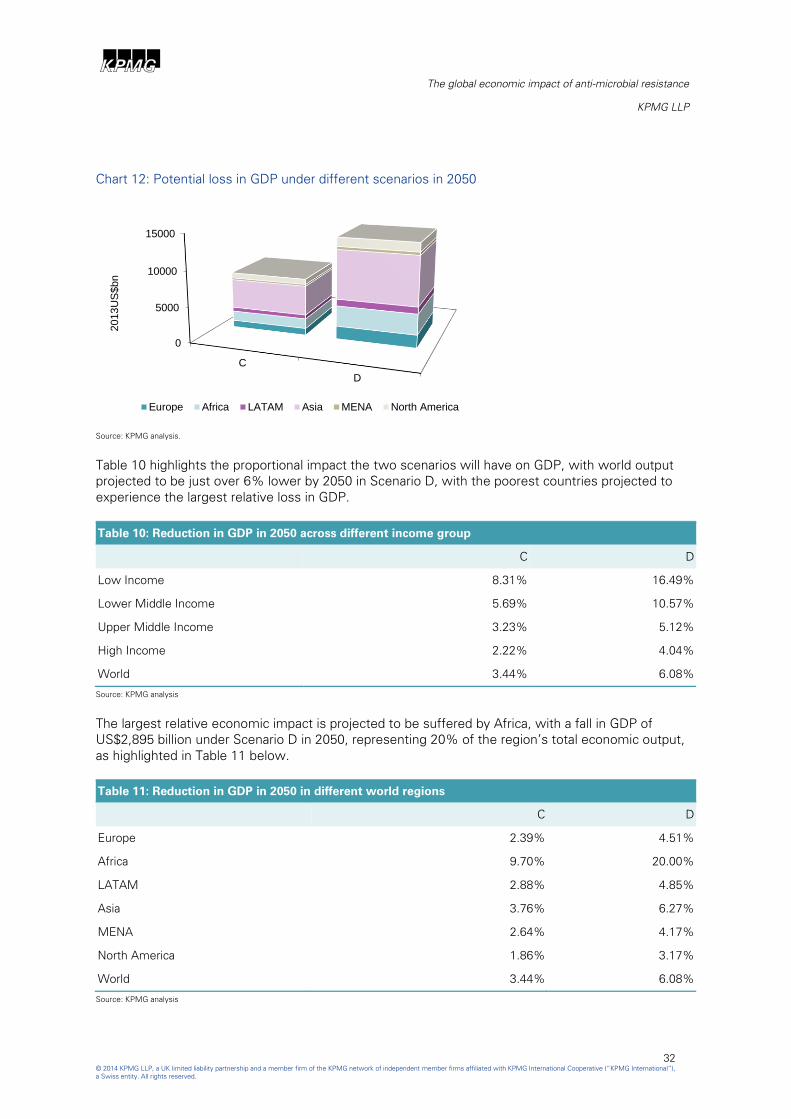
Chart 12 below highlights the impact these scenarios could have on the world economy. The most
severe scenario modelled, Scenario D, is projected to see world GDP $US14,228 billion lower in
2050, the equivalent of more than the whole economies of China, Russia and India wiped out
together based on their current size, or the whole continent of Africa disappearing based on its
projected size in 2050 in our baseline scenario.
ABCD
The global economic impact of anti-microbial resistance
KPMG LLP
32
© 2014 KPMG LLP, a UK limited liability partnership and a member firm of the KPMG network of independent member firms affiliated with KPMG International Cooperative (“KPMG International”),
a Swiss entity. All rights reserved.
Chart 12: Potential loss in GDP under different scenarios in 2050
Source: KPMG analysis.
Table 10 highlights the proportional impact the two scenarios will have on GDP, with world output
projected to be just over 6% lower by 2050 in Scenario D, with the poorest countries projected to
experience the largest relative loss in GDP.
Table 10: Reduction in GDP in 2050 across different income group
C D
Low Income 8.31% 16.49%
Lower Middle Income 5.69% 10.57%
Upper Middle Income 3.23% 5.12%
High Income 2.22% 4.04%
World 3.44% 6.08%
Source: KPMG analysis
The largest relative economic impact is projected to be suffered by Africa, with a fall in GDP of
US$2,895 billion under Scenario D in 2050, representing 20% of the region’s total economic output,
as highlighted in Table 11 below.
Table 11: Reduction in GDP in 2050 in different world regions
C D
Europe 2.39% 4.51%
Africa 9.70% 20.00%
LATAM 2.88% 4.85%
Asia 3.76% 6.27%
MENA 2.64% 4.17%
North America 1.86% 3.17%
World 3.44% 6.08%
Source: KPMG analysis
0
5000
10000
15000
C
D
2013U
S$bn
Europe Africa LATAM Asia MENA North America
ABCD
The global economic impact of anti-microbial resistance
KPMG LLP
33
© 2014 KPMG LLP, a UK limited liability partnership and a member firm of the KPMG network of independent member firms affiliated with KPMG International Cooperative (“KPMG International”),
a Swiss entity. All rights reserved.
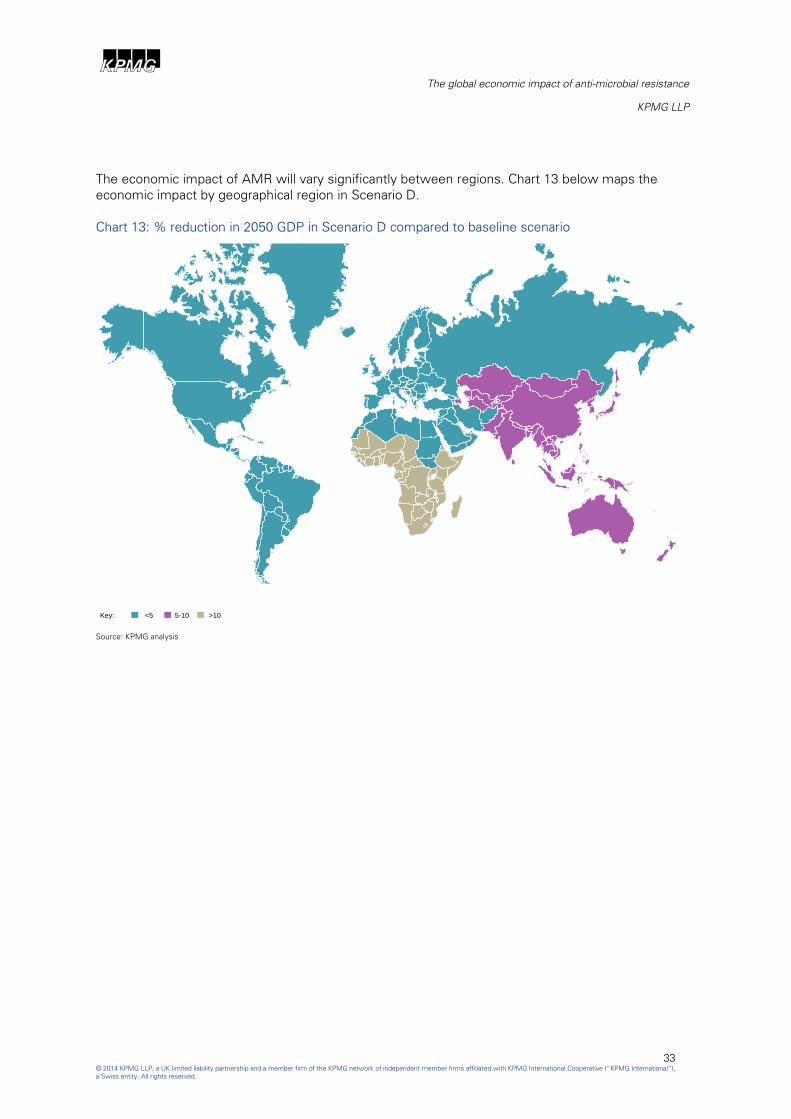
The economic impact of AMR will vary significantly between regions. Chart 13 below maps the
economic impact by geographical region in Scenario D.
Chart 13: % reduction in 2050 GDP in Scenario D compared to baseline scenario
Source: KPMG analysis
Key: <5 5-10 >10

ABCD
The global economic impact of anti-microbial resistance
KPMG LLP
34
© 2014 KPMG LLP, a UK limited liability partnership and a member firm of the KPMG network of independent member firms affiliated with KPMG International Cooperative (“KPMG International”),
a Swiss entity. All rights reserved.
7 Conclusions
AMR represents a genuine cost to society. Rising AMR levels are projected to cause increasing
numbers of mortalities and morbidity across the world.
The impact of higher AMR is unlikely to be spread equally, however, with those more vulnerable
likely to pay the highest price, as low income countries suffer the biggest loss of population and
economic output.
The potential loss from not addressing the AMR challenge cannot therefore be seen as a potential
economic loss in isolation, and any future decisions need to incorporate the social loss associated
with rising AMR in tandem.
The rise in AMR and its potential real damage to society and to the world economy should encourage
the development of new antibiotics, and increase efforts to ensure future social and economic
impacts are minimised.
ABCD
The global economic impact of anti-microbial resistance
KPMG LLP
35
© 2014 KPMG LLP, a UK limited liability partnership and a member firm of the KPMG network of independent member firms affiliated with KPMG International Cooperative (“KPMG International”), a Swiss entity. All rights reserved.
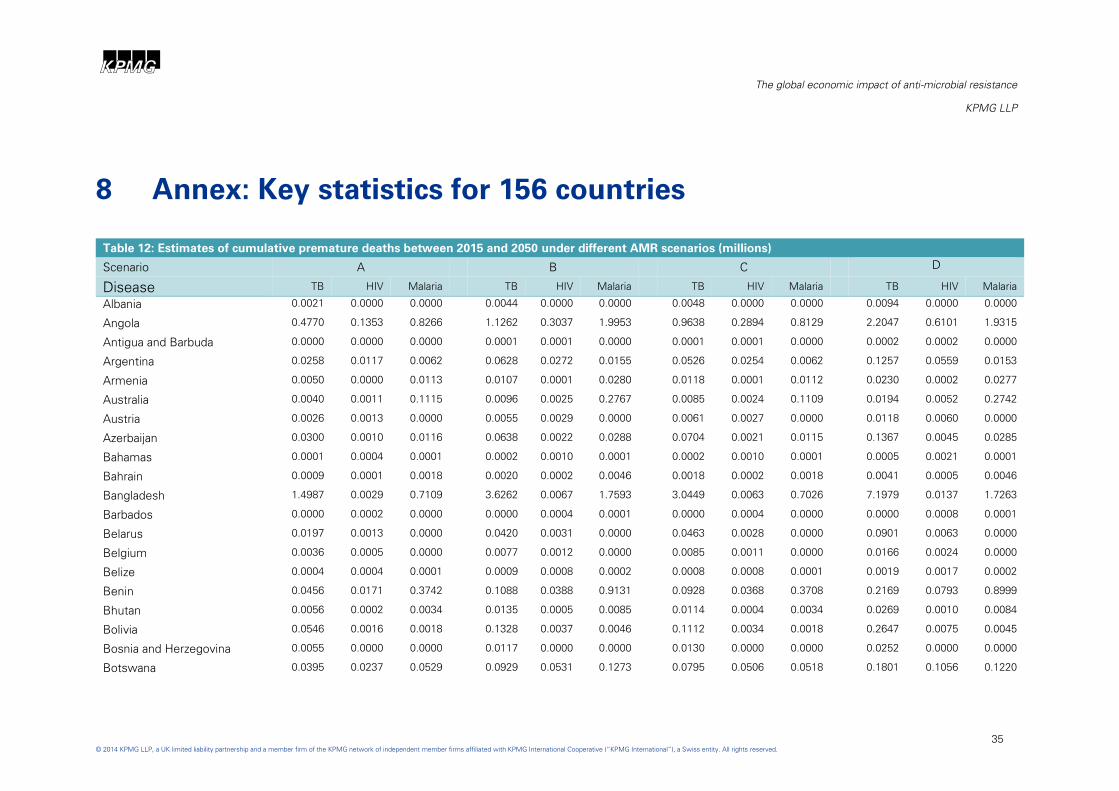
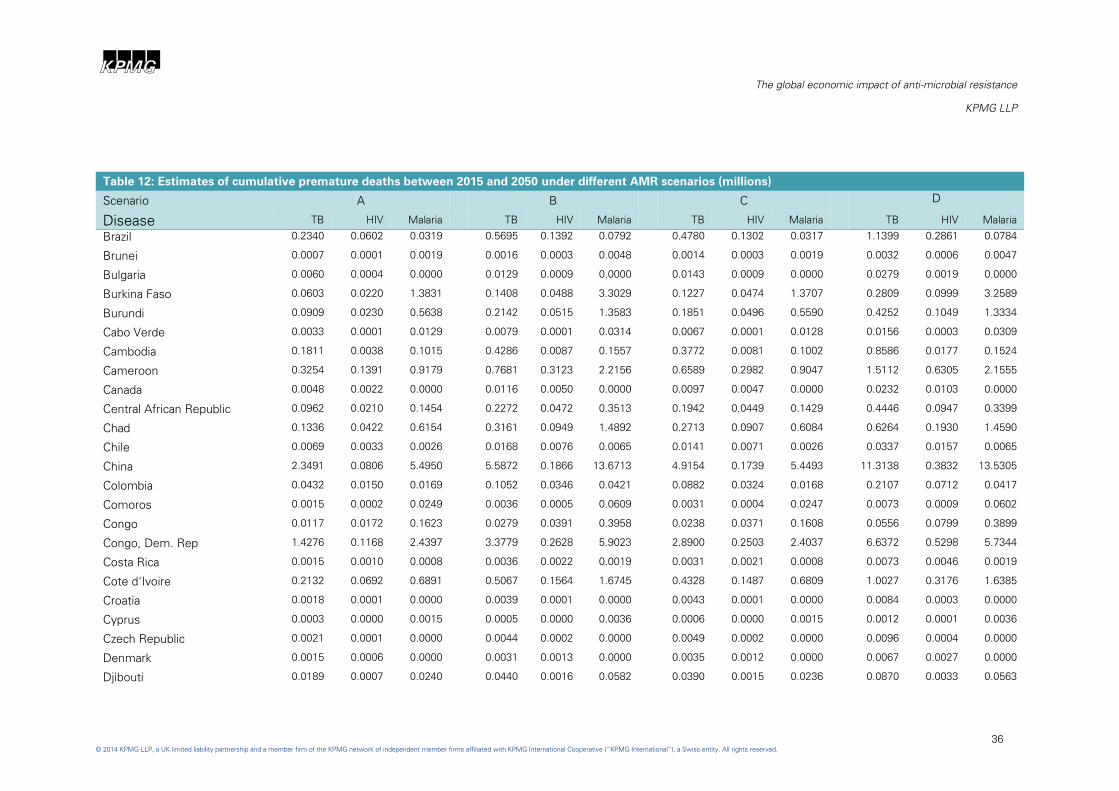
8 Annex: Key statistics for 156 countries
Table 12: Estimates of cumulative premature deaths between 2015 and 2050 under different AMR scenarios (millions)
Scenario A B C D
Disease TB HIV Malaria TB HIV Malaria TB HIV Malaria TB HIV Malaria
Albania 0.0021 0.0000 0.0000 0.0044 0.0000 0.0000 0.0048 0.0000 0.0000 0.0094 0.0000 0.0000
Angola 0.4770 0.1353 0.8266 1.1262 0.3037 1.9953 0.9638 0.2894 0.8129 2.2047 0.6101 1.9315
Antigua and Barbuda 0.0000 0.0000 0.0000 0.0001 0.0001 0.0000 0.0001 0.0001 0.0000 0.0002 0.0002 0.0000
Argentina 0.0258 0.0117 0.0062 0.0628 0.0272 0.0155 0.0526 0.0254 0.0062 0.1257 0.0559 0.0153
Armenia 0.0050 0.0000 0.0113 0.0107 0.0001 0.0280 0.0118 0.0001 0.0112 0.0230 0.0002 0.0277
Australia 0.0040 0.0011 0.1115 0.0096 0.0025 0.2767 0.0085 0.0024 0.1109 0.0194 0.0052 0.2742
Austria 0.0026 0.0013 0.0000 0.0055 0.0029 0.0000 0.0061 0.0027 0.0000 0.0118 0.0060 0.0000
Azerbaijan 0.0300 0.0010 0.0116 0.0638 0.0022 0.0288 0.0704 0.0021 0.0115 0.1367 0.0045 0.0285
Bahamas 0.0001 0.0004 0.0001 0.0002 0.0010 0.0001 0.0002 0.0010 0.0001 0.0005 0.0021 0.0001
Bahrain 0.0009 0.0001 0.0018 0.0020 0.0002 0.0046 0.0018 0.0002 0.0018 0.0041 0.0005 0.0046
Bangladesh 1.4987 0.0029 0.7109 3.6262 0.0067 1.7593 3.0449 0.0063 0.7026 7.1979 0.0137 1.7263
Barbados 0.0000 0.0002 0.0000 0.0000 0.0004 0.0001 0.0000 0.0004 0.0000 0.0000 0.0008 0.0001
Belarus 0.0197 0.0013 0.0000 0.0420 0.0031 0.0000 0.0463 0.0028 0.0000 0.0901 0.0063 0.0000
Belgium 0.0036 0.0005 0.0000 0.0077 0.0012 0.0000 0.0085 0.0011 0.0000 0.0166 0.0024 0.0000
Belize 0.0004 0.0004 0.0001 0.0009 0.0008 0.0002 0.0008 0.0008 0.0001 0.0019 0.0017 0.0002
Benin 0.0456 0.0171 0.3742 0.1088 0.0388 0.9131 0.0928 0.0368 0.3708 0.2169 0.0793 0.8999
Bhutan 0.0056 0.0002 0.0034 0.0135 0.0005 0.0085 0.0114 0.0004 0.0034 0.0269 0.0010 0.0084
Bolivia 0.0546 0.0016 0.0018 0.1328 0.0037 0.0046 0.1112 0.0034 0.0018 0.2647 0.0075 0.0045
Bosnia and Herzegovina 0.0055 0.0000 0.0000 0.0117 0.0000 0.0000 0.0130 0.0000 0.0000 0.0252 0.0000 0.0000
Botswana 0.0395 0.0237 0.0529 0.0929 0.0531 0.1273 0.0795 0.0506 0.0518 0.1801 0.1056 0.1220
ABCD
The global economic impact of anti-microbial resistance
KPMG LLP
36
© 2014 KPMG LLP, a UK limited liability partnership and a member firm of the KPMG network of independent member firms affiliated with KPMG International Cooperative (“KPMG International”), a Swiss entity. All rights reserved.
Table 12: Estimates of cumulative premature deaths between 2015 and 2050 under different AMR scenarios (millions)
Scenario A B C D
Disease TB HIV Malaria TB HIV Malaria TB HIV Malaria TB HIV Malaria
Brazil 0.2340 0.0602 0.0319 0.5695 0.1392 0.0792 0.4780 0.1302 0.0317 1.1399 0.2861 0.0784
Brunei 0.0007 0.0001 0.0019 0.0016 0.0003 0.0048 0.0014 0.0003 0.0019 0.0032 0.0006 0.0047
Bulgaria 0.0060 0.0004 0.0000 0.0129 0.0009 0.0000 0.0143 0.0009 0.0000 0.0279 0.0019 0.0000
Burkina Faso 0.0603 0.0220 1.3831 0.1408 0.0488 3.3029 0.1227 0.0474 1.3707 0.2809 0.0999 3.2589
Burundi 0.0909 0.0230 0.5638 0.2142 0.0515 1.3583 0.1851 0.0496 0.5590 0.4252 0.1049 1.3334
Cabo Verde 0.0033 0.0001 0.0129 0.0079 0.0001 0.0314 0.0067 0.0001 0.0128 0.0156 0.0003 0.0309
Cambodia 0.1811 0.0038 0.1015 0.4286 0.0087 0.1557 0.3772 0.0081 0.1002 0.8586 0.0177 0.1524
Cameroon 0.3254 0.1391 0.9179 0.7681 0.3123 2.2156 0.6589 0.2982 0.9047 1.5112 0.6305 2.1555
Canada 0.0048 0.0022 0.0000 0.0116 0.0050 0.0000 0.0097 0.0047 0.0000 0.0232 0.0103 0.0000
Central African Republic 0.0962 0.0210 0.1454 0.2272 0.0472 0.3513 0.1942 0.0449 0.1429 0.4446 0.0947 0.3399
Chad 0.1336 0.0422 0.6154 0.3161 0.0949 1.4892 0.2713 0.0907 0.6084 0.6264 0.1930 1.4590
Chile 0.0069 0.0033 0.0026 0.0168 0.0076 0.0065 0.0141 0.0071 0.0026 0.0337 0.0157 0.0065
China 2.3491 0.0806 5.4950 5.5872 0.1866 13.6713 4.9154 0.1739 5.4493 11.3138 0.3832 13.5305
Colombia 0.0432 0.0150 0.0169 0.1052 0.0346 0.0421 0.0882 0.0324 0.0168 0.2107 0.0712 0.0417
Comoros 0.0015 0.0002 0.0249 0.0036 0.0005 0.0609 0.0031 0.0004 0.0247 0.0073 0.0009 0.0602
Congo 0.0117 0.0172 0.1623 0.0279 0.0391 0.3958 0.0238 0.0371 0.1608 0.0556 0.0799 0.3899
Congo, Dem. Rep 1.4276 0.1168 2.4397 3.3779 0.2628 5.9023 2.8900 0.2503 2.4037 6.6372 0.5298 5.7344
Costa Rica 0.0015 0.0010 0.0008 0.0036 0.0022 0.0019 0.0031 0.0021 0.0008 0.0073 0.0046 0.0019
Cote d'Ivoire 0.2132 0.0692 0.6891 0.5067 0.1564 1.6745 0.4328 0.1487 0.6809 1.0027 0.3176 1.6385
Croatia 0.0018 0.0001 0.0000 0.0039 0.0001 0.0000 0.0043 0.0001 0.0000 0.0084 0.0003 0.0000
Cyprus 0.0003 0.0000 0.0015 0.0005 0.0000 0.0036 0.0006 0.0000 0.0015 0.0012 0.0001 0.0036
Czech Republic 0.0021 0.0001 0.0000 0.0044 0.0002 0.0000 0.0049 0.0002 0.0000 0.0096 0.0004 0.0000
Denmark 0.0015 0.0006 0.0000 0.0031 0.0013 0.0000 0.0035 0.0012 0.0000 0.0067 0.0027 0.0000
Djibouti 0.0189 0.0007 0.0240 0.0440 0.0016 0.0582 0.0390 0.0015 0.0236 0.0870 0.0033 0.0563

ABCD
The global economic impact of anti-microbial resistance
KPMG LLP
37
© 2014 KPMG LLP, a UK limited liability partnership and a member firm of the KPMG network of independent member firms affiliated with KPMG International Cooperative (“KPMG International”), a Swiss entity. All rights reserved.
Table 12: Estimates of cumulative premature deaths between 2015 and 2050 under different AMR scenarios (millions)
Scenario A B C D
Disease TB HIV Malaria TB HIV Malaria TB HIV Malaria TB HIV Malaria
Dominican Republic 0.0165 0.0046 0.0026 0.0403 0.0106 0.0064 0.0337 0.0099 0.0026 0.0806 0.0217 0.0064
Ecuador 0.0253 0.0064 0.0042 0.0617 0.0148 0.0105 0.0517 0.0138 0.0042 0.1234 0.0304 0.0104
Egypt 0.0475 0.0010 0.1169 0.1139 0.0024 0.2916 0.0988 0.0022 0.1160 0.2301 0.0050 0.2888
El Salvador 0.0061 0.0018 0.0009 0.0149 0.0042 0.0022 0.0124 0.0039 0.0009 0.0297 0.0087 0.0022
Equatorial Guinea 0.0069 0.0060 0.0283 0.0164 0.0135 0.0685 0.0141 0.0129 0.0279 0.0325 0.0273 0.0669
Estonia 0.0009 0.0002 0.0000 0.0020 0.0004 0.0000 0.0022 0.0004 0.0000 0.0043 0.0009 0.0000
Ethiopia 1.2747 0.1221 3.1810 3.0338 0.2763 7.7404 2.5835 0.2619 3.1376 5.9996 0.5606 7.5688
Fiji 0.0012 0.0001 0.0036 0.0029 0.0002 0.0089 0.0026 0.0002 0.0036 0.0059 0.0005 0.0088
Finland 0.0011 0.0001 0.0000 0.0023 0.0001 0.0000 0.0026 0.0001 0.0000 0.0050 0.0003 0.0000
France 0.0207 0.0055 0.0000 0.0440 0.0126 0.0000 0.0487 0.0118 0.0000 0.0946 0.0260 0.0000
Gabon 0.0422 0.0058 0.0553 0.0994 0.0129 0.1333 0.0852 0.0123 0.0544 0.1941 0.0258 0.1287
Gambia 0.0227 0.0027 0.1148 0.0533 0.0059 0.2760 0.0460 0.0057 0.1135 0.1056 0.0121 0.2704
Georgia 0.0154 0.0001 0.0044 0.0327 0.0003 0.0109 0.0361 0.0003 0.0043 0.0700 0.0006 0.0107
Germany 0.0155 0.0036 0.0000 0.0330 0.0083 0.0000 0.0366 0.0077 0.0000 0.0711 0.0170 0.0000
Ghana 0.0958 0.0334 0.8129 0.2289 0.0759 1.9857 0.1952 0.0721 0.8060 0.4566 0.1555 1.9587
Greece 0.0018 0.0001 0.0000 0.0039 0.0002 0.0000 0.0043 0.0002 0.0000 0.0085 0.0005 0.0000
Grenada 0.0000 0.0001 0.0000 0.0000 0.0001 0.0000 0.0000 0.0001 0.0000 0.0000 0.0003 0.0000
Guatemala 0.0320 0.0062 0.0068 0.0780 0.0144 0.0169 0.0652 0.0134 0.0067 0.1560 0.0295 0.0167
Guinea 0.1291 0.0402 0.6771 0.3036 0.0899 1.6277 0.2617 0.0863 0.6679 0.6008 0.1825 1.5924
Guinea-Bissau 0.0394 0.0129 0.1336 0.0908 0.0282 0.3143 0.0795 0.0274 0.1310 0.1770 0.0563 0.3030
Honduras 0.0136 0.0027 0.0018 0.0333 0.0062 0.0046 0.0278 0.0057 0.0018 0.0665 0.0127 0.0045
Hong Kong 0.0129 0.0004 0.0301 0.0306 0.0010 0.0749 0.0269 0.0010 0.0299 0.0620 0.0021 0.0742
Hungary 0.0058 0.0001 0.0000 0.0125 0.0002 0.0000 0.0138 0.0002 0.0000 0.0270 0.0004 0.0000
Iceland 0.0000 0.0000 0.0000 0.0001 0.0000 0.0000 0.0001 0.0000 0.0000 0.0002 0.0000 0.0000

ABCD
The global economic impact of anti-microbial resistance
KPMG LLP
38
© 2014 KPMG LLP, a UK limited liability partnership and a member firm of the KPMG network of independent member firms affiliated with KPMG International Cooperative (“KPMG International”), a Swiss entity. All rights reserved.
Table 12: Estimates of cumulative premature deaths between 2015 and 2050 under different AMR scenarios (millions)
Scenario A B C D
Disease TB HIV Malaria TB HIV Malaria TB HIV Malaria TB HIV Malaria
India 8.9388 0.0797 15.5720 21.5542 0.1827 38.4050 18.1761 0.1714 15.4028 42.8922 0.3731 37.7817
Indonesia 1.9644 0.1164 1.1312 4.7472 0.2676 2.7961 4.0014 0.2509 1.1209 9.4355 0.5457 2.7474
Iran 0.0542 0.0036 0.3521 0.1298 0.0083 0.8761 0.1129 0.0078 0.3494 0.2622 0.0171 0.8678
Ireland 0.0016 0.0001 0.0000 0.0033 0.0003 0.0000 0.0037 0.0003 0.0000 0.0071 0.0007 0.0000
Israel 0.0020 0.0003 0.0111 0.0042 0.0007 0.0275 0.0046 0.0007 0.0110 0.0090 0.0014 0.0273
Italy 0.0120 0.0066 0.0000 0.0256 0.0153 0.0000 0.0282 0.0142 0.0000 0.0552 0.0315 0.0000
Jamaica 0.0004 0.0013 0.0004 0.0010 0.0029 0.0010 0.0009 0.0027 0.0004 0.0021 0.0060 0.0009
Japan 0.0500 0.0004 0.4569 0.1187 0.0010 1.1356 0.1048 0.0009 0.4544 0.2408 0.0020 1.1259
Jordan 0.0016 0.0001 0.0107 0.0038 0.0001 0.0267 0.0033 0.0001 0.0107 0.0077 0.0003 0.0265
Kazakhstan 0.0891 0.0067 0.0000 0.1894 0.0154 0.0000 0.2088 0.0143 0.0000 0.4049 0.0314 0.0000
Kenya 0.7541 0.2927 1.5522 1.7865 0.6594 3.7596 1.5234 0.6260 1.5261 3.5067 1.3281 3.6490
Korea, South 0.1169 0.0012 0.1986 0.2777 0.0027 0.4933 0.2449 0.0025 0.1970 0.5619 0.0055 0.4878
Kuwait 0.0034 0.0002 0.0056 0.0082 0.0005 0.0139 0.0072 0.0005 0.0055 0.0166 0.0011 0.0137
Kyrgyzstan 0.0332 0.0023 0.0000 0.0706 0.0054 0.0000 0.0778 0.0050 0.0000 0.1509 0.0110 0.0000
Latvia 0.0031 0.0005 0.0000 0.0066 0.0011 0.0000 0.0072 0.0010 0.0000 0.0142 0.0023 0.0000
Lebanon 0.0023 0.0008 0.0058 0.0056 0.0019 0.0144 0.0049 0.0018 0.0057 0.0113 0.0040 0.0142
Lesotho 0.0881 0.0411 0.0535 0.2028 0.0899 0.1260 0.1749 0.0864 0.0518 0.3802 0.1730 0.1169
Lithuania 0.0063 0.0003 0.0000 0.0135 0.0006 0.0000 0.0149 0.0006 0.0000 0.0291 0.0013 0.0000
Luxembourg 0.0002 0.0000 0.0000 0.0004 0.0000 0.0000 0.0004 0.0000 0.0000 0.0009 0.0000 0.0000
Madagascar 0.3558 0.0096 0.8571 0.8441 0.0217 2.0788 0.7229 0.0207 0.8475 1.6688 0.0440 2.0322
Malawi 0.1778 0.2080 0.6230 0.4197 0.4671 1.5040 0.3606 0.4467 0.6150 0.8248 0.9418 1.4613
Malaysia 0.0842 0.0096 0.1427 0.1995 0.0221 0.3538 0.1764 0.0207 0.1418 0.4033 0.0453 0.3495
Maldives 0.0006 0.0000 0.0017 0.0016 0.0000 0.0042 0.0013 0.0000 0.0017 0.0032 0.0000 0.0042
Mali 0.0681 0.0159 1.5504 0.1579 0.0351 3.6770 0.1387 0.0343 1.5372 0.3150 0.0718 3.6264
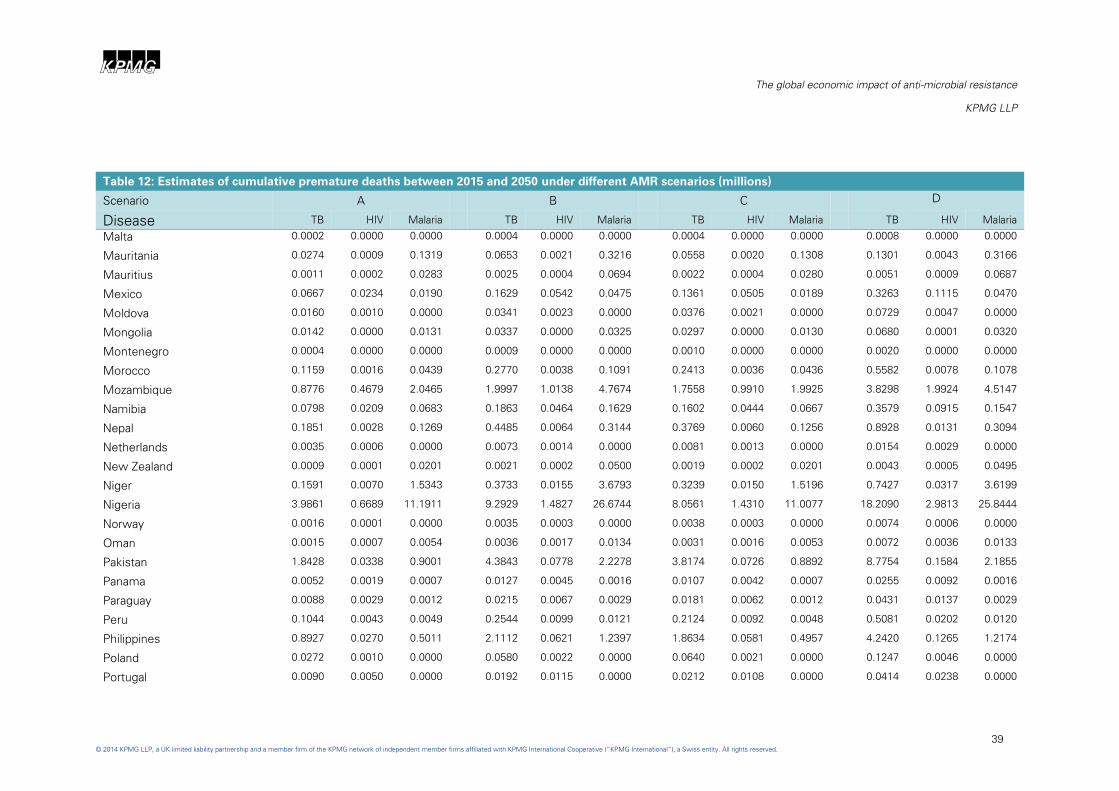
ABCD
The global economic impact of anti-microbial resistance
KPMG LLP
39
© 2014 KPMG LLP, a UK limited liability partnership and a member firm of the KPMG network of independent member firms affiliated with KPMG International Cooperative (“KPMG International”), a Swiss entity. All rights reserved.
Table 12: Estimates of cumulative premature deaths between 2015 and 2050 under different AMR scenarios (millions)
Scenario A B C D
Disease TB HIV Malaria TB HIV Malaria TB HIV Malaria TB HIV Malaria
Malta 0.0002 0.0000 0.0000 0.0004 0.0000 0.0000 0.0004 0.0000 0.0000 0.0008 0.0000 0.0000
Mauritania 0.0274 0.0009 0.1319 0.0653 0.0021 0.3216 0.0558 0.0020 0.1308 0.1301 0.0043 0.3166
Mauritius 0.0011 0.0002 0.0283 0.0025 0.0004 0.0694 0.0022 0.0004 0.0280 0.0051 0.0009 0.0687
Mexico 0.0667 0.0234 0.0190 0.1629 0.0542 0.0475 0.1361 0.0505 0.0189 0.3263 0.1115 0.0470
Moldova 0.0160 0.0010 0.0000 0.0341 0.0023 0.0000 0.0376 0.0021 0.0000 0.0729 0.0047 0.0000
Mongolia 0.0142 0.0000 0.0131 0.0337 0.0000 0.0325 0.0297 0.0000 0.0130 0.0680 0.0001 0.0320
Montenegro 0.0004 0.0000 0.0000 0.0009 0.0000 0.0000 0.0010 0.0000 0.0000 0.0020 0.0000 0.0000
Morocco 0.1159 0.0016 0.0439 0.2770 0.0038 0.1091 0.2413 0.0036 0.0436 0.5582 0.0078 0.1078
Mozambique 0.8776 0.4679 2.0465 1.9997 1.0138 4.7674 1.7558 0.9910 1.9925 3.8298 1.9924 4.5147
Namibia 0.0798 0.0209 0.0683 0.1863 0.0464 0.1629 0.1602 0.0444 0.0667 0.3579 0.0915 0.1547
Nepal 0.1851 0.0028 0.1269 0.4485 0.0064 0.3144 0.3769 0.0060 0.1256 0.8928 0.0131 0.3094
Netherlands 0.0035 0.0006 0.0000 0.0073 0.0014 0.0000 0.0081 0.0013 0.0000 0.0154 0.0029 0.0000
New Zealand 0.0009 0.0001 0.0201 0.0021 0.0002 0.0500 0.0019 0.0002 0.0201 0.0043 0.0005 0.0495
Niger 0.1591 0.0070 1.5343 0.3733 0.0155 3.6793 0.3239 0.0150 1.5196 0.7427 0.0317 3.6199
Nigeria 3.9861 0.6689 11.1911 9.2929 1.4827 26.6744 8.0561 1.4310 11.0077 18.2090 2.9813 25.8444
Norway 0.0016 0.0001 0.0000 0.0035 0.0003 0.0000 0.0038 0.0003 0.0000 0.0074 0.0006 0.0000
Oman 0.0015 0.0007 0.0054 0.0036 0.0017 0.0134 0.0031 0.0016 0.0053 0.0072 0.0036 0.0133
Pakistan 1.8428 0.0338 0.9001 4.3843 0.0778 2.2278 3.8174 0.0726 0.8892 8.7754 0.1584 2.1855
Panama 0.0052 0.0019 0.0007 0.0127 0.0045 0.0016 0.0107 0.0042 0.0007 0.0255 0.0092 0.0016
Paraguay 0.0088 0.0029 0.0012 0.0215 0.0067 0.0029 0.0181 0.0062 0.0012 0.0431 0.0137 0.0029
Peru 0.1044 0.0043 0.0049 0.2544 0.0099 0.0121 0.2124 0.0092 0.0048 0.5081 0.0202 0.0120
Philippines 0.8927 0.0270 0.5011 2.1112 0.0621 1.2397 1.8634 0.0581 0.4957 4.2420 0.1265 1.2174
Poland 0.0272 0.0010 0.0000 0.0580 0.0022 0.0000 0.0640 0.0021 0.0000 0.1247 0.0046 0.0000
Portugal 0.0090 0.0050 0.0000 0.0192 0.0115 0.0000 0.0212 0.0108 0.0000 0.0414 0.0238 0.0000
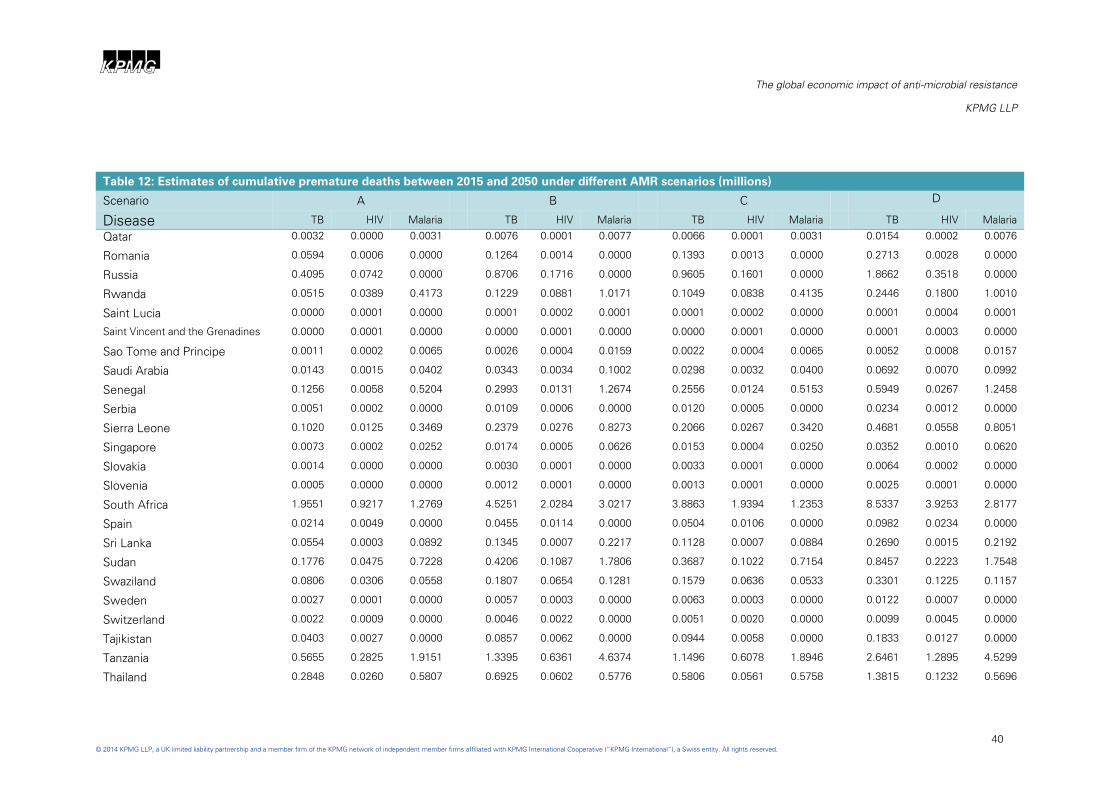
ABCD
The global economic impact of anti-microbial resistance
KPMG LLP
40
© 2014 KPMG LLP, a UK limited liability partnership and a member firm of the KPMG network of independent member firms affiliated with KPMG International Cooperative (“KPMG International”), a Swiss entity. All rights reserved.
Table 12: Estimates of cumulative premature deaths between 2015 and 2050 under different AMR scenarios (millions)
Scenario A B C D
Disease TB HIV Malaria TB HIV Malaria TB HIV Malaria TB HIV Malaria
Qatar 0.0032 0.0000 0.0031 0.0076 0.0001 0.0077 0.0066 0.0001 0.0031 0.0154 0.0002 0.0076
Romania 0.0594 0.0006 0.0000 0.1264 0.0014 0.0000 0.1393 0.0013 0.0000 0.2713 0.0028 0.0000
Russia 0.4095 0.0742 0.0000 0.8706 0.1716 0.0000 0.9605 0.1601 0.0000 1.8662 0.3518 0.0000
Rwanda 0.0515 0.0389 0.4173 0.1229 0.0881 1.0171 0.1049 0.0838 0.4135 0.2446 0.1800 1.0010
Saint Lucia 0.0000 0.0001 0.0000 0.0001 0.0002 0.0001 0.0001 0.0002 0.0000 0.0001 0.0004 0.0001
Saint Vincent and the Grenadines 0.0000 0.0001 0.0000 0.0000 0.0001 0.0000 0.0000 0.0001 0.0000 0.0001 0.0003 0.0000
Sao Tome and Principe 0.0011 0.0002 0.0065 0.0026 0.0004 0.0159 0.0022 0.0004 0.0065 0.0052 0.0008 0.0157
Saudi Arabia 0.0143 0.0015 0.0402 0.0343 0.0034 0.1002 0.0298 0.0032 0.0400 0.0692 0.0070 0.0992
Senegal 0.1256 0.0058 0.5204 0.2993 0.0131 1.2674 0.2556 0.0124 0.5153 0.5949 0.0267 1.2458
Serbia 0.0051 0.0002 0.0000 0.0109 0.0006 0.0000 0.0120 0.0005 0.0000 0.0234 0.0012 0.0000
Sierra Leone 0.1020 0.0125 0.3469 0.2379 0.0276 0.8273 0.2066 0.0267 0.3420 0.4681 0.0558 0.8051
Singapore 0.0073 0.0002 0.0252 0.0174 0.0005 0.0626 0.0153 0.0004 0.0250 0.0352 0.0010 0.0620
Slovakia 0.0014 0.0000 0.0000 0.0030 0.0001 0.0000 0.0033 0.0001 0.0000 0.0064 0.0002 0.0000
Slovenia 0.0005 0.0000 0.0000 0.0012 0.0001 0.0000 0.0013 0.0001 0.0000 0.0025 0.0001 0.0000
South Africa 1.9551 0.9217 1.2769 4.5251 2.0284 3.0217 3.8863 1.9394 1.2353 8.5337 3.9253 2.8177
Spain 0.0214 0.0049 0.0000 0.0455 0.0114 0.0000 0.0504 0.0106 0.0000 0.0982 0.0234 0.0000
Sri Lanka 0.0554 0.0003 0.0892 0.1345 0.0007 0.2217 0.1128 0.0007 0.0884 0.2690 0.0015 0.2192
Sudan 0.1776 0.0475 0.7228 0.4206 0.1087 1.7806 0.3687 0.1022 0.7154 0.8457 0.2223 1.7548
Swaziland 0.0806 0.0306 0.0558 0.1807 0.0654 0.1281 0.1579 0.0636 0.0533 0.3301 0.1225 0.1157
Sweden 0.0027 0.0001 0.0000 0.0057 0.0003 0.0000 0.0063 0.0003 0.0000 0.0122 0.0007 0.0000
Switzerland 0.0022 0.0009 0.0000 0.0046 0.0022 0.0000 0.0051 0.0020 0.0000 0.0099 0.0045 0.0000
Tajikistan 0.0403 0.0027 0.0000 0.0857 0.0062 0.0000 0.0944 0.0058 0.0000 0.1833 0.0127 0.0000
Tanzania 0.5655 0.2825 1.9151 1.3395 0.6361 4.6374 1.1496 0.6078 1.8946 2.6461 1.2895 4.5299
Thailand 0.2848 0.0260 0.5807 0.6925 0.0602 0.5776 0.5806 0.0561 0.5758 1.3815 0.1232 0.5696
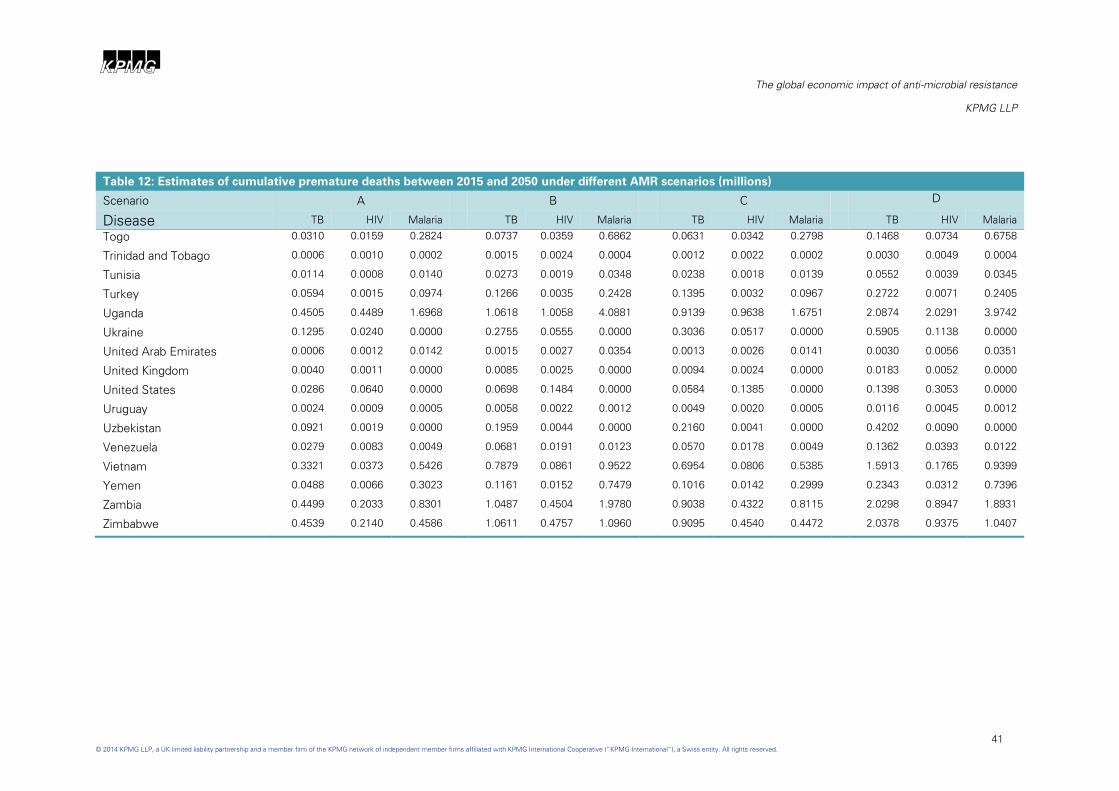
ABCD
The global economic impact of anti-microbial resistance
KPMG LLP
41
© 2014 KPMG LLP, a UK limited liability partnership and a member firm of the KPMG network of independent member firms affiliated with KPMG International Cooperative (“KPMG International”), a Swiss entity. All rights reserved.
Table 12: Estimates of cumulative premature deaths between 2015 and 2050 under different AMR scenarios (millions)
Scenario A B C D
Disease TB HIV Malaria TB HIV Malaria TB HIV Malaria TB HIV Malaria
Togo 0.0310 0.0159 0.2824 0.0737 0.0359 0.6862 0.0631 0.0342 0.2798 0.1468 0.0734 0.6758
Trinidad and Tobago 0.0006 0.0010 0.0002 0.0015 0.0024 0.0004 0.0012 0.0022 0.0002 0.0030 0.0049 0.0004
Tunisia 0.0114 0.0008 0.0140 0.0273 0.0019 0.0348 0.0238 0.0018 0.0139 0.0552 0.0039 0.0345
Turkey 0.0594 0.0015 0.0974 0.1266 0.0035 0.2428 0.1395 0.0032 0.0967 0.2722 0.0071 0.2405
Uganda 0.4505 0.4489 1.6968 1.0618 1.0058 4.0881 0.9139 0.9638 1.6751 2.0874 2.0291 3.9742
Ukraine 0.1295 0.0240 0.0000 0.2755 0.0555 0.0000 0.3036 0.0517 0.0000 0.5905 0.1138 0.0000
United Arab Emirates 0.0006 0.0012 0.0142 0.0015 0.0027 0.0354 0.0013 0.0026 0.0141 0.0030 0.0056 0.0351
United Kingdom 0.0040 0.0011 0.0000 0.0085 0.0025 0.0000 0.0094 0.0024 0.0000 0.0183 0.0052 0.0000
United States 0.0286 0.0640 0.0000 0.0698 0.1484 0.0000 0.0584 0.1385 0.0000 0.1398 0.3053 0.0000
Uruguay 0.0024 0.0009 0.0005 0.0058 0.0022 0.0012 0.0049 0.0020 0.0005 0.0116 0.0045 0.0012
Uzbekistan 0.0921 0.0019 0.0000 0.1959 0.0044 0.0000 0.2160 0.0041 0.0000 0.4202 0.0090 0.0000
Venezuela 0.0279 0.0083 0.0049 0.0681 0.0191 0.0123 0.0570 0.0178 0.0049 0.1362 0.0393 0.0122
Vietnam 0.3321 0.0373 0.5426 0.7879 0.0861 0.9522 0.6954 0.0806 0.5385 1.5913 0.1765 0.9399
Yemen 0.0488 0.0066 0.3023 0.1161 0.0152 0.7479 0.1016 0.0142 0.2999 0.2343 0.0312 0.7396
Zambia 0.4499 0.2033 0.8301 1.0487 0.4504 1.9780 0.9038 0.4322 0.8115 2.0298 0.8947 1.8931
Zimbabwe 0.4539 0.2140 0.4586 1.0611 0.4757 1.0960 0.9095 0.4540 0.4472 2.0378 0.9375 1.0407


For inquiries about this report please contact:
Yael Selfin
Head of Macroeconomics
KPMG
Phone: +44(0)20 7311 2074
Email: [email protected]
© 2014 KPMG LLP, a UK limited liability partnership and a member firm of the KPMG
network of independent member firms affiliated with KPMG International Cooperative
(“KPMG International”), a Swiss entity. All rights reserved.
For full details of our professional regulation please refer to ‘Regulatory Information’ at
www.kpmg.com/uk
The information contained herein is of a general nature and is not intended to address the
circumstances of any particular individual or entity. Although we endeavour to provide
accurate and timely information, there can be no guarantee that such information is
accurate as of the date it is received or that it will continue to be accurate in the future. No
one should act on such information without appropriate professional advice after a thorough
examination of the particular situation.
The KPMG name, logo and "cutting through complexity" are registered trademarks or
trademarks of KPMG International.