Embed Size (px)
Citation preview
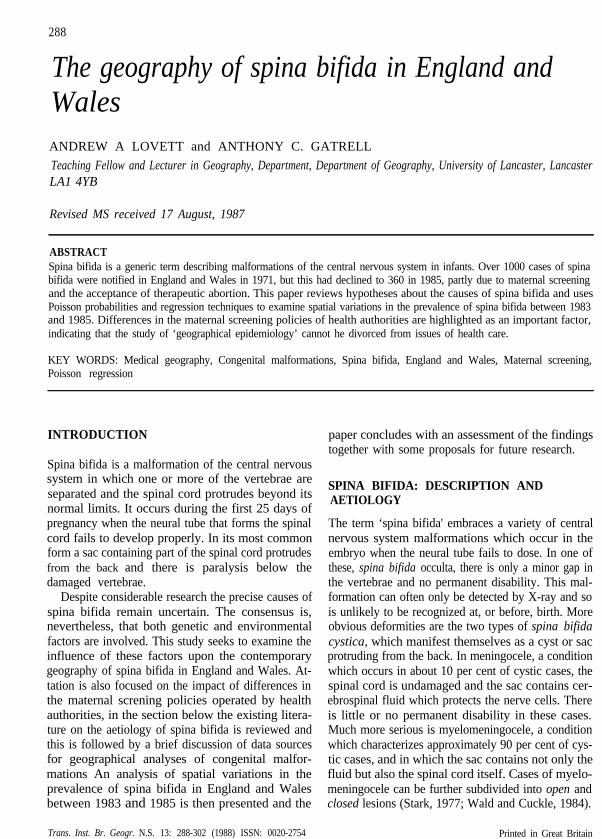
288
The geography of spina bifida in England andWalesANDREW A LOVETT and ANTHONY C. GATRELL
Teaching Fellow and Lecturer in Geography, Department, Department of Geography, University of Lancaster, LancasterLA1 4YB
Revised MS received 17 August, 1987
ABSTRACTSpina bifida is a generic term describing malformations of the central nervous system in infants. Over 1000 cases of spinabifida were notified in England and Wales in 1971, but this had declined to 360 in 1985, partly due to maternal screeningand the acceptance of therapeutic abortion. This paper reviews hypotheses about the causes of spina bifida and usesPoisson probabilities and regression techniques to examine spatial variations in the prevalence of spina bifida between 1983and 1985. Differences in the maternal screening policies of health authorities are highlighted as an important factor,indicating that the study of ‘geographical epidemiology’ cannot he divorced from issues of health care.
KEY WORDS: Medical geography, Congenital malformations, Spina bifida, England and Wales, Maternal screening,Poisson regression
INTRODUCTION
Spina bifida is a malformation of the central nervoussystem in which one or more of the vertebrae areseparated and the spinal cord protrudes beyond itsnormal limits. It occurs during the first 25 days ofpregnancy when the neural tube that forms the spinalcord fails to develop properly. In its most commonform a sac containing part of the spinal cord protrudesfrom the back and there is paralysis below thedamaged vertebrae.
SPINA BIFIDA: DESCRIPTION ANDAETIOLOGY
Despite considerable research the precise causes ofspina bifida remain uncertain. The consensus is,nevertheless, that both genetic and environmentalfactors are involved. This study seeks to examine theinfluence of these factors upon the contemporarygeography of spina bifida in England and Wales. At-tation is also focused on the impact of differences inthe maternal screning policies operated by healthauthorities, in the section below the existing litera-ture on the aetiology of spina bifida is reviewed andthis is followed by a brief discussion of data sourcesfor geographical analyses of congenital malfor-mations An analysis of spatial variations in theprevalence of spina bifida in England and Walesbetween 1983 and 1985 is then presented and the
paper concludes with an assessment of the findingstogether with some proposals for future research.
The term ‘spina bifida' embraces a variety of centralnervous system malformations which occur in theembryo when the neural tube fails to dose. In one ofthese, spina bifida occulta, there is only a minor gap inthe vertebrae and no permanent disability. This mal-formation can often only be detected by X-ray and sois unlikely to be recognized at, or before, birth. Moreobvious deformities are the two types of spina bifidacystica, which manifest themselves as a cyst or sacprotruding from the back. In meningocele, a conditionwhich occurs in about 10 per cent of cystic cases, thespinal cord is undamaged and the sac contains cer-ebrospinal fluid which protects the nerve cells. Thereis little or no permanent disability in these cases.Much more serious is myelomeningocele, a conditionwhich characterizes approximately 90 per cent of cys-tic cases, and in which the sac contains not only thefluid but also the spinal cord itself. Cases of myelo-meningocele can be further subdivided into open andclosed lesions (Stark, 1977; Wald and Cuckle, 1984).
Trans. Inst. Br. Geogr. N.S. 13: 288-302 (1988) ISSN: 0020-2754 Printed in Great Britain
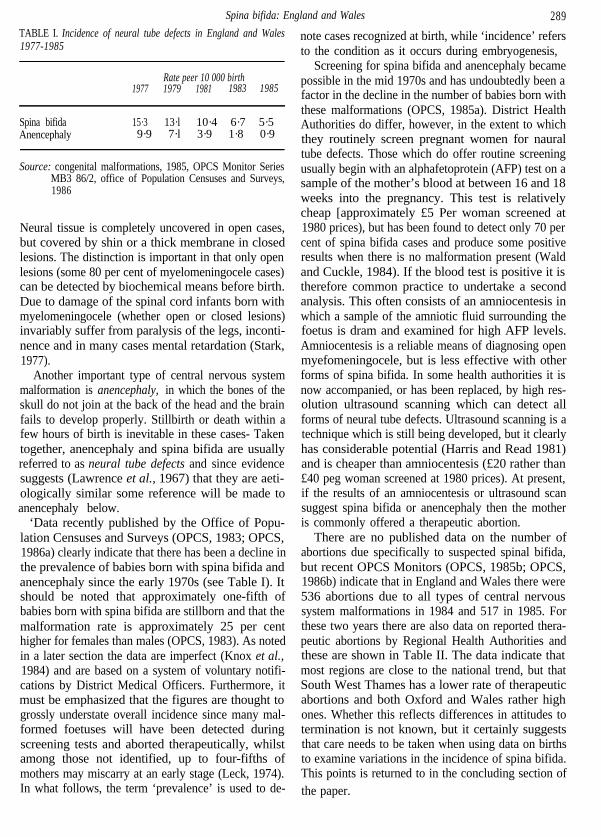
Spina bifida: England and Wales 289TABLE I. Incidence of neural tube defects in England and Wales1977-1985
Rate peer 10 000 birth1977 1979 1981 1983 1985
Spina bifida 15·3 13·l 10·4 6·7 5·5Anencephaly 9·9 7·l 3·9 1·8 0·9
Source: congenital malformations, 1985, OPCS Monitor SeriesMB3 86/2, office of Population Censuses and Surveys,1986
Neural tissue is completely uncovered in open cases,but covered by shin or a thick membrane in closedlesions. The distinction is important in that only openlesions (some 80 per cent of myelomeningocele cases)can be detected by biochemical means before birth.Due to damage of the spinal cord infants born withmyelomeningocele (whether open or closed lesions)invariably suffer from paralysis of the legs, inconti-nence and in many cases mental retardation (Stark,1977).
Another important type of central nervous systemmalformation is anencephaly, in which the bones of theskull do not join at the back of the head and the brainfails to develop properly. Stillbirth or death within afew hours of birth is inevitable in these cases- Takentogether, anencephaly and spina bifida are usuallyreferred to as neural tube defects and since evidencesuggests (Lawrence et al., 1967) that they are aeti-ologically similar some reference will be made toanencephaly below.
‘Data recently published by the Office of Popu-lation Censuses and Surveys (OPCS, 1983; OPCS,1986a) clearly indicate that there has been a decline inthe prevalence of babies born with spina bifida andanencephaly since the early 1970s (see Table I). Itshould be noted that approximately one-fifth ofbabies born with spina bifida are stillborn and that themalformation rate is approximately 25 per centhigher for females than males (OPCS, 1983). As notedin a later section the data are imperfect (Knox et al.,1984) and are based on a system of voluntary notifi-cations by District Medical Officers. Furthermore, itmust be emphasized that the figures are thought togrossly understate overall incidence since many mal-formed foetuses will have been detected duringscreening tests and aborted therapeutically, whilstamong those not identified, up to four-fifths ofmothers may miscarry at an early stage (Leck, 1974).In what follows, the term ‘prevalence’ is used to de-
note cases recognized at birth, while ‘incidence’ refersto the condition as it occurs during embryogenesis,
Screening for spina bifida and anencephaly becamepossible in the mid 1970s and has undoubtedly been afactor in the decline in the number of babies born withthese malformations (OPCS, 1985a). District HealthAuthorities do differ, however, in the extent to whichthey routinely screen pregnant women for nauraltube defects. Those which do offer routine screeningusually begin with an alphafetoprotein (AFP) test on asample of the mother’s blood at between 16 and 18weeks into the pregnancy. This test is relativelycheap [approximately £5 Per woman screened at1980 prices), but has been found to detect only 70 percent of spina bifida cases and produce some positiveresults when there is no malformation present (Waldand Cuckle, 1984). If the blood test is positive it istherefore common practice to undertake a secondanalysis. This often consists of an amniocentesis inwhich a sample of the amniotic fluid surrounding thefoetus is dram and examined for high AFP levels.Amniocentesis is a reliable means of diagnosing openmyefomeningocele, but is less effective with otherforms of spina bifida. In some health authorities it isnow accompanied, or has been replaced, by high res-olution ultrasound scanning which can detect allforms of neural tube defects. Ultrasound scanning is atechnique which is still being developed, but it clearlyhas considerable potential (Harris and Read 1981)and is cheaper than amniocentesis (£20 rather than£40 peg woman screened at 1980 prices). At present,if the results of an amniocentesis or ultrasound scansuggest spina bifida or anencephaly then the motheris commonly offered a therapeutic abortion.
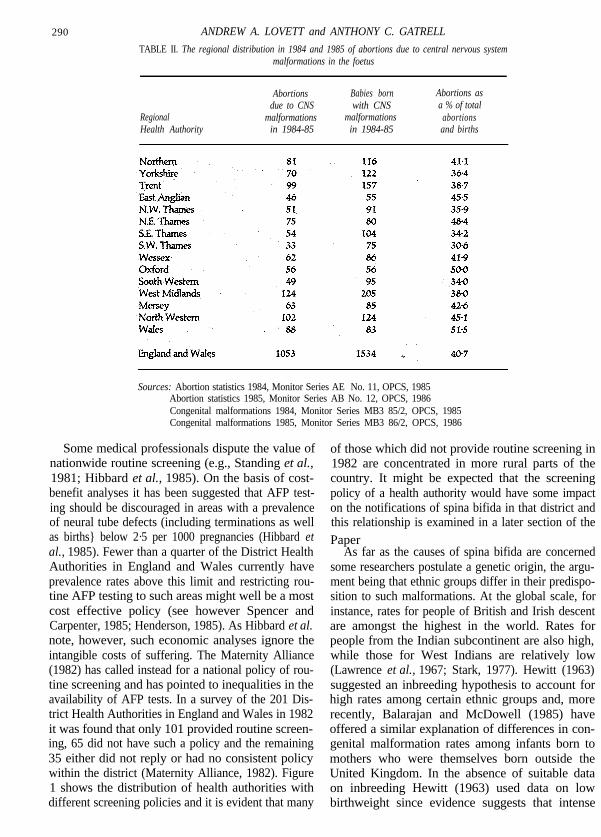
There are no published data on the number ofabortions due specifically to suspected spinal bifida,but recent OPCS Monitors (OPCS, 1985b; OPCS,1986b) indicate that in England and Wales there were536 abortions due to all types of central nervoussystem malformations in 1984 and 517 in 1985. Forthese two years there are also data on reported thera-peutic abortions by Regional Health Authorities andthese are shown in Table II. The data indicate thatmost regions are close to the national trend, but thatSouth West Thames has a lower rate of therapeuticabortions and both Oxford and Wales rather highones. Whether this reflects differences in attitudes totermination is not known, but it certainly suggeststhat care needs to be taken when using data on birthsto examine variations in the incidence of spina bifida.This points is returned to in the concluding section ofthe paper.
290 ANDREW A. LOVETT and ANTHONY C. GATRELL
TABLE II. The regional distribution in 1984 and 1985 of abortions due to central nervous systemmalformations in the foetus
RegionalHealth Authority
Abortions Babies borndue to CNS with CNS
malformations malformationsin 1984-85 in 1984-85
Abortions asa % of total
abortionsand births
Sources: Abortion statistics 1984, Monitor Series AE No. 11, OPCS, 1985Abortion statistics 1985, Monitor Series AB No. 12, OPCS, 1986Congenital malformations 1984, Monitor Series MB3 85/2, OPCS, 1985Congenital malformations 1985, Monitor Series MB3 86/2, OPCS, 1986
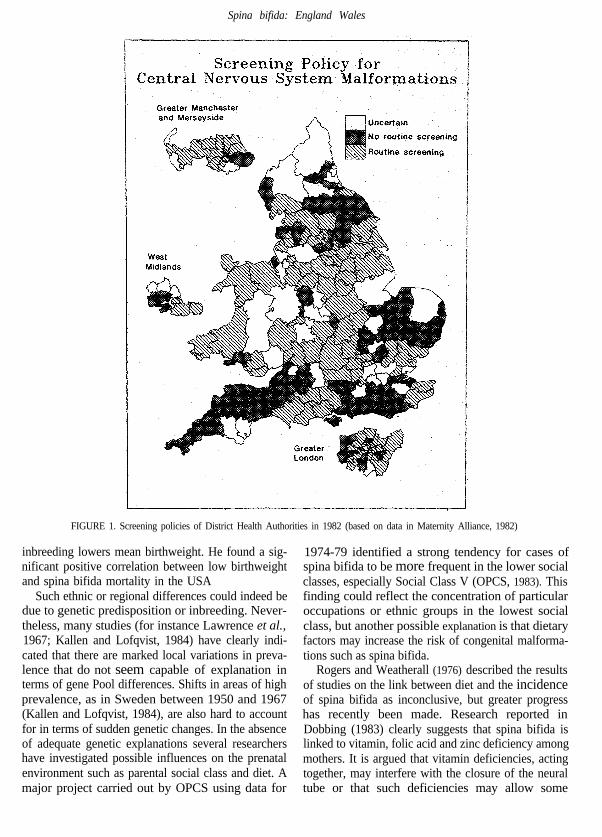
Some medical professionals dispute the value ofnationwide routine screening (e.g., Standing et al.,1981; Hibbard et al., 1985). On the basis of cost-benefit analyses it has been suggested that AFP test-ing should be discouraged in areas with a prevalenceof neural tube defects (including terminations as wellas births} below 2·5 per 1000 pregnancies (Hibbard etal., 1985). Fewer than a quarter of the District HealthAuthorities in England and Wales currently haveprevalence rates above this limit and restricting rou-tine AFP testing to such areas might well be a mostcost effective policy (see however Spencer andCarpenter, 1985; Henderson, 1985). As Hibbard et al.note, however, such economic analyses ignore theintangible costs of suffering. The Maternity Alliance(1982) has called instead for a national policy of rou-tine screening and has pointed to inequalities in theavailability of AFP tests. In a survey of the 201 Dis-trict Health Authorities in England and Wales in 1982it was found that only 101 provided routine screen-ing, 65 did not have such a policy and the remaining35 either did not reply or had no consistent policywithin the district (Maternity Alliance, 1982). Figure1 shows the distribution of health authorities withdifferent screening policies and it is evident that many
of those which did not provide routine screening in1982 are concentrated in more rural parts of thecountry. It might be expected that the screeningpolicy of a health authority would have some impacton the notifications of spina bifida in that district andthis relationship is examined in a later section of thePaper
As far as the causes of spina bifida are concernedsome researchers postulate a genetic origin, the argu-ment being that ethnic groups differ in their predispo-sition to such malformations. At the global scale, forinstance, rates for people of British and Irish descentare amongst the highest in the world. Rates forpeople from the Indian subcontinent are also high,while those for West Indians are relatively low(Lawrence et al., 1967; Stark, 1977). Hewitt (1963)suggested an inbreeding hypothesis to account forhigh rates among certain ethnic groups and, morerecently, Balarajan and McDowell (1985) haveoffered a similar explanation of differences in con-genital malformation rates among infants born tomothers who were themselves born outside theUnited Kingdom. In the absence of suitable dataon inbreeding Hewitt (1963) used data on lowbirthweight since evidence suggests that intense
Spina bifida: England Wales
FIGURE 1. Screening policies of District Health Authorities in 1982 (based on data in Maternity Alliance, 1982)
inbreeding lowers mean birthweight. He found a sig-nificant positive correlation between low birthweightand spina bifida mortality in the USA
Such ethnic or regional differences could indeed bedue to genetic predisposition or inbreeding. Never-theless, many studies (for instance Lawrence et al.,1967; Kallen and Lofqvist, 1984) have clearly indi-cated that there are marked local variations in preva-lence that do not seem capable of explanation interms of gene Pool differences. Shifts in areas of highprevalence, as in Sweden between 1950 and 1967(Kallen and Lofqvist, 1984), are also hard to accountfor in terms of sudden genetic changes. In the absenceof adequate genetic explanations several researchershave investigated possible influences on the prenatalenvironment such as parental social class and diet. Amajor project carried out by OPCS using data for
1974-79 identified a strong tendency for cases ofspina bifida to be more frequent in the lower socialclasses, especially Social Class V (OPCS, 1983). Thisfinding could reflect the concentration of particularoccupations or ethnic groups in the lowest socialclass, but another possible explanation is that dietaryfactors may increase the risk of congenital malforma-tions such as spina bifida.
Rogers and Weatherall (1976) described the resultsof studies on the link between diet and the incidenceof spina bifida as inconclusive, but greater progresshas recently been made. Research reported inDobbing (1983) clearly suggests that spina bifida islinked to vitamin, folic acid and zinc deficiency amongmothers. It is argued that vitamin deficiencies, actingtogether, may interfere with the closure of the neuraltube or that such deficiencies may allow some
292 ANDREW A. LOVETT and ANTHONY C. GATRELL
unknown teratogen (an agent causing malformations)to have an influence. There are, however, still difficul-ties in evaluating the relationship between diet andcongenital malformations since, as Baird (1974) ar-guest it may not be diet during early pregnancy that isaetiologically sign&ant but rather conditions duringthe mother’s childhood. This interpretation, alongwith improvements in the nutritional status ofwomen during the post-war years, may help toexplain the recent decline in the prevalence of centralnervous system malformations. Together, these find-ings certainly suggest that environmental factorshave an important role, although it has been arguedthat they are essentially a 'trigger' which only acts ongenetically susceptible sub-sections of the population(Rogers and Morris, 1971).
An environmental factor which has been the sub-ject of considerable investigation is water quality.Two studies in South Wales have produced conflict-ing results. Lawrence et al. (1967) concluded thatthere was no relationship between the prevalence ofneural tube defects and water hardness, whereasLowe et al. (1971) found a significant negative corre-lation which persisted even when a control was madefur social class. Using data for towns in the UK,Fedrick (1970) identified a negative correlationbetween anencephaly rates and water hardness (cal-cium content) and similar results were reported byCrawford et al. (1972). Fedrick (197O) suggested thatone reason for the relationship was that softer, acidicwaters might dissolve the lead from aid pipes and thatthis agent could contribute to foetal malformations.
In addition to ecological analysis at the national orregional scale Lowe et al. (1971.) suggested that itwas also important to compare samples of tap waterfrom houses of women who had delivered mal-formed infants with those from the homes of a con-trol group who had given birth to normal infants.One such study by Morten et al. (1976) found thatcongenital malformation rates were positively cor-related with aluminium content and negatively as-sociated with calcium, copper and barium levels.These findings were not, however, confirmed bythe more extensive research of St Leger et al.,(1980). In this analysis the only significant differenceidentified was for zinc, the concentration being lowerfor the cases of malformations than the controls.
One of the most persuasive arguments yet pre-sented for an association between central nervoussystem malformations and water quality is the studyby Dorsch et al. (1984 based on 218 case-controlpairs in Southn Australia. They compared women who
had consumed only rainwater during their pregnancywith women whose source of water was principallygroundwater and found that the latter group had astatistically significant increase in the risk of bearing amalformed child. The authors then analysed the waterfor nitrate concentration and found substantiallyhigher concentrations in the groundwater. Of par-ticular interest is the finding that:
. . . the distribution of water containing high concen-trations of nitrate in this aquifer coincides with the areaswhere large amounts of waste have been disposed ofdirectly underground within a confined area. (Dorschet al., 1984, p. 475).
This point suggests that it may be important toconsider the potential teratogenic effects of poordomestic and industrial waste disposal. There is cer-tainly some evidence of higher rates of congenitalmalformations in areas around major waste disposalsites. One of the most notorious examples is LoveCanal, a suburb of Niagara City in New York State,where a housing estate was built in the 1950s on topof a recently closed chemical dump. During the 1970sit became apparent that chemicals were leaking fromthe dump and in 1978 a large part of the estate wasevacuated and has now been fenced off. Considerablecontroversy surrounds some of the medical researchsubsequently carried out at Love Canal (Landy, 1986),but one study quoted by Hildyard (1983) calculatedthat in the worst affected areas between 1974 and1978 a fifth-of the children born had congenital mal-formations, compared to a ratio of 1 in 14 for theimmediate surrounding area. There has been nothingon the scale of Love Canal in the United Kingdom,but given the doubts expressed by the HazardousWaste Inspectorate (HWI, 1985) about some wastedisposal practices there would seem to be a case for aninvestigation of the links between malformations andgroundwater pollution in this country. There are,however, many difficulties in such research, particu-larly since regulation of hazardous waste disposalcommenced only 15 years ago and it is possible to dolittle more than speculate about contamination ofwater supplies by disused waste dumps whoselocations are unrecorded.
THE AVAILABILITY AND QUALITY OFDATA ON CONGENITALMALFORMATIONS
A national scheme for the monitoring of all congeni-tal malformations was established in 1964 and is now
Spina bifida: England and Wales 293
operated by the Office of Population Censuses andSurveys. In the wake of the thalidomide tragedy theneed was ‘to detect sudden increases in the incidenceof any particular malformation or group of malforma-tions’ (OPCS, 1983, p. iv}. The precise manner inwhich malformation data are assembled variesbetween District Health Authorities, but DistrictMedical Officers are formally responsible for collect-ing data from either midwives, doctors delivering ababy or hospital administrators. The data are thenforwarded to OPCS using a notification form (Rogersand Weatherall, 1976). Two points need to be madeabout this notification procedure. First, only n&for-mations identified during the first week of life areincluded on the notification form. Secondly, thesystem is voluntary, so that if the District MedicalOfficer is not informed the data forwarded to OPCSwill be incomplete.
The first point is only a slight problem in the caseof spina bifida (especially cystic farms), since theseverity of the malformation is such that it should bedetectable at birth. The second caveat is, however,more significant and may explain same of the imper-fections in the data to which Knox et al. (1984 havedrawn attention. They compared notifications madeto OPCS of several classes of malformations withthose recorded independently by the Department ofSocial Medicine at Birmingham University. TheBirmingham register is widely regarded as reliableand the results of the comparison suggested that for‘neural tube defects the accuracy of reporting (toOPCS) was poor’ (Knox et al., 1984, p. 303). Between1972 and 1978 only about half of the cases of centralnervous system malformations recognized by theBirmingham register were entered on the OPCSrecords. The situation in Birmingham may be excep-tional since there is evidence that fewer malfor-mations may be reported to OPCS in those areaswhere a separate local register exists (Batting, 1987;Macfarlane, 1987). Nevertheless it needs to be recog-nized that there are problems of under-reportingwithin the OPCS system and it should also bestressed that the QPCS data cover only births andexclude miscarriages or terminations due to neuraltube defects. The ‘true’ incidence. of spina bifida isconsequently underestimated in several importantrespects.
These limitations mean that some caution isrequired when using the OPCS data to examine thegeography of spina bifida in England and Wales.There are, however, no better data at a national scaleand an ecological analysis would at least seem to
provide a starting paint far any assessment of the roleof genetic and environmental factors. In any area-based study there is nevertheless a need to be awareof the ‘ecological fallacy' (Langbein and Lichtman,1978) and in the analysis described below a particularproblem is the lack of information on mobility. Theinterpretation of the results assumes that cases ofspina bifida notified within a health authority wereborn to mothers who had spent their pregnancy asresidents of the district. It is, however, quite possiblethat an apparent excess of spina bifida in one auth-ority may simply reflect the in-migration of two orthree mothers during the course of pregnancy. Theproblems concerning the scale of the analysis (such asthe size of the District Health Authorities) and theneed far individual-level data and case-control stud-ies are assessed in the concluding section.
THE CONTEMPORARY GEOGRAPHY OFSPINA BIFIDA IN ENGLAND AND WALES
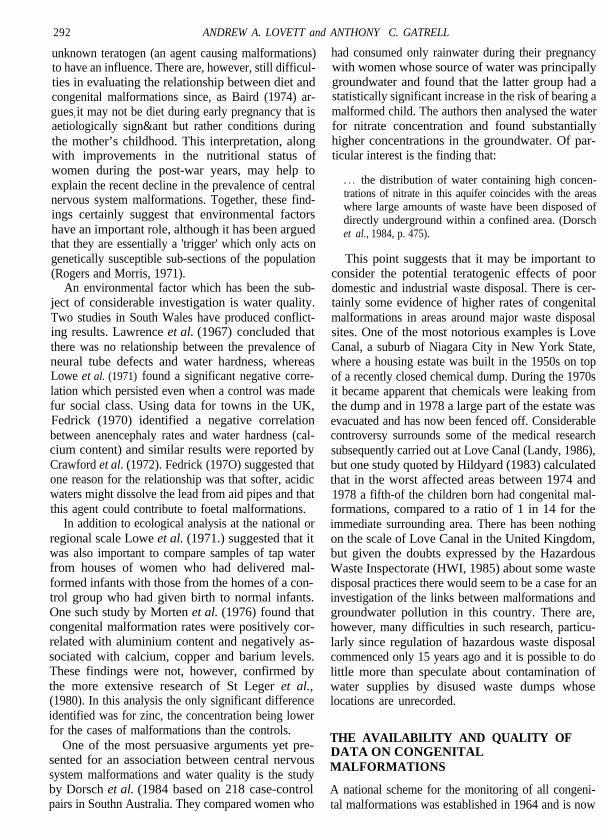
In order to examine the contemporary distribution ofspina bifida in England and Wales the OPCS notifi-cation data for the period 1983-85 were mapped (seeFig. 2). Many of the higher rates occurred in coastaldistricts whilst central England and the London con-urbation were characterized by lower values. Twocontrasts with the 1971-80 pattern described inOPCS (1983) should also be noted. These are theemergence of relatively high rates in parts of southernEngland and the less prominent position of the EastMidlands and North West.
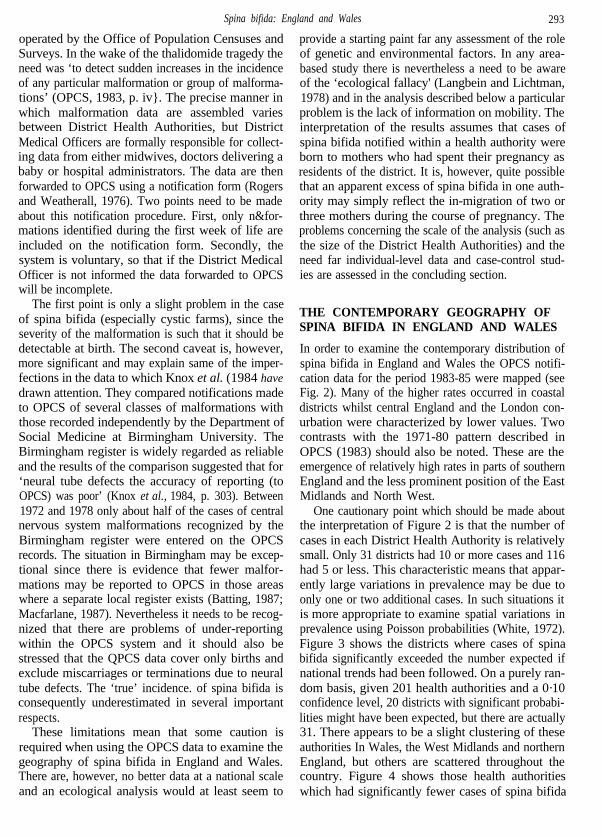
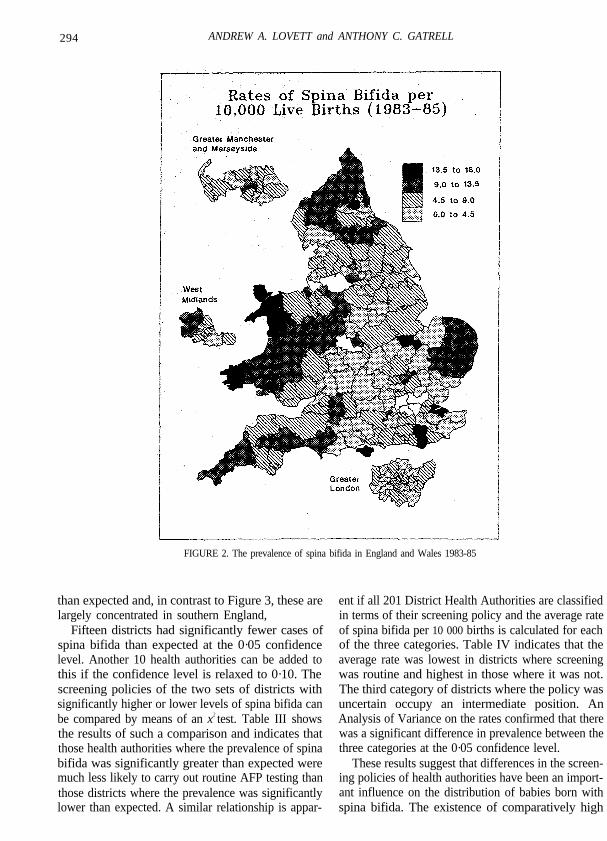
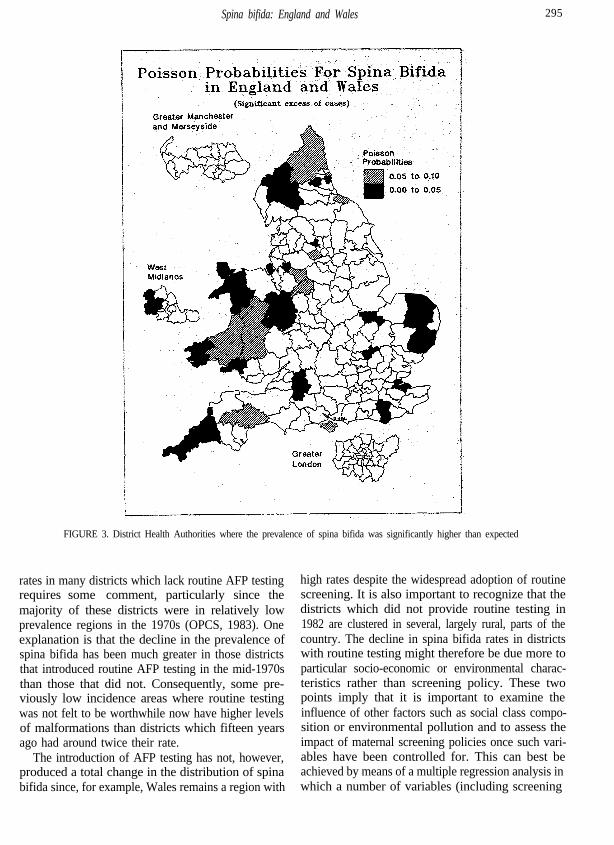
One cautionary point which should be made aboutthe interpretation of Figure 2 is that the number ofcases in each District Health Authority is relativelysmall. Only 31 districts had 10 or more cases and 116had 5 or less. This characteristic means that appar-ently large variations in prevalence may be due toonly one or two additional cases. In such situations itis more appropriate to examine spatial variations inprevalence using Poisson probabilities (White, 1972).Figure 3 shows the districts where cases of spinabifida significantly exceeded the number expected ifnational trends had been followed. On a purely ran-dom basis, given 201 health authorities and a 0·10confidence level, 20 districts with significant probabi-lities might have been expected, but there are actually31. There appears to be a slight clustering of theseauthorities In Wales, the West Midlands and northernEngland, but others are scattered throughout thecountry. Figure 4 shows those health authoritieswhich had significantly fewer cases of spina bifida
294 ANDREW A. LOVETT and ANTHONY C. GATRELL
FIGURE 2. The prevalence of spina bifida in England and Wales 1983-85
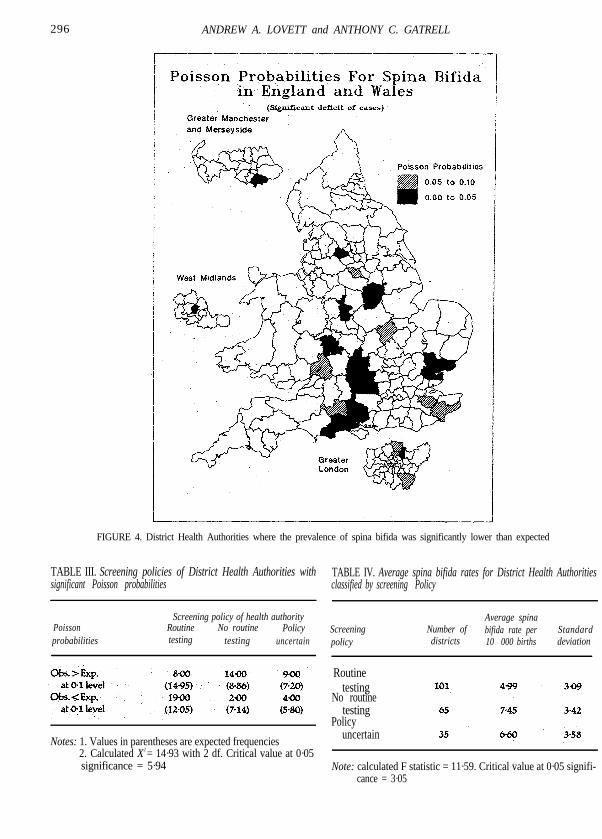
than expected and, in contrast to Figure 3, these arelargely concentrated in southern England,
Fifteen districts had significantly fewer cases ofspina bifida than expected at the 0·05 confidencelevel. Another 10 health authorities can be added tothis if the confidence level is relaxed to 0·10. Thescreening policies of the two sets of districts withsignificantly higher or lower levels of spina bifida canbe compared by means of an x2 test. Table III showsthe results of such a comparison and indicates thatthose health authorities where the prevalence of spinabifida was significantly greater than expected weremuch less likely to carry out routine AFP testing thanthose districts where the prevalence was significantlylower than expected. A similar relationship is appar-
ent if all 201 District Health Authorities are classifiedin terms of their screening policy and the average rateof spina bifida per 10 000 births is calculated for eachof the three categories. Table IV indicates that theaverage rate was lowest in districts where screeningwas routine and highest in those where it was not.The third category of districts where the policy wasuncertain occupy an intermediate position. AnAnalysis of Variance on the rates confirmed that therewas a significant difference in prevalence between thethree categories at the 0·05 confidence level.
These results suggest that differences in the screen-ing policies of health authorities have been an import-ant influence on the distribution of babies born withspina bifida. The existence of comparatively high
Spina bifida: England and Wales 295
rates in many districts which lack routine AFP testingrequires some comment, particularly since themajority of these districts were in relatively lowprevalence regions in the 1970s (OPCS, 1983). Oneexplanation is that the decline in the prevalence ofspina bifida has been much greater in those districtsthat introduced routine AFP testing in the mid-1970sthan those that did not. Consequently, some pre-viously low incidence areas where routine testingwas not felt to be worthwhile now have higher levelsof malformations than districts which fifteen yearsago had around twice their rate.
The introduction of AFP testing has not, however,produced a total change in the distribution of spinabifida since, for example, Wales remains a region with
high rates despite the widespread adoption of routinescreening. It is also important to recognize that thedistricts which did not provide routine testing in1982 are clustered in several, largely rural, parts of thecountry. The decline in spina bifida rates in districtswith routine testing might therefore be due more toparticular socio-economic or environmental charac-teristics rather than screening policy. These twopoints imply that it is important to examine theinfluence of other factors such as social class compo-sition or environmental pollution and to assess theimpact of maternal screening policies once such vari-ables have been controlled for. This can best beachieved by means of a multiple regression analysis in which a number of variables (including screening
FIGURE 3. District Health Authorities where the prevalence of spina bifida was significantly higher than expected
296 ANDREW A. LOVETT and ANTHONY C. GATRELL
FIGURE 4. District Health Authorities where the prevalence of spina bifida was significantly lower than expected
TABLE III. Screening policies of District Health Authorities with TABLE IV. Average spina bifida rates for District Health Authoritiessignificant Poisson probabilities classified by screening Policy
Poissonprobabilities
Screening policy of health authorityRoutine No routine Policytesting testing uncertain
Screeningpolicy
Number ofdistricts
Average spinabifida rate per10 000 births
Standarddeviation
Routine
Notes: 1. Values in parentheses are expected frequencies2. Calculated X2 = 14·93 with 2 df. Critical value at 0·05significance = 5·94
testingNo routine
testingPolicy
uncertain
Note: calculated F statistic = 11·59. Critical value at 0·05 signifi-cance = 3·05
Spina bifida: England and Wales 297
policy) are used to try to account for spatial variationsin the prevalence of spina bifida.
THE MULTIPLE REGRESSION ANALYSIS
Given the small number of cases in each health auth-ority it was felt inappropriate to use the spina bifidarate per 10 000 births as the dependent variable in themultiple regression analysis. If, however, a count ofthe number of babies born with spina bifida is usedthen many of the assumptions of conventionalOrdinary Least Squares regression are untenable(Flowerdew and Aitkin, 1982). In particular the dis-crete nature of the dependent variable must be takeninto account and this can best be done by using aPoisson regression model. Poisson regression tech-niques have been described in detail by several ge-ographers (e.g., Flowerdew and Aitken, 1982; Lovettet al., 1986) and so only a brief outline will be givenhere.
The main characteristics of Poisson regression canbe most easily described by means of a comparisonwith conventional Ordinary Least Squares re-gression. In Ordinary Least Squares regression thepredicted values of the dependent variable are givenby a linear combination of the independent variables.The predicted value ýi can also be regarded as theestimated mean of a normally distributed random variable Yi, one possible realization of which is theobserved value yi of the dependent variable. The dif-ference between the observed and predicted values ofthe dependent variable can therefore be evaluated interms of the probability of a value of Yi being equal toyi. Poisson regression differs from Ordinary LeastSquares in that the random variable Yi is regarded ashaving a Poisson distribution, an assumption which ismuch more appropriate when the dependent variableconsists of counts. In addition, the predicted value ýi
is not identical to a linear combination of the indepen-dent variables, but logarithmically linked. The equa-tion for a Poisson regression model can therefore bepresented as:
where K is the number of independent variables; xij isthe value of the ith observation on the jth indepen-dent variable; ßOis the intercept, the value of ý when
each independent variable equals zero; and ßj is theamount by which ý changes when the value of the jthindependent variable increases by one unit and thoseof the others are held constant.
Maximum likelihood estimates for the parametersof a Poisson regression model can be obtained byusing an iteratively reweighted least squares pro-cedure such as that available in the GLIM computerpackage (O’Brien, 1983). In GLIM the goodness of fitfor a Poisson regression model is measured by thelog-likelihood ratio statistic, also known as thedeviance. This is given by the equation:
(3)
where d is the deviance. A small deviance value indi-cates a good fit and it is possible to test whether theregression model could have produced the observeddata by comparing the deviance with the criticalvalue of x2 fur the appropriate significance level andnumber of degrees of freedom. If the deviance is lessthan the critical value the model can be regarded as asatisfactory fit at the chosen significance level. Apartfrom this test of overall fit it is also possible to evalu-ate the significance of individual variables as they areadded to the regression model. This is done by com-paring the reduction in deviance that occurs with thecritical value of x2 for the corresponding loss of de-grees of freedom. If the decline in deviance is greater,then the variable can be considered significant at thechosen confidence level.
The main sources of variables for the multipleregression analysis were the 1981 census and OPCSMonitors. Table V lists the variables used and theirmnemonics. Census variables were ‘selected on thebasis of previous findings about the aetiology ofspina bifida, and the SASPAC package (Rhind, 1983)was used to obtain data for the 201 District HealthAuthorities in England and Wales. In addition dataon the number of births and cases of spina bifida ineach health authority were taken from the OPCSMonitor Series MB3 (OPCS, 1984, 1985a, 1986a).Details of the percentage of babies with low birthweight were derived from the OPCS Monitor SeriesDH3 (OPCS, 1985c) and the screening variable wasobtained from the previously discussed MaternityAlliance survey (Maternity Alliance, 1982). It wouldhave been desirable to include data on water qualityand hazardours waste disposal in each District Health Authority, but such details essentially refer to points(e.g., landfill sites, incinerators, or water samplingstations) and overall figures for areas may not be
o r
(1)
(2)

298 ANDREW A. LOVETT and ANTHONY C. GATRELL
TABLE V. Variables used in the multiple regression analysis TABLE VI. Results of the Poisson regression analysis
Mnemonic Variable descriptionDegrees of
freedom
Critical valueof x2 at 0·05significance
SB Number of cases of spina bifida 1983-85 B Total number of live and still births 1983-85SC Screening policy of health authority in 1982LBW Percentage of total births weighing under 2500 gms
in1984
Model Deviance
ICABlNDPAKU
Percentage of female residents born in EirePercentage of female residents born in the CaribbeanPercentage of female residents born in IndiaPercentage Of female residents born in PakistanPercentage of the economically active populationunemployed
LA Percentage of residents living in council housingLC Percentage of residents in households lacking a carCl2 Percentage of residents in households with a head
classified as Social Class 1 or 2AG Percentage of economically active residents
employed in agriculture
Note: All census variables are for 1981
particularly meaningful. There are, in any case, noreadily available data on these variables for allDistrict Health Authorities in England and Wales andso in what follows they are considered largely interms of accounting for regression residuals.
The first step in the Poisson regression analysiswas to check whether any of the independent vari-ables needed to be transformed As a result of a seriesof plots it was decided to use the natural log trans-formation of number of births (LOGB) and retain theother variables in their original form. A Poisson re-gression model containing only an intercept term wasthen fitted in order to provide a measure of the vari-ation in the dependent variable around its mean.Once this benchmark had been established a stepwisemethod was used in which each independent variablewas separately added to the existing model and theone which produced the largest reduction in deviancewas incorporated into the model if a X2. test on thedecline in deviance was significant. This stepwiseprocedure was repeated until no further significantreductions in deviance could be obtained
Table VI summarizes the results of the regressionanalysis. The first independent variable to be includedwas the log transformation of number of births(LOGB) and the addition of the screening variable(SC) as a three category factor produced a furtherlarge drop in deviance to 305·3. This model (LOGB +SC) can be thought of as a set of three regression lineswith difference intercepts but a common slope. The
Null 554·11 200 240·6LOGB 349-28 199 239·5
+SC 305·32 197 237·3+ CAB 285·04 196 236·2+ U 266·88 195 235-I+ AG 256·03 194 234-O+ SC.U 249·02 192 231·8
highest intercept value was for districts where therewas no routine screening whilst the lowest was forthose health authorities where AFP testing was stan-dard practice. Such a result supports the hypothesisthat the absence of routine AFP testing in a healthauthority contributed to a higher prevalence of babiesborn with spina bifida.
The next independent variable to be included inthe regression analysis was the percentage of femaleresidents born in the Caribbean (CAB). This had anegative parameter estimate which may reflect gene-tic factors since previous studies have suggested thatpeople of Caribbean origin are less vulnerable tospina bifida than those of European descent (Hewitt,1963). Given the small size of the Caribbean bornpopulation (no more than 9 per cent of female resi-dents in any health authority) this interpretationshould, however, be treated with a degree of caution.Et could also be argued that the negative parameterestimate for females of Caribbean origin simply re-flects the low prevalence of spina bifida in some of themajor conurbations (particularly London) and thehigh levels of some rural areas. This pattern is inalmost direct contrast to the distribution of theCaribbean born population (Peach, 1982).
Further cycles through the stepwise procedure ledto two more variables being included in the re-gression model. The first of these was percentageunemployment (U) and the second was the percent-age of the economically active population employedin agriculture (AG). Both of these variables had posi-tive parameter estimates. In the case of unemploy-ment this result can be regarded as a reflection of theknown social class gradient in the incidence of spinabifida, with babies born to mothers in the lowerclasses being at a greater risk due to possible de-ficiencies in the maternal diet (Baird, 1974; Robbing,1983), The positive parameter for agricultural
Spina bifida: England and Wales 299
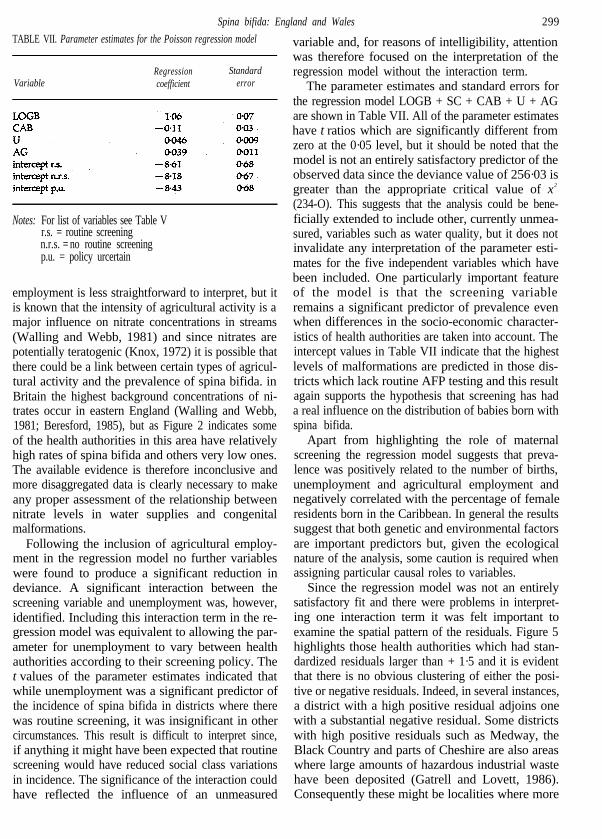
TABLE VII. Parameter estimates for the Poisson regression model
Variable Regressioncoefficient
Standarderror
Notes: For list of variables see Table Vr.s. = routine screeningn.r.s. = no routine screeningp.u. = policy urcertain
employment is less straightforward to interpret, but itis known that the intensity of agricultural activity is amajor influence on nitrate concentrations in streams(Walling and Webb, 1981) and since nitrates arepotentially teratogenic (Knox, 1972) it is possible thatthere could be a link between certain types of agricul-tural activity and the prevalence of spina bifida. inBritain the highest background concentrations of ni-trates occur in eastern England (Walling and Webb,1981; Beresford, 1985), but as Figure 2 indicates someof the health authorities in this area have relativelyhigh rates of spina bifida and others very low ones.The available evidence is therefore inconclusive andmore disaggregated data is clearly necessary to makeany proper assessment of the relationship betweennitrate levels in water supplies and congenitalmalformations.
Following the inclusion of agricultural employ-ment in the regression model no further variableswere found to produce a significant reduction indeviance. A significant interaction between thescreening variable and unemployment was, however,identified. Including this interaction term in the re-gression model was equivalent to allowing the par-ameter for unemployment to vary between healthauthorities according to their screening policy. Thet values of the parameter estimates indicated thatwhile unemployment was a significant predictor ofthe incidence of spina bifida in districts where therewas routine screening, it was insignificant in othercircumstances. This result is difficult to interpret since,if anything it might have been expected that routinescreening would have reduced social class variationsin incidence. The significance of the interaction couldhave reflected the influence of an unmeasured
variable and, for reasons of intelligibility, attentionwas therefore focused on the interpretation of theregression model without the interaction term.
The parameter estimates and standard errors forthe regression model LOGB + SC + CAB + U + AGare shown in Table VII. All of the parameter estimateshave t ratios which are significantly different fromzero at the 0·05 level, but it should be noted that themodel is not an entirely satisfactory predictor of theobserved data since the deviance value of 256·03 isgreater than the appropriate critical value of x2
(234-O). This suggests that the analysis could be bene-ficially extended to include other, currently unmea-sured, variables such as water quality, but it does notinvalidate any interpretation of the parameter esti-mates for the five independent variables which havebeen included. One particularly important featureof the model is that the screening variableremains a significant predictor of prevalence evenwhen differences in the socio-economic character-istics of health authorities are taken into account. Theintercept values in Table VII indicate that the highestlevels of malformations are predicted in those dis-tricts which lack routine AFP testing and this resultagain supports the hypothesis that screening has hada real influence on the distribution of babies born withspina bifida.
Apart from highlighting the role of maternalscreening the regression model suggests that preva-lence was positively related to the number of births,unemployment and agricultural employment andnegatively correlated with the percentage of femaleresidents born in the Caribbean. In general the resultssuggest that both genetic and environmental factorsare important predictors but, given the ecologicalnature of the analysis, some caution is required whenassigning particular causal roles to variables.
Since the regression model was not an entirelysatisfactory fit and there were problems in interpret-ing one interaction term it was felt important toexamine the spatial pattern of the residuals. Figure 5highlights those health authorities which had stan-dardized residuals larger than + 1·5 and it is evidentthat there is no obvious clustering of either the posi-tive or negative residuals. Indeed, in several instances,a district with a high positive residual adjoins onewith a substantial negative residual. Some districtswith high positive residuals such as Medway, theBlack Country and parts of Cheshire are also areaswhere large amounts of hazardous industrial wastehave been deposited (Gatrell and Lovett, 1986).Consequently these might be localities where more

300 ANDREW A. LOVETT and ANTHONY C. GATRELL
FIGURE 5. Standardized residuals from the Poisson regression model LOGB + SC + CAB + AG
detailed investigation of the links between environ- number of babies born with spina bifida in that dis-mental pollution and congenital malformations wouldbe merited.
CONCLUSIONS
it should be clear from the above that there is nosimple explanation of the distribution of spina bifidain England and Wales. The Poisson regression analy-sis nevertheless implies that variations in social classand ethnic composition are important factors andsuggests that the role of water quality (and hazardouswaste disposal) needs to be investigated in more de-tail. An additional feature of the analysis was that thematernal screening policy adopted by a health auth-ority was found to be a significant predictor of the
trict. There would seem to be little doubt that re-gional differences in the implementation of AFPtesting have been responsible for significant changesin the prevalence and distribution of spina bifida inEngland and Wales since the mid 1970s. Implement-ing routine AFP testing throughout the countrymight not be particularly cost-effective (Hibbard etal., 1985), but it is surely inconsistent if many of thedistricts with the highest prevalence do not providesuch a service. The results reported in this paper cer-tainIy suggest that those health authorities which donot offer routine AFP testing should, at least, reviewtheir policies.
Two limitations of the work described in this papermust be noted. The first concerns the scale of analysis.
Spina bifida: England and Wales
ACKNOWLEDGEMENTS
301
Although it has been possible to identify those dis-tricts in which the prevalence of spina bifida was sig-nificantly different from national trends there is noinformation on where, within the health authorities,the malformations actually occurred. This, forexample, means that any assessment of the linksbetween a point source of environmental pollutionand the distribution of congenital malformations canbe little more than speculation. The cases notified toOPCS are currently being postcoded and it is antici-pated that information on malformations by postcodesector will be available in the near future (McDowall,1985). This would allow more detailed epidemi-ological analysis, but the restrictions of an ecologicalapproach would still exist.
The second limitation concerns the coverage andreliability of the OPCS notification data, particu-larly the problems posed by suspected differencesin reporting levels between districts. It is unlikelythat these deficiencies are sufficiently severe toinvalidate the analysis reported here, but betterquality data would be desirable. For some parts ofthe country such as Birmingham (Knox et al., 1984)and Glasgow {Stone and Hamilton, 1987) there areindependent registers of congenital malformations,some of which predate the OPCS system. Like theOPCS records these do not include miscarriages ortherapeutic abortions, but they do contain data onindividual cases of malformations and, fur their ownregistration area, invariably have better coverageand more reliable diagnosis than OPCS. If therecords in such registers were gee-coded it wouldbe feasible to undertake a much more satisfactoryepidemiological investigation of congenital malfor-mations. Ideally, such a study would use a case-control approach (Kelsey et al., 1986) to examinethe role of factors such as parental occupation, diet,water quality and proximity to waste disposal sites.There would still be the problem of examining onlyprevalence at birth rather than overall incidence,but it is hard to see how this could be overcomewithout widespread access to medical records andthe attendant difficulties which this would entail.The present study, with its focus on factorsinfluencing the geography of spina bifida at anational scale, has provided a context in which suchintensive local research can be set. In highlightingthe role of maternal screening, it also provides anapposite example in support of Mayer’s (1982) callfor a removal of the artificial barriers between theepidemiological and health care traditions in medi-cal geography.
An earlier version of this paper was presented at theAnnual Conference of the Institute of British Geogra-phers in Portsmouth, 8 January, 1987. The authors aregrateful for the many helpful comments made duringdiscussion of the paper and would particularly like toacknowledge the contributions of Graham Bentham,Robin Flowerdew and Robin Haynes. We wouldalso like to thank Sandra Irish, Claire Jarvis andPeter Mingins of the Department of Geography,University of Lancaster for their assistance during thepreparation of the paper.
REFERENCES
BAIRD, D. (1974) ‘Epidemiology of congenital malforma-tions of the central nervous system in Aberdeen andScorland', J. Biosoc. Sci. 6: 113-37
BALARAJAN, R and McDOWALL, M (1985) ‘Mortalityfrom congenital malformations by mother’s country ofbirth’ J. Epidemiol. Community Health 39: 102-6
BERESFORD, S. A. A. (1985) ‘Is nitrate in the drinkingwater associated with the risk of cancer in the urban UK?‘,lnt. J. Epidemiol. 14: 57-63
BUTTING, B. J. (1987) Personal communication, 26February, 1987.
CRAWFORD, M. D, GARDNER M. J. and SEDGWICK,P. A (1972) 'Infant mortality and hardness of watersupplies', Lancet 1: 988-92
DOBBING, J. (ed.) (1983) Prevention of bifida and otherneural tube defects (Academic Press, London)
DORSCH, M. M., SCRAGG, R K, McMICHAEL, A. J.,BAGHURST, P. A and DYER, K. F. (1984) 'Congenitalmalformations and maternal drinking water supply inrural South Australia: a case-control study', Am. J.Epidemiol. 119: 473-86
FEDRICK, J. (1970) ‘Anencephalus and local watersupply’, Nature 227: 176
FLOWERDEW, R and AITKIN, M. (1982) 'A method offitting the gravity model based on the Poisson distri-bution’, J. Reg, Sci. 22: 191-202
GATRELL, A. C. and LOVETT, A. A. (1986) ‘The geogra-phy of hazardous waste disposal in England and Wales'Area 18: 275-83
HARRIS, R. and READ, A P. (1981) 'New uncertainties inprenatal screening for neural tube defects', Br. Med. J.282: 14160-18
HAZARDOUS WASTE INSPECTORATE (1985) Hazard-ous waste management: an overview, First Report of theHazardous Waste Inspectorate, (Department of theEnvironment, London)
HENDERSON, J. B. (1985) 'Letter to the Editor', Br. Med. J.290: 711
302 ANDREW A. LOVETT and ANTHONY C. GATRELL
HEWITT, D. (1963) 'Geographical variations in themortality attributed to spina bifida and other congenitalmalformations’, Br. J. Prev. Soc. Med. 17: 13-22
HIBBABD, B. M., ROBERTS C. J., ELDER G. H., EVANS,K. T. and LAWRENCE, K. M. (1985) ‘Can we affordscreening for neural tube defects? The South Wales ex-perience', Br. Med. J. 290:293-5
HILDYARD, N. (1983) Cover-up (New English Library,Sevenoaks)
KALLEN, B. and LOFQVIST, E. (1984) Time trends ofspina bifida in Sweden .1947-1981', J. Epidemiol. Com-munity Health 38:103-7
KELSEY, J. L., THOMPSON, W. D. and EVANS, A. S.(1986) Methods in observational epidemiology (OxfordUniversity Press, Oxford)
KNOX, E. G. (1972) ‘Anencephalus and dietary intakes’, Br.J. of Soc. Med. 26:219-23
KNOX, E. G, ARMSTRONG, E. H. and LANCASHIRE, R.(1984) The quality of notification of congenital malfor-mations’, J. Epidemiol. Community Health 38: 296-305
LANDY, M. (1986) 'Cleaning up Superfund’, The PublicInterest 85:58-71
LANGBEIN, L. I. and LICHTMAN, A. J. (1978) Ecologicalinference (Sage, London)
LAWRENCE, K. M., CARTER, C. O. and DAVID, P. A.(1967) 'Major central nervous system malformations inSouth Wales, Parts I and II’, Br. J. Prev. Soc. Med. 22: 146-60 and 212-22
LECK I. M. (1974) ‘Epidemiology of neural tube malforma-tions’, Br. Med. Bull. 30: 158-63
LOVETT, A. A., BENTHAM, C. G. and FLOWERDEW, R.(1986) 'Analysing geographic variations in mortalityusing Poisson regression: the example of ischaemic heartdisease in England and Wales 1969-1973’, Soc. Sci. Med.23: 935-43
LOWE, C. R., ROBERTS, C. J. and LLOYD, S. (1971)'Malformations of central nervous system and softnessof local water supplies', Br. Med. J. 2: 357-61
MACFARLANE, A (1987) Personal communication, 2March, 1987
MATERNITY ALLIANCE (1982) It all depends where youlive: a survey of antenatal screening for congenital abnor-malities (The Maternity Alliance, London)
MAYER, J. D. (1982) ‘Relationships between two traditionsof medical geography: health systems planning and geo-graphical epidemiology’, Prog. Hum. Geogr. 16: 216-30
McDOWALL, M. (1985) Personal communication, 11 July,1985.
MORTON M. S., ELWOOD, P. C. and ABERNETHY, M.(1976) 'Trace elements in water and congenital malfor-mations of the central nervous system in South Wales’,Br. J. Prev. Soc. Med. 30: 36-9
O‘BRIEN, L. G. (1983) ‘Generalised linear modelling usingthe GLIM system‘, Area 15: 327-35
OPCS (1983) Congenital malformation statistics: notificatons(Office of Population censuses and Surveys, London)
OPCS (1984) Congenital malformations, 1983, MonitorSeries MB3, 84/2 (Office of Population Censuses andSurveys, London)
OPCS (1985a) Congenital malformations, 1984, MonitorSeries MB3, 85/2 (Office of Population Censuses andSurveys, London)
OPCS (1985b) Abortion statistics, Monitor Series AB,11, (Office of Population Censuses and Surveys,London)
OPCS (1985) Infant and perinatal mortality, 1983, MonitorSeries DH3, 85/3 (Office of Population Censuses andSurveys, London)
OPCS (1986a) Congenital malformations, 1985, MonitorSeries MB3, 86/2 (Office of Population Censuses andSurveys, London)
OPCS (1986b) Abortion statistics, Monitor Series AB, 12,(Office of Population Censuses and Surveys, London)
PEACH, C. (1982) The growth and distribution of the blackpopulation in Britain 1945-1980’, in COLEMAN, D.(ed.) The demography of immigrant) and minority groupsin the United Kingdom (Academic Press, London)pp. 23-42
RHIND, D. W. (ed.) (1983) A census user's handbook(Methuen, London)
ROGERS, S. C. and MORRIS, M. (1971) 'Infant mortalityfrom spina bifida, congenital hydrocephalus, monstro-sity and congenital diseases of the cardiovascular systemin England and Wales’, Ann. Hum. Genet. 34: 295-305
ROGERS, S. C. and WEATHERALL, J. A. C (1976) ‘Anen-cephalus, spina bifida and congenital hydrocephalus:England and Wales 1964-1972’, OPCS Studies in Medicaland Population Subjects, No.32
SPENCER, K. and CARPENTER, P. (1985) ‘Letter to theEditor’, BY. Med. J. 290: 711-12
ST LEGER, A. S., ELWOOD, P. C. and MORTON, M. S.(1980) 'Neural tube malformations and trace elements inwater’, J. Epidem. Community Health 34: 186-7
STANDING, S. J., BRINDLE, M. J., MACDONALD, A. P.and LACEY, R. W. (1981) ‘Maternal alpha-fetoproteintesting two years‘ experience in a low risk district’, Br.Med. J. 283: 705-7
STARK, G. D. (1977) Spina bifida: problems and management(Basil Blackwell, Oxford)
STONE, D. H. and HAMILTON, F. M. W. (1987) ‘Uses andlimitations of registers of congenital malformations: acase study’, Public Health 101: 191-7
WALD, N. J. and CUCKLE, H. S. (1984) ‘Open neural-tube defects’, in WALD, N. J. (ed.) Antenatal andneonatal screening (Oxford University Press, Oxford)pp. 25-73
WALLING, D. E. and WEBB, B. W. (1981) Water quality’,in LEWIN, J. (ed.) British rivers (Allen and Unwin,London) pp. 126-72
WHITE, R. R (1972) ‘Probability maps of leukaemia mor-talities in England and Wales’, in McGLASHAN, N. D.(cd.) Medical geography: techniques and field studies(Methuen, London) pp. 173-86