Embed Size (px)
Citation preview

The Geography of Opportunity in Austin:The Geography of Opportunity in Austin:Mapping Opportunity to Support a Vibrant RegionMapping Opportunity to Support a Vibrant Region
March 21st 2007March 21st 2007
john a. powelljohn a. powellWilliams Chair in Civil Rights & Civil Liberties, Moritz College of LawWilliams Chair in Civil Rights & Civil Liberties, Moritz College of Law
Executive Director, Kirwan Institute for the Study of Race and EthnicityExecutive Director, Kirwan Institute for the Study of Race and EthnicityThe Ohio State UniversityThe Ohio State University
http://www.kirwaninstitute.org/http://www.kirwaninstitute.org/

2
Today’s PresentationToday’s Presentation
► What is the Community of Opportunity What is the Community of Opportunity approach to community development? approach to community development?
► What is opportunity mapping?What is opportunity mapping? How has opportunity mapping been used How has opportunity mapping been used
before? before?
► The geography of opportunity in AustinThe geography of opportunity in Austin► How can we use this information?How can we use this information?

3
►What is the What is the “Community “Community of of Opportunity” Opportunity” Model? Model?

4
Place and Life OutcomesPlace and Life Outcomes
► Where you live is more important than Where you live is more important than what you live in…what you live in… Housing -- in particular its location -- is the primary Housing -- in particular its location -- is the primary
mechanism for accessing opportunity in our societymechanism for accessing opportunity in our society
HousingHousing location location determines the quality of schools determines the quality of schools children attend, the quality of public services they children attend, the quality of public services they receive, access to employment and transportation, receive, access to employment and transportation, exposure to health risks, access to health care, etc.exposure to health risks, access to health care, etc.
For those living in high poverty neighborhoods, For those living in high poverty neighborhoods, these factors can significantly inhibit life outcomesthese factors can significantly inhibit life outcomes

5
Housing is Housing is CriticalCritical in Determining Access to Opportunity in Determining Access to Opportunity
Housing
Childcare Employment
Education
Health
Transportation
Effective Participation
Housing and OpportunityHousing and Opportunity

6
Communities of Opportunity Communities of Opportunity
►The “Communities of Opportunity” The “Communities of Opportunity” framework is a model of fair housing and framework is a model of fair housing and community developmentcommunity development
►The model is based on the premises that The model is based on the premises that Everyone should have fair access to the Everyone should have fair access to the
critical opportunity structures needed to critical opportunity structures needed to succeed in lifesucceed in life
Affirmatively connecting people to opportunity Affirmatively connecting people to opportunity creates positive, transformative change in creates positive, transformative change in communitiescommunities

7
Communities of OpportunityCommunities of Opportunity
►The “Communities of Opportunity” The “Communities of Opportunity” model advocates for a fair investment model advocates for a fair investment in all of a region’s people and in all of a region’s people and neighborhoods -- to improve the life neighborhoods -- to improve the life outcomes of all citizens, and to outcomes of all citizens, and to improve the health of the entire regionimprove the health of the entire region A focus on people, investing in our A focus on people, investing in our
residents (and their communities) to residents (and their communities) to produce transformative changeproduce transformative change

8
The Web of OpportunityThe Web of Opportunity
► Opportunities in our society are Opportunities in our society are geographically distributed (and often geographically distributed (and often clustered) throughout metropolitan areasclustered) throughout metropolitan areas This creates “winner” and “loser” communities or This creates “winner” and “loser” communities or
“high” and “low” opportunity communities“high” and “low” opportunity communities
► Your location within this “web of Your location within this “web of opportunity” plays a decisive role in your life opportunity” plays a decisive role in your life potential and outcomespotential and outcomes Individual characteristics still matter…Individual characteristics still matter… ……but so does access to opportunity, such as but so does access to opportunity, such as
good schools, health care, child care, and job good schools, health care, child care, and job networks networks

9
Neighborhood Neighborhood SegregationSegregation
School SegregationSchool Segregation
Racial stigma, other Racial stigma, other psychological impactspsychological impacts
Job segregationJob segregation
Impacts on community Impacts on community power and individual power and individual
assetsassets
Impacts on Educational Impacts on Educational AchievementAchievement
The Cumulative Impacts of Racial The Cumulative Impacts of Racial and and
Opportunity SegregationOpportunity Segregation
Exposure to crime; arrestExposure to crime; arrest
Transportation limitations Transportation limitations and other inequitable public and other inequitable public servicesservices
Adapted from figure by Barbara Reskin at: http://faculty.washington.edu/reskin/
Segregation impacts a number of life-opportunitiesSegregation impacts a number of life-opportunities
Impacts on HealthImpacts on Health

10
Economic ConditionsEconomic ConditionsHigh Opportunity
Low Opportunity

11
Low Opportunity
High Opportunity
School Conditions School Conditions

12
►What is What is Opportunity Opportunity Mapping?Mapping?
►How has it How has it been used been used before? before?

13
The Geography of The Geography of OpportunityOpportunity
► The Communities of Opportunity framework is The Communities of Opportunity framework is inherently spatial inherently spatial Inequality has a geographic footprintInequality has a geographic footprint Maps can visually track the history and presence of Maps can visually track the history and presence of
discriminatory and exclusionary policiesdiscriminatory and exclusionary policies This “opportunity mapping” has been completed for many This “opportunity mapping” has been completed for many
metropolitan areas in the U.S. and is used by advocates to metropolitan areas in the U.S. and is used by advocates to further fair housing and community development goalsfurther fair housing and community development goals
► The Communities of Opportunity model uses state-The Communities of Opportunity model uses state-of-the-art geographic information systems (GIS) and of-the-art geographic information systems (GIS) and extensive data sets to analyze the distribution of extensive data sets to analyze the distribution of opportunity in our metropolitan areasopportunity in our metropolitan areas

14
Opportunity MappingOpportunity Mapping
►Opportunity mapping is a research tool Opportunity mapping is a research tool used to understand the dynamics of used to understand the dynamics of “opportunity” within metropolitan areas“opportunity” within metropolitan areas
►The purpose of opportunity mapping is The purpose of opportunity mapping is to illustrate where opportunity rich to illustrate where opportunity rich communities exist (and assess who has communities exist (and assess who has access to these communities) access to these communities) Also, to understand what needs to be Also, to understand what needs to be
remedied in opportunity poor communities remedied in opportunity poor communities

15
General MethodologyGeneral Methodology
► Opportunity mapping methodologyOpportunity mapping methodology Requires a comprehensive assessment of local Requires a comprehensive assessment of local
indicators related to opportunityindicators related to opportunity► Economic conditions, education, neighborhood health etc.Economic conditions, education, neighborhood health etc.
Would be extremely difficult without Geographic Would be extremely difficult without Geographic Information Systems technologyInformation Systems technology
Analyzing multiple opportunity indicators to create Analyzing multiple opportunity indicators to create a comprehensive opportunity indexa comprehensive opportunity index
► Break Census Tracts into quintiles (based on opportunity Break Census Tracts into quintiles (based on opportunity index score) to distinguish between various opportunity index score) to distinguish between various opportunity categories (very low, low, moderate, high, very high)categories (very low, low, moderate, high, very high)

16
Similar Models Used Similar Models Used ElsewhereElsewhere
► The concept of using neighborhood based data to The concept of using neighborhood based data to assess neighborhood opportunities and challenges is assess neighborhood opportunities and challenges is not unprecedented and is used in various sectors not unprecedented and is used in various sectors (examples)(examples) Business: Site selection analysis by firms such as ClaritasBusiness: Site selection analysis by firms such as Claritas Community Development: Criteria used to identify areas for Community Development: Criteria used to identify areas for
targeted investment or areas targeted for specific community targeted investment or areas targeted for specific community development initiativesdevelopment initiatives
Housing: Models that try to connect affordable housing to areas Housing: Models that try to connect affordable housing to areas of job growth “work force housing initiatives”of job growth “work force housing initiatives”
► The use of neighborhood based indicators for The use of neighborhood based indicators for measuring sustainability is well established in the measuring sustainability is well established in the Austin regionAustin region Opportunity mapping adds an additional analytical lens to this Opportunity mapping adds an additional analytical lens to this
significant body of existing work in the regionsignificant body of existing work in the region

17
What has opportunity mapping What has opportunity mapping been used for in other regions?been used for in other regions?
►The Kirwan Institute has conducted The Kirwan Institute has conducted opportunity mapping in approximately opportunity mapping in approximately a dozen metropolitan regions, some a dozen metropolitan regions, some prominent examples of this work prominent examples of this work informing action can be found in three informing action can be found in three regionsregions ChicagoChicago BaltimoreBaltimore ClevelandCleveland

18
ChicagoChicago► Chicago:Chicago: The Kirwan Institute worked with the The Kirwan Institute worked with the
Leadership Council for Metropolitan Open Leadership Council for Metropolitan Open Communities and the Institute of Race and Poverty to Communities and the Institute of Race and Poverty to conduct an opportunity mapping analysis in the conduct an opportunity mapping analysis in the Chicago region Chicago region
► The opportunity maps produced as part of the Chicago The opportunity maps produced as part of the Chicago research were utilized by the Leadership Council for research were utilized by the Leadership Council for advising inner-city voucher holders looking to relocate advising inner-city voucher holders looking to relocate to higher opportunity neighborhoods in Chicago to higher opportunity neighborhoods in Chicago
► In addition, the research was utilized to inform In addition, the research was utilized to inform inclusionary housing advocacy in the Chicago region, inclusionary housing advocacy in the Chicago region, focusing on inclusionary zoning advocacy and to focusing on inclusionary zoning advocacy and to assess the impacts of the Low Income Housing Tax assess the impacts of the Low Income Housing Tax Credit program on expanding access to opportunity in Credit program on expanding access to opportunity in the Chicago region the Chicago region

19
Chicago’sChicago’sCommunities of Communities of OpportunityOpportunity
► This example is a 6 This example is a 6 county Communities county Communities of Opportunity map of Opportunity map for the Chicago for the Chicago regionregion Red = Lowest Red = Lowest
OpportunityOpportunity Blue = Highest Blue = Highest
OpportunityOpportunity
Source: Report published by the Leadership Council for Metropolitan Open Communities 2005

20
Baltimore (Litigation)Baltimore (Litigation)
► Baltimore:Baltimore: Opportunity mapping in the Baltimore Opportunity mapping in the Baltimore region was conducted as part of the region was conducted as part of the Thompson v. Thompson v. HUDHUD fair housing litigation fair housing litigation
► Plaintiffs used opportunity mapping to frame their Plaintiffs used opportunity mapping to frame their remedial proposal, in response to a liability ruling remedial proposal, in response to a liability ruling that found the U.S. Department of Housing and that found the U.S. Department of Housing and Urban Development in violation of the Fair Housing Urban Development in violation of the Fair Housing Act Act
► The plaintiffs have proposed establishing 7,000 The plaintiffs have proposed establishing 7,000 affordable housing units in the region’s high- affordable housing units in the region’s high- opportunity communities, available to volunteers opportunity communities, available to volunteers who wish to relocate out of the City of Baltimore’s who wish to relocate out of the City of Baltimore’s public housingpublic housing

21
Proposed remedy Proposed remedy identifies Communities of identifies Communities of
Opportunity Opportunity ► Used 14 indicators of Used 14 indicators of neighborhood opportunity to neighborhood opportunity to designate high and low designate high and low opportunity neighborhoods opportunity neighborhoods in the regionin the region Neighborhood Quality/HealthNeighborhood Quality/Health
► Poverty, Crime, Vacancy, Poverty, Crime, Vacancy, Property Values, Population Property Values, Population TrendsTrends
Economic Opportunity Economic Opportunity ► Proximity to Jobs and Job Proximity to Jobs and Job
Changes, Public TransitChanges, Public Transit Educational OpportunityEducational Opportunity
► School Poverty, School Test School Poverty, School Test Scores, Teacher QualificationsScores, Teacher Qualifications

22
Baltimore (Community Baltimore (Community Organizing)Organizing)
► Baltimore:Baltimore: In response to the proposed remedy, In response to the proposed remedy, an umbrella organization of seven social justice an umbrella organization of seven social justice organizations (known as the Baltimore Regional organizations (known as the Baltimore Regional Housing Campaign) has adopted the opportunity-Housing Campaign) has adopted the opportunity-based approach and is actively working outside of based approach and is actively working outside of the Court’s remedial action to develop affordable the Court’s remedial action to develop affordable housing options in Baltimore’s high-opportunity housing options in Baltimore’s high-opportunity communities, as well as counseling those who communities, as well as counseling those who desire to leave Baltimore’s public housing for new desire to leave Baltimore’s public housing for new opportunitiesopportunities

23
ClevelandCleveland
► Cleveland:Cleveland: Opportunity mapping and GIS analysis Opportunity mapping and GIS analysis were used in the Cleveland region to assess were used in the Cleveland region to assess economic opportunities in the region, in relation to economic opportunities in the region, in relation to Minority Business concentrationsMinority Business concentrations Most MBE's in the region were clustered in neighborhoods Most MBE's in the region were clustered in neighborhoods
with declining economic opportunity, producing potential with declining economic opportunity, producing potential impediments to business networking and access to impediments to business networking and access to marketsmarkets
► Additional opportunity analysis was used to inform Additional opportunity analysis was used to inform regional growth and development policy regional growth and development policy recommendations formulated by the Presidents’ recommendations formulated by the Presidents’ Council of Cleveland, a committee of leading Council of Cleveland, a committee of leading political, civic and business leaders in the African political, civic and business leaders in the African American community American community

24
Cleveland opportunity analysis & raceCleveland opportunity analysis & race

25
►The The geography of geography of opportunity in opportunity in the Austin the Austin region region

26
Background on the Austin Background on the Austin InitiativeInitiative
► The Central Texas Opportunity initiative was initiated by The Central Texas Opportunity initiative was initiated by Community Partnership for the Homeless and involved a Community Partnership for the Homeless and involved a steering committee representing a diverse array of steering committee representing a diverse array of organizations in the Central Texas regionorganizations in the Central Texas region
► The committee included representatives from The committee included representatives from PeopleFund, a regional community development financial PeopleFund, a regional community development financial
institution; Envision Central Texas, a regional planning body; institution; Envision Central Texas, a regional planning body; Capital Metro, the region’s public transit authority; the Indigent Capital Metro, the region’s public transit authority; the Indigent Care Collaborative, a non-profit health organization focused on Care Collaborative, a non-profit health organization focused on public health issues for the poor; Capitol Area Council of public health issues for the poor; Capitol Area Council of Governments; United Way Capital Area; Habitat for Humanity; and Governments; United Way Capital Area; Habitat for Humanity; and several professors from the University of Texas’ Community & several professors from the University of Texas’ Community & Regional Planning and Public Health Departments Regional Planning and Public Health Departments
► The broader goal of the opportunity mapping initiative is to The broader goal of the opportunity mapping initiative is to provide a data resource for policy makers, community provide a data resource for policy makers, community development practitioners, social service providers, and the development practitioners, social service providers, and the public to support actions to remedy socioeconomic inequity public to support actions to remedy socioeconomic inequity issues highlighted by the map, such as providing access to issues highlighted by the map, such as providing access to health care or addressing affordable housinghealth care or addressing affordable housing

27
Selecting Indicators of Selecting Indicators of OpportunityOpportunity
► The committee worked collaboratively with the The committee worked collaboratively with the Kirwan Institute to identify indicators of Kirwan Institute to identify indicators of opportunity in the region opportunity in the region
► The selection of indicators was based on input The selection of indicators was based on input regarding issues or concerns in the region, as regarding issues or concerns in the region, as well as research literature validating the well as research literature validating the connection between indicators and opportunityconnection between indicators and opportunity Twenty-two indicator areas were selected for the Twenty-two indicator areas were selected for the
analysis, covering education, economic conditions, analysis, covering education, economic conditions, mobility and transportation, public health and the mobility and transportation, public health and the environment, and neighborhood quality environment, and neighborhood quality

28
Indicators of Opportunity: Indicators of Opportunity: AustinAustin
EDUCATION ECONOMIC MOBILITY & TRANSPORTATION
HEALTH & ENVIRONMENT
NEIGHBORHOOD QUALITY
School Poverty
Teacher Experience
Student/ Teacher Ratio
Math & Reading Scores
Student Retention
Unemployment
Dependence on Public Assistance
Proximity to Employment
Ratio of jobs to residents
Job growth trends
Commute Time
Access to public transit stops
Frequency of public transit service
Proximity to toxic waste
Access to parks and open space
Proximity to health care facilities and
physicians
Access to grocery stores
Insurance access
Neighborhood poverty rates
Housing vacancy rates
Crime rates
Home ownership
Median income
Home values
Figure 1: Opportunity indicators used in the Austin analysis

29
General ResultsGeneral Results
► The Comprehensive Opportunity Map (which The Comprehensive Opportunity Map (which represents all opportunity indicators)represents all opportunity indicators) As seen in As seen in the following mapsthe following maps, higher , higher
opportunity areas in the region are primarily opportunity areas in the region are primarily concentrated west of I-35, with the highest concentrated west of I-35, with the highest opportunity communities found directly west of I-opportunity communities found directly west of I-35 in the Travis County area35 in the Travis County area
The lowest opportunity areas are primarily The lowest opportunity areas are primarily concentrated in southeastern Travis County and in concentrated in southeastern Travis County and in the region’s eastern counties (Caldwell and the region’s eastern counties (Caldwell and Bastrop)Bastrop)
The largest concentration of high-opportunity The largest concentration of high-opportunity communities are found in the portions of the City communities are found in the portions of the City of Austin west of I-35 and most of the suburban of Austin west of I-35 and most of the suburban communities adjacent to Austin west of I-35 communities adjacent to Austin west of I-35

30
How is Opportunity Distributed in a Hot
Market City?
(Austin, TX)
Opportunity in the Austin region is more
centralized (not a hollow region like Cleveland or
Baltimore). Although, opportunity is more centralized it is still
spatially segregated.

31
An in-depth view of the distribution
of high and low opportunity areas in and around the
City of Austin

32
Other Opportunity Maps: Other Opportunity Maps: EducationEducation
►The east-west divide along I-35 is The east-west divide along I-35 is evident in educational conditions in the evident in educational conditions in the region, with all high-opportunity areas region, with all high-opportunity areas found west of I-35found west of I-35
►Areas of low educational opportunity Areas of low educational opportunity are concentrated east of I-35, but are concentrated east of I-35, but centered around Travis Countycentered around Travis County
►Most areas in Caldwell and Bastrop Most areas in Caldwell and Bastrop Counties scored as “moderate” areas of Counties scored as “moderate” areas of educational opportunity educational opportunity

33
Education Opportunity Map
(based on educational
indicators for elementary schools)

34
Other Opportunity Maps: Other Opportunity Maps: Housing and Neighborhood Housing and Neighborhood
QualityQuality The distribution of high and low opportunity The distribution of high and low opportunity
census tracts based on the housing and census tracts based on the housing and neighborhood quality analysis is seen in the neighborhood quality analysis is seen in the following mapfollowing map The highest opportunity areas in the The highest opportunity areas in the
neighborhood analysis are located west of I-35, neighborhood analysis are located west of I-35, spreading from Hays to Williamson County spreading from Hays to Williamson County
Most of the high-opportunity tracts in Travis Most of the high-opportunity tracts in Travis County are west of Route 183 County are west of Route 183
The lowest opportunity tracts in this analysis are The lowest opportunity tracts in this analysis are located in the center of Travis County, directly located in the center of Travis County, directly east of I-35 east of I-35

35
Neighborhood Conditions “Quality”
Opportunity Map
(based on neighborhood quality indicators for census
tracts)

36
Other Opportunity MapsOther Opportunity Maps
► Economic OpportunityEconomic Opportunity Economic opportunities in the region are generally Economic opportunities in the region are generally
centralized, but are more concentrated to the west of I-35 centralized, but are more concentrated to the west of I-35 ► Opportunity related to Transportation MobilityOpportunity related to Transportation Mobility
Mobility-related opportunity in the region is highly Mobility-related opportunity in the region is highly concentrated, reflecting the centralized nature of the concentrated, reflecting the centralized nature of the public transportation system and lower commute times for public transportation system and lower commute times for urban workers (also related to the general concentration of urban workers (also related to the general concentration of jobs near the City of Austin) jobs near the City of Austin)
► Public Health and Environmental QualityPublic Health and Environmental Quality The highest performing areas in the region are The highest performing areas in the region are
concentrated west of I-35, including parts of western Travis concentrated west of I-35, including parts of western Travis County and portions of Williamson County County and portions of Williamson County

37
38
Public Health and Environmental
Quality
Opportunity Map
(based on indicators of public health and
environmental quality)

39
►How can we How can we use this use this analysis and analysis and information? information?

40
Using this Information to Using this Information to Produce Action (Some Produce Action (Some
Examples)Examples)►Assess and work to remedy racial, Assess and work to remedy racial,
ethnic, economic segregation from ethnic, economic segregation from opportunity in the regionopportunity in the region
►Look at affordable housing and access Look at affordable housing and access to high opportunity areasto high opportunity areas
►Exploring linkages with the Exploring linkages with the opportunity mapping data (e.g. public opportunity mapping data (e.g. public transit and health care facilities)transit and health care facilities)

41
Opportunity SegregationOpportunity Segregation
► Just like a weak market city, hot Just like a weak market city, hot markets can result in segregation from markets can result in segregation from communities of opportunity for communities of opportunity for marginalized groupsmarginalized groups In weak market regions (Detroit) people are In weak market regions (Detroit) people are
disconnected from high opportunity disconnected from high opportunity neighborhoods in the suburbsneighborhoods in the suburbs
In hot market regions (Austin) people may In hot market regions (Austin) people may be disconnected from high opportunity be disconnected from high opportunity neighborhoods in the city neighborhoods in the city

42
Opportunity Segregation in Opportunity Segregation in AustinAustin
► Latino and African American populations are Latino and African American populations are concentrated in the region’s low and moderate concentrated in the region’s low and moderate opportunity communitiesopportunity communities While 39% of Whites in the region are in very low- or low-While 39% of Whites in the region are in very low- or low-
opportunity census tracts, 60% of Latinos and African Americans opportunity census tracts, 60% of Latinos and African Americans are concentrated in these tracts are concentrated in these tracts
Linguistically isolated populations are also more likely to be Linguistically isolated populations are also more likely to be concentrated in low-opportunity areas, with 56% of all concentrated in low-opportunity areas, with 56% of all linguistically isolated people located in very low or low linguistically isolated people located in very low or low opportunity census tractsopportunity census tracts
Latino and African American children are much more likely to be Latino and African American children are much more likely to be located in the region’s low opportunity areas, with 2 out of 3 located in the region’s low opportunity areas, with 2 out of 3 African American and Latino children found in these communitiesAfrican American and Latino children found in these communities
For children in poverty, this isolation from opportunity is more For children in poverty, this isolation from opportunity is more pronounced, with 69% of children in poverty in the region found pronounced, with 69% of children in poverty in the region found in the region’s low-opportunity census tracts in the region’s low-opportunity census tracts

43
Segregation from Segregation from OpportunityOpportunity
Opportunity Level Total Population Total White Total Non-White Hispanic/Latino African American Liguistic Isolation
Low or Very Low 43.5% 39.4% 55.4% 59.9% 59.8% 56.4%Moderate 21.9% 22.1% 21.0% 20.4% 22.2% 19.9%High or Very High 34.5% 38.5% 23.6% 19.7% 17.9% 23.7%
Opportunity Level Total Children Non-White Children Hispanic Children Afr. Amer Children Children in Poverty Seniors (Over 65)
Low or Very Low 47.1% 58.8% 62.6% 62.1% 68.6% 45.7%Moderate 24.2% 22.1% 21.1% 23.6% 17.2% 21.1%High or Very High 28.7% 19.1% 16.3% 14.3% 14.3% 33.2%
Table 1: General Population Figures for Opportunity Areas from the 2000 Census

44
Linguistically Isolated People and the Comprehensive Opportunity Map for
the Austin Region

45
Children of Color and Educational OpportunityChildren of Color and Educational Opportunity

46
Remedying Opportunity Remedying Opportunity SegregationSegregation
►To remedy such “opportunity To remedy such “opportunity segregation,” the Communities of segregation,” the Communities of Opportunity approach emphasizes Opportunity approach emphasizes investment in investment in
►PeoplePeople►PlacesPlaces►LinkagesLinkages
47
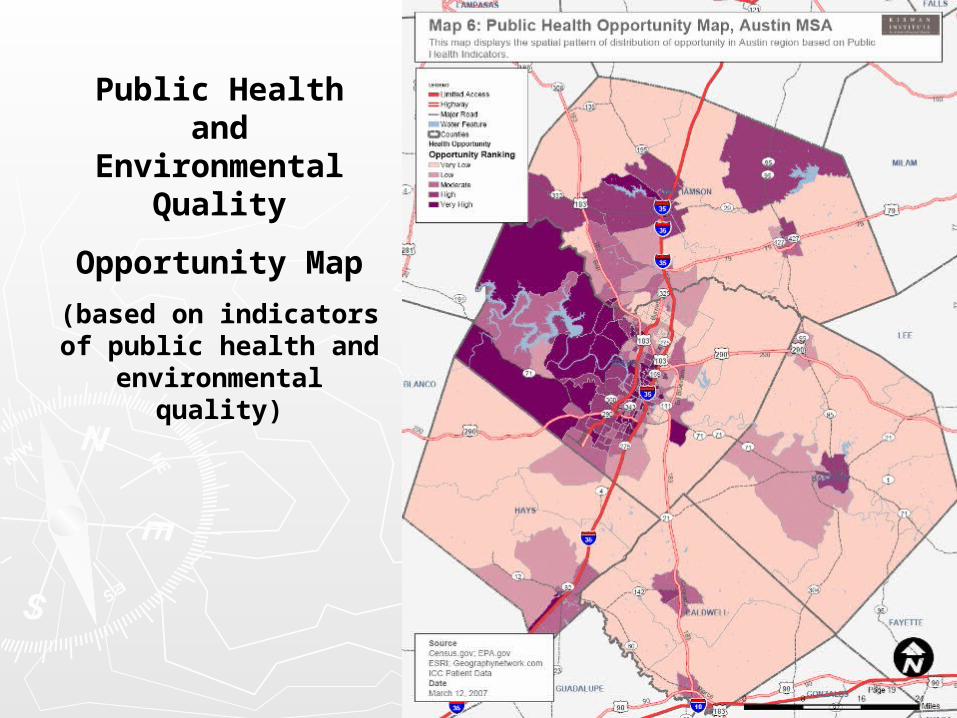
ExamplesExamples► PeoplePeople
Subsidies for affordable housing in high-opportunity neighborhoods Subsidies for affordable housing in high-opportunity neighborhoods with good schoolswith good schools
► Although inclusionary zoning is not permitted in Texas, other inclusionary Although inclusionary zoning is not permitted in Texas, other inclusionary models could be explored (e.g. developer incentives for production of models could be explored (e.g. developer incentives for production of affordable units)affordable units)
Promoting school mobilityPromoting school mobility Wealth building programs for residents in low opportunity areasWealth building programs for residents in low opportunity areas
► PlacesPlaces Regional housing and neighborhood development plansRegional housing and neighborhood development plans Opportunity-based Zoning Opportunity-based Zoning Targeted investment in failing schoolsTargeted investment in failing schools
► Linkages Linkages Improved public transportation to jobs and other critical opportunity Improved public transportation to jobs and other critical opportunity
structuresstructures

48
Inclusion for Marginalized Communities in Hot Inclusion for Marginalized Communities in Hot Market RegionsMarket Regions
► How can marginalized communities benefit How can marginalized communities benefit more from the economic growth and more from the economic growth and investment found in hot market regions? investment found in hot market regions?
► Three strategies:Three strategies: Assure business investments provide benefits to Assure business investments provide benefits to
disadvantaged groups (community benefits disadvantaged groups (community benefits agreements)agreements)
Assess the racial impacts of new developments Assess the racial impacts of new developments (Racial Impact Statements)(Racial Impact Statements)
Assure people are prepared to be included in Assure people are prepared to be included in Austin’s thriving 21Austin’s thriving 21stst century economy (education) century economy (education)
Focus on affordable housing opportunities in Focus on affordable housing opportunities in growing high opportunity areasgrowing high opportunity areas

49
Opportunity and Opportunity and Subsidized Subsidized
HousingHousing► Subsidized housing Subsidized housing
is almost non is almost non existent in high existent in high opportunity areasopportunity areas
► Approximately 1 out Approximately 1 out of 10 subsidized of 10 subsidized housing sites can be housing sites can be found in high found in high opportunity census opportunity census tracts, while 2 out of tracts, while 2 out of 3 sites are 3 sites are concentrated in the concentrated in the region’s low region’s low opportunity areasopportunity areas

50
How can we counter How can we counter this trend?this trend?
► Housing should be a primary policy concern Housing should be a primary policy concern (how do we connect affordable housing to (how do we connect affordable housing to high opportunity areas)high opportunity areas) Work to assure affordable housing is included in Work to assure affordable housing is included in
new investmentsnew investments Assure inclusionary housing requirement as part Assure inclusionary housing requirement as part
of developer incentivesof developer incentives Work to maintain/preserve existing affordable Work to maintain/preserve existing affordable
unitsunits Promote alternative revenue streams for Promote alternative revenue streams for
affordable housing (explore expanding resources affordable housing (explore expanding resources for housing trust fund)for housing trust fund)

51
Using Opportunity Mapping Data to Using Opportunity Mapping Data to Explore LinkagesExplore Linkages
►Example: How is the region’s public Example: How is the region’s public transit infrastructure connected to the transit infrastructure connected to the region’s health care facilities (clinics, region’s health care facilities (clinics, physicians offices, hospitals)physicians offices, hospitals) Public transit lines are well connected to Public transit lines are well connected to
public health resources in the City of public health resources in the City of Austin, but transit access gaps exist with Austin, but transit access gaps exist with regard to health care resources directly to regard to health care resources directly to the west and north of the City of Austin the west and north of the City of Austin

52

53
Thinking OpportunisticallyThinking Opportunistically
► Given this information, what can concerned Given this information, what can concerned stakeholders in the Austin region do to stakeholders in the Austin region do to promote integration with opportunity?promote integration with opportunity? Be prepared to take advantage of the Be prepared to take advantage of the
opportunities and resources for changing the opportunities and resources for changing the regional arrangements which isolate residents regional arrangements which isolate residents from opportunityfrom opportunity
► Educational reforms? Educational reforms? ► Assuring marginalized residents benefit from Assuring marginalized residents benefit from
transportation and public transit investments? transportation and public transit investments? ► Utilizing the regions rapid investment and building Utilizing the regions rapid investment and building
boom to promote inclusion and assuring community boom to promote inclusion and assuring community benefits?benefits?
Prioritize and target specific initiatives as a Prioritize and target specific initiatives as a starting pointstarting point
54
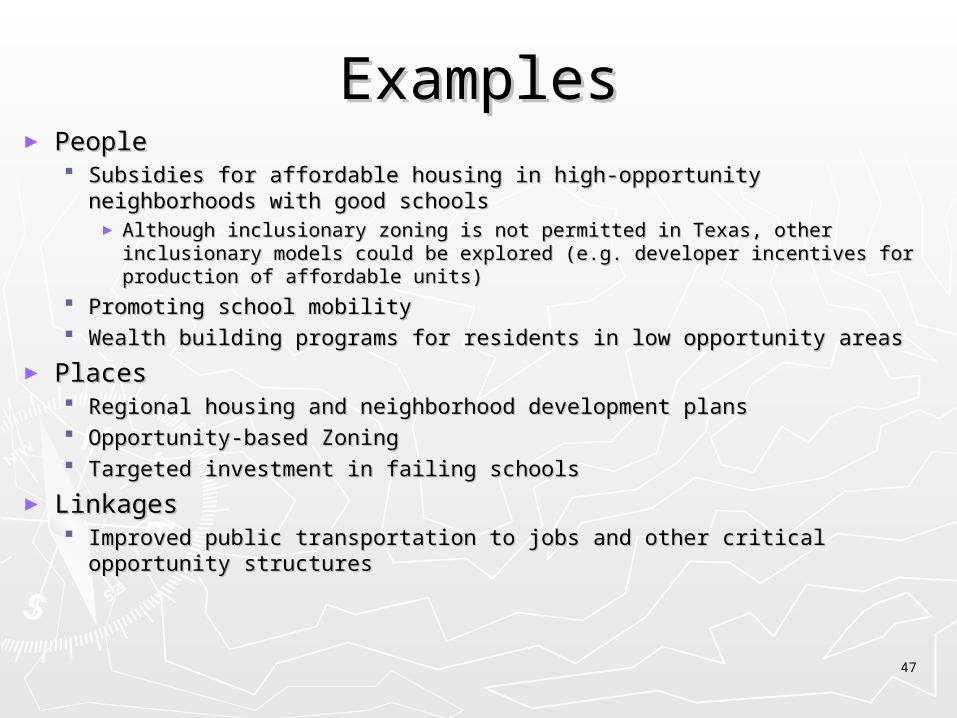
Linked fates…transformative Linked fates…transformative changechange
► Our fates are linked, yet our fates have been socially Our fates are linked, yet our fates have been socially constructed as disconnected constructed as disconnected
► We need socially constructed “bridges” to transform We need socially constructed “bridges” to transform our societyour society Conceive of an individuality as connected to—Conceive of an individuality as connected to—
instead of isolated from—“thy neighbor”instead of isolated from—“thy neighbor” Be advocates for “Communities of Opportunity” as Be advocates for “Communities of Opportunity” as
transformative change transformative change ►Transformative : An intervention that works to Transformative : An intervention that works to
permanently transform structural arrangements permanently transform structural arrangements which produce inequity and disparitywhich produce inequity and disparity

55
Agents of transformative Agents of transformative changechange
► Recognize that advocacy can be Recognize that advocacy can be instrumental to connecting people to critical instrumental to connecting people to critical opportunity structuresopportunity structures Education, Jobs, Child care, Health care, Education, Jobs, Child care, Health care,
TransportationTransportation
► All of these are related and affect each other; All of these are related and affect each other; all show effects of cumulative disparity; all all show effects of cumulative disparity; all are ripe for transformative changeare ripe for transformative change
► Creating the potential for healthier citizens, Creating the potential for healthier citizens, communities and a more vibrant regioncommunities and a more vibrant region

56
Concluding ThoughtsConcluding Thoughts
►We need integration with We need integration with opportunity to have a truly “just” opportunity to have a truly “just” societysociety A society where all people would have access to A society where all people would have access to
the means essential to living a life they have the means essential to living a life they have reason to value reason to value
A society where a geographic identifier would not A society where a geographic identifier would not predict an individual’s life chancespredict an individual’s life chances
Linked fateLinked fate

57
Questions or Comments? Questions or Comments? For More Information Visit Us On-For More Information Visit Us On-
Line:Line:
www.KirwanInstitute.orgwww.KirwanInstitute.org