Embed Size (px)
Citation preview

1
The Geography of European Convertible Bonds: Why Firms Issue Convertibles?
Franck Bancel Usha R. Mittoo Zhou Zhang* ESCP-EAP, France University of Manitoba University of Regina
[email protected] [email protected] [email protected]
Abstract
Why firms issue convertible debt is still one of the unresolved puzzles in finance. While several theories provide different rationales for convertible issuance, empirical evidence is mixed and unclear. Another puzzling feature is that a few countries dominate the global convertible market, suggesting that country-specific factors may play an important role in the use of convertibles. The traditional convertible theories, however, assign little role to country-factors and little prior research has been done to examine their influence on the convertible issuance decision. In this paper, we study the role of country-specific factors in convertible issuance by examining the evolution of European convertible market and the cross-country variation in its development from 1990 to 2007. We find that country-specific factors have a significant impact on the likelihood of convertible issuance, after controlling for firm, industry and market-specific factors. This version: December 12, 2009 Keywords: Convertible debt, European, country factors, legal system, market timing, issue and issuer characteristics JEL Classification: G15, G38, F23 *We are grateful to Anna N. Danielova and Roberto Golinelli for their helpful comments and suggestions that have improved the paper considerably. We also thank conference participants at the 2009 Midwest Finance Association and the 2009 Northern Finance Association annual meetings for their helpful comments. Usha Mittoo acknowledges financial support from the Social Sciences and Humanities Research Council of Canada (SSHRC) and the Bank of Montreal Professorship. Zhou Zhang acknowledges financial support from the CMA faculty fellowship. All correspondence related to this paper should be directed to Zhou Zhang.

2
1. Introduction
Why firms issue convertible debt has both intrigued and puzzled financial researchers.
Several theories have been proposed to explain rationale for convertible (hereafter “CB”)
issuance but the empirical evidence is mixed and unclear. The puzzle deepens when one looks
at the geography of CB issuance. The size and development of the CB market varies widely
across countries and over time with a few countries dominating the market. The U.S. is the
largest player with a steady market share of about 40% of the global market whereas most
other countries have experienced dramatic changes in their market share over time. Japan,
once a dominant player, has experienced a continuous decline in its market share since 1990s
whereas European countries have increased their share from less than 10% in 1990 to about
25% of the global market by the end of 2005.
Why CBs find a more conducive growth environment in some countries but not in
others is puzzling and a largely unexplored issue. The goal of this paper is to provide some
insights into this puzzle by examining the evolution of European CB market and cross-
country differences in its growth. We address the following questions: 1) What factors
spurred the growth of the European CB market and why do growth patterns vary across
countries? 2) What theoretical factors (related to firm, industry and market characteristics)
explain these cross-country differences and do country-specific factors play a significant role
after controlling for the theoretical factors? 3) Has the influence of country-specific factors
diminished over time with the adoption of the Euro and is there a convergence between
countries in the European Monetary Union?
The European CB market provides several attractive features for such analysis. First, it
is a relatively young market that comprised only a small segment of the global market until
1990 but grew dramatically in the mid-1990s comprising about half of the global market in
1998. The growth pattern, however, varies considerably even within the European CB market,

3
with five countries, France, the Netherlands, the U.K., Germany, and Switzerland, comprising
about 83% of the market.
Second, the European countries represent both English and Civil (French, German and
Scandinavian) systems and the convertible features, markets, and regulatory environments
vary widely across European countries. For example, in several Nordic countries, it is not
possible to issue bonds with a maturity date longer than five years and in the UK, a firm
cannot issue more than 5% of the existing equity if the issue is not justified by an acquisition.
Many European firms also issue exchangeable bonds (EBs) where the options are written on
securities of other firms and their issuance varies across countries with many European CBs
are denominated in a currency other than the underlying equity. Lastly, Europe implemented
two structural changes in its financial system in the 1990s that removed a major hurdle to the
creation of a fully integrated Pan-European market: the introduction of euro and the European
Monetary Union (EMU). These developments provide us a unique sample to assess the extent
to which such structural changes can spur the growth of the convertible market by studying
the growth patterns between EMU and non-EMU countries.
We ask questions related to the theoretical models as well as demand- and supply-side
factors that may have contributed to the recent growth of CB markets. Our study complements
and extends the prior research on European CBs by Dutordoir and Van de Gutch (2009,
2005). They find that unlike U.S. issues, most European CBs are debt-like securities and find
evidence of market timing. We ask specifically whether country-specific factors matter after
controlling for the firm, industry, and market effects using a much larger sample and time
period that includes the introduction of euro. We also examine the influence of several
additional variables, such as dividend payout ratio, in the likelihood of CB issuance.
Brockman and Unlu (2009) show that dividend policy can be a substitute for weak creditor
rights. Our preliminary results show that country-specific factors, including legal and national

4
economy factors, have a significant impact on the likelihood of CB issuance relative to
straight debt (non-CB) issuance, after controlling for firm and market-specific factors.
The rest of the paper is organized as follows. Section 2 examines the geography of
European CBs and presents the cross-country differences in the CB issuance overtime and
across countries. Section 3 reviews theories and empirical implications of the factors
impacting the likelihood of CB issuance. Section 4 discusses data, sample, and firm
characteristics differences between CB and non-CB issuers. Section 5 includes the regression
analysis and Section 6 concludes the paper and discusses future work to be done.
2. The geography of European convertible market
This section presents the structure of the European CB bond market and the
comparison with CB markets in other regions using data from the SDC Global New Issues
database.
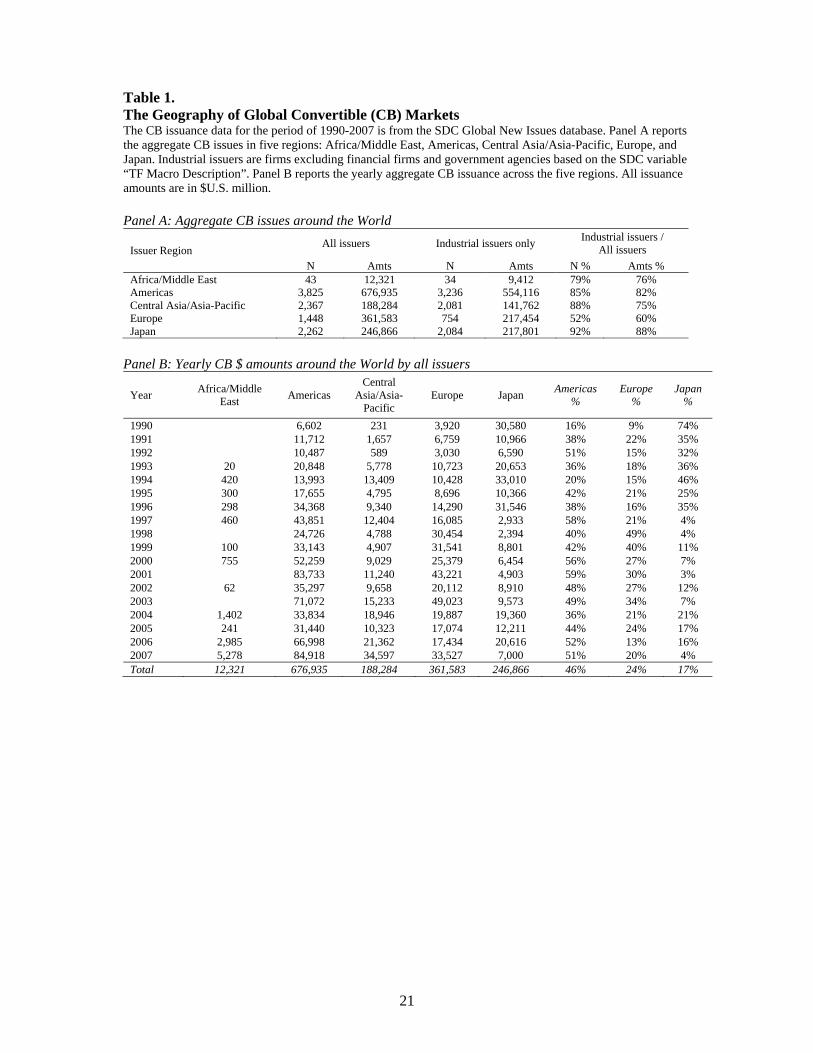
We map out the geography of global CB markets in Table 1. Europe is the second
largest region in the World for CB issues, about half of the size of the Americas. Between
1990 and 2007, European companies issued about U.S. $362 billion of CB debt, representing
24% of the global CB market. In particular, financial firms and government related agencies
have played an active role in European CB market, accounting for about 40% of the total CB
issues compared to only 18% in Americas and 12% in Japan. However, over time the percentage
share of financial institutions has declined whereas that of industrial issuers has increased.
[Insert Table 1 and Figure 1 about here]
The European CB market has grown over time, increasing from annual issuance of $4
billion in 1990 to $34 billion in 2007 but it exhibits strong time-varying pattern relative to the
Americas (Panel B).The European CB issuance surged dramatically in 1998-1999 around the
introduction of euro. In 1998, European firms raised about $30.5 billion through CBs, more
than that in the Americas, accounting for about 50% of the global CB market. Between 1999

5
and 2003, the European firms raised over 30% of the total amount raised in global CB
markets, varying from a high of 40% in 1999 to a low of 27% in 2000 and 2003. Since then,
the average has varied between 13% and 24%. In contrast, the Americas have a very stable
CB market share, with an average 46% of the global CB market share. Japan, on the other
hand, lost its position in global convertible market, with a decline in its market share from
74% in 1990 to only 4% in 2007. Figure 1 show that the U.S. and European CB markets have
strong correlation (about 74%) but the correlation has become stronger since the introduction
of euro in 1999. In untabulated analysis, we also find that since 1999, the market share of the
EMU countries (e.g., France, Germany) increased whereas that of the non-EMU countries
(e.g., Switzerland) declined over time. This evidence indicates that the introduction of euro
helped in making the European CB market from regional market to part of the global market.
In Table 2, we report the CB issuance patterns across sixteen Western European
countries that account for 86% of total European CB issuances: Austria, Belgium, Denmark,
Finland, France, Germany, Greece, Ireland, Italy, Netherlands, Norway, Portugal, Spain,
Sweden, Switzerland and United Kingdom. The size of CB markets varies across these
countries and a few countries dominate the market. French firms are the largest issuers of
convertible bonds ($87 billion), followed by the Netherlands ($64 billion), the U.K. ($42
billion), Germany ($38 billion), Switzerland ($26 billion) and Italy ($20 billion).
[Insert Tables 2 and 3 about here]
One of the unique features of the European CB market is the popularity of
exchangeable CB debt (account for 26% of the total amount of CB issues), which differs from
standard CB bonds with an embedded option to exchange the bond for the stock of a company
other than the issuer. This popularity is largely driven by the European model of corporate
governance that is characterized by the presence of many cross shareholdings. These cross
shareholdings are owned by large shareholders (firms, families, banks, states) and have been
6
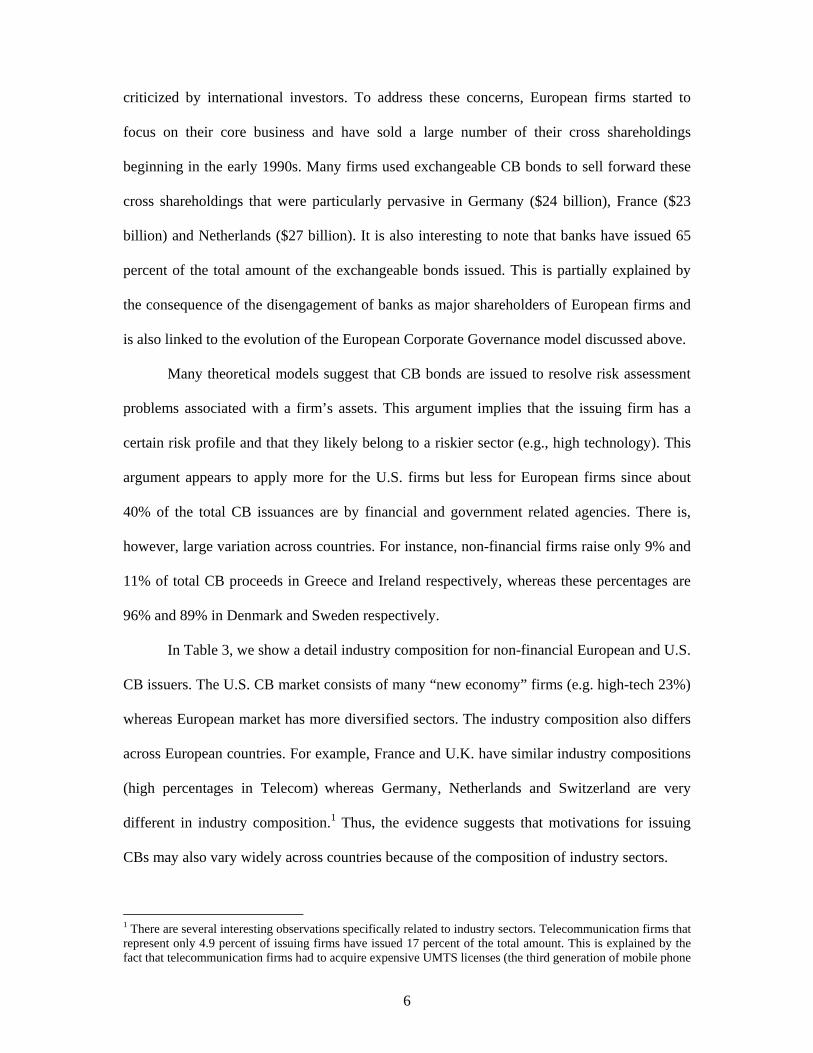
criticized by international investors. To address these concerns, European firms started to
focus on their core business and have sold a large number of their cross shareholdings
beginning in the early 1990s. Many firms used exchangeable CB bonds to sell forward these
cross shareholdings that were particularly pervasive in Germany ($24 billion), France ($23
billion) and Netherlands ($27 billion). It is also interesting to note that banks have issued 65
percent of the total amount of the exchangeable bonds issued. This is partially explained by
the consequence of the disengagement of banks as major shareholders of European firms and
is also linked to the evolution of the European Corporate Governance model discussed above.
Many theoretical models suggest that CB bonds are issued to resolve risk assessment
problems associated with a firm’s assets. This argument implies that the issuing firm has a
certain risk profile and that they likely belong to a riskier sector (e.g., high technology). This
argument appears to apply more for the U.S. firms but less for European firms since about
40% of the total CB issuances are by financial and government related agencies. There is,
however, large variation across countries. For instance, non-financial firms raise only 9% and
11% of total CB proceeds in Greece and Ireland respectively, whereas these percentages are
96% and 89% in Denmark and Sweden respectively.
In Table 3, we show a detail industry composition for non-financial European and U.S.
CB issuers. The U.S. CB market consists of many “new economy” firms (e.g. high-tech 23%)
whereas European market has more diversified sectors. The industry composition also differs
across European countries. For example, France and U.K. have similar industry compositions
(high percentages in Telecom) whereas Germany, Netherlands and Switzerland are very
different in industry composition.1 Thus, the evidence suggests that motivations for issuing
CBs may also vary widely across countries because of the composition of industry sectors.
1 There are several interesting observations specifically related to industry sectors. Telecommunication firms that represent only 4.9 percent of issuing firms have issued 17 percent of the total amount. This is explained by the fact that telecommunication firms had to acquire expensive UMTS licenses (the third generation of mobile phone

7
[Insert Table 4 about here]
In Table 4, we link the information of issuer’s country with the marketplace where the
CBs go. In Panel A, we find strong evidence that European issuers largely rely on the public
CB markets whereas the U.S. issuers mostly use the private placement market. The
percentage of the total amount raised in public CB market is 88% in Europe, more than twice
that in the U.S. (34%). Further, Panel B shows that a vast majority of the European CBs
(83%) are issued in the Eurobond market whereas most U.S. CBs are issued in the domestic
market. The difference in the geography of marketplace indicates that one plausible reason for
the higher volatility in the number of European CBs relative to the U.S. CB issuances over
time could be that the European CB issuances are determined by both global and regional
(country-specific) demand and supply factors whereas the U.S. is driven by mainly the
domestic demand and supply factors.
Finally, most European convertibles (78 percent) give the issuer the capacity to call
the convertible before its maturity date (Table 5). In recent years, the putable CBs that allow
the bondholder to sell the bonds to the issuer at pre-specified prices on pre-specified dates are
gaining popularity comprising about 10 percent of European convertibles. The putable CBs
are considered the most successful financial innovation in the U.S. CB market in the last ten
years. In the 2000s, more money was raised by issuing putable CBs ($122 billion) compared
to ordinary CBs ($109 billion) from 2000 to 2003 (Chemmanur and Simonyan, 2005). The
European countries have also followed the U.S. trend indicating the influence of global CB
market factors on European CB design.
[Insert Table 5 about here]
The differences across European countries raise questions to whether these differences
are related to firm characteristics (size, risk, shareholding, etc.), to institutional or legal
license) at the end of the 90s. In the context of the internet bubble and internet and telecommunication crises, these telecom firms have solved part of their financing problem by issuing convertible bonds.

8
constraints, specific market conditions or other factors (national cultures, etc.). At a minimum,
the European CB market cannot be compared to the U.S. market in the sense that is not a
unified single market. Each European country has its own regulator and many local legal
constraints limit equity or debt issuance in many circumstances which likely to impact the
firms decision to issue CB bonds. For example, in France, the rule of “10 among the 20” (the
issuing stock price was at least equal to an average of 10 stock prices chosen among the last
20 days of trading) has limited the capacity of the French firms to issue equity when the
market volatility was very high (which was the case in years 2001, 2002 and 2003). This
means that the relative development of a national CB market will depend on the local legal
constraints as well as regional and global factors. We need to untangle these different effects
to better understand the development of convertible market and why European firms issue
CBs.
3. Factors affecting the likelihood of convertible issuance
In this section, we review the literature on the rationale for CB issuance and discuss
the firm, market and country-specific factors that could affect the likelihood of CB issuance.
3.1. Firm-specific factors: agency costs and asymmetric information framework
In most theoretical models, CBs are modeled as a substitute for debt or equity in an
agency theory or asymmetric information framework.
Green (1984) argues that CBs provide the bondholders with an option to convert their
bonds to the underlying stock, and consequently, reduce their concern about ex-post risk-
shifting. Mayers (1998) uses Jensen’s (1986) framework in which managers have incentives
to make inefficient investment in the presence of free cash flow (overinvestment problem). He
argues that CB bonds resolve the sequential-financing problem by controlling the
overinvestment problem and economizing the issuing costs by avoiding multiple issues of

9
debt and/or equity. The call option is valuable in Mayers’ model for providing flexibility in
financing future investments when funds are needed.
The asymmetric information based models argue that CBs resolve the uncertainty
about the risk of the firm’s current or future assets (e.g., Brennan and Kraus (1987), Brennan
and Schwartz (1988)). Constantinides and Grundy (1989) and Stein (1992) develop models
based on Myers and Majluf’s (1984) asymmetric information framework in which managers
have superior information than investors. Stein (1992) argues that firms prefer to avoid
issuing equity when they privately know that their stock is undervalued, but also want to
minimize the distress costs that come with debt issuance. CB debt resolves this financing
problem through “backdoor equity” that has lower distress costs than debt financing but has
smaller undervaluation compared to equity financing. The call feature is critical in Stein’s
model to force investors to exercise their conversion option early.
The U.S. evidence is generally consistent with both Mayers and Stein’s models.
Several studies show that high growth firms issue CBs for financing future growth
opportunities whereas firms with financing difficulties use convertibles as back-door equity.
Lewis (1999) finds about half of the U.S. CB sample consists of equity-like CBs (with higher
than 50% conversion probability) that are used as delayed equity financing whereas the other
half consists of debt-like CBs issued as sweetened debt. By contrast, Dutordoir and Van de
Gucht (2009) examine a sample of 179 European CB debt issues from 1994 to 2004 and find
that only four issues are equity-like based on 50% conversion probability. They also find that
unlike U.S. issuers, European CB issuers tend to be large companies with small debt and
equity-related financing costs and conclude that European CBs are used primarily as
sweetened debt, not as delayed equity.
3.2. Market-specific factors: Market timing theory

10
The market timing theory argues that managers use their superior information to select
the timing of security issuance opportunistically to take advantage of temporarily favorable
market conditions and to capture attractive security prices. Several U.S. studies show that
U.S. firms tend to cluster their seasoned equity offerings during periods when economy wide
equity-related adverse selection are low (e.g., Bayless and Chaplinsky (1996) and Korajczyk
and Levy (2003)). Graham and Harvey (2001) also report that U.S. CFOs try to time the
market for equity and debt issuance.
Since CBs are hybrid securities, market conditions and interest rate levels are also
likely to influence managers’ issuance decision. Bancel and Mittoo (2004) report that the
majority of European CFOs agree that a combination of low interest rate and high stock
market volatility environment is an important factor in their decision to issue CBs. Dutordoir,
and Van de Gucht (2007) also find that the stockholder’s reactions to CB announcements are
systematically less negative during hot CB markets (e.g., periods with a high CB issuance
volume).
3.3 Country-Specific factors: Legal and institutional environment
A growing body of research suggests that the country’s legal and institutional
environment, such as financial system, accounting laws and standards, and tax systems, have
a significant influence on the type of securities that firms issue. La Porta et al., (LLSV, 1997,
1998) show that strong minority shareholder protection is associated with more developed
equity markets whereas strong creditor protection is related to more developed debt markets.
Demirguc-Kunt and Maksimovic (1999) argue that developed stock markets provide better
opportunities for diversification and motivate firms to switch from long-term debt to equity
financing.
As hybrids of equity and bond contracts, CB decisions should also be influenced by
the international differences in the legal and institutional environment because their design

11
can be adjust to be more debt-like or equity-like. Korkeamaki (2005) examines call protection
terms in a sample of 1,480 CBs with about 80% of sample consisting of U.S. and Japanese
CBs and finds that firms from countries with weaker shareholder protection and/or stronger
creditor protection issue CBs with stronger call protection. Lee et al., (2009) examine the
convertible design and find that firms in countries with stronger shareholder rights issue CBs
with a higher expected probability of converting to equity.
These differences suggest that the likelihood of CB issuance will vary systematically
with the country-specific factors, all else equal. Several studies document that the
announcement effects of CBs differ across countries. For example, in the U.S. and the U.K.,
CB issuance is generally associated with a negative stock price reaction (Dann and
Mikkelson, 1984; Abhyankar and Dunning, 1999) whereas in Japan (Kang and Stulz, 1996)),
the Netherlands (De Roon and Veld, 1998), and Taiwan (Chang, Chen, and Liu, 2001), the
stock market reaction tends to be positive.
In sum, the empirical evidence suggests that the European CBs are mostly debt-like
offerings that are issued as alternative to debt. In this paper, we focus on CB debt as an
alternative to straight debt (non-CBs) and examine the evolution of the European CB market
over time and test whether the likelihood of CB issuance varies systematically with the
country-level investor protection, after controlling for firm and market specific factors.
4. Data and Sample
4.1. Sample construction
We collect CB issuance data from the SDC Global New Issues database for the period
of 1990-2007. The final sample of CBs for the remaining empirical analysis is constructed as
follows:

12
a) We exclude financial issuers and issuers associated with government and agencies
because their motivations to raise capital could be substantially different from that of
industrial issuers.
b) We extract firm-specific information from the Compustat Global database.
Specifically, annual financial and accounting variables, monthly stock price and index data,
monthly exchange rates are from Compustat Global Industrial, Global Issues, and Global
Currency files, respectively. To match our CB dataset with the Compustat Global, we require
each CB issuance with a valid SEDOL number. We also require that the issuing firm’s
accounting data and market value for the fiscal year-end immediately prior to the issuance
date must be available on the Compustat Global.
c) We keep only one issuance if one issuer has multiple CB issuances on the same
issuance date. Furthermore, similar to Hovakimian et al., (2001) we remove dual-issuance
firms who issued CBs and non-CBs in the same year. We also exclude exchangeable CB
issuance from the analysis.
Our final dataset has 280 CBs issued by 238 firms. Table 6 shows the sample
distribution by country. The comparison with the full CB file (Table 2) suggests that we have
similar country composition in the final sample.
[Insert Table 6 about here]
To examine the likelihood of CBs, we also collect non-CB issuance from the SDC
database for comparison. We follow the same sample selection procedure for the non-CB
sample and have 2,149 issuances by 750 firms.
4.2. Comparison on firm-specific characteristics
Table 7 shows that CB issuers differ from non-CB issuers in several aspects, and most
of the differences are significant at the 1% level.2 First, CB issuers are substantially smaller
2 To minimize the impact of outliers, we winsorize firm-specific variables in the 1% of both tails.

13
based on total sales and total assets. We also sort firm’s total assets in each country and each
fiscal year into ten size portfolio (1: smallest size; 10: largest size) in Compustat Global. The
size portfolio value shows that CB issuers belong to very large firm category in the country
(median value=8), but are still smaller than non-CB issuers (median value=10).
[Insert Table 7 about here]
Contrary to the prediction of theoretical literature, CB issuers in our sample have
lower leverage ratios. Their market and book debt ratios are lower and interest coverage ratios
are higher than non-CB issuers. CB issuers are less profitable and pay out fewer dividends
than non-CB issuers. They have higher financial slacks but exhibit higher monthly stock
return volatility than non-CB issuers. The measures for growth opportunities provide mixed
results: Median Asset growth, Sales growth, M/B ratios suggest that CB issuers have slightly
higher growth opportunities than non-CB issuers but the mean values show the opposite
results, suggesting that a few extreme observations affect the mean values.
To summarize, CB issuers present some characteristics that are in line with the
theoretical predictions. For example, their greater financial slack and lower dividend payout
ratio imply they have more free cash flow concerns in Jensen’s (1986) agency costs
framework. However, their lower leverage ratios are not consistent with the theoretical
predictions. Overall, the univariate evidence indicates that we need to control for these firm-
specific factors in the regression analysis.
5. Multivariate Analysis
5.1 Variable definitions
The focus of our empirical analysis is to examine whether country-specific factors
provide additional explanation power on the likelihood of CB issuance, after controlling for
the impact of firm-specific factors and market-specific factors. We use the Logit model with

14
robust variance estimator as our main regression. The dependent variable is a CB dummy,
which equals to one for a CB issuance and zero for a non-CB issuance.
Firm-specific factors are defined as follows. Firm size is defined as the log of total
assets in U.S. million dollars and is a measure for asymmetric information. Larger firms are
expected to have lower concerns in asymmetric information (Brennan and Schwartz, 1988).
Equity volatility (Return volatility) is calculated as the standard deviation of monthly stock
return during the fiscal year prior to the issuance date. Return volatility also proxies for the
firm-level of information asymmetry. Firms with smaller size and/or higher return volatility
are more likely to issue CBs than non-CBs. Profitability (Profit) is calculated as the earnings
before interest and taxes divided by total sales. Market debt ratio is defined as the total debt
divided by the market value of assets, which is the sum of the firm’s book assets minus the
book value of the equity plus the market value of equity. Market-to-book assets ratio (M/B)
measures issuers’ growth opportunity and is calculated as the market value of total assets
divided by book value of total assets. Firms with higher M/B ratios tend to have higher
agency costs of debt, and are more likely to issue CBs.
We use a hot CB market dummy (HOT market) to capture the impact of market
condition. On an ex-post basis, the aggregate number of CBs should be positively related to
the likelihood of CB issuance. We first calculate the aggregate volume of CBs as a three-
month moving average of the monthly number of CB issuances using our full CB dataset. We
define a “hot” CB market if the monthly moving average number of CB issuances is higher
than the median number of all moving average number. We also use 10-year Treasury bond
yield and stock market index return volatility in each country to capture the ex-ante likelihood
of CB issuance. The level of equity market volatility and interest rates should be positively
related to the likelihood of CB issuance. A year 1999 dummy (Year99) is included in the
regression to test whether the introduction of Euro impacts the likelihood of CB debt.

15
[Insert Table 8 about here]
We include legal dummies (French law, German law, and Scandinavian law), creditor
rights and shareholder rights, rule of law, and several stock market and bond market
development index to capture country-specific factors. The creditor rights and shareholders
rights data is from Djankov, McLiesh, and Shleifer (2007) and Djankov, LaPorta, Lopez-de-
Silanes, and Shleifer (2008), respectively, and other country-level data is from the World
Bank. We report the mean values for 1990-2007 period in Table 8. France, which accounts for
39% of convertible issuance in our sample, has the lowest Creditor rights (value=0) among all
European countries. This raises the question why CBs are so popular in a low creditor rights
environment. The level of Capital market development also varies widely across countries.
The U.K. and Switzerland have high stock market capitalization/GDP ratio but low bond
market capitalization/GDP, implying a high level of stock market development. In contrast,
Belgium and Italy have high bond market capitalization/GDP ratio but low stock market
capitalization/GDP.
5.2 Regression results
Table 9 reports the regression results of the Logit model. We further perform two
statistical tests (Somer’s D and ROC) for the in-sample predictive power for each regression.
The Somer’s D ranges between -1.0 and 1.0 where -1.0 (1.0) represents the lowest (highest)
predictive power. The ROC shows the area under the receiver operating characteristic (ROC)
curve. The ROC value of 1 implies that the logit model perfectly predicts the dependent
variable and a value of 0.5 implies that the logit model randomly predicts the dependent
variable.
[Insert Table 9 about here]
We first estimate the impact of firm-specific factors on the likelihood of CB issuance.
In column 1, four firm-level variables are statistically significant at the 1% level and only

16
M/B ratio is not significant at any level. The coefficients on Firm Size and Return Volatility
are negative (coeff.=-0.415) and positive (coeff.=4.242), supporting the theoretical predictions
that firms with smaller size and higher return volatility are more likely to issue CBs than non-
CBs. The coefficient on Market Debt Ratio is -1.988 (t=2.91), implying that firms with higher
leverage are less likely to issue CBs. This result is not consistent with the delayed-equity view
because a high-levered firm can lower their debt ratios through converting CBs into equity.
The ROC and Somer’s D values are 0.7678 and 0.5356, respectively.
Columns 2 and 3 include additional variables capturing the market condition. In
column 2, we find that equity market index volatility is positive and significant, consistent
with the market timing theory prediction. In column 3, we include the ex-post measure for the
CB market condition and find the coefficient on HOT convertible market is not significant at
level. Since the fit and predictability of regressions in column 2 is better than that in column
3, in the remaining regressions we include the equity market index volatility and 10-yeat
Treasury bond yield to proxy for market conditions.
Next, we add country level variables in the regressions. In column 4, we add three law
dummies – French law, German law, and Scandinavian law, and find that the coefficients on
three law variables are significant. The predictive power of the model improve significantly in
contrast to previous models: Pseudo R2 increased from 0.1547 in column 2 to 0.2265 in
column 4; ROC value increase from 0.7750 to 0.8168; and Somer’s D value increase from
0.5499 to 0.6355.
In column 5, we add creditor rights and shareholder rights. The coefficient on creditor
rights is negative and significant at the 5% level. This result suggests that firms from lower
creditor rights countries are more likely to issue convertibles. The coefficient on Shareholder
rights is not significant at any level. In column 6, we add Rule of law, Year 99 dummy, Stock
market development index, Financial intermediary development index, Listed companies per

17
capita, Public bond market capitalization/GDP, and International debt issues/GDP. Most of
the coefficients on those additional variables are not significant except two variables. Year 99
dummy is negative (-0.68) and significant at the 5% level. International debt issues/GDP is
positive and significant (1.501, t=2.10), implying that firms from countries relying on
international bond market are more likely to issue convertibles.
[Insert Table 10 about here]
We continue to explore why the coefficient on Creditor rights is negative in Table 10.
Since the Creditor rights index is calculated by summing up four dummy variables
(No_autostay, Secured_first, Restrict_reorg, and Mgmt_no_stay), we include them separately
in the regressions. In columns 1 to 4, although the coefficients on all four dummy variables
are negative, only Mgmt_no_stay is statistically significant. In column 5, we include Creditor
rights index and Dividend payout ratio in the regression. Brockman and Unlu (2009) argue
that creditor rights influence dividend policies and low dividend payouts serve as a substitute
mechanism for weak creditor rights. We find that the coefficient on Dividend payout is
negative (-0.536, t=2.29) while the coefficient on Creditor rights remain negative and
significant (-0.137, t=1.72). Overall, our evidence supports that country-specific factors
significantly affect the likelihood of CB issuance after controlling for the firm and industry
variables.
6. Summary and future work
We use a large European convertible dataset to examine the geography of European
CB bonds during 1990-2007. Prior studies using the U.S. and Japanese samples cannot
investigate the influence of country-specific factors on CB markets. This study fills the gap
and explicitly tests the impact of country-specific factors on the likelihood of CB issuance,
after controlling for firm-specific and market-specific factors. Our results support that
country-specific factors, such as legal framework, significantly impact the likelihood of CB

18
issuance in contrast to non-CB issuance. We plan to conduct several additional tests in future
controlling for issue-specific factors (e.g., callable, maturity, debt-like or equity-like
convertibles) and other country-specific variables that are important in the European context,
such as the European Monetary Union (EMU) and non-EMU countries.

19
REFERENCES
Abhyankar A., and A. Dunning. Wealth effects of convertible bond and convertible preference share issues: an empirical analysis of the U.K. market. Journal of Banking and Finance 23, 1043–1065, 1999.
Bancel, F., and Mittoo, U.R. Why do European firms issue convertible debt? European Financial
Management 10, 339-373, 2004. Bayless, M. and S. Chaplinsky, Is there a window of opportunity for seasoned equity issuance?
Journal of Finance 51, 253-278, 1996. Brennan, M., and Kraus, A. Efficient financing under asymmetric information. The Journal of Finance
42, 1225-1243, 1987. Brennan, M.J., and Schwartz, E.S. The Case for convertibles. Journal of Applied Corporate Finance 1,
55-64, 1988. Brockman P. and Unlu E., Dividend policy, creditor rights, and the agency cost of debt. Journal of
Financial Economics 92, 276-299, 2009. Choe, H., R.W. Masulis, and V. Nanda, Common stock offerings across the business cycle: theory and
evidence, Journal of Empirical Finance 1, 3-31, 1993.
Constantinides, G.M., Grundy, B.D., Optimal investment with stock repurchase and financing as signals. Review of Financial Studies 2, 445-465, 1989.
Chang, S.-C., S.-S. Chen, and Y. Liu, Further evidence on why firms use convertibles: Corporate focus and the sequential-financing hypothesis", unpublished manuscript, Yuan Ze University, 2001.
Chemmanur, T.J., and K. Simonyan, Why issue putable convertibles? An empirical analysis, Working Paper, SSRN, 2005.
Dann, L.Y. and W.H. Mikkelson, Convertible debt issuance, capital structure change and financing-
related information, Journal of Financial Economics 13, 157-186, 1984.
Demirguc-Kunt, A., and V. Maksimovic, Institutions, financial markets, and firm debt maturity, Journal of Financial Economics 54, 295-336, 1999.
De Roon, F., and Veld, C. Announcement effects of convertible bond loans and warrant bond loans: an
empirical analysis for the Dutch market. Journal of Banking and Finance, 22: 1481–1506, 1998. Djankov, S., McLiesh, C., Shleifer, A. ,2007. Private credit in 129 countries. Journal of Financial
Economics 84, 299–329. Djankov ,S., La Porta, R., Lopez-de-Silanes, F., Shleifer, A., 2008. The law and economics of self-
dealing. Journal of Financial Economics 88, 430–465. Dutordoir M, Van de Gucht L.M. Why do European firms issue convertibles instead of straight debt or
equity? European Financial Management 15, 563 - 583, 2009. Dutordoir M, Van de Gucht L.M. Is there a window of opportunity for convertible debt issuance?
Evidence for Western Europe. Journal of Banking and Finance 31, 28 - 46, 2007.

20
Graham, J.R., and Harvey, C.R. The theory and practice of corporate finance: evidence from the field. Journal of Financial Economics 60. 187-243, 2001.
Green, R.C. Investment incentives, debt, and warrants. Journal of Financial Economics 13, 115-136,
1984. Jensen, M. C. Agency costs of free cash flow, corporate finance, and takeovers. The American Economic
Review 76, 323–329, 1986. Kang, J., and Stulz, R.. How different is Japanese corporate finance? An investigation of the information
content of new security issues. Review of Economics Studies, 9: 109–139, 1996. Korajczyk, R.A. and Levy, A., Capital structure choice: macroeconomic conditions and financial
constraints, Journal of Financial Economics 68, 75-109, 2003. Korkeamaki, T.P., Effects of law on corporate financing practices - international evidence from
convertible bond issues, Journal of Corporate Finance 11, 809-31. 2005, Krishnaswami, S. and D. Yaman, The role of convertible bonds in alleviating contracting costs, SSRN
working paper, 2004.
La Porta, R., Lopez-de-Silanes F., Shleifer A. and Vishny R.W. Law and finance, Journal of Political Economy 106, 1113-1155, 1998.
La Porta, R., Lopez-de-Silanes F., Shleifer A. and Vishny R.W. Legal determinants of external finance, Journal of Finance 52, 1131-52, 1997.
Lee, C., Lee, K. and Yeo, G. Investor protection and convertible debt design, Journal of Banking and Finance 33, 985-995, 2009.
Mayers, D. Why firms issue convertible bonds: the matching of financial and real investment options. Journal of Financial Economics, 47: 83-102, 1998.
Myers, S.C., and Majluf, N.S. Corporate financing and investment decisions when firms have information that investors do not have. Journal of Financial Economics 13, 187-221, 1984.
Ritter, J., The long-run performance of initial public offerings, Journal of Finance, 46, 3-27, 1991.
Ritter, J. R., Differences between European and American IPO Markets, European Financial Management 9, 421-434, 2003.
Stein, J.C. Convertible bonds as backdoor equity financing. Journal of Financial Economics 32, 3-21, 1992.
21
Table 1. The Geography of Global Convertible (CB) Markets The CB issuance data for the period of 1990-2007 is from the SDC Global New Issues database. Panel A reports the aggregate CB issues in five regions: Africa/Middle East, Americas, Central Asia/Asia-Pacific, Europe, and Japan. Industrial issuers are firms excluding financial firms and government agencies based on the SDC variable “TF Macro Description”. Panel B reports the yearly aggregate CB issuance across the five regions. All issuance amounts are in $U.S. million. Panel A: Aggregate CB issues around the World
Issuer Region All issuers Industrial issuers only Industrial issuers / All issuers
N Amts N Amts N % Amts % Africa/Middle East 43 12,321 34 9,412 79% 76%Americas 3,825 676,935 3,236 554,116 85% 82% Central Asia/Asia-Pacific 2,367 188,284 2,081 141,762 88% 75% Europe 1,448 361,583 754 217,454 52% 60% Japan 2,262 246,866 2,084 217,801 92% 88%
Panel B: Yearly CB $ amounts around the World by all issuers
Year Africa/Middle East Americas
Central Asia/Asia-
Pacific Europe Japan Americas
% Europe
% Japan
%
1990 6,602 231 3,920 30,580 16% 9% 74% 1991 11,712 1,657 6,759 10,966 38% 22% 35% 1992 10,487 589 3,030 6,590 51% 15% 32% 1993 20 20,848 5,778 10,723 20,653 36% 18% 36% 1994 420 13,993 13,409 10,428 33,010 20% 15% 46% 1995 300 17,655 4,795 8,696 10,366 42% 21% 25% 1996 298 34,368 9,340 14,290 31,546 38% 16% 35% 1997 460 43,851 12,404 16,085 2,933 58% 21% 4% 1998 24,726 4,788 30,454 2,394 40% 49% 4% 1999 100 33,143 4,907 31,541 8,801 42% 40% 11% 2000 755 52,259 9,029 25,379 6,454 56% 27% 7% 2001 83,733 11,240 43,221 4,903 59% 30% 3% 2002 62 35,297 9,658 20,112 8,910 48% 27% 12% 2003 71,072 15,233 49,023 9,573 49% 34% 7% 2004 1,402 33,834 18,946 19,887 19,360 36% 21% 21% 2005 241 31,440 10,323 17,074 12,211 44% 24% 17% 2006 2,985 66,998 21,362 17,434 20,616 52% 13% 16% 2007 5,278 84,918 34,597 33,527 7,000 51% 20% 4% Total 12,321 676,935 188,284 361,583 246,866 46% 24% 17%

22
Figure 1. Yearly Aggregate Convertible (CB) Bonds Issued by European and U.S. Firms The CB issuance data for the period of 1990-2007 is from the SDC Global New Issues database. Figure 1A shows the yearly aggregate CB issuance amount in Europe and the US. Figure 1B shows the yearly aggregate CB issuance amount in five selected European countries: France, Germany, Netherlands, Switzerland and U.K. All issuance amounts are in $U.S. million. 1A. The annual size of CB markets: Europe versus the U.S.
B. The annual size of CB markets for selected European countries
-
10,000
20,000
30,000
40,000
50,000
60,000
70,000
80,000
1990
1991
1992
1993
1994
1995
1996
1997
1998
1999
2000
2001
2002
2003
2004
2005
2006
2007
US
Europe
0
2,000
4,000
6,000
8,000
10,000
12,000
14,000
16,000
1990
1991
1992
1993
1994
1995
1996
1997
1998
1999
2000
2001
2002
2003
2004
2005
2006
2007
France
Germany
Netherlands
Switzerland
UK

23
Table 2. European Convertibles (CB) Issuances by All Firms, Industrial issuers, and Exchangeable CB Issues. The CB issuance data for the period of 1990-2007 is from the SDC Global New Issues database. Industrial issuers are firms excluding financial firms and government agencies based on the SDC variable “TF Macro Description”. Exchange CB issues allow holders to exchange the CB bond for the stock of a company other than the issuer. All issuance amounts are in $U.S. million.
Country Issues by all firms Exchangeable issues
by all firms Issues by industrial firms* Exchangeable issues by industrial firms Ratios
N Amts(a) % N Amts(b) % N Amts(c) % N Amts(d) % (b)/(a) (c)/(a) (d)/(c) Austria 23 5,600 2% 3 921 1% 12 4,324 2% 2 620 2% 16% 77% 14% Belgium 27 5,901 2% 6 915 1% 12 1,290 1% 16% 22% 0% Denmark 6 367 0% 0% 5 350 0% 0% 96% 0% Finland 60 2,776 1% 0% 40 1,945 1% 0% 70% 0% France 245 86,845 28% 35 22,656 20% 209 71,973 38% 27 17,714 45% 26% 83% 25% Germany 193 38,258 12% 129 23,683 21% 44 14,711 8% 7 2,444 6% 62% 38% 17% Greece 14 5,229 2% 8 3,596 3% 7 462 0% 2 218 1% 69% 9% 47% Ireland 11 2,478 1% 5 1,569 1% 4 280 0% 63% 11% 0% Italy 57 20,218 6% 13 7,425 7% 21 8,097 4% 1 515 1% 37% 40% 6% Netherlands 199 64,238 21% 78 27,210 24% 108 37,602 20% 18 11,192 28% 42% 59% 30% Norway 23 2,923 1% 1 122 0% 14 2,518 1% 4% 86% 0% Portugal 7 3,100 1% 3 1,531 1% 0% 49% 0% Spain 18 2,651 1% 0% 13 1,215 1% 0% 46% 0% Sweden 28 3,084 1% 11 330 0% 17 2,755 1% 11% 89% 0% Switzerland 81 25,653 8% 19 10,880 10% 50 12,069 6% 8 2,636 7% 42% 47% 22% United Kingdom 172 41,919 13% 41 11,080 10% 101 28,910 15% 8 4,207 11% 26% 69% 15% Total 1,164 311,238 100% 352 111,916 100% 657 188,500 100% 73 39,547 100% 26% 61% 21%

24
Table 3. Industry Composition of Non-financial Convertible Issuers: European versus the U.S. Firms The CB issuance data for the period of 1990-2007 is from the SDC Global New Issues database. Non-financial issuers are firms excluding financial firms and government agencies. The Industry classification is based on the SDC variable “TF Macro Description”. All issuance amounts are in $U.S. million.
Industry Selected European countries
U.S. Europe all France Germany Netherlands Switzerland United Kingdom Amts % Amts % Amts % Amts % Amts % Amts % Amts %
Consumer Products and Services 17,856 4% 10,135 5% 3,872 5% 2,311 16% 2,460 7% 176 1% 850 3% Consumer Staples 9,658 2% 9,478 5% 2,256 3% 620 4% 3,528 9% 300 2% 1,881 6% Energy and Power 55,152 11% 25,193 13% 12,351 17% 1,205 8% 3,406 9% 419 3% 4,887 17% Healthcare 91,061 18% 5,523 3% 561 1% 77 1% 99 0% 1,926 16% 2,303 8% High Technology 114,652 23% 19,891 11% 6,196 9% 702 5% 8,660 23% 3,546 29% 220 1% Industrials 44,218 9% 26,794 14% 6,340 9% 4,069 28% 5,407 14% 1,819 15% 4,262 15% Materials 18,597 4% 18,135 10% 5,460 8% 3,522 24% 1,224 3% 3,251 27% 3,160 11%Media and Entertainment 50,349 10% 20,165 11% 13,035 18% 406 3% 2,789 7% 0% 2,930 10% Real Estate 31,698 6% 10,139 5% 1,738 2% 1,385 9% 239 1% 318 3% 2,392 8% Retail 24,535 5% 11,127 6% 6,046 8% 418 3% 1,752 5% 213 2% 2,119 7% Telecommunications 38,482 8% 32,780 17% 14,640 20% 0% 8,140 22% 101 1% 4,067 14% Total 496,257 100% 189,360 100% 72,493 100% 14,716 100% 37,702 100% 12,069 100% 29,072 100%

25
Table 4. Marketplace of European Non-financial Convertible (CB) Issuances The CB issuance data for the period of 1990-2007 is from the SDC Global New Issues database. Non-financial issuers are firms excluding financial firms and government agencies based on the SDC variable “TF Macro Description”. All issuance amounts are in $U.S. million. Panel A: CB issues in public and private markets
Country Issues in Public Market Issues in Private Market Public issue N %
Public issue Amts % N Amts N Amts
Austria 12 4,324 100% 100% Belgium 10 1,220 2 69 83% 95% Denmark 4 203 1 147 80% 58% Finland 19 1,627 21 318 48% 84% France 199 63,584 12 8,910 94% 88% Germany 36 13,658 9 1,058 80% 93% Greece 5 419 2 42 71% 91% Ireland 4 280 1 20 80% 93% Italy 18 7,242 3 855 86% 89% Netherlands 94 33,418 15 4,285 86% 89% Norway 12 2,429 2 89 86% 96% Spain 11 940 2 275 85% 77% Sweden 12 2,519 9 289 57% 90% Switzerland 44 10,275 6 1,793 88% 85% United Kingdom 84 23,963 26 5,109 76% 82% Europe total 564 166,101 111 23,259 84% 88% United States 690 168,319 1,716 327,938 29% 34%
Panel B: CB issues in domestic, Euro and foreign markets
Country Domestic Euro Intl. Domestic
Amts %
Euro Amts
%
Intl. Amts
% N Amts N Amts N Amts Austria 3 97 9 4,227 2% 98% 0% Belgium 3 95 7 1,097 2 97 7% 85% 8% Denmark 3 34 1 169 1 147 10% 48% 42% Finland 33 1,105 7 840 57% 43% 0%France 56 7,356 132 60,525 23 4,613 10% 83% 6% Germany 3 580 37 12,939 5 1,197 4% 88% 8% Greece 4 103 3 359 22% 78% 0% Ireland 2 87 1 72 2 141 29% 24% 47% Italy 5 1,025 15 7,021 1 52 13% 87% 1% Netherlands 6 245 89 34,389 14 3,068 1% 91% 8% Norway 6 272 7 2,140 1 106 11% 85% 4% Spain 9 554 4 661 46% 54% 0%Sweden 3 1,053 9 1,167 9 588 37% 42% 21% Switzerland 9 1,010 11 5,107 30 5,951 8% 42% 49% United Kingdom 2 86 90 26,335 18 2,651 0% 91% 9% Europe total 147 13,700 422 157,050 106 18,610 7% 83% 10% United States 2,191 452,649 129 20,907 86 22,702 91% 4% 5%

26
Table 5. European Convertible (CB) Bonds with Right to Call (or Put) Table 5 shows the amount of European CB issuance with right to call or put. The CB data is provided by Exane and BNP Paribas for the period of 1992-2005. We manually check this data with the SDC data and find that most issues are identical between the two sources.
Countries # Of convertibles that include a call
% Of convertibles that include a call / Of convertibles without a
call
# Of convertibles that include a put
% Of convertibles that include a put / Of convertibles without a
put
Austria 4 40.0% 0 0.0%Belgium 10 58.8% 1 5.9%Cyprus 1 100.0% 0 0.0%Denmark 3 75.0% 0 0.0%Finland 7 58.3% 0 0.0%France 196 88.7% 18 8.1%Germany 55 73.3% 10 13.3%Greece 6 100.0% 0 0.0%Hungary 1 100.0% 0 0.0%Ireland 4 100.0% 1 25.0%Italy 53 59.6% 14 15.7%Luxembourg 9 69.2% 2 15.4%Netherlands 59 96.7% 1 1.6%Norway 1 20.0% 0 0.0%Poland 4 80.0% 2 40.0%Portugal 4 80.0% 0 0.0%Russia 4 100.0% 0 0.0%Spain 11 68.8% 1 6.3%Sweden 5 25.0% 1 5.0%Switzerland 94 74.6% 18 14.3%UK 85 85.9% 10 10.1%
Total 616.0 77.6% 79.0 10%

27
Table 6. Sample Distribution of European Convertible and Straight Debt Issuances This table compares the sample distribution of convertible (CB) and straight debt (Non-CB) issuances. We collect the CB and non-CB debt issuance data from the SDC Global New Issues database for the period of 1990-2007. To remain in the final sample, both CBs and non-CBs must meet the following requirements: 1) non-financial firms and non-government related agencies only; 2) the country’s legal classification is available in LLSV (1997, 1998); 3) the accounting data and market value of the issuing firm must be available on Compustat Global database for the fiscal year-end immediately prior to the issuance date; 4) keep only one issuance if one issuer has multiple convertible issuances at the same date; 5) excluding exchangeable convertible issues.
CBs Non-CBs N % N % Austria 3 1% 35 2% Belgium 3 1% 32 1% Denmark 4 1% 16 1% Finland 8 3% 52 2% France 110 39% 505 23% Germany 16 6% 193 9% Greece 3 1% 7 0% Ireland 2 1% 11 1% Italy 6 2% 96 4% Netherlands 41 15% 112 5% Norway 7 3% 73 3% Portugal 0 0% 28 1% Spain 6 2% 78 4% Sweden 4 1% 55 3% Switzerland 22 8% 105 5% United Kingdom 45 16% 751 35% Total 280 100% 2149 100%

28
Table 7. Firm Characteristics for European Convertible and Straight Debt Issuers This Table compares firm characteristics between European convertible (CB) and straight debt (Non-CB) issuers. We collect the firm-specific factors from the Compustat Global database. Size portfolio value: we rank total assets for the firms in each European countries within each fiscal year into ten size portfolio and assign them values 1 to 10 (1: smallest firms; 10: largest firms). Asset growth and sale growth are the annual percentage increase in total assets and net sales. M/B asset ratio is the sum of total assets minus the book value of common equity plus the market value of common equity divided by the total assets. M/B equity ratio is the market value of equity divided by the book value of equity. Asset tangibility is the net tangible assets divided by the total assets. Financial slack is the sum of cash and other short-term investments divided by the total assets. Operating margin is the operating income divided by the total sales. Net income margin is the net income divided by the total sales. Interest coverage is the operating income divided by the interest expenses. Book (market) debt ratio is the total debt divided by the book (market) value of assets. Depreciation ratio is the amount of depreciation and amortization divided by the total assets. Dividend payout ratio is the dividends divided by the net income. t test and Wilcoxon z test compare the difference in mean and median values.
Convertibles Straight debt issuers t-test
Wilcoxon z-test Mean Median Mean Median
Total Assets ($mil.) 83081.75 2094.34 187999.20 14075.79 ** *** Size portfolio value 7.50 8.00 9.04 10.00 *** *** Sales ($mil.) 44786.98 1996.83 91452.10 11433.40 ** *** Assets growth 0.30 0.09 3.12 0.07 ** Sales growth 0.65 0.09 6.08 0.06 * ** M/B asset ratio 7.33 1.37 29.54 1.32 *** M/B equity ratio 21.03 2.04 72.39 2.04 *** Assets tangibility 0.29 0.25 0.41 0.37 *** *** Financial slack 0.12 0.09 0.08 0.06 *** *** Operating margin 0.06 0.07 0.11 0.09 *** *** Net income margin 0.01 0.03 0.05 0.04 *** *** Interest coverage 6.87 3.78 4.73 3.62 *** Book debt ratio 0.27 0.26 0.31 0.29 *** *** Market debt ratio 0.19 0.17 0.22 0.21 *** *** Depreciation ratio 0.05 0.04 0.05 0.04 Dividend payout ratio 0.16 0.00 0.32 0.28 *** *** Monthly return volatility 0.14 0.11 0.10 0.08 *** ***
*, ** and *** represent 10%, 5% and 1% significance level, respectively.

29
Table 8. Country-level data for 16 European countries This table reports country-level data for 16 Western European countries. Creditor rights and Shareholders (S.H) rights are from Djankov, McLiesh, and Shleifer (2007) and Djankov, LaPorta, Lopez-de-Silanes, and Shleifer (2008), respectively. The remaining country-level data is from World Bank. We present the mean values for the 1990-2007 period. GDP and GDP per Capita are in U.S dollars. Stock market cap./GDP is the value of listed shares to GDP. Stock value traded/GDP is the total shares traded on the stock market exchange to GDP. Stock turnover is the ratio of the value of total shares traded to average real market capitalization. Stock market development is average of standardized values of market capitalization to GDP, total value traded to GDP, and total value traded to market capitalization ratios. Financial intermed. development is the average of standardized values of liquid liabilities to GDP and domestic credit for private firms to GDP ratios. Listed firms per capita is the number of publicly listed companies per capita. Bond market cap./GDP is the public domestic debt securities issued by government as a share of GDP. Int. debt issues/GDP is the international debt securities (amount outstanding) as a share of GDP.
Country Legal system Creditor rights
S.H rights
GDP ($bil.)
GDP per
capita
Stock market
cap./GDP
Stock value traded/GDP
Stock turnover
Stock market development
Financial intermed.
development
Listed firms per
capita
Bond market
cap./GDP
Int. debt
issues /GDP
Austria German 3 2.5 230 28643 0.20 0.09 0.48 0.26 0.93 0.13 0.31 0.41 Belgium French 2 3 280 27246 0.57 0.17 0.25 0.33 0.76 0.17 0.96 0.48 Denmark Scandinavian 3 4 189 35440 0.49 0.33 0.60 0.47 0.71 0.43 0.50 0.20 Finland Scandinavian 1 3.5 144 27889 0.90 0.78 0.69 0.79 0.60 0.21 0.29 0.37France French 0 3.5 1611 26456 0.61 0.50 0.69 0.60 0.77 0.12 0.40 0.23 Germany German 3 3.5 2289 27972 0.39 0.45 1.12 0.65 0.96 0.08 0.29 0.36 Greece French 1 2 159 14609 0.39 0.24 0.44 0.36 0.55 0.23 0.59 0.22Ireland English 1 5 112 28467 0.60 0.29 0.50 0.43 0.80 0.18 0.30 0.47 Italy French 2 2 1338 23270 0.34 0.36 0.83 0.51 0.63 0.04 0.87 0.20 Netherlands French 3 2.5 451 28423 0.95 1.02 0.95 0.97 1.05 0.14 0.44 0.59 Norway Scandinavian 2 3.5 190 42314 0.38 0.36 0.75 0.50 0.61 0.37 0.18 0.21 Portugal French 1 2.5 129 12578 0.31 0.20 0.51 0.34 0.96 0.12 0.41 0.30 Spain French 2 5 741 17941 0.57 0.88 1.19 0.88 0.89 0.35 0.41 0.29 Sweden Scandinavian 1 3.5 282 31783 0.90 0.85 0.81 0.85 0.54 0.29 0.43 0.40 Switzerland German 1 3 297 41029 1.89 1.80 0.82 1.48 1.45 0.33 0.21 0.34 United Kingdom English 4 5 1557 26349 1.31 1.07 0.77 1.05 1.10 0.36 0.30 0.35 European Average 1.88 3.38 625 27526 0.68 0.59 0.72 0.66 0.83 0.22 0.43 0.34

30
Table 9. Logit Regression of Likelihood of Convertible Issuance. This table reports Logit regression result of the impact of firm, market and country-specific factors on the likelihood of convertible (CB) issuances compared to straight debt (non-CB) issuance. The dependent variable is the CB dummy, which equals to one if it is a convertible and zero if it is a non-CB issuance. Firm size is the log of total assets in U.S. million dollars. Profit is the operating income divided by the total sales. Market debt ratio is total debt divided by the market value of assets. Return volatility is the standard deviation of monthly stock return during the fiscal year prior to the issuance date. M/B ratio is the sum of total assets minus the book value of common equity plus the market value of common equity divided by the total assets. 10-year Treasury bond yield is from the OECD statistics. Equity market index volatility is the standard deviation of monthly stock market return during the year prior to the issuance date. French law, German Law and Scandinavian Law equal to one if the country belongs to the specific legal framework outlined in LLSV (1997, 1998), and equal to zero otherwise. Creditor rights and Shareholders rights are from Djankov, McLiesh, and Shleifer (2007) and Djankov, LaPorta, Lopez-de-Silanes, and Shleifer (2008), respectively. Year99 is a dummy variable that equals to one if the issuance is after year (including) year 1999 and zero otherwise. The remaining variables are provided by the World Bank. Rule of law is from Worldwide Governance Indicators (WGI). Stock market development is average of standardized values of market capitalization to GDP, total value traded to GDP, and total value traded to market capitalization ratios. Financial intermediary development is the average of standardized values of liquid liabilities to GDP and domestic credit for private firms to GDP ratios. Listed companies per capita is the number of publicly listed companies per capita. Bond market capitalization/GDP is the public domestic debt securities issued by government as a share of GDP. International debt issues/GDP is the international debt securities (amount outstanding) as a share of GDP.
(1) (2) (3) (4) (5) (6) Intercept 1.763*** 1.430*** 1.817*** 1.101** 1.122 0.631
(4.83) (2.98) (4.86) (2.40) (1.19) (0.24) Firm size -0.415*** -0.430*** -0.416*** -0.572*** -0.599*** -0.578***
(9.51) (9.80) (9.52) (12.44) (12.00) (10.16) Profit -2.449*** -2.402*** -2.470*** -2.190*** -2.186*** -2.473***
(3.50) (3.37) (3.53) (2.79) (2.80) (3.05) Market debt ratio -1.988*** -2.008*** -1.978*** -2.344*** -2.426*** -2.121***
(2.91) (2.94) (2.90) (3.40) (3.47) (2.84) Return volatility 4.242*** 3.986*** 4.256*** 2.856*** 2.617*** 3.574***
(5.51) (5.06) (5.51) (3.50) (3.13) (3.69) M/B ratio -0.001 -0.001 -0.001 -0.001 -0.001 -0.000
(0.84) (0.78) (0.84) (0.77) (0.52) (0.16) 10-year treasury bond yield -0.010 0.123*** 0.136*** 0.203***
(0.24) (2.80) (3.03) (2.60) Equity market index volatility 11.341*** 6.451** 7.853** 7.144
(4.05) (2.11) (2.45) (1.63) HOT convertible market -0.090
(0.64) French law 2.106*** 1.947*** 1.898***
(9.43) (3.90) (2.99) German Law 1.080*** 1.078** 0.955*
(4.02) (2.38) (1.85) Scandinavian Law 0.693** 0.497 0.608
(2.21) (1.02) (0.67) Creditor rights -0.167** -0.281***
(2.11) (2.68) Shareholder rights 0.146 0.168
(0.88) (0.64) Rule of law -0.502
(0.73) Year99 -0.680**
(2.05) Stock market developemnt 0.062
(0.23) Financial intermediary development 0.952
(0.89) Listed companies per capita -0.157
(0.14) Public bond market capitalization/GDP -0.817
(0.61) International debt issues/GDP 1.501**
(2.10) N 2199 2196 2199 2196 2196 2060 Log likelihood -683.78 -676.88 -683.58 -619.38 -615.26 -553.81 Pseudo R2 0.1465 0.1547 0.1467 0.2265 0.2316 0.2383 ROC 0.7678 0.7750 0.7676 0.8168 0.8199 0.8252 Somer's D 0.5356 0.5499 0.5352 0.6335 0.6398 0.6504
*, ** and *** represent 10%, 5% and 1% significance level, respectively.

31
Table 10. Separating the Impact of Creditor Rights on the Likelihood of Convertible Issuance This table reports Logit regression result of the impact of firm, market, and country-specific factors on the likelihood of convertible (CB) issuances compared to straight debt (non-CB) issuance. The dependent variable is the CB dummy, which equals to one if it is a convertible and zero if it is a non-CB issuance. Firm size is the log of total assets in U.S. million dollars. Profit is the operating income divided by the total sales. Market debt ratio is total debt divided by the market value of assets. Return volatility is the standard deviation of monthly stock return during the fiscal year prior to the issuance date. M/B ratio is the sum of total assets minus the book value of common equity plus the market value of common equity divided by the total assets. 10-year Treasury bond yield is from the OECD statistics. Equity market index volatility is the standard deviation of monthly stock market return during the year prior to the issuance date. French law, German Law and Scandinavian Law equal to one if the country belongs to the specific legal framework outlined in LLSV (1997, 1998), and equal to zero otherwise. Creditor rights and Shareholders rights are from Djankov, McLiesh, and Shleifer (2007) and Djankov, LaPorta, Lopez-de-Silanes, and Shleifer (2008), respectively. NO_AUTOSTAY equals one if there is no automatic stay on assets, and zero otherwise. SECURED_FIRST equals one if secured creditors are given the absolute priority claims during bankruptcy, and zero otherwise. RESTRICT_REORG equals one if management cannot file for reorganization unilaterally, and zero otherwise. MGMT_NOT_STAY equals one if either creditors or courts can change the incumbent management during bankruptcy proceedings.
(1) (2) (3) (4) (5) Intercept 0.594 0.024 0.516 0.643 1.216
(0.67) (0.03) (0.50) (0.78) (1.29) Firm size -0.591*** -0.594*** -0.596*** -0.599*** -0.593***
(11.80) (12.06) (12.24) (11.86) (11.92) Profit -2.146*** -2.209*** -2.198*** -2.193*** -1.956**
(2.76) (2.84) (2.84) (2.82) (2.55) Market debt ratio -2.346*** -2.400*** -2.372*** -2.437*** -2.421***
(3.39) (3.44) (3.40) (3.49) (3.48) Return volatility 2.753*** 2.677*** 2.671*** 2.621*** 2.492***
(3.33) (3.22) (3.20) (3.16) (2.99) M/B ratio -0.001 -0.001 -0.001 -0.001 -0.000
(0.67) (0.65) (0.59) (0.49) (0.31) 10-year treasury bond yield 0.121*** 0.129*** 0.124*** 0.136*** 0.138***
(2.77) (2.89) (2.79) (3.07) (3.12) Equity market index volatility 6.830** 7.725** 7.408** 7.825** 7.992**
(2.21) (2.39) (2.33) (2.44) (2.46) French law 2.168*** 2.499*** 2.323*** 2.260*** 1.845***
(4.42) (6.30) (4.43) (5.46) (3.73) German Law 1.109** 1.507*** 1.448*** 1.247*** 1.029**
(2.21) (3.90) (3.52) (2.97) (2.30) Scandinavian Law 0.734 0.884** 0.963** 0.581 0.437
(1.64) (2.06) (2.35) (1.28) (0.90) Shareholder rights 0.205 0.279* 0.201 0.199 0.131
(1.43) (1.90) (1.13) (1.27) (0.80) No_autostay -0.381
(1.18) Secured_first -0.224
(1.16) Restrict_reorg -0.263
(0.94) Mgmt_no_stay -0.447**
(2.35) Creditor rights -0.137*
(1.72) Dividend payout -0.536**
(2.29) N 2196 2196 2196 2196 2196 Log likelihood -616.73 -616.8 -617.04 -614.57 -611.73 Pseudo R2 0.2298 0.2297 0.2294 0.2325 0.236 ROC 0.8175 0.8185 0.8182 0.8204 0.8234 Somer's D 0.6351 0.6371 0.6364 0.6408 0.6469
*, ** and *** represent 10%, 5% and 1% significance level, respectively.