Embed Size (px)
DESCRIPTION
The Games Economists Play: Interactive Public Policy Pennsylvania Capital Campus March 19, 2008 copies of this presentation can be found at www.business.duq.edu/faculty/davies. - PowerPoint PPT Presentation
Citation preview

1
The Games Economists Play: Interactive Public Policy
Pennsylvania Capital CampusMarch 19, 2008
copies of this presentation can be found atwww.business.duq.edu/faculty/davies
The purpose of this simulation is to create a competitive market and to observe the market as it achieves equilibrium.
In this simulation, you will experience real market forces. The same human traits and behaviors that govern real markets exist in the simulation.
What are artificial are your surroundings. The market forces are real.
2
The Players and the Goals
In this experiment, there are CONSUMERS and FIRMS.
FIRMS manufacture stuff.
CONSUMERS buy stuff from FIRMS.
3

The Players and the Goals
Two types of firms
• Red Firms produce Red Stuff.
• Blue Firms produce Blue Stuff.
• Firms sell stuff to consumers.
Each firm’s goal: Maximize profit
4

The Objects
= 1 unit of Blue Stuff
= 1 unit of Red Stuff
= 1 dollar
Stuff
$
Stuff
= 50 cents (each)
5

Units Sold Total Cost Units Sold Total Cost
0 35.0 15 57.5
1 35.1 16 60.6
2 35.4 17 63.9
3 35.9 18 67.4
4 36.6 19 71.1
5 37.5 20 75.0
6 38.6 21 79.1
7 39.9 22 83.4
8 41.4 23 87.9
9 43.1 24 92.6
10 45.0 25 97.5
11 47.1 26 102.6
12 49.4 27 107.9
13 51.9 28 113.4
14 54.6 29 119.1
30 125.0
Each firm can produce a maximum of 30 units of stuff.
Every chip you sell constitutes 1 unit produced.
Chart shows the total cost of producing and selling various quantities.
6
Units Sold Total Cost Units Sold Total Cost
0 35.0 15 57.5
1 35.1 16 60.6
2 35.4 17 63.9
3 35.9 18 67.4
4 36.6 19 71.1
5 37.5 20 75.0
6 38.6 21 79.1
7 39.9 22 83.4
8 41.4 23 87.9
9 43.1 24 92.6
10 45.0 25 97.5
11 47.1 26 102.6
12 49.4 27 107.9
13 51.9 28 113.4
14 54.6 29 119.1
30 125.0
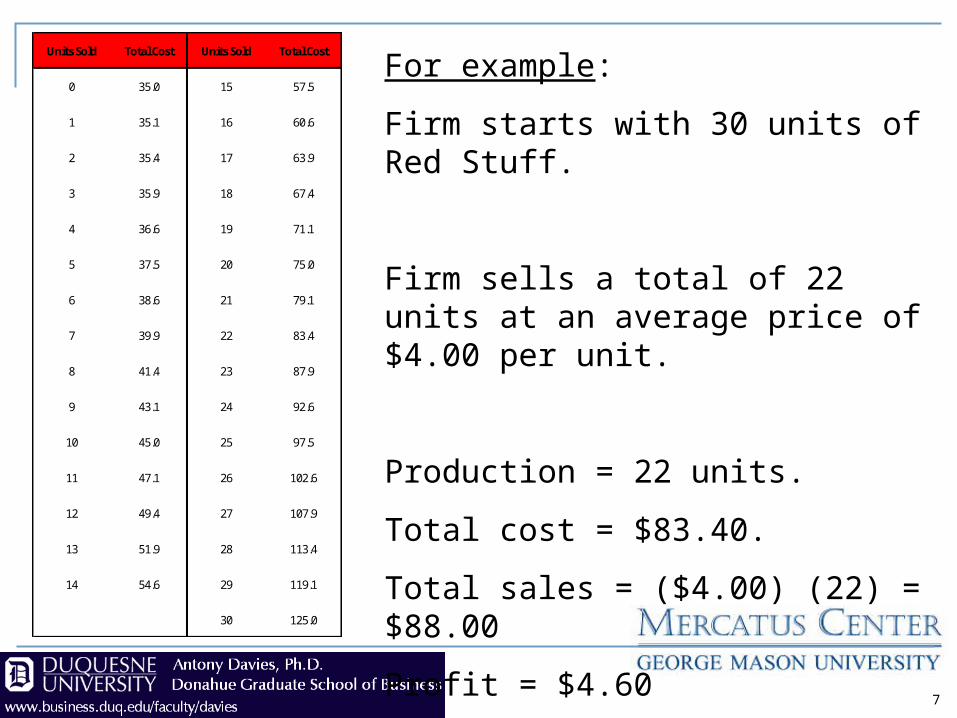
For example:
Firm starts with 30 units of Red Stuff.
Firm sells a total of 22 units at an average price of $4.00 per unit.
Production = 22 units.
Total cost = $83.40.
Total sales = ($4.00) (22) = $88.00
Profit = $4.60
7
Units Sold Total Cost Units Sold Total Cost
0 35.0 15 57.5
1 35.1 16 60.6
2 35.4 17 63.9
3 35.9 18 67.4
4 36.6 19 71.1
5 37.5 20 75.0
6 38.6 21 79.1
7 39.9 22 83.4
8 41.4 23 87.9
9 43.1 24 92.6
10 45.0 25 97.5
11 47.1 26 102.6
12 49.4 27 107.9
13 51.9 28 113.4
14 54.6 29 119.1
30 125.0
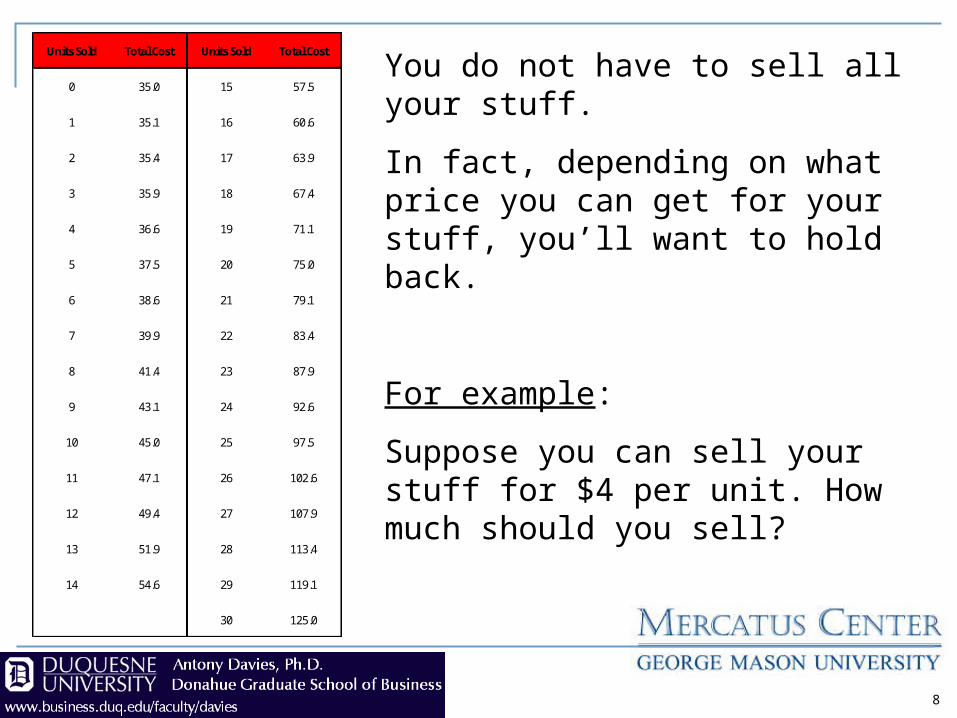
You do not have to sell all your stuff.
In fact, depending on what price you can get for your stuff, you’ll want to hold back.
For example:
Suppose you can sell your stuff for $4 per unit. How much should you sell?
8

Units Sold Total Cost Units Sold Total Cost
0 35.0 15 57.5
1 35.1 16 60.6
2 35.4 17 63.9
3 35.9 18 67.4
4 36.6 19 71.1
5 37.5 20 75.0
6 38.6 21 79.1
7 39.9 22 83.4
8 41.4 23 87.9
9 43.1 24 92.6
10 45.0 25 97.5
11 47.1 26 102.6
12 49.4 27 107.9
13 51.9 28 113.4
14 54.6 29 119.1
30 125.0
Sell 0 units
Sales = ($4.00) (0) = $0.00
Cost = $35.00
Profit = – $35.00
Sell 15 units
Sales = ($4.00) (15) = $60.00
Cost = $57.50
Profit = $2.50
Sell 30 units
Sales = ($4.00) (30) = $120.00
Cost = $125.00
Profit = – $5.00
9

Units Sold Total Cost Units Sold Total Cost
0 35.0 15 57.5
1 35.1 16 60.6
2 35.4 17 63.9
3 35.9 18 67.4
4 36.6 19 71.1
5 37.5 20 75.0
6 38.6 21 79.1
7 39.9 22 83.4
8 41.4 23 87.9
9 43.1 24 92.6
10 45.0 25 97.5
11 47.1 26 102.6
12 49.4 27 107.9
13 51.9 28 113.4
14 54.6 29 119.1
30 125.0
An easy way to decide whether or not you should sell more is to compare the price you get from selling one more unit to the additional cost of selling one more unit.
10
For example:
Suppose you have already sold 7 units.
A consumer offers you $5 for another unit.
Should you sell one more unit?
What is your current total cost?
7 units of output $39.90
What will selling one more unit do to your costs?
Increase total cost by $1.50
$5 extra sales exceeds $1.50 extra cost sell it!

The Players and the Goals
Workers consume stuff they buy from firms
Each worker’s goal: Maximize happiness
11

Consumers buy Red Stuff and Blue Stuff from the firms.
Consumers consume every-thing they buy.
Chart shows the happiness the consumer gets from consuming various quantities of stuff.
0 1 2 3 4 5 6 7 8 9 10
0 0 1 2 2 3 3 3 4 4 4 4
1 8 10 11 12 13 14 14 15 15 15 16
2 15 18 20 21 22 23 24 25 25 26 26
3 22 26 28 30 31 33 34 34 35 36 37
4 29 34 36 38 40 41 43 44 45 45 46
5 36 41 44 46 48 50 51 53 54 55 56
6 42 48 52 54 57 58 60 61 63 64 65
7 49 55 59 62 65 67 68 70 71 73 74
8 55 62 66 70 72 75 77 78 80 81 83
9 61 69 73 77 80 83 85 87 88 90 91
10 67 75 81 85 88 90 93 95 97 98 100
12

For example:
Suppose the consumer buys a total of 5 units of Red Stuff and 8 units of Blue Stuff.
The consumer’s total happiness is 54.
0 1 2 3 4 5 6 7 8 9 10
0 0 1 2 2 3 3 3 4 4 4 4
1 8 10 11 12 13 14 14 15 15 15 16
2 15 18 20 21 22 23 24 25 25 26 26
3 22 26 28 30 31 33 34 34 35 36 37
4 29 34 36 38 40 41 43 44 45 45 46
5 36 41 44 46 48 50 51 53 54 55 56
6 42 48 52 54 57 58 60 61 63 64 65
7 49 55 59 62 65 67 68 70 71 73 74
8 55 62 66 70 72 75 77 78 80 81 83
9 61 69 73 77 80 83 85 87 88 90 91
10 67 75 81 85 88 90 93 95 97 98 100
13

For example:
Consumer starts with $50.
Suppose that the price of Red Stuff is $2.00 per unit and that the price of Blue Stuff is $6.00 per unit.
What can the consumer buy?
0 1 2 3 4 5 6 7 8 9 10
0 0 1 2 2 3 3 3 4 4 4 4
1 8 10 11 12 13 14 14 15 15 15 16
2 15 18 20 21 22 23 24 25 25 26 26
3 22 26 28 30 31 33 34 34 35 36 37
4 29 34 36 38 40 41 43 44 45 45 46
5 36 41 44 46 48 50 51 53 54 55 56
6 42 48 52 54 57 58 60 61 63 64 65
7 49 55 59 62 65 67 68 70 71 73 74
8 55 62 66 70 72 75 77 78 80 81 83
9 61 69 73 77 80 83 85 87 88 90 91
10 67 75 81 85 88 90 93 95 97 98 100
14
($2.00) (1 Red) + ($6.00) (8 Blue) = $50
($2.00) (4 Red) + ($6.00) (7 Blue) = $50
($2.00) (7 Red) + ($6.00) (6 Blue) = $50
($2.00) (10 Red) + ($6.00) (5 Blue) = $50

For example:
Of these possibilities, the combination of 10 Red and 5 Blue yields the greatest happiness.
That is the combination the consumer should buy.
0 1 2 3 4 5 6 7 8 9 10
0 0 1 2 2 3 3 3 4 4 4 4
1 8 10 11 12 13 14 14 15 15 15 16
2 15 18 20 21 22 23 24 25 25 26 26
3 22 26 28 30 31 33 34 34 35 36 37
4 29 34 36 38 40 41 43 44 45 45 46
5 36 41 44 46 48 50 51 53 54 55 56
6 42 48 52 54 57 58 60 61 63 64 65
7 49 55 59 62 65 67 68 70 71 73 74
8 55 62 66 70 72 75 77 78 80 81 83
9 61 69 73 77 80 83 85 87 88 90 91
10 67 75 81 85 88 90 93 95 97 98 100
15
($2.00) (1 Red) + ($6.00) (8 Blue) = $50
($2.00) (4 Red) + ($6.00) (7 Blue) = $50
($2.00) (7 Red) + ($6.00) (6 Blue) = $50
($2.00) (10 Red) + ($6.00) (5 Blue) = $50

Accounting Phase
After all trading is done, players add up their chips.
Consumers report:
• Units of Red Stuff purchased.• Units of Blue Stuff purchased.
Firms report:
• Units of stuff remaining (i.e., unsold).• Money earned.
16

Trading Rules
Firms must remain in their seats.
Firms display cards indicating their ask prices.
Consumers may only purchase 1 unit of stuff at a time.
Purchase the unit, takes it back to your seat, go back and purchase another unit, etc.
17

Ready to begin…
18
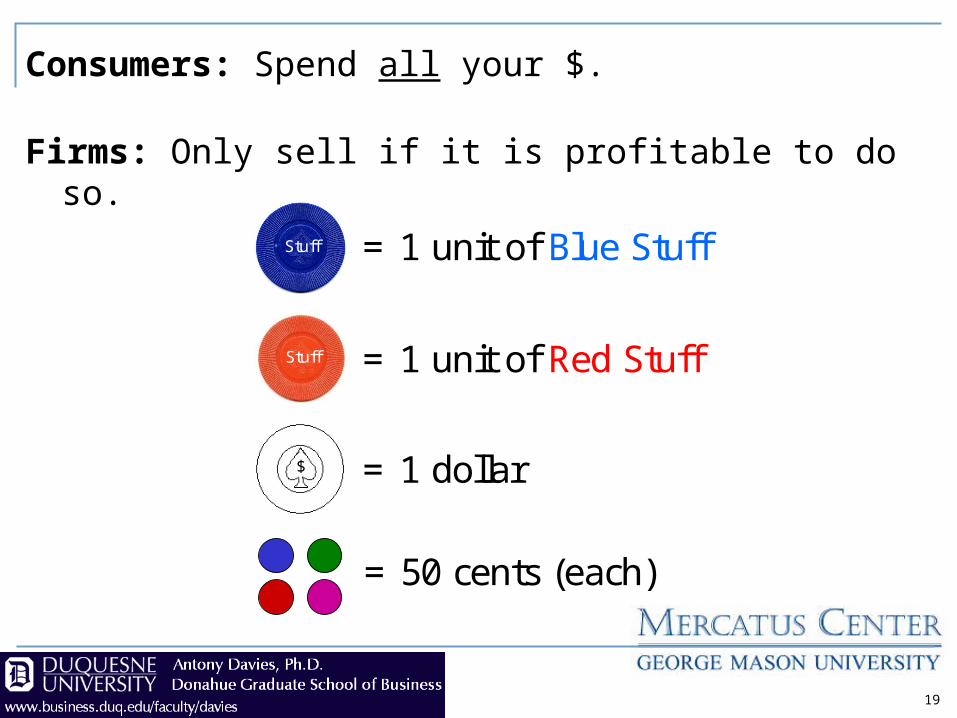
Consumers: Spend all your $.
Firms: Only sell if it is profitable to do so.
19
= 1 unit of Blue Stuff
= 1 unit of Red Stuff
= 1 dollar
Stuff
$
Stuff
= 50 cents (each)

Accounting Phase
Workers report:
• Income earned• Unsold labor
Firms report:
• Blue labor hired• Red labor hired• Money remaining
20

Publicly Provided Good
The government has taxed each consumer $30. The government used the tax revenue to provide each consumer with 8 units of Blue Stuff.
Each consumer begins this round with 8 units of Blue Stuff.
Each Blue firm begins this round having already sold 16 units of Blue Stuff.
21

Ready to begin…
22

Consumers: Spend all your $.
Firms: Only sell if it is profitable to do so.
23
= 1 unit of Blue Stuff
= 1 unit of Red Stuff
= 1 dollar
Stuff
$
Stuff
= 50 cents (each)
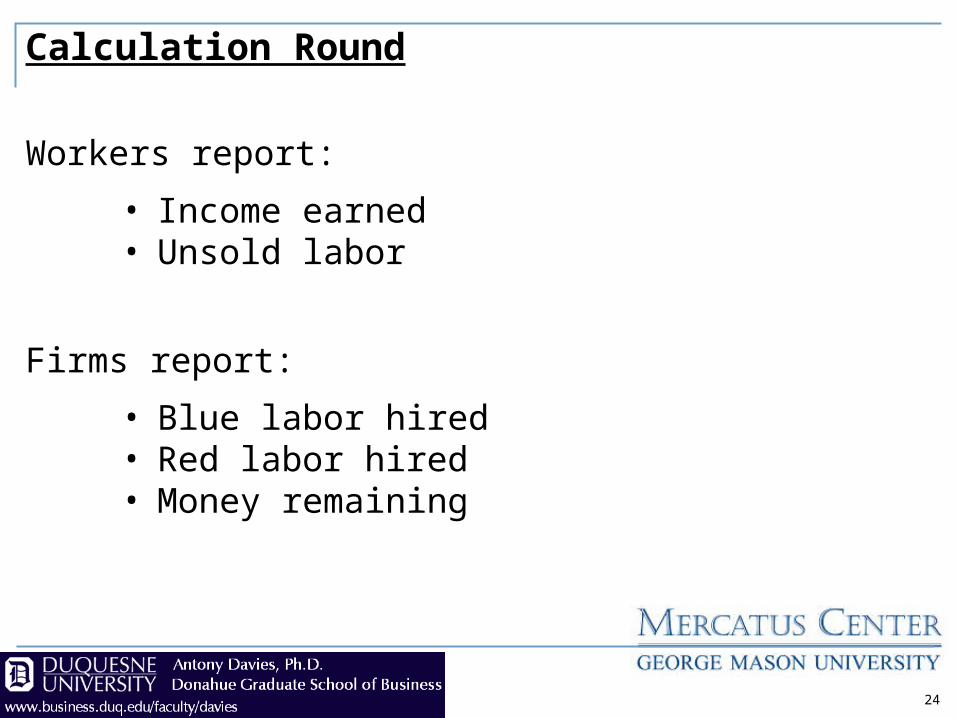
Calculation Round
Workers report:
• Income earned• Unsold labor
Firms report:
• Blue labor hired• Red labor hired• Money remaining
24

Results…
25

0
20
40
60
80
100
120
Round 1 Round 2
Red Consumed Blue Consumed
26

0
20
40
60
80
100
120
140
160
180
Round 1 Round 2
Red Consumed Blue Consumed
27

$0.00$0.10$0.20$0.30$0.40$0.50$0.60$0.70$0.80$0.90$1.00
Round 1 Round 2
Red Price (per unit) Blue Price (per unit)
28

$0.00
$0.50
$1.00
$1.50
$2.00
$2.50
$3.00
$3.50
$4.00
$4.50
$5.00
Round 1 Round 2
Red Price (per unit) Blue Price (per unit)
29

0
50
100
150
200
250
300
350
400
450
Round 1 Round 2
Happiness (odd, total) Happiness (even, total)
30

790
800
810
820
830
840
850
860
870
880
890
Round 1 Round 2
Happiness (odd, total) Happiness (even, total)
31
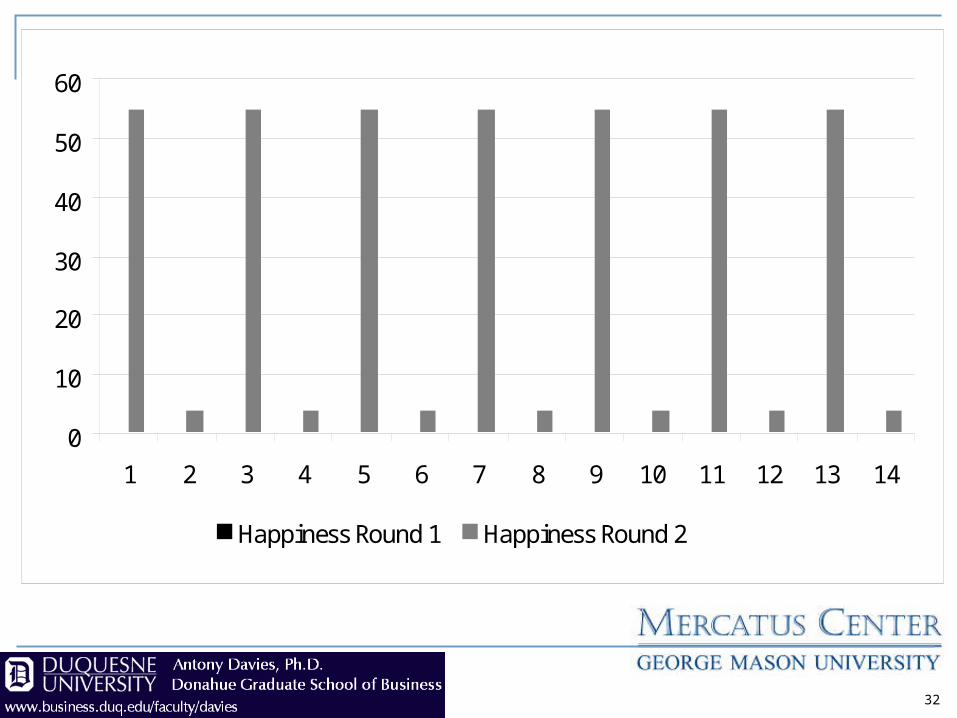
0
10
20
30
40
50
60
1 2 3 4 5 6 7 8 9 10 11 12 13 14
Happiness Round 1 Happiness Round 2
32

-$140
-$120
-$100
-$80
-$60
-$40
-$20
$0
Red
1
Red
2
Red
3
Red
4
Red
5
Red
6
Red
7
Blue
1
Blue
2
Blue
3
Blue
4
Blue
5
Blue
6
Blue
7
Profit Round 1 Profit Round 2
33

When the government taxes to provide a good publicly, it forces consumers to consumer a quantity of the good that
they may not want to consume.
34

For non-economic reasons, it may be desirable to force consumers to consume a specific quantity of a
product.
But, it is important to be aware of the tradeoffs – what do you force the
consumer to give up?
35
What has been happening to the cost of health care over time?
36

0.0
50.0
100.0
150.0
200.0
250.0
300.0
350.0
400.0
1980
1981
1982
1983
1984
1985
1986
1987
1988
19
8919
9019
9119
9219
9319
9419
9519
9619
9719
9819
9920
0020
0120
0220
0320
0420
0520
06
Price of Medical Care Consumer Prices Excluding Medical Care
37
Source: Bureau of Labor Statistics (www.economy.com)
Price of medical care has increased 349% since 1980 versus 135% for other consumer prices.

0.0
50.0
100.0
150.0
200.0
250.0
300.0
350.0
400.0
450.0
500.0
1980
1981
1982
1983
1984
1985
1986
1987
1988
19
8919
9019
9119
9219
9319
9419
9519
9619
9719
9819
9920
0020
0120
0220
0320
0420
0520
06
Price of Physicians Services
Price of Hospital Services
Price of Prescription Drugs and Medical Supplies
38
Source: Bureau of Labor Statistics (www.economy.com)
Hospital services + 576%
Drugs and supplies + 402%
Physician services + 282%
Other consumer prices+ 135%

-800%
-600%
-400%
-200%
0%
200%
400%
600%
Co
lle
ge
Tu
itio
n
Me
dic
al C
are
Sta
te/L
oca
l Go
v't
(pe
r-c
ap
ita
)
Fed
era
l Go
v't
(pe
r-c
ap
ita
)
Ho
usi
ng
Foo
d
Ga
soli
ne
Ne
w C
ars
1 G
Hz
of
Co
mp
uti
ng
Po
we
r
Gro
wth
in P
rice
s 1
98
0
-20
06
39
Source: Bureau of Labor Statistics (www.economy.com)

The cost of health care is only one-half of the transaction.
What has been happening to the quality of health care?
40

41
7.5
8.0
8.5
9.0
9.5
10.0
1960
1970
1972
1974
1976
1978
1980
1982
1984
1986
1988
1990
1992
1994
1996
1998
2000
2002
2004
2006
Deaths per 1,000 People
Source: Statistical Abstract of the United States, 2008, Table 77.
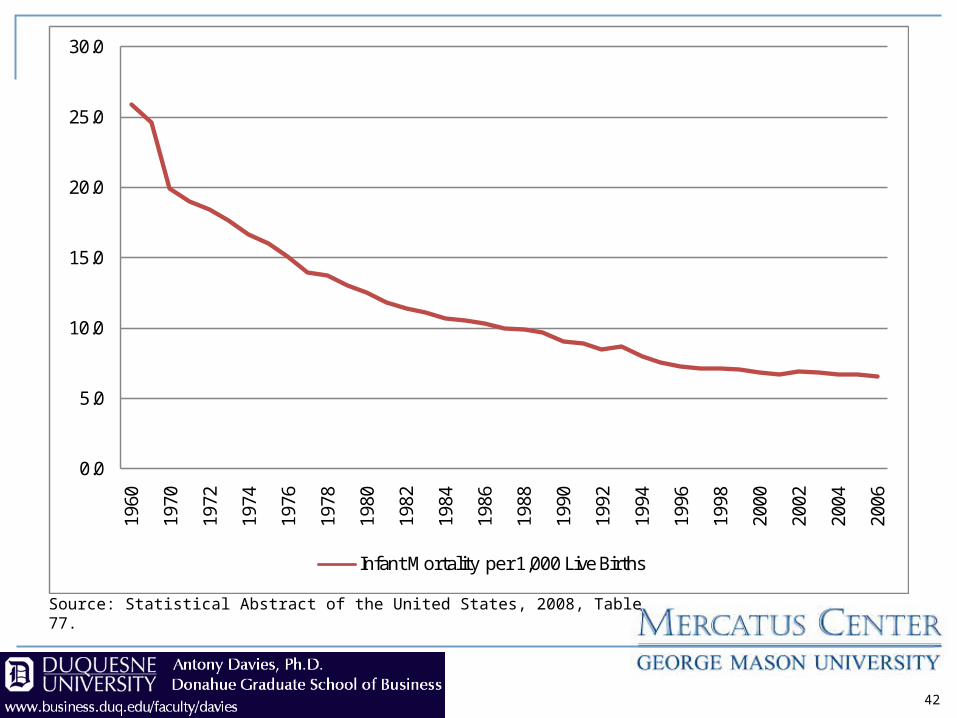
0.0
5.0
10.0
15.0
20.0
25.0
30.0
1960
1970
1972
1974
1976
1978
1980
1982
1984
1986
1988
1990
1992
1994
1996
1998
2000
2002
2004
2006
Infant Mortality per 1,000 Live Births
42
Source: Statistical Abstract of the United States, 2008, Table 77.
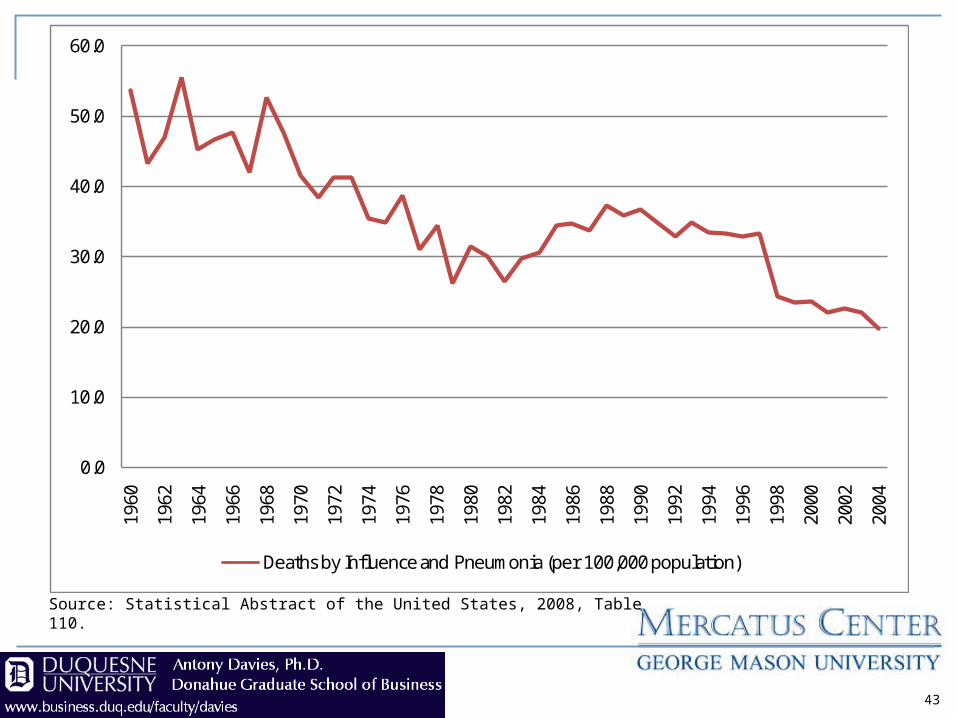
0.0
10.0
20.0
30.0
40.0
50.0
60.0
1960
1962
1964
1966
1968
1970
1972
1974
1976
1978
1980
1982
1984
1986
1988
1990
1992
1994
1996
1998
2000
2002
2004
Deaths by Influence and Pneumonia (per 100,000 population)
43
Source: Statistical Abstract of the United States, 2008, Table 110.
How does one measure the quality of health care?
1. What is “quality?”
2. How do we account for health care that has become routine but didn’t exist in the past (e.g., pre-natal care)?
3. How do we weigh qualities across different types of care (e.g., dental, catastrophic, preventative)?
44

How does one measure the quality of health care?
An easy measure of the effectiveness of health care is the mortality rate.
Some health care may have little or no impact on the mortality rate (e.g., orthodonture).
But, it is not unreasonable to assume that the quality of other types of health care grow at the same rate as types of health care that directly contribute to reductions in the mortality rate.
45

1.5
1.7
1.9
2.1
2.3
2.5
2.7
2.9
1960
1970
1972
1974
1976
1978
1980
1982
1984
1986
1988
1990
1992
1994
1996
1998
2000
2002
2004
2006
Mill
ions
Actual Deaths in the Current Year Deaths at the 1960 Mortality Rate
46
Source: Derived from Statistical Abstract of the United States, and the Bureau of Economic Analysis.
Measuring quality of health care is difficult. We can use changes in the mortality rate as a proxy for changes in the quality of health care.

0.0%1.0%2.0%3.0%4.0%5.0%6.0%7.0%8.0%9.0%
10.0%
1974
1976
1978
1980
1982
1984
1986
1988
1990
1992
1994
1996
1998
2000
2002
2004
2006
Health Care Share of GDP per 100,000 Lives Saved vs. 1960
47
Source: Derived from Statistical Abstract of the United States, and the Bureau of Economic Analysis.
In 1974, it was necessary to spend more than 9% of GDP on health care to reduce mortality by the equivalent of 100,000 lives (versus the mortality rate for 1960).
By 2006, spending less than 4% of GDP on health care reduced mortality by the equivalent of 100,000 lives (versus the mortality rate for 1960).
0%
2%
4%
6%
8%
10%
12%
14%
16%
18%
1987
1988
1989
1990
1991
1992
1993
1994
1995
1996
1997
1998
1999
2000
2001
2002
2003
2004
2005
2006
2007
48
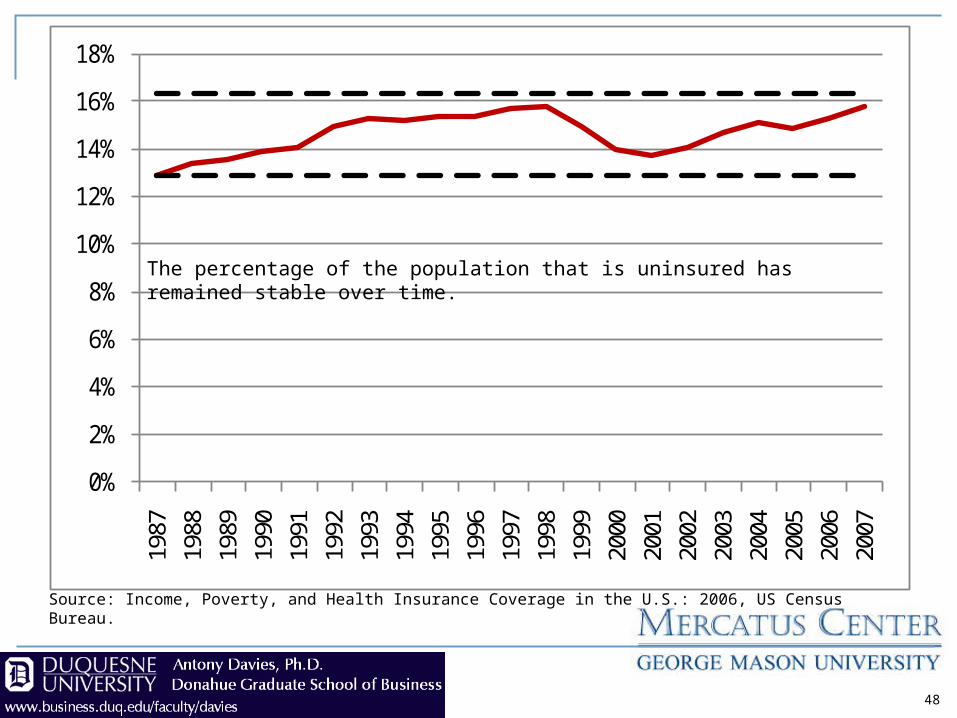
Source: Income, Poverty, and Health Insurance Coverage in the U.S.: 2006, US Census Bureau.
The percentage of the population that is uninsured has remained stable over time.
0.0%
5.0%
10.0%
15.0%
20.0%
25.0%
30.0%
35.0%
1999 2000 2001 2002 2003 2004 2005 2006
Under 18 18 to 24 25 to 34 35 to 44 45 to 54 55 to 64
49
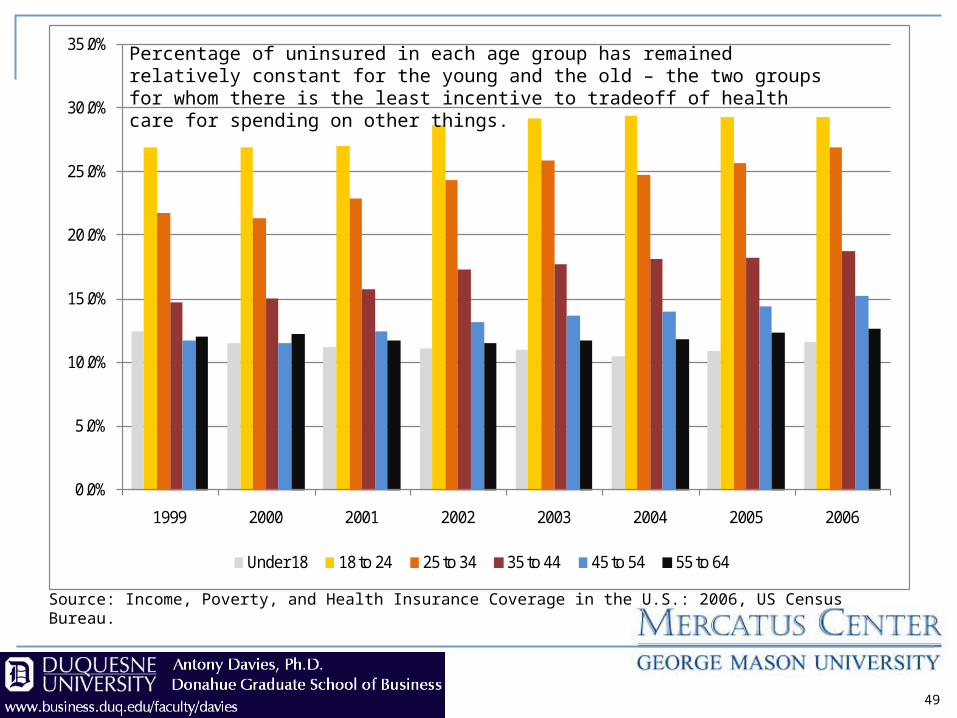
Source: Income, Poverty, and Health Insurance Coverage in the U.S.: 2006, US Census Bureau.
Percentage of uninsured in each age group has remained relatively constant for the young and the old – the two groups for whom there is the least incentive to tradeoff of health care for spending on other things.

-2%
-1%
0%
1%
2%
3%
4%
5%
6%
Under 18 18 to 24 25 to 34 35 to 44 45 to 54 55 to 64
Change in % of Uninsured 1999 to 2006
50
Source: Income, Poverty, and Health Insurance Coverage in the U.S.: 2006, US Census Bureau.
Pattern of uninsured is commensurate with the hypothesis that, as the price of health care rises, the more healthy willingly choose not to be insured.
51
The Games Economists Play: Interactive Public Policy
Pennsylvania Capital CampusMarch 19, 2008
copies of this presentation can be found atwww.business.duq.edu/faculty/davies