Embed Size (px)
Citation preview

Megatrends creating opportunities and challenges over the coming twenty years
The Future of Tourism in QueenslandStefan Hajkowicz, Hannah Cook and Naomi Boughen
CSIRO FUTURESwww.csiro.au

CITATION
Hajkowicz SA, Cook H, Boughen N (2013) The Future of Tourism in Queensland. Megatrends creating opportunities and challenges over the coming twenty years. CSIRO, Australia.
CSIRO Publication Identifier: EP134277
FOR FURTHER INFORMATION
For further information on this report please contact the project lead scientist Dr Stefan Hajkowicz. E [email protected] P 07 3833 5540
ABOUT THIS REPORT
This report has been prepared by CSIRO in consultation with the Department of Tourism, Major Events, Small Business and the Commonwealth Games under a contract arrangement.
COPYRIGHT
© 2013 Commonwealth Scientific and Industrial Research Organisation and the Queensland Government. All rights are reserved and to the extent permitted by the Copyright Act 1968, no part of this publication covered by copyright may be transmitted, reproduced or copied in any form or by any means without prior written permission of the owners of this publication.
IMPORTANT DISCLAIMER
CSIRO advises that the information contained in this publication comprises general statements based on scientific research. The reader is advised and needs to be aware that such information may be incomplete or unable to be used in any specific situation. No reliance or actions must therefore be made on that information without seeking prior expert professional, scientific and technical advice. To the extent permitted by law, CSIRO (including its employees and consultants) excludes all liability to any person for any consequences, including but not limited to all losses, damages, costs, expenses and any other compensation, arising directly or indirectly from using this publication (in part or in whole) and any information or material contained in it.
ACKNOWLEDGEMENTS
This research is being funded by the Queensland Government. The research team expresses gratitude to the many government, community and industry stakeholders and experts who have shared their wisdom about the Queensland Tourism sector at interviews and workshops across the State.
Cover Image: istockphoto Location: Sunshine Coast, Queensland Australia

Imag
e co
urt
esy
of
Fair
fax
Pho
tos
The purpose of this report is to identify and describe important trends impacting Queensland’s tourism sector over the coming twenty years. This will help inform the development of a long term tourism plan.
Over the next decade tourist visitation and expenditure in Queensland is expected to rise. In 2012 total visitor expenditure in Queensland was $21.5 billion. This represents an 8 percent increase from the previous year (TEQ, 2013c). Forecasts for the ten year period from 2013-14 to 2021-22 show increases in domestic visitor nights from 79 million per year to 83 million per year. International visitor nights are forecast to increase from 44 million per year to 62 million over the same time period (Tourism Forecasting Committee, 2012).
The Queensland Government has identified tourism as one of four pillars supporting the future development of the State’s economy. The other three pillars are agriculture, resources and construction. Within the tourism pillar
Executive Summary
the Queensland Government (2012) aims to increase annual overnight visitor expenditure to $30 billion by the year 2020. To achieve this target the tourism sector will need to continue to innovate. It will need to harness new opportunities and manage new risks. This will require imaginative thinking and evidence-based choices.
This report explores possible opportunities and challenges for tourism in Queensland. The narrative of the future is built upon trends and megatrends. A trend is a pattern of social, economic, environmental, political or technological activity playing out over the next twenty years and is relevant to the tourism sector. A megatrend occurs at the intersection of multiple trends. Megatrends represent particularly important and far-reaching events that will substantially impact the tourism sector in Queensland. The megatrends are shown in an interlinked Venn diagram (Figure 1).

1. The Orient Express – The world economy will significantly change over coming decades. Rapid income growth within emerging economies will create new markets and new sources of competition. Major growth opportunities are associated with attracting new tourists from the developing Asia region and ensuring Queensland is a differentiated and aspirational destination for domestic and international travellers.
Digital Whispers Bolts from the Blue
A Natural AdvantageThe Lucky Country
On the Move Great Expectations
The Orient Express
Figure 1. Megatrends impacting tourism in Queensland over the next twenty years
2. A Natural Advantage – Global biodiversity and natural habitats are disappearing at alarming rates. Those areas of remaining pristine natural habitats are of increasing value. As the world’s population grows and becomes increasingly urbanised, tourists will be drawn to nature-based experiences. Queensland’s natural assets will become an increasingly important drawcard for locals and visitors alike.
3. Great Expectations – As incomes grow, people shift their discretionary expenditure towards experiences as opposed to products. The experiences future tourists will seek will be ‘authentic’ to the destination and its people, personalised and often involve social interaction and emotional connection.
4. Bolts from the Blue – Sudden and hard to predict events such as extreme weather and infectious disease outbreaks have greater likelihood in a world with a changed climate, antimicrobial drug resistance and increased human mobility. When combined with the growing importance of safety perceptions, these events will have both positive and negative impacts on Queensland tourism expenditure depending on where they occur in the world and the perceptions potential travellers have regarding their impacts.
5. Digital Whispers – In the digital age, models of human communication and decision making are changing over time. Information flows much more rapidly and via widely distributed channels. The perceived credibility of information sources is also changing. The online world has created new risks and opportunities for the tourism sector.
6. On the Move – People are becoming increasingly mobile. While leisure remains a strong motivator for travel, people are travelling further and more frequently for many reasons such as trade, business, events, conferences, education and healthcare. Technological advances in the transport sector, particularly aviation, will enable the continued rise in mobility as people are able to move greater distances, faster.
7. The Lucky Country – Queensland and Australia have travelled through the financial turbulence of the last decade exceptionally well compared to many other wealthy countries. Australia and Queensland are expensive destinations. Local tourism operators face higher costs than many overseas competitors.
4 The Future of Tourism in Queensland

However, the high price tag may also come with the perception of boutique and exotic status.
Based on these megatrends, this report identifies two potential “game changers” for the Queensland tourism industry that create the greatest potential for growth. They are:
1. Attracting Queensland and Australian residents to holiday in Queensland as opposed to overseas destinations.
2. Attracting the large and rapidly growing and developing Asia market.
There are other opportunities for growth. However, these two opportunities are stand outs. They are central themes revisited throughout this report. They are touched upon throughout the megatrends and the discussion about Queensland’s unique value proposition.
From the convergence of the megatrends this study identifies five defining characteristics of Queensland’s unique value proposition for domestic and international tourist markets. Capitalising on these characteristics can help Queensland’s tourism sector differentiate its product and capture increased market share. They include:
• Safe and secure - Whilst able to deliver adrenaline and excitement fuelled holidays for the adventure seeking traveller, Queensland is a politically and socially stable destination on the world map.
• Clean – On the global stage, Queensland has high levels of food, water and general hygiene standards and excellent healthcare services.
• Green (breathtakingly so) –Queensland’s beautiful beaches, rainforests, deserts and “great-outdoors” can deliver world class nature experiences.
• Friendly and authentic – People will have greater expectations for authentic experiences and a critical and increasingly important component of that experience is social interaction with other people and local cultures.
• Worth it – The main differentiation for Queensland will be on the quality of visitor experiences. If the expectations are met tourists are more likely to pay a price premium and travel longer distances.
This foresight study will support the 20 year strategic planning process for tourism by the Queensland Government.
From the convergence of the megatrends this study identifies five defining characteristics of Queensland’s unique value proposition for domestic and international tourist markets.
5

Imag
e co
urt
esy
of
Fair
fax
Pho
tos
6 The Future of Tourism in Queensland

Contents
Executive summary 3 1 Introduction 9
2 Tourism Sector Profile 10 2.1 Economic Contribution 10
2.2 Visitor Forecasts 10
2.3 Global Tourism 11
3 Megatrends 12 3.1 The Orient Express 12
3.2 A Natural Advantage 18
3.3 Great Expectations 21
3.4 Bolts from the Blue 25
3.5 Digital Whispers 28
3.6 On The Move 32
3.7 The Lucky Country 40
4 Our Methods 47 4.1 Types of Futures 47
4.2 Process for Identifying Megatrends 48
4.3 Interviews with Experts 49
4.4 Consultative Workshop 50
5 Conclusion 51 References 52
7
List of figures
Figure 1. Megatrends impacting tourism in Queensland over the next twenty years 4
Figure 2. Forecast growth in domestic and international visitor nights in Queensland to 2021-22 10
Figure 3. International tourist arrivals worldwide, 1995 to 2011 13
Figure 4. The shifting centre of gravity of the world economy from 1980 to 2030, by a weighted GDP measurement 13
Figure 5. China’s disposable income per capita, 2000-01 to 2011-12 14
Figure 6. Actual capital investment in travel and tourism, 2012 and 2023, by country 14
Figure 7. Forecast percentage growth in capital investment in travel and tourism, 2012 to 2023, by country 15
Figure 8. Forecast percentage growth in international tourist arrivals from 2013 to 2023 15
Figure 9. International arrivals into Australia by source country, 2005 to 2012 16
Figure 10. Destinations for Australian tourists travelling internationally, 2006 and 2011 17
Figure 11. Percentage of population living in urban areas, actual and forecast, 1950 to 2050, by country 19
Figure 12. Material consumption (LHS) and income growth (RHS) 23
Figure 13. Accommodation used by overnight domestic visitors to Queensland, 2012 24
Figure 14. Selected online activities undertaken by persons 18+ years via mobile phone handsets 29
Figure 15. Internet use for tourism-related bookings, 2006 to 2010 30
Figure 16. Imports and exports of goods from Australia, trend estimates, 1971 to 2012 34
Figure 17. Number of student visa applications granted in Australia, 2003-04 to 2010-11 35
Figure 18. Passenger arrivals at Brisbane airport, 2000-01 to 2011-12 36
Figure 19. Jet fuel costs as a proportion of total global aviation industry costs, 2003 to 2012 36
Figure 20. Monthly domestic airfare index (best discounted fare) in Australia, 1992 to 2013 37
Figure 21. Australia’s strong economic performance, 2001 to 2011 (GDP growth, unemployment, central government debt to GDP ratio, US dollar exchange rate) 41
Figure 22. Quarterly index of prices paid by Australians for domestic versus international holiday travel and accommodation, 2008 to 2013 42
Figure 23. Short term departures of Australian residents to overseas destinations 43
Figure 24. Average weekly earnings (salaries) for Queensland workers and the average cost of a hotel room night, 1998 to 2012 44
Figure 25. Average hourly wage of a waiter (in 2013 AUD) in selected tourist destinations 45
Figure 26. Cost of a Big Mac in selected countries, 2004 to 2013 45
Figure 27. The futures cone 47
Figure 28. Stages of the foresight study 48
Figure 29. Stakeholder distribution for interviews 49
8 The Future of Tourism in Queensland

1 Introduction
This report presents the findings of a foresight study into the future of the Queensland tourism sector. The study was conducted by CSIRO Futures for the Queensland Government. Foresight is the art and science of exploring possible future events to inform contemporary decision making and strategy formulation. Foresight provides an information base from which informed choices can be made. The time frame for this analysis is 20 years. However, aspects of trends identified in this report are already occurring and many will continue to have impact beyond this time period.
The results of the foresight study are presented through seven megatrends. Megatrends are important patterns of change occurring over the next two decades and create both risks and opportunities. They relate to social, economic, environmental, technological and political drivers. The megatrends give rise to two key growth opportunities and five unique value propositions for Queensland. Collectively the value propositions describe how Queensland Tourism can differentiate, and compete, in a global industry.
Throughout the report the focus is on growth opportunities. At 52 percent of the State’s total overnight tourism revenue, and 82 percent of the total including day trips (TEQ, 2013b), the domestic market will remain the foundation of Queensland’s Tourism sector over the next twenty years. Continuing to supply and expand the well established and longstanding domestic market will be crucial for the tourism sector. However, the major external disruptors or “game changers” that create opportunities for new growth are connected to Queensland’s ability to compete with international destinations and capture a share of new high growth international markets. They are:
1. Attracting domestic travelers to holiday in Queensland as opposed to overseas destinations. The emergence of low cost air carriers, the development of tourist infrastructure in emerging economies and the changing cost differential between a domestic and international holiday are attracting Australian tourists to travel abroad in record numbers. During calendar year 2012 there were approximately 8.2 million short term departures of Australian residents to overseas locations including 623,000 to Thailand, 333,000 to Fiji and 912,000 to Indonesia (ABS, 2013e). Many of these people would have been tourists who could have holidayed in Queensland. Attracting local residents back to local destinations, rather than overseas rivals, can significantly grow Queensland’s tourism revenue.
2. Attracting the large and rapidly growing and developing Asia market. As over one billion people in Asia cross the income threshold up into the middle classes in the coming decade, a large new tourist market is created. China and other countries in the developing Asia region are amongst the world’s most rapidly growing tourist generators. Already these countries have become important for Queensland and their importance is likely to grow in coming decades. However, Queensland is not the only destination competing for these new high growth markets. Tourist attractions across the world are moving quickly to capture this new market. The challenge is to understand, and deliver, upon the experiences sought by the new tourists.
Section 2 of this report provides data on the economic size and structure of the tourism sector. It also describes the likely growth in visitor numbers and the global tourism sector. Section 3 describes the seven megatrends. At the end of each megatrend the implications for Queensland’s tourism sector are summarised. Section 4 provides a description of the research methods, data sources, interviews and consultative workshops. The concluding section looks at the areas of overlap between the megatrends and identifies attributes potentially important for a tourism strategy. Five unique value propositions for the Queensland tourism sector are identified in the conclusion.
This study aims to describe possible futures but does not prescribe any actions nor does it make policy recommendations. These decisions will be made by others within industry, government and community organisations. The foresight study aims to equip decision makers with information and ideas about possible social, economic, environmental, political and technological changes.
9

2 Tourism Sector Profile
Tourism is a diverse sector of the Queensland economy capturing many businesses, government and community organisations. The tourist experience is the combined product of these many different groups. Tourism and Events Queensland identifies nine subsectors of the overall tourism sector. These include (TQ, n.d.):
◆ Accommodation (e.g. Bed and breakfast, hotels, resorts)
◆ Attractions (e.g. Art galleries, theme parks, museums)
◆ Distribution (e.g. Retail travel agents, visitor information centres, tour desks)
◆ Food and drink (e.g. Restaurants, bars, cafes)
◆ Retail services (e.g. Souvenir stores, boutiques, art and craft stores)
◆ Planners and coordinators (e.g. Conferences, conventions, exhibitions)
◆ Tour operators (e.g. Day cruises, day tours, tour guides)
◆ Tourism support organisations (e.g. Industry associations, local governments agencies, regional tourist organisations)
◆ Transportation (e.g. Car rentals, trains, airlines)
2.1 Economic Contribution
Queensland’s tourism sector directly contributed approximately $10.6 billion to the Queensland economy in 2011-12, equivalent to 3.7 percent of Gross State Product. In the year ended June 2012 tourism exports were $5.7 billion making it the state’s second largest export behind coal (OESR, 2013; TRA, 2013b).
The size of Queensland’s tourism sector represents one quarter of the national tourism industry (TRA, 2013b). In 2011-12, Queensland’s tourism sector made the second largest contribution to total direct tourism Gross Value Added for Australia ($9.6 billion; 26 percent), behind New South Wales ($11.6 billion; 31 percent) (TRA, 2013b).
In 2011-12, the Queensland tourism sector directly accounted for 136,000 jobs or 5.9 percent of total Queensland employment, substantially more than the mining sector (66,300 direct jobs) and agriculture, forestry and fishing (77,700 direct jobs) (ABS, 2013d; TRA, 2013b). Tourism employment spiked in 2007-08 but has since remained reasonably constant at around 124,000 jobs (TEQ, 2013a).
The tourism sector is characterised by a large number of small businesses. Ninety percent of tourism businesses employ less than 20 persons (TEQ, 2013a). As at June 2011, Queensland had 55,700 tourism related businesses, equivalent to 12.9 percent of all registered businesses in the state (ABS, 2012a; TRA, 2012a).
2.2 Visitor Forecasts
Domestic visitors account for the majority of all visitors to Queensland. Over the next 10 years, total domestic visitor nights are forecast to grow at an average annual growth rate of 0.8 percent to reach 83 million visitors nights in 2021-22 while total international visitor nights are forecast to grow at 4.2 percent to 62 million visitor nights (Figure 2). Although international visitor nights are expected to grow more rapidly, domestic visitor nights are expected to still account for more than half (57 percent) of total visitor nights in Queensland in 2021-22 (Tourism Forecasting Committee, 2012).
Strong income growth in developing economies such as China and India is expected to drive the increase in international visitors. The increase in Chinese visitors is expected to account for one-third of the growth in Australia’s tourism export earnings to 2020 (RBA, 2011). The majority of total growth in Queensland is expected to take place in regional Queensland as opposed to the Brisbane and Gold Coast areas (TQ, 2012b).
10 The Future of Tourism in Queensland

Australia’s and Queensland’s domestic tourism markets are not without challenges. While Australian households typically spend around 3.25 percent of total consumption on domestic overnight holiday travel, Australians are increasingly favouring holidays abroad rather than domestic holidays (RBA, 2011).
This is largely attributable to changes in the relative prices of domestic and overseas travel and a rise in household income (RBA, 2011; TRA, 2013c). Spending by Australians on overseas travel has increased at an average annual rate of 7.5 percent over the 10 years preceding 2009-10 (RBA, 2011). Short haul destinations such as Indonesia, Thailand and Fiji are directly competing with Australia’s beach holidays destinations, especially those in Queensland (RBA, 2011; TRA, 2013c).
2.3 Global Tourism
Although there are a number of challenges facing the tourism sector, globally it has fared better than most industries throughout the fragile economic conditions of recent years. Worldwide, international tourist arrivals grew by 4.8 percent from 955 million in 2010 to 1.001 billion in 2011 (World Bank, 2013a). Europe still accounts for over half of all global international visitor arrivals although Asia and the Pacific experienced growth rates in visitor arrivals similar to that of Europe (UNWTO, 2012).
New emerging destinations are beginning to challenge these traditional destinations. International tourism receipts reached a record US$1,030 billion in 2011, showing real growth of 3.9 percent from 2010 (UNWTO, 2012). Much of the growth in spending has been from tourists from developing countries such as Brazil, China and Indonesia (WEF, 2013b).
Given the economic resilience demonstrated by the sector and the contribution it makes to job creation, economic development and economic growth (UNWTO, 2012), the tourism sector is likely to be of increasing importance to the economic futures of the Queensland, Australian and global economies.
0
10,000
20,000
30,000
40,000
50,000
60,000
70,000
80,000
90,000
2011
-12
2012
-13
2013
-14
2014
-15
2015
-16
2016
-17
2017
-18
2018
-19
2019
-20
2020
-21
2021
-22
Tota
l vis
ito
r n
igh
ts (
'000
)
Total Domestic
Total International
Figure 2. Forecast growth in domestic and international visitor nights in Queensland to 2021-22 Data source: Tourism and Events Queensland (TQ, 2012b)
11

3.1 The Orient Express
The Orient Express train travelled in a southeast direction from Paris to Istanbul. This is analogous to the continued geographic repositioning of the world economy over the coming twenty years. The generation of wealth is shifting from west to east and from north to south. Over one billion people in the developing Asia region will cross the income threshold from poor to middle income. Queensland tourism has an opportunity to capture new markets and deliver experiences that match changing consumer needs. However, there will also be tougher competition as the tourism infrastructure in other world locations improves.
3 MegatrendsIm
age
cou
rtes
y o
f iS
tock
ph
oto
12 The Future of Tourism in Queensland

Tourism continues to grow internationally. International tourist arrivals worldwide grew by 4.8 percent from 955 million in 2010 to 1.001 billion in 2011 (Figure 3) (World Bank, 2013a). France continues to be the most popular tourist destination followed by the United States. However, China has continued to grow in popularity since 2003 and in 2011 attracted the third highest number of international tourist arrivals (World Bank, 2013a).
The shifting centre of gravity of the world economy. Once driven by Europe and the United States, the centre of the world economy is shifting eastwards, driven by rapid growth throughout Asia. An analysis of GDP at 700 locations finds the ‘Centre of Gravity’ of the world’s economy will shift from the mid Atlantic Ocean in 1980 to a location between India and China by 2030 (Figure 4) (Quah, 2011).
Developing countries are the standout for medium term growth. China and India are the exceptions to the fragile and uncertain economic conditions experienced by the majority of countries. China is expected to grow at rates of around 8 percent to 2017 and India at around 6 to 7 percent (IMF, 2012). Although these growth rates are down from the growth experienced in the early 2000’s, these economies are still demonstrating comparably strong growth. Given these forecasts, it is expected that in the short term, inbound Australian tourism demand will be driven by Asia and, by a lesser extent, North America as opposed to Europe (TRA, 2012a).
A growing middle-class. Coming decades will see over one billion people in Asia transition out of poverty and into the middle income bracket between US$6,000 and US$30,000 per year (Wilson et al., 2010). Disposable income in China has been growing steadily
20101980 2030
EUROPE
AFRICA
ASIA
AUSTRALIA
OCEANIA
0
200
400
600
800
1,000
1,200
1995
1996
1997
1998
1999
2000
2001
2002
2003
2004
2005
2006
2007
2008
2009
2010
2011
Inte
rnat
ion
al t
ou
rist
arr
ival
s (m
illio
ns)
Figure 3. International tourist arrivals worldwide, 1995 to 2011 Data source: The World Bank (2013a)
Figure 4. The shifting centre of gravity of the world economy from 1980 to 2030, by a weighted GDP measurement Data source: Quah (2011) from the journal Global Policy
13

and increased 14 percent from 2011 to 2012 (Figure 5) (NBSC, 2012). Given that disposable income and expenditure on travel and dining are directly correlated (OECD, 2012c), this transition will open up vast potential in the tourism market as the ‘new wealthy’ seek new experiences.
Cultural and entertainment tastes of Chinese tourists. A survey of Chinese tourists found that many seek cultural enrichment during their holidays:
◆ 67 percent of tourists prefer tourist sites with cultural aspects such as historical sites or cultural relics rather than only natural scenery;
◆ 53 percent aimed to incorporate a visit to a museum or art show or watch a sports games during their holiday; and
◆ 40 percent hope to improve their abilities through their experience at tourist activities (Yin, 2005).
New competition for Queensland – developing countries are investing heavily in tourism. Countries throughout the developing Asia region are investing in tourism and are becoming tougher competitors for Queensland. China is expected to make the largest increase in capital investment in tourism between 2012 and 2023 (Figure 6). Other countries substantially growing their investment include Thailand, Singapore, Mexico and Indonesia (Figure 7). The United States currently has the highest level of investment in travel and tourism (WTTC, 2013) however the forecast growth
in investment is not expected to be significant in comparison to the forecast growth in other countries. Australia’s forecast investment growth is low and roughly equal to that of other developed economies. Investments in tourism infrastructure are translating to visitor
0
5,000
10,000
15,000
20,000
25,000
2000
-01
2001
-02
2002
-03
2003
-04
2004
-05
2005
-06
2006
-07
2007
-08
2008
-09
2009
-10
2010
-11
2011
-12
Dis
po
sab
le in
com
e (y
uan
)
0
50
100
150
200
250
300
Chin
a
Thai
lan
d
Braz
il
Ind
on
esia
Sin
gap
ore
Mex
ico
Can
ada
Un
ited
Sta
tes
New
Zea
lan
d
Ho
ng
Ko
ng
Ger
man
y
Un
ited
Kin
gdo
m
Au
stra
lia
Fran
ce
$AU
D b
illio
ns
2012
2023
Figure 5. China’s disposable income per capita, 2000-01 to 2011-12 Data source: National Bureau of Statistics of China (NBSC, 2012)
Figure 6. Actual capital investment in travel and tourism, 2012 and 2023, by country Data source: World Travel and Tourism Council (WTTC, 2013); Reserve Bank of Australia (RBA, 2013)
numbers. China has continued to grow in popularity since 2003 and in 2011 attracted the third highest number of international tourist arrivals worldwide (World Bank, 2013a).
14 The Future of Tourism in Queensland

Emerging economies expected to experience faster growth in tourist arrivals. In 2012, 51 percent of arrivals were into Europe, 23 percent to Asia and the Pacific, 16 percent to the Americas, 5 percent to Africa and 5 percent to the Middle East (Kester, 2013). However, international tourist arrivals in emerging economies have been growing faster than arrivals in advanced economies (UNWTO, 2012). For example, from 2005 to 2011, the annual average growth rate in international tourist arrivals was 2.3 percent in Europe and 2.1 percent in North America compared to 5.8 percent in South America, 8 percent in South-East Asia and 6.3 percent in Africa (UNWTO, 2012). Over the period from 2013 to 2023, international tourist arrivals into emerging economies such as Brazil, China, Thailand and Hong Kong are forecast to grow at a higher rate than that for developed economies such as the United States, the United Kingdom, and Australia (Figure 8). By 2030, it is forecast that destinations in today’s emerging economies will account for 57 percent of international tourist arrivals compared to 47 percent in 2011 (UNWTO, 2012).
0
20
40
60
80
100
120
140
160
180
Chin
a
Thai
lan
d
Braz
il
Ind
on
esia
Sin
gap
ore
Mex
ico
Can
ada
Un
ited
Sta
tes
New
Zea
lan
d
Ho
ng
Ko
ng
Ger
man
y
Un
ited
Kin
gdo
m
Au
stra
lia
Fran
ce
Perc
enta
ge g
row
th
-
20
40
60
80
100
120
Braz
il
Thai
lan
d
Chin
a
Ho
ng
Ko
ng
Un
ited
Sta
tes
New
Zea
lan
d
Ind
on
esia
Un
ited
Kin
gdo
m
Au
stra
lia
Sin
gap
ore
Mex
ico
Can
ada
Ger
man
y
Fran
ce
Gro
wth
in in
tern
atio
nal
arr
ival
s (%
)
Figure 7. Forecast percentage growth in capital investment in travel and tourism, 2012 to 2023, by country Data source: World Travel and Tourism Council (WTTC, 2013)
Countries throughout the developing Asia region are investing in tourism and are becoming tougher competitors for Queensland.
Figure 8. Forecast percentage growth in international tourist arrivals from 2013 to 2023 Data source: World Travel and Tourism Council (WTTC, 2013)
15

Rapid growth in world youth travel. Concurrent to income growth in the developing world youth travel is experiencing rapid growth. The youth travel market accounts for approximately 20 percent of worldwide international tourist arrivals (UNWTO, 2008). From 2002 to 2007, the average number of trips taken by young people (defined as people under 30 years old) increased from 6.2 to 7.3 (UNWTO, 2008). The youth traveller market makes up approximately 26 percent of Australia’s inbound tourists (Woodbridge, 2011). For the young person, travel has become an essential part of their life, rather than a brief escape from the daily routine (UNWTO, 2011). An important consideration for the youth traveller is the amount of domestic travel undertaken. It is possible that if young people do not develop the habit of domestic travel when they are young, they will potentially not travel domestically in the long-term (TRA, 2008).
The youth traveller – more mobile, more wealthy. Although the size of the global youth population is not expected to grow considerably, the number of youth travellers is expected to grow as disposable incomes increase and travel becomes more affordable (Richards, 2011). The growth in youth travel has been driven by rising living standards and the growth in first-time travellers from developing countries (UNWTO, 2011). These first-time youth travellers are typically more affluent compared to other travellers and the total average travel expenditure by the youth traveller has increased by 39 percent between 2002 and 2007 (UNWTO, 2008, 2011). In 2011 it was estimated that the global youth travel industry represents 190 million international trips per year, a figure expected to rise to 300 million by 2020 (UNWTO, 2011).
Australia’s share of world tourism. The number of international visitor arrivals to Australia grew by 4.7 percent between 2011 and 2012 (TRA, 2013a). However, Australia’s proportion of total international arrivals worldwide has been gradually declining from 0.7 percent of world share in 1995 to 0.6 percent of world share in 2011.
Where are Australia’s tourists coming from? Just over half (53 percent) of Australia’s international tourists in 2012 came from 5 countries including New Zealand (19 percent), China (11 percent), United Kingdom (10 percent), United States of America (8 percent) and Japan (6 percent) (TRA, 2013a). While the source countries for the majority of Australia’s tourists have not changed in recent years, there has been some variation within this group (Figure 9). From 2009, the number of visitors from China has risen from 351,000 to 592,000 (increase of 69 percent). The number of visitors from Japan has been steadily declining since 2005, as have visitors from the United Kingdom since 2006. New Zealand continues to be the source of the highest number of international arrivals into Australia. Some of these movements are likely to be reflective of global and country-specific economic conditions.
Where are Australian international tourists going? New Zealand continues to be the most popular destination for Australian overseas bound tourists (Figure 10). However, New Zealand’s share of total Australian outbound tourists has fallen from 18 percent in 2006 to 14 percent in 2011 (TRA, 2013c). The number of Australian visitors to Indonesia has grown significantly during the years 2006 to 2011 and now accounts for 11 percent of Australian overseas tourists (TRA, 2013c). Australian visitor numbers to Thailand, USA and Canada have also grown significantly.
Figure 9. International arrivals into Australia by source country, 2005 to 2012 Data source: Tourism Research Australia (TRA, 2013a)
0
200
400
600
800
1,000
1,200
2005 2006 2007 2008 2009 2010 2011 2012
Arr
ival
s ('0
00)
New Zealand China United Kingdom USA Japan
16 The Future of Tourism in Queensland

0
100
200
300
400
500
600
700
800
900
1,000
New
Zea
lan
d
Oth
er c
ou
ntr
ies
Oth
er A
sia
USA
& C
anad
a
Oth
er E
uro
pe
Un
ited
Kin
gdo
m
Thai
lan
d
Chin
a
Sin
gap
ore
Ho
ng
Ko
ng
Ind
on
esia
Mal
aysi
a
Nu
mb
er o
f A
ust
ralia
n v
isit
ors
('0
00) 2006 2011
Figure 10. Destinations for Australian tourists travelling internationally, 2006 and 2011 Data source: Tourism Research Australia (TRA, 2013c)
The implications for tourism in Queensland
This megatrend identifies a new and rapidly expanding growth market for Queensland tourism within the developing Asia region. As over one billion people cross into the middle income bracket, new markets will emerge. At the same time, however, competition will intensify. The wealth generated by Asian countries will be reinvested back into their economies and tourism sectors. This will make overseas countries increasingly attractive to the international traveller. The challenge for the Queensland tourism sector is to identify the niche markets where it has comparative advantage and achieve product differentiation from competitors.
Imag
e co
urt
esy
of
Tou
rism
an
d Ev
ents
Qu
een
slan
d
17

3.2 A Natural Advantage
The impacts of climate change are likely to put increasing pressure on nature. Biodiversity is forecast to decline. Some species of plant and animal are already under threat. As species, habitats and the environment come under threat, nature is likely to become a bigger drawcard for tourists. Australia already has established nature-based tourism operations. Indeed, Queensland itself is well endowed with natural assets. These natural attractions have remained popular for tourists and it is likely that these natural assets will become increasingly valuable tourist attractions in the future.
Imag
e co
urt
esy
of
Tou
rism
an
d Ev
ents
Qu
een
slan
d
18 The Future of Tourism in Queensland
Biodiversity decline. There are indications that the three main components of biodiversity - genes, species and ecosystems - are all continuing to show signs of decline. The five principal pressures affecting this rate of decline - habitat damage, overexploitation, pollution, invasive alien species and climate change- are remaining constant or increasing in intensity (Secretariat of the Convention on Biological Diversity, 2010). This is despite an international commitment made during the 2002 Convention on Biological Diversity to achieve a significant reduction in the rate of biodiversity loss by 2010 (Butchart et al., 2010). As more species become threatened or disappear what remains will be of greater value. The economic laws of supply and demand mean that as a good or service becomes more scarce the price goes up.
Impact of climate change on biodiversity. Climate change impacts have already been sufficient to threaten the survival of some species. Tropical coral reefs and amphibians have been the most negatively affected thus far (Parmesan, 2006; Secretariat of the Convention on Biological Diversity, 2010). Coral species are moving faster towards extinction than all other species groups (including birds, mammals and amphibians) (Secretariat of the Convention on Biological Diversity, 2010) while the Global Amphibian Assessment lists 427 amphibious species as ‘critically endangered’, 122 of which are ‘possibly extinct’ (Alan Pounds et al., 2006).
Queensland has world-class natural assets. Australia and Queensland are well endowed with natural assets compared to other countries. Australia has the highest number of World Heritage natural sites in the world (WEF, 2013b) and of these 18 sites, five are
found in Queensland including Fraser Island, Gondwana Rainforests, the Great Barrier Reef, Riversleigh fossil site and the Wet Tropics (DEHP, 2012). Queensland hosts the greatest levels of biodiversity in Australia, with 85 percent of the nation’s native mammals, 72 percent of its native birds, more than half of its native reptiles and frog species and thousands of native plant species (DEHP, 2012).
Queensland is maintaining a (relatively) healthy natural environment. Coastal areas have suffered from recent cyclones and sediment inflows due to flooding and the health of coastal ecosystems is variable across the State (DEHP, 2012). Queensland is widespread with wetlands and recent years have seen a decline in the rate of loss of this habitat (DEHP, 2012). While they are under threat, Queensland’s natural assets are actually doing well by comparison. Although it is still showing signs of decline and decreased resilience, the Great Barrier Reef is one of the healthiest and best-protected coral reef systems in the world (Secretariat of the Convention on Biological Diversity, 2010).
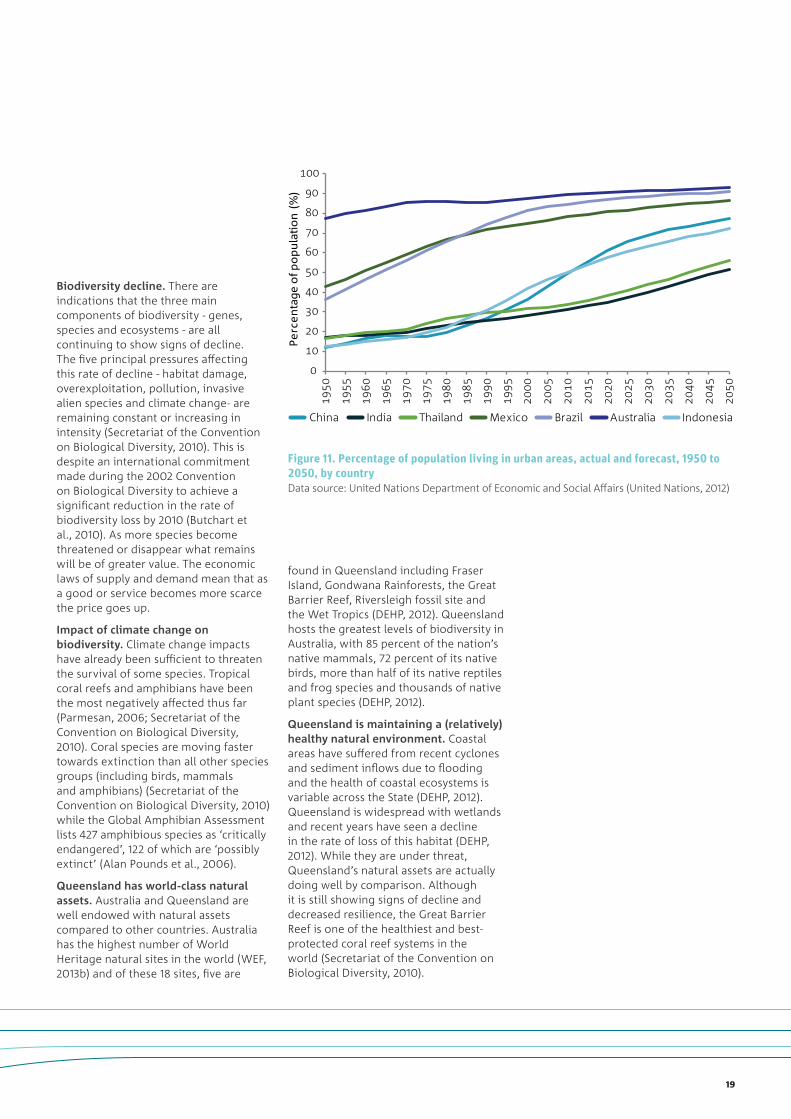
Figure 11. Percentage of population living in urban areas, actual and forecast, 1950 to 2050, by country Data source: United Nations Department of Economic and Social Affairs (United Nations, 2012)
0
10
20
30
40
50
60
70
80
90
100
1950
1955
1960
1965
1970
1975
1980
1985
1990
1995
2000
2005
2010
2015
2020
2025
2030
2035
2040
2045
2050
Perc
enta
ge o
f po
pu
lati
on
(%
)
China India Thailand Mexico Brazil Australia Indonesia
19

Nature is still Australia’s drawcard with tourists. A survey of 11 key international tourist markets found that 53 percent of tourists consider Australia’s beaches to be the most appealing attraction. This was followed by Australian wildlife (46 percent), the Great Barrier Reef (44 percent), rainforests/forests and national parks (42 percent) and unspoilt natural wilderness (40 percent) (TA, 2011). Hence nature-based attractions made up the top 5 most appealing attractions in Australia. It is likely that as biodiversity loss continues worldwide, the remaining assets will continue to draw tourists.
Increased urbanisation is likely to increase the desire for nature. It is not only biodiversity loss that is likely to increase the popularity of natural attractions. As the proportion of people living in urbanised societies increases, there is likely to be a greater preference for nature experiences and the outdoors. Those living in urbanised societies see contact with nature as a means of restoration from stress and fatigue and associate it with improved health and well-being (van ben Berg et al., 2007). Approximately 52 percent of the world’s population was living in urban areas in 2011 (United Nations, 2012). Many of Australia’s main tourist source countries have undergone recent growth in urbanisation and the urbanised population is forecast to continue to grow (Figure 11) (United Nations, 2012). As a greater proportion of the population live in urban areas, there may be a greater desire for nature experiences in the future.
Income and nature experiences. Although it is difficult to categorise tourists into separate homogenous groups, it is generally believed that those tourists motivated to travel for nature experiences do share similar characteristics. These shared characteristics include an interest in nature, more frequent travel habits, a willingness to travel longer distances, high levels of education, high levels of individual and household income and a willingness to spend more (Mehmetoglu, 2007).
Australians prefer Australian beaches. A recent study by Tourism Australia (TA, 2013) revealed that 60 percent of Australians rate Australia’s beach destinations as better than those in Bali, Fiji and Thailand. Given the choice between a domestic and overseas beach holiday, 35 percent would be more likely to take a beach holiday in Australia compared to 24 percent more likely to go overseas (TA, 2013). Young travellers without children form the majority of those preferring overseas beaches (TA, 2013). This shows that the appeal of Australia’s beaches is still strong for domestic visitors and not just international visitors.
Nature continues to be enjoyed by all ages. In the case of Australians, “to engage in nature-based activities” is not a strong principal motivation for taking a holiday (Oppewal et al., 2010). However, when examining the types of activities enjoyed when travelling, activities such as visiting the beach and nature based activities are still popular holiday pursuits (TRA, 2008). Beaches are most popular with Generation Y while nature based activities (including visiting National parks/State parks, bushwalking or rainforest walks, visiting botanical or other public gardens, going whale or dolphin watching and visiting farms) are more popular with older generations (TRA, 2008).
The implications for tourism in Queensland
Queensland is endowed with world class natural assets that will continue to attract tourists in greater numbers. The trends collated here show natural beauty and pristine wilderness will hold greater value to tourists of the future. Effective management and promotion of natural assets will help Queensland to fetch a price premium in global tourist markets.
Imag
e co
urt
esy
of
Tou
rism
an
d Ev
ents
Qu
een
slan
d
20 The Future of Tourism in Queensland

3.3 Great Expectations
As incomes and consumer choices expand in both Australia and the world, people’s expectations are also expanding and changing. Authenticity, personalisation and friendliness will all become increasingly important. People will also shift discretionary expenditure away from material products and towards higher level experiences. This megatrend explores the all-important experience factor for tomorrow’s tourist.
Imag
e co
urt
esy
of
Tou
rism
an
d Ev
ents
Qu
een
slan
d
21

Moving upwards through Maslow’s Hierarchy. First published in 1943 in a paper titled “A Theory of Human Motivation”, Maslow’s Hierarchy is a well established and widely cited concept in the social sciences (Maslow, 1943). In simple terms it tells us that people first meet their basic needs (food, water, shelter) and then go on to meet more advanced needs (social networks, self esteem). Social interaction is near the top of the hierarchy. In both the developed and developing world incomes will grow considerably over coming decades. In Asia over one billion people will transition out of poverty and into the middle income classes. These people will be in a position to look beyond the basic necessities of life in search for higher level services and experiences. It is likely that social and cultural interaction will be high on their agenda when they contemplate a Queensland holiday.
People consume less materials as they grow their incomes. Although the level of material consumption continues to grow, there are emerging signs of a relative decoupling of economic growth with material consumption (Figure 12) (OECD, 2011). Relative decoupling is a decline in material consumption relative to economic output and results from more efficient production systems and a preferential shift toward consuming experiences and services rather than physical goods. Examples of experiential purchases would include having a massage, going to the theatre or buying songs for a digital music player. These purchases involve a minimal transaction of physical material. The good being produced and consumed is intangible. Although there are tangible goods purchased during a holiday, tourism is largely about the experience. As incomes continue to grow, tourism may play an important role in satisfying people’s cravings for memorable experiences.
Tourism bounced back from the global financial downturn. As people place more importance on experiences rather than products, they are less likely to give up holidays, even in uncertain economic times. The OECD (2012a) found that 940 million people went on holidays worldwide in the year 2010 which represents a 7 percent increase on the previous year. This has economic significance because tourism pays for 5 percent of jobs and contributes around 6 percent of GDP in OECD countries (OECD, 2012a). The bounce-back has not been so strong for all areas of consumer spending, reflecting the relative value placed on tourism.
Young singles tend to spend more on holidays. A study of Australians found that one particular segment of the population was inclined to allocate an above average amount on overseas and domestic holidays while devoting a smaller than average proportion of their budget on reducing debt, financial investments, home renovations and improvements (Dolnicar et al., 2008). Approximately 16 percent of Australia’s population was estimated to fit in this segment and was characterised as single adults without children, living in large households with non-family members (possibly share accommodation) and who take holidays frequently (Dolnicar et al., 2008). The travel motivations of this segment include the desire for fun and entertainment, seeking a nature experience, wanting to have everything organised and seeking cultural offers and sights (Dolnicar et al., 2008).
An increasing desire for authentic experiences. The material needs of an increasing proportion of people across the globe are being satisfactorily met. This affluence has prompted consumers to direct an increasing proportion of expenditure towards goods and services that will improve their quality of life and enhance their sense of self (Yeoman et al., 2007). One of these goods is travel and tourism. Tourists are placing an increasing value on the ‘authentic’ experience. Although what actually constitutes ‘authentic’ is contested, the nature and quality of the experience is becoming more important (McCabe, 2009). Experiencing the untouched and unexposed are likely to be important elements of authenticity (Yeoman et al., 2007).
The tourist that doesn’t want to be a “tourist”. The anti-tourist attitudes of some travellers can be attributed to the desire to experience something authentic, the possibilities of this being inversely proportional to the number of tourists already visiting the area (Jacobsen, 2000). Thus tourism becomes a positional good where the value of the good decreases as more people consume it. Individuality and independence are underlying factors in their destination choices (Jacobsen, 2000). These travellers generally tend to take cultural experiences home with them rather than traditional souvenirs and their experiences abroad are likely to influence their tastes at home in eating habits and home decoration (Jacobsen, 2000).
Jam
es F
ish
er/T
ou
rism
Au
stra
lia C
op
yrig
ht
22 The Future of Tourism in Queensland

Personalised marketing to unique preferences. More and more, tourists are demanding comprehensive, personalised and up-to-date products and services to meet their own specific needs (Buhalis and Law, 2008). People are increasingly preferring itineraries that match their individual preferences and times schedules, leading to declining popularity of the traditional package tour over dynamic packaging models (Buhalis and Law, 2008). This has challenged traditional marketing strategies and created new approaches to targeting the consumer. Marketing and advertising is now being targeted directly to the consumer based on their unique preferences (Garcia et al., 2012).
Loneliness and single person households. Over the last twenty years the proportion of the population living alone has increased from 9 to 12 percent and is forecast to rise to 16 percent, or 3.1 million people, in another twenty years time (ABS, 2009a). This is associated with delayed partnering, divorce and declining fertility. The rise of the single person household and is likely to result in an increased proportion of disposable income able to be spent on affordable luxuries such as travel (TRA, 2008). In addition, as screen time continues to take up a greater proportion of total recreation time (ABS, 2008a), it is likely that greater value will be placed on the social interaction aspects of vacations. The friendliness of a tourist destination is therefore likely to be a key differentiator.
Friends and relatives are an important motivation for domestic visits. Just over one third (35 percent) of domestic overnight visitors in 2012 visited for the primary purpose of seeing friends or relatives (TRA, 2013c). Holidays were, however, the largest primary motivator for domestic overnight visits at 43 percent (TRA, 2013c). The most popular accommodation choice for overnight visitors was a friend’s or relative’s property (42 percent) (Figure 13), suggesting that even though visiting friends or relatives may not be the most significant motivator for a visit to Queensland, it plays an important part of the domestic visitors’ trip.
Visiting friends and relatives (VFR) is forecast to rise. Industry forecasts suggest the VFR category for domestic visitors will grow at the rate of 0.8 percent per year from 2011 to 2021. This compares to growth in holiday visitors of 0.3 percent per year and business visitors of 0.9 percent per year over the same time period. For international visitors, the VFR category is expected to grow at 3 percent per year which is equal to holiday visitors and slightly less than business visitors at 3.2 percent per year. By the year 2021, an additional 494,000 people will arrive from other countries and an additional 6.4 million from within Australia for the purposes of visiting friends and relatives (Tourism Forecasting Committee, 2012). Recent research finds that due to definitional
Figure 12. Material consumption (LHS) and income growth (RHS) Data source: Material consumption data from the Organisation for Economic Cooperation and Development (OECD, 2011) and GDP per capita data from The World Bank (2012).
$0
$5,000
$10,000
$15,000
$20,000
$25,000
$30,000
$35,000
16
17
18
19
20
21
1980 1990 2000 2008
Ave
rage
GD
P p
er c
apit
a fo
r G
8 co
un
trie
s (e
xclu
din
g Ru
ssia
) in
200
0 U
SD
Mat
eria
l co
nsu
mp
tio
n
(met
ric
ton
nes
per
cap
ita)
Domestic material consumptionIncome (GDP per capita)
As people place more importance on experiences rather than products, they are less likely to give up holidays, even in uncertain economic times.
issues, formal VFR in Australia is understated. A comprehensive definition estimates that VFR accounts for 48 percent of Australia’s total overnight tourist visitation (Backer, 2012).
Backpackers will continue to be important tourism revenue generators. Over the year ending September 2011, backpackers spent A$3,071 million in Australia which represents 17 percent of international tourist expenditure. Whilst their daily expenditure of A$74 is low compared to holidaymakers (A$111/day) and business travellers (A$186/day), their length of stay is much longer. On average, an international backpacker stays in Australia for 73 nights compared to holidaymakers at 18 nights and business travellers at 14 nights. In Queensland over the year ending 2011, backpackers stayed a total of 12,910,000 nights, representing 32 percent of total visitor nights (TRA, 2012b). During the ten year period 2000 to 2009, international backpacker visitors into Australia increased from 453,000 to 570,000 people (average year-on-year growth of 3 percent) (TRA, 2009). In Queensland since 2006 international backpacker visitation has stayed between 250,000 to 300,000 visitors per year and visitor nights oscillated between 4.2 million to 5.3 million (TQ, 2012a). In recent years backpacker numbers have declined slightly but there is no discernable long term trend. The strong Australian dollar relative to the US dollar and the Euro may be a key driver of this short term decline.
23

Backpackers want social interaction. Around 64 percent of backpackers entering Queensland are travelling alone (TQ, 2012a). Tourism researchers have observed that a central motivation for backpackers is the desire to socialise and meet-up with other travellers and local residents (Larsen et al., 2011; Mohsin and Ryan, 2003). For many backpackers the opportunities for social interaction are more important than the destination itself. As such these factors play a major role in where they choose to visit and how long they stay. The new backpackers from Asia have similar social interaction motivations as the historical backpacker markets of the United States, Europe and United Kingdom. A survey of 416 Chinese backpackers (a potential growth market for Queensland) finds three market segments based on primary motivations (Chen et al., 2013):
◆ 50 percent are on a journey of self discovery and personal improvement;
◆ 34 percent seek to have an understanding of the destination’s local culture, history and society and also seek to communicate with local residents; and
◆ 16 percent are seeking social interaction with both locals and other travellers.
Therefore, half of the Chinese backpacker market has the primary motivation of social interaction and experiencing culture.
Is a boom in Asian backpacking in the pipeline for Queensland? The United States, the United Kingdom, Continental Europe and Canada are over-represented in backpacker markets compared to general tourist visitation markets. Recent years have seen a softening in backpacker arrivals from these countries. However, backpacker markets in developing Asia are set for growth. A recent report from Monash University (Moreno, 2013), citing data from Tourism Australia’s International Visitor Survey, finds expenditure growth
during 2010 to 2012 in backpacker expenditure in Australia from:
◆ South Korea grew from $228 million to A$250 million (9.6 percent growth);
◆ Taiwan grew from A$104 million to $139 million (33 percent growth); and
◆ Overall Asia grew from A$745 million to A$812 million (9 percent growth).
If the new Asian backpackers travel alone and have the same social needs as European and United States backpackers, the social interaction component of the tourist experience will remain important. However, different cultures are likely to have different styles of social interaction.
Local communities and tourism. If residents in community understand and realise the positive social impact of tourism they are generally more receptive of tourists and their satisfaction with the community increases (Kim et al., 2013). However, there is a high level of awareness of the costs that tourism can have on a region. A study of community attitudes on the Sunshine Coast, Queensland, revealed that while the community was aware of the positive economic benefits these would come with costs. Even though the community agreed that tourism would create more jobs, support business for local people and small businesses, only 41 percent of respondents agreed that tourism would be likely to have a positive impact on their community (Dyer et al., 2007). Two thirds of respondents held concerns that tourism would change the local culture and 60 percent held concerns about overcrowding (Dyer et al., 2007). Addressing community concerns may help in the successful implementation of regional tourism.
Figure 13. Accommodation used by overnight domestic visitors to Queensland, 2012 Data source: Tourism Research Australia (TRA, 2013c)
The implications for tourism in Queensland
This megatrend highlights the heightened importance of the experience factor. These experiences will need to be personalised, authentic and involve social and cultural interaction. Friendliness will be a central part of the package enjoyed by overseas and domestic tourists and will be crucial for achieving repeat visits. The coffee shop today doesn’t just sell milk, sugar and coffee beans. The ambience, aroma, ethical (fair trade) production, friendly service and opportunity to interact with customers and staff are equally, if not, more important. This analogy applies to the tourism sector as a whole. To be successful the industry needs to understand and deliver on the experience factor. People will have much greater expectations for this in the future.
24 The Future of Tourism in Queensland

3.4 Bolts from the Blue
Regional tourist destinations can be heavily impacted, positively or negatively, by sudden and unexpected events. The coming decades are likely to see increased severity and frequency of extreme weather related events such as cyclones, floods and fires. The risk of infectious diseases and pandemics is rising in line with increased mobility of people. Furthermore, antibiotics are being developed at a slower pace than bacteria are evolving meaning we may be unable to treat common infections in the future. Recent times have also seen world markets become much more volatile with sudden spikes and troughs. The coming decades are likely to be characterised by bolts from the blue which impact the tourism sector. This will heighten the importance of resilience and adaptability.
Imag
e co
urt
esy
of
iSto
ckp
ho
to
2525

The sensitivity of tourism to extreme events. Tourism is an industry where revenue and employment are highly sensitive to extreme events such as terrorism, armed conflict, natural disasters, pandemics and financial system shocks. Some examples of extreme events that have had a significant impact on the tourism sector include (cited in Hsiao et al., 2008):
◆ The 2004 Indian Ocean tsunami which resulted in a drop of 67.2 percent in tourism arrivals for Phuket, Thailand in 2005 with 500 companies employing 3,000 people in the tourism sector collapsed (Henderson, 2007);
◆ The Avian Flu epidemic during 2004 which led to a subsequent loss of 12 million tourist arrivals at destinations throughout the entire Asia Pacific region (Wilder-Smith, 2006);
◆ The terrorist attacks of S11 which caused global travel to decline by 9.2 percent between September and December 2001 (UNWTO, 2002);
◆ The Bali bombings in 2002 which led to around 2000 people immediately cancelling their holidays to Bali. International visitor numbers dropped from 4,650 down to 2,833 one month after the bombings and hotel occupancy rates fell from 75 percent to 33 percent (Henderson, 2003).
◆ The Queensland floods of 2010-11 which are estimated to have reduced the State’s tourism revenue by 0.7 percent or $590 million (IBISWorld, 2011).
It is worth noting that a decrease in tourism arrivals and expenditure in one location that has been impacted by an extreme event, may translate to an increase in another location.
Extent of climate change impacts. Warming of the climate is now considered unequivocal given increases of global average air and ocean temperatures, widespread melting of snow and ice and rising average sea levels (IPCC, 2007). Of the more than 29,000 observational data series, from 75 studies, that show significant change in many physical and biological systems, more than 89 percent are consistent with the direction of change expected as a response to warming (IPCC, 2007). Examples of such changes include:
◆ The annual average Arctic sea ice extent shrinking by 2.7 percent per decade since 1978;
◆ The average annual temperature of the global ocean has increased at depths greater than 3000m since 1961;
◆ The global average sea level rising at an average annual rate of 1.8 millimetres per year during the period from 1961 to 2003; and
◆ Global surface temperatures during eleven of the twelve years between 1995 and 2006 ranking among the 12 warmest years since 1850 (IPCC, 2007).
Increased flooding and coastal inundation. The Intergovernmental Panel on Climate Change (IPCC) has developed models to forecast the frequency and severity of extreme weather events (IPCC, 2012). These models find that a 1 in 20 year extreme precipitation (rainfall) event may become a 1 in 5 year event. This is likely to result in increased local flooding in some catchments or regions. Sea level rise is predicted to increase the incidence of coastal inundation. According to a special report by IBISWorld, the Queensland floods of 2010-11 are estimated to have reduced the State’s tourism revenue by 0.7 percent or $590 million. Furthermore, the tourism sector did not rebound to its previous position for a period of one year (IBISWorld, 2011).
More intense cyclones. Whilst the IPCC models do not predict an increased frequency of tropical cyclones, the intensity of the cyclones is likely to increase. A category 4 cyclone has sustained windspeed of 160 to 200 km/hr and gusts of 225 to 279 km/hr and a category 5 cyclone is the highest rated with sustained winds above 200km/hr and gusts above 279km/hr. Both are extremely destructive. An analysis of cyclone activity since 1975 shows they are becoming more intense (Webster et al., 2005). Worldwide, cyclones (and hurricanes) in categories 4 and 5 have almost doubled in number from 1970 to 2005. During the period 1975 to 1989 the West Pacific Ocean had 85 tropical cyclones, with 25 percent of the total at category 4 or 5. The number of category 4 or 5 cyclones rose to 116 cyclones, 41 percent of the total, during the period 1990 to 2004. The IPCC expects that wind speeds will increase into the future.
Geopolitical instability associated with water scarcity. The International Water Management Institute (IWMI, 2007) estimates that 1.2 billion people live in regions with insufficient water to meet human needs. It is also estimated that
1.6 billion people live in water-scarce river basins with inadequate financial and human capacity to develop future water resources. Global water demand is forecast to increase by 55 percent between 2000 and 2050, with the largest increases coming from manufacturing, electricity and domestic use (OECD, 2012b). As water and other resources become scarce relative to demand the risk of conflict is heightened. Statistical analyses have revealed that countries which share rivers have a statistically higher probability of military disputes (Gleditsch et al., 2006). The contested waters of The Nile River, The Jordan River, The Mekong River and The Rio Grande all have potential to create geopolitical instability. This could have impacts for the demand in global tourism markets if one destination becomes unsafe relative to another.
Geopolitical instability associated with food insecurity. Based on assumptions about population growth, changing diets and agricultural systems the Food and Agriculture Organisation (FAO) forecast that food production needs to increase by 70 percent by the year 2050 to meet demand (FAO, 2009). Over the same period the world will lose 12 million hectares of productive agricultural land, capable of producing 20 million tonnes of grain, each year to land degradation resulting from human activities such as over-cultivation and deforestation (UNCCD, 2011). In addition to rising food demand, diets are shifting. People in developing countries are, on average, increasing their meat consumption at the rate of 5 percent per year with expectations of future growth ahead (FAO, 2003). The supply and demand drivers are pushing up food prices. Global food prices spiked in February 2011 at record highs and are likely to remain high, and volatile, for some time to come. High food prices have been linked to increased political unrest and social upheaval, particularly in low income countries (Arezki and Brückner, 2011; Bellemare, 2011). Future food insecurity could trigger geopolitical destabilisation and armed conflict. This could, in turn, impact global tourism markets.
Increased human mobility is elevating infectious disease risk. The increased movement of people for trade and travel is increasing the risk of infectious diseases being spread. For example, the influenza virus H1N1 originated in Mexico during March and April 2009. It was unknowingly transported by international
26 The Future of Tourism in Queensland

air travellers on commercial flights. A study was conducted of the movements of 2.35 million passengers departing Mexico and H1N1 outbreaks at destination cities worldwide. This study found that countries receiving more than 1400 arrivals from Mexico were at elevated risk of H1N1 importation. The study also found that international air traffic volume alone is 92 percent accurate in predicting importation of H1N1 (Khan et al., 2009).
Bacteria evolving faster than antibiotics. The rise of antimicrobial drug resistance is a concerning trend in the field of infectious diseases. For example, in India in 2002, bacteria were resistant to only 4 drugs. Four years later in 2006 bacteria in India were resistant to 21 different drug therapies. Every year 100,000 Americans, 80,000 Chinese and 25,000 Europeans die from hospital acquired antibiotic resistant infections (ReAct, 2012; Spellberg et al., 2011; WEF, 2013a).
More systems and procedures to reduce the spread of disease are likely. With increased risk of antimicrobial drug resistance, this is likely to lead to new surveillance systems, travel history reporting and rapid analysis of travellers leading to an increased cost and burden of travel (MacPherson et al., 2009). Modern aircraft currently use High-Efficiency Particulate Air filters to reduce the chances of in-flight infection. In the future airports may screen passengers with infrared thermal image scanners to detect infectious disease. However, at this stage the technology is not considered an effective means of preventing viruses entering a country (Priest et al., 2011). Overall infectious disease control systems, procedures and technology are likely to become a more prominent part of the travel experience.
The impact of perceived risk. Safety perceptions are often destination dependent (Kozak et al., 2007), thus where one destination may be perceived unsafe a traveller may simply change their destination, where possible, rather than not travel at all. A survey of 1180 international travellers found that 84 percent would change travel plans if they were planning to visit a destination that had an elevated level of perceived risk (Kozak et al., 2007). Australia was considered to have the lowest or second lowest risk regarding infectious diseases, terrorist attacks and natural disasters compared to North America, Europe, Asia and South America/Africa/Middle East (Kozak et al., 2007).
Increased uncertainty increases the popularity of domestic holidays. Domestic tourism generally continues to perform well during unexpected world events compared to international tourist visits. Following the 2001 terrorist attacks, domestic tourists grew by 1.66 percent in Australia while international tourists declined by 5.68 percent (Allen and Yap, 2009). During the SARS outbreak in 2003, domestic visitor numbers grew by 0.23 percent compared to a decrease of 2.25 percent in international tourist arrivals (Allen and Yap, 2009). Domestic tourism can help sustain the industry during such events.
Australia is a relatively safe tourist destination. The country has been virtually free of life threatening tropical diseases in recent decades (Shaw and Leggat, 2003). While there were 1,068 overseas visitor deaths during 2001 to 2003, 73 percent were due to natural causes such as heart disease (Leggat and Wilks, 2009) and thus not attributable to visiting Australia. Transportation accidents were the most common cause of accidental deaths (14 percent of all deaths), followed by drowning (5 percent of all deaths) (Leggat and Wilks, 2009). Being unfamiliar with marine conditions and driving environments may potentially be contributing factors to these two types of tourist deaths. Between 2001 and 2003, 27 percent of international tourist deaths were due to possible preventable accidents. On the whole, Australia is considered a safe destination and has been suggested as a benchmark for other tourist destinations (Wilks et al., 2002).
Perceptions differ from reality. Among those who have already visited Australia, the country is rated number one for safety (TA, 2011). However, among those who have never visited, Australia ranks low in perceptions of safety for key markets including India, Indonesia and South Korea. It is likely that Australia’s reputation as a safe destination has been damaged by attacks against India students (TA, 2011). For those that decide to travel however, Australia is a much safer destination than the tourist expected (TA, 2011), indicating that there is a degree of disconnect between foreigner’s perception of safety in Australia and their actual experiences.
The implications for tourism in Queensland
The sudden events described in this megatrend can negatively impact large parts of the global tourism sector. However, those regions which are stable, and perceived as secure, are likely to benefit. The trends presented here show that tourists are quick to change destinations when a perceived safety or health risk is identified. On the world stage Queensland and Australia are politically, environmentally and socially stable with excellent health and hygiene standards. Natural disasters such as floods, bushfires and cyclones are serious and do have major impacts, but they are well managed. Early warning systems, building designs and recovery plans are effective. The stability of Queensland will be a major drawcard for international and domestic tourists.
27

3.5 Digital Whispers
Perhaps one of the most rapid and profound shifts in human information flows is associated with the rise of social media. Internet services such as Facebook, Twitter, YouTube and Skype have experienced incredible growth. While this technology in itself is not new, it is changing the way people access and trust information. It is creating public relations and marketing challenges and opportunities for both individuals and organisations. The tourism sector is highly sensitive to people’s perceptions. We are moving into a world where individuals can influence the thinking of millions of people, including customers, within hours and minutes. There is an opportunity for the Queensland tourism sector if it can enter these conversations in the right ways and at the right times.
Imag
e co
urt
esy
of
ww
w.s
hu
tter
sto
ck.c
om
28 The Future of Tourism in Queensland

Internet usage continues to grow. In June 2012, approximately 73 percent of Australians used the internet more than once a day (ACMA, 2012a). On average, 81 hours and 34 minutes were spent online at home during June 2012 with the most popular activity being communication (ACMA, 2012a). The internet and its various social media platforms are continuing to grow and evolve to challenge traditional means of communication. Forty-eight hours worth of content is uploaded onto YouTube every minute (WEF, 2013a). Facebook had more than 1 billion active users in under a decade of existence and Twitter reached over 500 million active users in seven years (WEF, 2013a).
Increased internet usage on smartphones. The most significant development has been the increase in internet usage on smartphones, with participation rates increasing from 8 percent in June 2008 to 32 percent in June 2012 in Australia (ACMA, 2012a). Australian consumers access the internet on their smartphones for a variety of reasons, the most popular being to browse websites or search for information (Figure 14) (ACMA, 2012b).
0
5
10
15
20
25
30
35
40
45
50
Browsingwebsites orsearch for
information
Accessednews, sports
weatherupdates
Used a socialnetworking
site
Streamingaudio
content ofvideo content
Paid bills Downloadedaudio or
videocontent
Purchasedgoods
Perc
enta
ge o
f sm
artp
ho
ne
inte
rnet
use
rs, 1
8+ (
%)
Figure 14. Selected online activities undertaken by persons 18+ years via mobile phone handsets Data source: Australia Communications and Media Authority (ACMA, 2012b)
Information technology will continue to change how tourists access and use information. Approximately 62 percent of international visitors use the internet for information when visiting Australia, up from 50 percent in 2006 (TRA, 2011). Visitors from Germany and France are most likely to use the internet as a source of information when visiting Australia, while visitors from China are least likely to use the internet. Chinese visitors tend to source travel information from friends or relatives living in Australia or travel agents (TRA, 2011). The internet has not replaced traditional sources of information such as travel agents however, which were used by 20 percent of international visitors in 2010 (TRA, 2011).
The changing role of the travel agent. The use of the internet for travel bookings is changing the role of the travel agent (Castillo-Manzano and López-Valpuesta, 2010). Where tourists previously relied on travel agents for information about travel destinations, hotels and airfare bookings, the internet has allowed the tourist themself to access this information and more. This has given the tourist direct access to suppliers,
sometimes resulting in suppliers giving special online deals to consumers that are unavailable through other means such as a travel agent (PwC, 2010). As a result, travel agencies are expected to move towards businesses that can offer cheaper travel products and retain a loyal customer base by offering quality and trustworthy service (PwC, 2010).
Greater information flows between travellers. Social media websites, which contain consumer-generated content such as blogs, wikis, social networks, collaborative tagging, and media files shared on sites like YouTube, have gained popularity in online travellers’ use of the web (Gretzel, 2006). Particularly for the young traveller, the internet has multiplied opportunities for increased information availability through sources such as Facebook, TripAdvisor or numerous travel blogs (UNWTO, 2011). These outlets enable vast flows of traveller opinions across the globe. For example, the website Tripadvisor.com operates in 30 countries worldwide and has over 100 million travel reviews and opinions from travellers worldwide (Tripadvisor.com, 2013). There are approximately 60 new contributions posted every minute and more than 90 percent of topics posted in the online forum receive a reply within 24 hours (Tripadvisor.com, 2013).
The emergence of flashpackers. Flashpackers are a new generation of backpackers who carry a greater disposable income, visit more remote locations, are technologically connected by a laptop or mobile phone but still engage with the mainstream backpacker culture (Hannam and Diekmann, 2010). A study in Cairns revealed that these technologically savvy backpackers show a significantly greater tendency to share their experiences via Facebook, Twitter, a travel blog or by uploading videos on a YouTube account (Paris, 2012). Traditionally a culture characterised by face-to-face communication and a reliance on Lonely Planet travel guides, technology has created an intersection between physical travel and interactive travel (Paris, 2012).
29

The popularity of user-generated content in travel accommodation. A study based on data from Ctrip.com, the largest online service provider for hotel accommodation, airline tickets and package tours in China, examined the relationship between the content of the review, whether positive or negative, and the number of online sales of hotel rooms. It was found that a 10 percent increase in the ratings of user reviews generally resulted in an increase in online hotel bookings of 5 percent, as calculated by an index (Ye et al., 2011). Furthermore, the variance in the reviews, that is the range of positive and negative reviews, did not appear to significantly influence the number of online bookings (Ye et al., 2011). Online customer reviews are thus generally viewed as a reliable source and positive reviews are likely to result in increased bookings.
Usage of foreign social media sites and travel research. While trending topics on Western social media sites are predominantly concerned with current events, China’s micro blogging site Sina Weibo is used differently. The majority of content are jokes, images and videos and content is often retweeted. Trending topics are formed largely via retweeting rather than a large number of original posts on the same topic (Yu et al., 2011). However, potential Chinese tourists are more likely to gather travel research through other methods. A study of Chinese tourists travelling to Australia revealed that the most commonly used information source was television programs with 60 percent of respondents using this source (Sparks and Pan, 2009). Friends were also an important information source (used by 7 percent) as was fashion magazines (54 percent). Only 49 percent researched Australia on Chinese websites and one third chatted online to find information (Sparks and Pan, 2009).
Technology is enabling cross-cultural communication. Smartphone apps like “Word Lens” and “Snap and Translate” translate words from English to Spanish and English to Chinese (and vice versa) respectively in real time (Du, 2011). Such technology is capable of translating text in printed newspapers, magazines, books, menus and signboards (Du, 2011). For the tourist, this technology helps overcome the language barriers that may be a potential disincentive to visit overseas destinations.
Figure 15. Internet use for tourism-related bookings, 2006 to 2010 Data source: Tourism Research Australia (TRA, 2011) Note: No available data for domestic trips in 2006.
0
5
10
15
20
25
30
35
40
45
2006 2007 2008 2009 2010
Pro
po
rtio
n o
f to
tal
bo
oki
ngs
(%
)
International visitorsDomestic trips
Potential communication of misinformation. As with word of mouth communication, electronic user generated content has the potential to be an unreliable source. In contrast to word of mouth information, the flow of electronic information occurs between individuals with little or no previous relationship, the transfer of information is relatively impersonal but on the other hand the information is easily retrievable (Tham et al., 2013). As such, in the case of choice of destination at least, electronic word of mouth does not generally hold the same credibility and consequent influence as traditional word of mouth does (Jacobsen and Munar, 2012; Tham et al., 2013), although still is consulted as an information source. In the extreme, misinformation can result in “digital wildfires” where information that is intentionally or unintentionally misleading or provocative is spread via social networks with potentially serious consequences (WEF, 2013a).
New public relations risks and opportunities. Instead of a consumer communicating their experience to their friends and family, social media has created the means by which the experience of one consumer can be shared with millions. This was the case with a professional musician and United Airlines. After United Airlines refused to compensate for breaking a $3,500 guitar, the musician wrote a song “United Breaks Guitars” which he posted on YouTube. This was subsequently viewed by over 12 million people and received media coverage on the internet, print and on television (WEF, 2013a). The consumer now has the capacity to share their experiences, whether good or bad, with global audiences. In some cases, tourism operators may not know these virtual complaints are being made or how to effectively handle them.
More bookings are made online. Travellers are using the internet more and more to make their own travel bookings. In 2010, 42 percent of international tourists to Australia used the internet for bookings and 27 percent of domestic tourists made bookings on the internet (Figure 15) (TRA, 2011). On an international scale, tourists from Malaysia, New Zealand and France made the highest proportion of online bookings while India and China had the lowest proportion of online bookings (TRA, 2011). Airfares and accommodation are the most common services booked over the internet for both international and domestic visitors to Australia (TRA, 2011).
30 The Future of Tourism in Queensland

The increasing versatility of technology. Technology and its increasing versatility of use has helped empower a new type of tourist who is increasingly knowledgeable and seeks value for both time and money (Buhalis and Law, 2008). Given the vast quantity of information available on the internet, via mobile phones, a tourist is now able to make decisions and change their plans very quickly (Bell et al., 2007). Smart devices are increasing the versatility of technology and allowing it to be used in different ways.
Virtual experiences are not replacing actual experiences, yet. However, it is unlikely that virtual tourism will completely replace the experience of actually being at a destination. A study of 31 Queensland students found that despite the advantage of no jet lag, they did not see virtual tourism as a substitute for the actual experience (Prideaux, 2002). Moreover, it was suggested that a virtual experience could detract from the surprise or spontaneity of the experience when actually visiting the destination (Prideaux, 2002). Given that a virtual experience is unlikely to be an “authentic” experience, it may be unlikely that a virtual visit will replace the actual visit for those that are able to travel.
A virtual experience may increase the intention to visit. While virtually experiencing a destination may not replace the actual visit, it could increase the intention to visit the destination (Guttentag, 2010). Tourism Tasmania used telepresence, that is “the feeling of being there” on a website (in the form of interactive 2D and 3D facilities) to increase the connection that potential tourists had to the destination (Hyun and O’Keefe, 2012). The study found that the virtual information presented by telepresence can translate into increased purchase intention (Hyun and O’Keefe, 2012). Virtual experiences may also enhance the actual experience. In the case of heritage sites, virtual heritage researchers believe their work encourages people to go visit the real site and provides the visitor with increased knowledge that enhances their experience (Refsland et al., 2000).
The shortcomings of social media. Historical research found that an individual could typically maintain at least a dozen friendship ties outside their household and workplace (Garton et al., 1997). This includes at least four ties with socially close intimates and another three ties at least with persons routinely contacted three times a week or more (Wellman et al., 1988). However, a more recent survey of students at a large Midwestern University, Ellison et al. (2007) found that the mean number of friends per student was between 150 and 200, suggesting that networks today consist of larger and less intimate relationships rather than tightly-knit small groups. The growing popularity of social media has the potential to lead to isolated groups within society that are unable to derive the necessary bonding social capital. When people think about where to have a holiday the social interaction drawcard will be of much importance.
The expectation for face-to-face interaction. Despite the high participation rates in social media, there is still a preference for face-to-face interaction. In a consumer survey 49 percent of American teenagers aged 13 to 17 prefer face-to-face communication with their friends. Face-to-face communication was stated as the preferred way of communication because it is “more fun” and people can be understood better. As one surveyed teenager stated, “[face-to-face communication] is the only real way to be with each other. “Moments only happen in person” (Common Sense Media, 2012). A study of 1,324 self-selected Australian internet users between the ages of 18 and 44 showed that while social media users are more likely to be extraverted, they also have stronger feelings of family loneliness (Ryan and Xenos, 2011). This is likely to reinforce the importance of social interaction and is likely to be a driver of holidays for the purpose of visiting friends and relatives.
Too much technology? The increasingly modern lifestyle is thought to be prompting a “re-tuning to nature”, whereby people are seeking to be reconnected to the natural world they feel they have been separated from by the modern lifestyle (Bell et al., 2007). A consideration for the tourism sector will be whether it can take advantage of this and deliver authentic experiences that aren’t crowded by technology.
The implications for tourism in Queensland
The implication of this megatrend for the Queensland tourism sector is that new systems will be needed to provide people with information relating to their travel choices. The world of social media is already very much upon us. The underlying technology will improve but it is unlikely to radically change over the next twenty years. However, the ways by which people access information and make choices will change considerably. An ability to enter these conversations and provide useful and accurate information will be of benefit to the Queensland tourism sector.
31

3.6 On The Move
Over coming decades humanity will become increasingly mobile. Every year the world’s population accrues an additional five percent frequent flyer miles (Boeing, 2012). People are travelling for holidays, friendship, trade, business meetings, education, events and healthcare. These drivers are interlinked and many trips have multiple purposes. The need or desire to visit Queensland will have spill over benefits for the tourism sector. The people who travel will be young and old. Cultural diversification in Queensland will increase people’s global connections and will strengthen the motivation to visit.
Imag
e co
urt
esy
of
Tou
rism
an
d Ev
ents
Qu
een
slan
d
32 The Future of Tourism in Queensland

Will this mobility trend continue? Throughout history technological advancements have drastically decreased trip durations and have improved the safety and comfort of travel. Technology advances will continue to occur. A major area of innovation is likely to be in the field of aviation. Whilst road, rail and shipping have multiple energy sources jet aircraft still depend on fossil fuels which have limited availability. As oil becomes scarce, and prices rise, aircraft manufacturers are likely to develop more efficient designs. Innovation is likely to see continued growth in the movement of people.
This megatrend explores the drivers of travel and the technologies that will transport people into Queensland over the coming twenty years.
Trade leads to travel. Business travel can lead to export sales and import purchases which can subsequently lead to further business travel and holiday travel (Kulendran and Wilson, 2010). A study conducted in 2010 found this to be the case with Australia and its trading partners USA, UK, Japan and New Zealand (Kulendran and Wilson, 2010). It is likely that similar causal relationships exist between Australia and other trading partners and strengthening of trade relationships has the potential to promote greater activity in tourism.
Global trade to increase by nearly 75 percent by 2025. Over the past few decades Australia’s trade with other countries has risen sharply (ABS, 2011c) (Figure 16). Further growth is expected, fuelled by the rise of manufactures imported from Asia and the expansion of mining activities. Australia’s trade has grown by roughly 80 percent since a decade ago (Figure 16). HSBC (2011) forecasts that by 2025, world trade will have grown by 73 percent. By the year
2020, 80 percent of the goods in the world will be manufactured in a country different from where they are consumed, compared to approximately 20 percent currently (McKinsey & Company as cited Ballou, 2007). Newly emerging economies are predicted to be the drivers of this growth in trade and as such, global supply chains are likely to widen as developed economies integrate emerging markets into their supply chains to compete in the new global landscape (HSBC, 2011).
Strong trading ties with Asia. In 2009-10, Australia’s exports to China were worth A$52,219 million. In the following year of 2010-11, exports to China jumped 35 percent to A$70,517 million. The total value of merchandise traded between China and Australia has grown at an average annual rate of 22 percent from 1999 to 2009, more strongly than any other trading partner over this period (ABS, 2009a). China is Australia’s largest trading partner (DFAT, 2011) and Australia’s trading links with Asia have been continually growing. The established trading links with Asia offer potential for the development of tourism opportunities with these countries.
Multi-purpose trips. The elements of the tourism sector are no longer restricted to the traditional infrastructure such as airline seats, hotel beds and travel agents, but have grown to incorporate ICT, local culture and society, education, work and play (UNWTO, 2011). As such, tourism can no longer be associated only with the traditional motivations for a holiday such as the desire for a break and to visit other destinations. Rather tourism is being increasingly driven by other motivations, such as a sporting event or other event, a medical procedure or education.
33

Figure 16. Imports and exports of goods from Australia, trend estimates, 1971 to 2012 Data source: Australian Bureau of Statistics (ABS, 2013c)
0
5,000
10,000
15,000
20,000
25,000
1971
1973
1974
1976
1978
1979
1981
1983
1984
1986
1988
1989
1991
1993
1994
1996
1998
1999
2001
2003
2004
2006
2008
2009
2011
$AU
D m
illio
ns,
cu
rren
t pri
ces
ImportsExports
Education exports. In 2009, international students accounted for 22 percent of tertiary students studying in Australia, the highest proportion of international students in all OECD countries (ABS, 2011b). The majority of international students visa applications are from China, United States, Malaysia, South Korea and India (DIC, 2011). In 2010-11, 20 percent of student visa applications granted were from China, 12 percent from India and 5 percent from South Korea (ABS, 2011b).
Falling numbers in international education visa applications. From 2009, there has been a decline in the number of international students studying in Australia, mainly in the Higher Education and Vocational Educational and Training (VET) sectors (DIC, 2011) (Figure 17). This decline has coincided with changes to the General Skilled Migration program and visa processing, the global financial crisis and subsequent increase in value of the Australian dollar, increased competition from other countries, domestic college closures and increased media and concern about the welfare of international students studying in Australia (ABS, 2011b; DIC, 2011). While enrolments have declined slightly from this peak, Australia continues to play an important part in the international education sector (ABS, 2011b).
A holiday while studying. International students make a contribution to tourism by visiting places of interest, purchasing souvenirs, casual work in hospitality and visits by friends and relatives (Min-En, 2006). It has been estimated that each overseas student taking a course in higher education was visited by an average of 1.3 people during the course of their stay, generating A$1.2 billion each year in the Australian economy (UNWTO, 2011).
The rise of medical tourism. While tourism has long been associated with health and well being, it is only recently that this has extended to medical intervention and surgery. Medical tourism has emerged as people travel considerable distances to undergo medical, dental and surgical care while also enjoying a holiday of the more typical nature (Connell, 2006). It is largely the result of high treatment costs in developed nations, long waiting lists, the relative affordability of international air travel, favourable economic exchange rates and the ageing population (Connell, 2006).
Developed countries lead the demand for medical tourism destinations. Medical tourism is largely associated with countries including India, Singapore, Thailand, South Africa and the Middle East (Connell, 2006). In order
In 2009, international students accounted for 22 percent of tertiary students studying in Australia, the highest proportion of international students in all OECD countries.
34 The Future of Tourism in Queensland
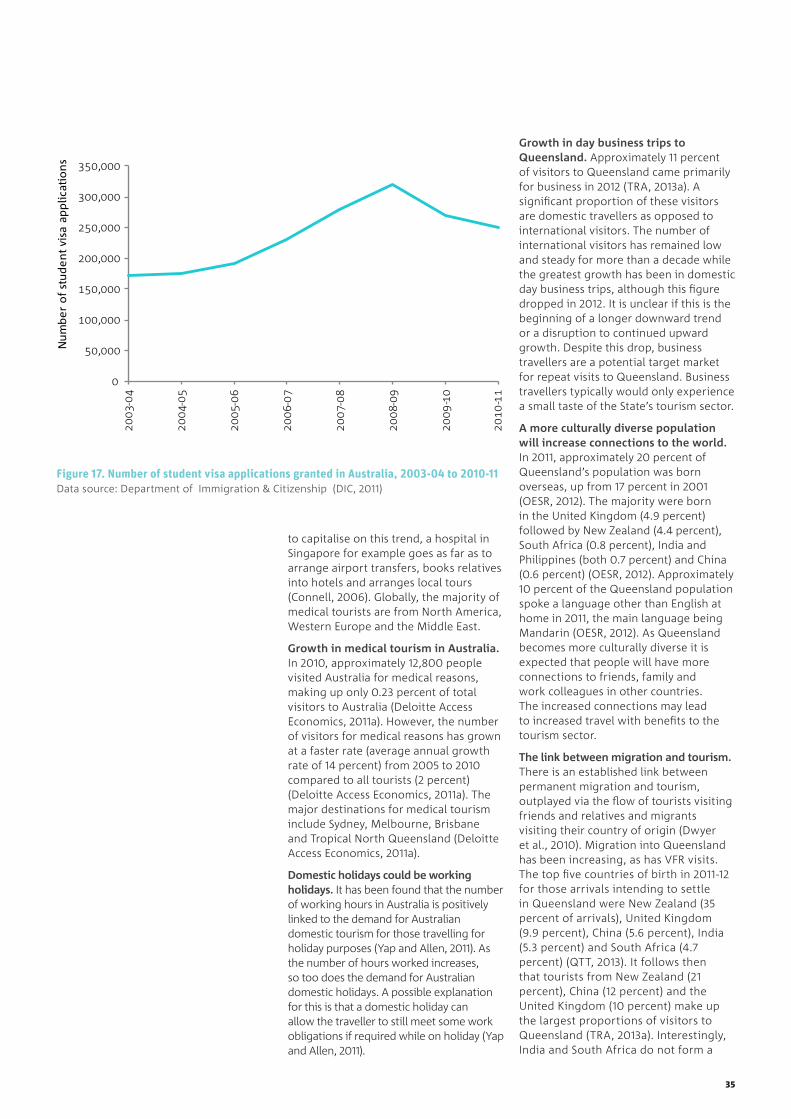
0
50,000
100,000
150,000
200,000
250,000
300,000
350,000
2003
-04
2004
-05
2005
-06
2006
-07
2007
-08
2008
-09
2009
-10
2010
-11
Nu
mb
er o
f st
ud
ent
visa
ap
plic
atio
ns
Growth in day business trips to Queensland. Approximately 11 percent of visitors to Queensland came primarily for business in 2012 (TRA, 2013a). A significant proportion of these visitors are domestic travellers as opposed to international visitors. The number of international visitors has remained low and steady for more than a decade while the greatest growth has been in domestic day business trips, although this figure dropped in 2012. It is unclear if this is the beginning of a longer downward trend or a disruption to continued upward growth. Despite this drop, business travellers are a potential target market for repeat visits to Queensland. Business travellers typically would only experience a small taste of the State’s tourism sector.
A more culturally diverse population will increase connections to the world. In 2011, approximately 20 percent of Queensland’s population was born overseas, up from 17 percent in 2001 (OESR, 2012). The majority were born in the United Kingdom (4.9 percent) followed by New Zealand (4.4 percent), South Africa (0.8 percent), India and Philippines (both 0.7 percent) and China (0.6 percent) (OESR, 2012). Approximately 10 percent of the Queensland population spoke a language other than English at home in 2011, the main language being Mandarin (OESR, 2012). As Queensland becomes more culturally diverse it is expected that people will have more connections to friends, family and work colleagues in other countries. The increased connections may lead to increased travel with benefits to the tourism sector.
The link between migration and tourism. There is an established link between permanent migration and tourism, outplayed via the flow of tourists visiting friends and relatives and migrants visiting their country of origin (Dwyer et al., 2010). Migration into Queensland has been increasing, as has VFR visits. The top five countries of birth in 2011-12 for those arrivals intending to settle in Queensland were New Zealand (35 percent of arrivals), United Kingdom (9.9 percent), China (5.6 percent), India (5.3 percent) and South Africa (4.7 percent) (QTT, 2013). It follows then that tourists from New Zealand (21 percent), China (12 percent) and the United Kingdom (10 percent) make up the largest proportions of visitors to Queensland (TRA, 2013a). Interestingly, India and South Africa do not form a
Figure 17. Number of student visa applications granted in Australia, 2003-04 to 2010-11 Data source: Department of Immigration & Citizenship (DIC, 2011)
to capitalise on this trend, a hospital in Singapore for example goes as far as to arrange airport transfers, books relatives into hotels and arranges local tours (Connell, 2006). Globally, the majority of medical tourists are from North America, Western Europe and the Middle East.
Growth in medical tourism in Australia. In 2010, approximately 12,800 people visited Australia for medical reasons, making up only 0.23 percent of total visitors to Australia (Deloitte Access Economics, 2011a). However, the number of visitors for medical reasons has grown at a faster rate (average annual growth rate of 14 percent) from 2005 to 2010 compared to all tourists (2 percent) (Deloitte Access Economics, 2011a). The major destinations for medical tourism include Sydney, Melbourne, Brisbane and Tropical North Queensland (Deloitte Access Economics, 2011a).
Domestic holidays could be working holidays. It has been found that the number of working hours in Australia is positively linked to the demand for Australian domestic tourism for those travelling for holiday purposes (Yap and Allen, 2011). As the number of hours worked increases, so too does the demand for Australian domestic holidays. A possible explanation for this is that a domestic holiday can allow the traveller to still meet some work obligations if required while on holiday (Yap and Allen, 2011).
35

significant proportion of visitors to Queensland. After New Zealand, China and the United Kingdom, Japan and the United States are the next most common source of visitors to Queensland (10 and 9 percent of total Queensland visitors respectively) (TRA, 2013a).
The sky is the limit. People travel to, and within, Queensland by walking, bicycles, motor vehicles, rail, boats and planes. With the exception of planes, all these transportation modes are likely to continue to exist in similar form over the next twenty years. Aviation is different. Aviation depends on fossil fuel for energy and, at the current time, there is no commercially viable alternative energy source. The limited availability of world crude oil reserves is forecast to significantly constrain jet fuel availability by the year 2026 (Nygren et al., 2009). However, technological innovation within the aviation sector is likely to see this mode of transportation adapt, change and continue to move people into Queensland. The future will see different types of aircraft opening up new travel routes and new tourism markets.
Aviation is vital to Queensland’s current and future tourism sector. Brisbane airport recorded 4.3 million international passenger arrivals and 15.8 million domestic passenger arrivals in financial year 2010-11 (BAC, 2013) (Figure 18). Around 1.5 million international visitors chose air travel for internal movement (stopovers) within Australia during 2011-12 (TRA, 2012c). In 2012 around 17.1 million domestic overnight visitors within Australia travelled to their destination by aircraft (TRA, 2012d). The vast majority of overseas visitors enter Australia on a commercial jet aircraft. It is not the only form of transportation that matters but the Queensland tourism sector would not exist in its current form or size without aviation.
Jet fuel is the most expensive, and increasing, cost item for airlines. In 2003 the worldwide aviation industry spent US$44 billion on jet fuel. In 2012 this rose to US$207 billion. Fuel costs account for 33 percent of the global aviation sectors total expenses. Ten years prior in 2003 jet fuel accounted for only 14 percent of aviation expenses (Figure 19). The change is largely due to rising crude oil prices driven by supply and demand forces. The price, and availability, of jet fuel will be a critical factor influencing the profitability of
Figure 18. Passenger arrivals at Brisbane airport, 2000-01 to 2011-12 Data source: Brisbane Airport Corporation (BAC, 2013)
0
2
4
6
8
10
12
14
16
18
2000
-01
2001
-02
2002
-03
2003
-04
2004
-05
2005
-06
2006
-07
2007
-08
2008
-09
2009
-10
2010
-11
2011
-12
Pass
enge
r ar
riva
ls (
mill
ion
s o
f p
eop
le) International passengers
Domestic passengers
0
5
10
15
20
25
30
35
2003 2004 2005 2006 2007 2008 2009 2010 2011 2012
Perc
enta
ge o
f to
tal
exp
ense
s (%
)
Figure 19. Jet fuel costs as a proportion of total global aviation industry costs, 2003 to 2012 Data source: International Air Transport Association (IATA, 2012)
36 The Future of Tourism in Queensland

airlines, the prices of tickets and the movement of people into Queensland from overseas and within Australia. There is an expectation that jet fuel demand will grow by 3 percent per year whilst crude oil production will decrease by several percent per year. This is forecast to create a substantial shortage of jet fuel by 2026 (Nygren et al., 2009).
Air ticket prices – can they really keep coming down (or stay so low) if jet fuel gets more expensive? In real terms the price of an airline seat, in Australia and globally, has come down considerably over the past decade (Figure 20). This is largely due to the rise of low cost carriers. Lower airfares translate to more visitor arrivals into Australia and also more departures of citizens headed for overseas destinations. There is no reliable 20-year forecast for air ticket prices. However, if jet fuel prices remain high (or increase) airlines will struggle to maintain the downward trend in fares. Unless alternative fuels and transportation technologies are developed, airfares will most likely rebound and passenger movement will fall below its current upward trajectory. The finite availability of crude oil is an inescapable reality. Near term forecasts by many analysts, including the US Energy Information Administration, suggest a softening in the currently high oil (Brent Crude) price from US$111/
0
20
40
60
80
100
120
140
160
1992
1993
1994
1996
1997
1998
1999
2000
2001
2002
2003
2004
2005
2006
2007
2009
2010
2011
2012
Real
pri
ce in
dex
(Ju
ly 2
003
= 10
0)
2013
Figure 20. Monthly domestic airfare index (best discounted fare) in Australia, 1992 to 2013 Data source: Bureau of Infrastructure, Transport and Regional Economics (BITRE, 2013)
barrel to US$101/barrel by the year 2014 (US EIA, 2013). However, in the longer term increased demand from developing economies, especially China, and constrained resource availability could be expected to push oil prices upward.
The world’s citizens are becoming more mobile. Despite these challenges industry forecasts suggest more and more people will take to the skies. A rule of thumb used by Boeing to predict a region’s annual growth in passenger air miles is GDP Growth + 2 percent. This equates to a five percent annual increase for the whole world. This is because air travel is closely correlated to economic growth. The more a country grows its economy the more people get on a plane. The Boeing aviation Current Market Outlook predicts 34,000 new airplane deliveries worldwide driven by the five percent annual increase in passenger kilometres. Boeing also predicts that over the next 20 years nearly half of the world’s air traffic growth will occur in the Asia pacific region with an anticipation of 12,030 new aircraft deliveries into this region (Boeing, 2012).
Innovation and the future of aviation. Since the early 1900s planes have been getting bigger, faster, safer, more comfortable and cleaner. The world’s major aircraft manufactures, Boeing and Airbus, are releasing and designing planes with lower fuel consumption,
37

increased biofuel mixes, decreased noise and decreased greenhouse gas emissions. Manufacturer’s specifications indicate the Boeing 787 Dreamliner uses 20 percent less fuel than most contemporary similar sized passenger aircraft whilst still achieving higher than usual cruise speed of Mach 0.85. This has been achieved by advances in jet engine technology and lower weight. Future designs by Boeing and Airbus are likely to continue down this pathway. Research into supersonic and hypersonic flight, potentially allowing London to Brisbane flights in several hours, is also likely to yield new aircraft over the coming decades. Over the course of the twentieth Century, from the 1920s to 2000, commercial passenger aircraft experienced (Gohardani et al., 2011):
◆ Increases in cruise speed from under 200 km/hr to over 900 km/hr for many conventional passenger jets (and over 2000 km/hr for Concorde);
◆ Increases in maximum take-off weight (MTOW) from a few hundred kilograms to over 600 tonnes; and
◆ Flight ranges from 1,000 kilometres to over 15,000 kilometres.
It can be expected that technological innovation will continue apace and the future will see planes that can fly further, faster and more efficiently. New planes may open up more activity in point-to-point (as opposed to hub-to-hub) transit. Point to point services could connect new markets in the developing world (e.g. emerging towns and cities) to specific destinations within Queensland. The challenge for the world’s aviation engineers over the coming twenty years will be to diversify fuel sources and break the reliance on crude oil.
The potential for bio-derived jet fuel and natural gas. The possibility of fuelling commercial jet aircraft from bio-derived fuels was recently investigated by CSIRO (2011). At the current time bio-derived fuels account for only a tiny fraction of the aviation sector’s energy usage and are mostly used for experimental and demonstration purposes. However, there is significant scope for substantially increasing bio-derived products in the jet fuel mix. The CSIRO study explores a scenario by which the Australian and New Zealand aviation sectors achieve 5 percent biofuel by 2020 and 40 percent biofuel by 2050. Some of the findings of the CSIRO study are that:
◆ Powering commercial aircraft using bio-derived fuel sources is technically feasible. Ongoing tests have shown that biofuel can meet the aviation sector’s stringent safety and performance requirements.
◆ The challenge is to make the leap from technical feasibility to financial feasibility. The focus of technology advances will be on bringing production costs down to make bio-derived products a commercially viable option.
◆ Australia and New Zealand have the right climate, land resources, skills, scientific capabilities and stable governance systems for efficient production of bio-derived aviation fuel. The industry can adopt bio-derived products with minimal disruption to current systems and supply chains if the financial barrier can be broken.
There have also been demonstration flights with natural gas accommodating 40 to 50 percent of the fuel mix. For example, in February 2008 Airbus flew an A380 jet aircraft between Britain and France with one of the four engines using 40 percent gas-to-liquids and 60 percent conventional jet fuel (Creedy, 2008).
Transport within Queensland. The mode of travel used between stopovers by domestic visitors has not undergone significant variation in recent years. As expected, the large majority of intrastate visitors to Queensland travel by private vehicle whereas the majority of interstate visitors travel via air transport (TRA, 2013c). Data could not be sourced on international visitors’ travel habits to Queensland. As an indication however, approximately half of international tourists visiting Australia use air transport between stopovers (TRA, 2013a). Private or company car is the next most preferred means of transport for international travellers. This may reflect the increasing proportion of international tourists visiting for the main purpose of visiting friends and relatives who can therefore travel with their Australian hosts.
High speed trains – a possibility in the long term? A study into a high speed rail network with trains operating at speeds of up to 350km/hour connecting Brisbane, Sydney, Canberra and Melbourne finds costs between A$61 to A$108 billion (AECOM, 2011). High speed rail transport has experienced
major technological advances in recent times and can be expected to improve in cost-effectiveness, speed, safety and reliability. The world’s fastest train is currently the CRH380A in China. It operates at maximum speeds of 350 to 380 km/hr. However, perhaps due to low population density, vast distances and high costs Australia has not yet developed proposed high speed rail links. However, the concept has technical feasibility and might be a possibility over the coming several decades.
High speed rail has proven popular in other countries. The Boston Consulting Group forecasts that by 2020 over half of Europe’s regular air routes will be serviced by trains with shorter overall travel times (Ulrich, 2009). In China more people already travel on long internal trips by high speed rail than jet aircraft (The World Bank, 2013). Benefits of train travel include decreased energy consumption, lower greenhouse gas emissions and a wider variety of possible fuel sources. Trains can be fully powered by electricity which can come from a variety of sources such as coal, natural gas, nuclear and renewable.
Cruise ships on the rise. A study by Access Economics (2008) finds that the Australian cruise ship sector has experienced “stunning growth” in recent times. The study reports that in 2007-08 the cruise ship sector contributed A$1.2 billion to the Australian economy which represented a 54 percent increase from A$781 million in 2006-07. The domestic market penetration of cruise shipping is forecast to grow from 1 to 2 percent of the Australian population currently to 3 to 5 percent by 2020. The Access Economics study also finds that in 2008 the Brisbane port handled some 90,000 passengers. This is forecast to grow to 360,000 passengers by 2060. Cruise ships represent both a tourist activity during a visit to Queensland and also a means of coming to Queensland from overseas and interstate locations.
Bicycles and tourism – a rapidly growing market and travel mode. Cycling as both a mode of transport for day trips and as tourism activity has experienced strong growth over the past decade and is likely to continue to grow into the future. The Victorian Government’s “Cycle Tourism Action Plan 2011-2015” aims to capitalise on this growth. During 2010 cycle tourism was estimated to generate A$362 million in Victoria and $2.4 billion within Australia
38 The Future of Tourism in Queensland

(Tourism Victoria, 2011). The EuroVelo network is a cycle route in Europe which is estimated to handle 45.2 million trips and generate 5 billion Euros each year (Tourism Victoria, 2011). Expenditure in the New Zealand bicycle tourism sector is anticipated to double from 2009 levels to around $640 million per year (Tourism Resource Consultants, 2009). Australians are also rapidly increasing their use of bicycles as a mode of transport. In 2006 Australian households spent A$164 million on bicycle purchases. In six years this grew to A$210 million by 2012 (ABS, 2012c). Today half of Australian households have at least one bicycle at home (ABS, 2009b). In Queensland 134,200 people per year use bicycles to travel to non-work and non-study destinations (e.g. a trip to a cafe) (ABS, 2012b).
The implications for tourism in Queensland
The overall conclusion from this megatrend is that technology advances will continue to see increased capacity for people to travel. Travel modes will diversify and travel cost is unlikely to rise considerably above current levels. The motivation for travel will also intensify. People will have more reasons to make a trip as education, business, trade, conferences and healthcare will all be drivers. The increased mobility of people represents an opportunity for the Queensland, Australian and global tourism sectors.
Imag
e co
urt
esy
of
iSto
ckp
ho
tos
39

3.7 The Lucky Country
The Australian and Queensland economies emerged from the financial turbulence of the last decade remarkably well compared to other wealthy countries. Australia ranks near the top of the OECD list in terms of income growth, unemployment and debt levels.
However, this strong economic performance has been accompanied by an appreciation of the Australian dollar against many other currencies including the US dollar and the Euro. Incomes and salaries have risen and as a consequence, Queensland has become an expensive destination compared to most overseas locations. The high cost structure may be a barrier to investment. Being expensive, however, may also create enhanced status as boutique, exotic and luxurious.
Imag
e co
urt
esy
of
Tou
rism
an
d Ev
ents
Qu
een
slan
d
40 The Future of Tourism in Queensland

Queensland is a stable and wealthy developed-world destination offering high quality infrastructure, security and health services. This megatrend explores the upsides and downsides for tourism arising from Australia’s changing position in the global economy.
Australia’s strong economic performance. The Reserve Bank of Australia (Stevens, 2012) and economic commentators (The Economist, 2012) conclude that Australia’s economy has performed exceptionally well over the last ten years compared to many other wealthy countries. Australia is better placed in terms of economic growth, unemployment and central government debt (Figure 21). However, the strong economic performance is largely responsible for a high Australian dollar relative to other currencies. This is impacting the tourism, manufacturing and agricultural sectors. Long term (e.g. >2 years) forecasts of exchange rate movements are subject to much uncertainty. Nevertheless, there is a likelihood that Australia remains a wealthy and expensive destination on the global tourist map for decades to come.
-5
-4
-3
-2
-1
0
1
2
3
4
5
2001
2002
2003
2004
2005
2006
2007
2008
2009
2010
2011
GD
P gr
ow
th r
ate
(%)
OECD members
Australia
OECD members
Australia
OECD members
Australia0
1
2
3
4
5
6
7
8
9
2001
2002
2003
2004
2005
2006
2007
2008
2009
2010
2011
Un
emp
loym
ent
rate
(%
)
0
10
20
30
40
50
60
70
2001
2002
2003
2004
2005
2006
2007
2008
2009
2010
2011
Deb
t to
GD
P (%
)
0
0.2
0.4
0.6
0.8
1
1.2
2001
2002
2003
2004
2005
2006
2007
2008
2009
2010
2011
Exch
ange
rat
e
Figure 21. Australia’s strong economic performance, 2001 to 2011 (GDP growth, unemployment, central government debt to GDP ratio, US dollar exchange rate) Data source: World Bank (2013b)
41

80
85
90
95
100
105
110
Mar
200
8
Jun
200
8
Sep
200
8
Dec
200
8
Mar
200
9
Jun
200
9
Sep
200
9
Dec
200
9
Mar
201
0
Jun
201
0
Sep
201
0
Dec
201
0
Mar
201
1
Jun
201
1
Sep
201
1
Dec
201
1
Mar
201
2
Jun
201
2
Sep
201
2
Dec
201
2
Mar
201
3
Con
sum
er P
rice
Ind
ex
DomesticInternational
Figure 22. Quarterly index of prices paid by Australians for domestic versus international holiday travel and accommodation, 2008 to 2013 Data source: Australian Bureau of Statistics, Consumer Price Index, Weighted Average of Eight Capital Cities (ABS, 2013b).
Overseas holidays are getting cheaper. Over the past five years the prices paid by Australians for international holidays have been falling. In comparison the prices paid for domestic holidays have been increasing (Figure 22). This is revealed from historical consumer price index (CPI) data from the Australian Bureau Statistics for the categories of international and holiday travel and accommodation (ABS, 2013b). The rising value of the Australian dollar, the rise of low cost carriers and overseas financial conditions are contributing to this trend. This means that the Queensland tourism sector will struggle to compete on cost and will need to instead campaign on the basis of quality and value-for-money to win a greater portion of the domestic market.
Short term departures of residents from Australia are on the rise. Data from the Australian Bureau of Statistics reveals rapid growth in the number of Australian residents making short term trips to overseas destinations. During calendar year 2000 there were 3.5 million short term departures of Australian residents (ABS, 2013e). This grew to 8.2 million for calendar year 2012 representing 135 percent growth in little over a decade. Many people making short term departures will be travelling for whole, or partial, tourism purposes. Attracting these residents back to local destinations represents a sizeable growth market for Queensland.
The cost price squeeze. A dataset on the terms of trade (prices received versus prices paid) for the Queensland tourism sector was not available. However, industry representatives described the cost price squeeze as an important industry trend at a consultative workshop for this project. Data on wages and hotel room costs supports this observation (Figure 24). The average weekly wage of a Queensland employee has risen from $582 per week in 1998 to $1035 per week in 2012 (ABS, 2013a). That represents a 78 percent increase. In contrast the average cost of a hotel room night in Queensland has risen only 33 percent over the same time period from $127 to $169 (ABS, 2013f). Wealth growth in Australia has been accompanied by wage growth and increased operational and capital costs for the tourism sector. The increasingly tough cost competition from accommodation providers in the nearby Asia region is placing downward pressure on prices for hotel rooms and other tourist products. Given the high cost structure of the Queensland tourism sector the industry will struggle to win price wars against alternative destinations. Maintaining a cost competitive structure via efficient practices and systems will remain important. However, differentiation on product quality will also be important.
42 The Future of Tourism in Queensland

0
10
20
30
40
50
60
70
80
90
1991
1993
1995
1997
1999
2001
2003
2005
2007
2009
2011
2013
Tho
usa
nd
s o
f D
epar
ture
s Pe
r M
on
thFiji
Indonesia
Thailand
0
100
200
300
400
500
600
700
800
1991
1993
1995
1997
1999
2001
2003
2005
2007
2009
2011
2013
Tho
usa
nd
s o
f D
epar
ture
s Pe
r M
on
th All Countries
Figure 23. Short term departures of Australian residents to overseas destinations Source: Australian Bureau of Statistics (ABS, 2013e)
Queensland tourism companies face high costs. Compared to other countries within the OECD, and even more so within the developing Asia region, the cost of establishing and operating a tourist business in Queensland and Australia is relatively high. For many tourism operations staff wages are a major cost item. Analysis of data from the International Labour Office, an agency of the United Nations, reveals that the average hourly wage of a restaurant waiter (Figure 25) in Australia is A$21. This compares to A$17 in Canada, A$11 in Hong Kong, A$7 in Singapore, A$2 in Brazil and A$1 in Indonesia (ILO, 2010).
Lack of investment in the domestic market could hold back local potential. Generally, the growth in tourism investment in Queensland has been slightly greater than that for Australia although Queensland’s investment is more volatile (Deloitte Access Economics, 2011b). The large majority of Queensland tourism investment is private, accounting for more than approximately 70 percent of the total from 1990 to 2009 (Deloitte Access Economics, 2011b). However, it is the general view that tourism development does not offer real short-term profits, particularly in the accommodation sector (TRA, 2008). In 2010, return on hotel accommodation in Queensland was estimated to be at 8.3 percent (Deloitte Access Economics, 2011b). Between 2002 to 2008, returns declined largely due to rising construction costs and also the effects of the global financial crisis (Deloitte Access Economics, 2011b). Investment in local infrastructure is a challenge for the future development of the domestic tourism sector.
43

13th most expensive country (out of 57) to buy a Big Mac after Germany and before France. A Big Mac in Australia is twice as expensive as one in Hong Kong. Over time Australia has crept upwards in the Big Mac index listing and is above the United States and Britain. It is one indicator of rising overall costs in Australia compared to other countries (Figure 26).
The effect of holiday budgets on holiday destinations. Travel and holidays make up a significant proportion of an annual household budget, being one of the most expensive items purchased regularly by households (Buhalis and Law, 2008). A study of 4000 Australians showed that overseas holiday destinations, keeping all else constant, are more popular and therefore generally regarded as better value than domestic destinations (Oppewal et al., 2010). However, there was no evidence that an increase in holiday budget had a differential effect on the willingness to travel to an overseas holiday destination compared to a domestic destination (Oppewal et al., 2010).
The Ulysses Factor and the lure of expensive destinations. A more expensive tourist destination can deter some visitors but attract others. The visiting friends and relatives (VFR) category of tourist is usually deterred by higher prices. However, higher prices
0
20
40
60
80
100
120
140
160
180
200
0
200
400
600
800
1,000
1,200
1998
1998
1999
2000
2001
2001
2002
2003
2004
2004
2005
2006
2007
2007
2008
2009
2010
2010
2011
2012
Cost
of
a h
ote
l ro
om
($)
Wee
kly
earn
ings
($)
Weekly earnings ($)
Cost of hotel room ($ per room night)
Figure 24. Average weekly earnings (salaries) for Queensland workers and the average cost of a hotel room night, 1998 to 2012 Data source: Australian Bureau of Statistics (ABS, 2013a, 2013f).
Potential for increased investment? Investors primarily consider the net present value of revenue streams and cost streams over the life of a project. The forecast growth in visitor numbers for Queensland is likely to be associated with increased demand for hotel rooms. If industry costs are held constant (in real inflation-adjusted terms) while revenue increases, greater levels of investment would be expected. For example, a study by AECgroup (2012) finds that the Brisbane short term accommodation market can add between 299 (base demand) to 449 (target demand) rooms per year out to 2022 and still provide returns to investors. This is based on the increased demand generated by growth in tourist visitation and expenditure.
Burgenomics and the increased cost of visiting Australia. A “Big Mac” hamburger is a standardised product made in almost exactly the same way in all countries and regions. The Economist magazine routinely publishes the “Big Mac index” to explore the purchasing power of world currencies (The Economist, 2013). The index is used effectively in serious economic research and has been found a valid and useful indicator of a currency’s purchasing power (Clements et al., 2012). In 2004 a Big Mac in Australia cost A$3.25. In 2013 this rose to A$4.70 representing a compound annual growth rate (CAGR) of 4.2 percent. Today Australia is the
44 The Future of Tourism in Queensland

20.89
18.07 17.78 17.44 17.00
10.68
6.53
2.31 1.72 1.41 0.81 0.48
0
5
10
15
20
25
Au
stra
lia
Un
ited
Sta
tes
Can
ada
Italy
Un
ited
Kin
gdo
m
Ho
ng
Ko
ng
Sin
gap
ore
Braz
il
Phill
ipin
es
Chin
a
Ind
on
esia
Ind
ia
Ave
rage
ho
url
y w
age
(201
3 A
UD
)
Figure 25. Average hourly wage of a waiter (in 2013 AUD) in selected tourist destinations Data sources: Wages for a waiter sourced from the International Labour Office (ILO, 2010), overseas consumer price index from the World Bank (2013b), Australian consumer price index from the Australian Bureau of Statistics (ABS, 2013b) and currency exchange rates from OANDA (2013).
0.00
1.00
2.00
3.00
4.00
5.00
6.00
7.00
8.00
9.00
2004 2005 2006 2007 2008 2009 2010 2011 2012 2013
No
min
al p
rice
(USD
)
Australia Singapore
United States Britain
Switzerland
Figure 26. Cost of a Big Mac in selected countries, 2004 to 2013 Data source: The Economist (2013)
intensify the motivation to travel to a destination for tourists with an “interest in broadening cultural knowledge and discovering new places” (referred to by researchers as the “Ulysses Factor”) (Nicolau and Más, 2006). These tourists are interested in culture and are willing to pay higher prices. This was shown in a study of 2127 tourists in the country of Spain (Nicolau and Más, 2006). The travel distance was found to have a similar effect to price. For cultural and discovery oriented tourists a longer travel distance acted as an attractant and increased the motivation to visit. If Queensland is perceived as an expensive destination, with high prices, this may increase the motivation of domestic and overseas tourists to visit for cultural discovery.
Australia’s changing demographics. Another characteristic of Australia potentially impacting tourism markets is our ageing population. Demographic forecasts by the Australian Bureau of Statistics reveal the extent of change in the nation’s age profile. In 2011 around 14 percent of the Australian population was aged 65 years and over (ABS, 2011a). By 2056 this proportion is predicted to have risen to between 23 and 25 percent (ABS, 2008b). Over the same time period the median age will rise from 37 years to between 41.0 and 45.2 years (ABS, 2008b). The relative population engaged in the workforce will also shrink. By the year 2050 there will only be 2.7 people of working age to support every Australian aged 65, compared to 5 in 2010 and 7.5 in 1970 (Australian Government, 2010). This demographic change may impact tourism labour markets and the preferences of Australian holidaymakers.
The holiday making preferences of senior citizens. Typically, older age cohorts and retirees have relatively long trips at low expenditure per night. A relatively high proportion stay in caravan parks or commercial camping grounds and they are more likely to undertake cultural and heritage activities, visit local attractions as well as visit friends and relatives (TRA, 2008).
45

The implications for tourism in Queensland
Queensland is not likely to win the price war against alternative destinations such as the Philippines, Indonesia, Singapore, Fiji, Thailand and Malaysia in seeking to win both the domestic and developing-Asia market. With lower labour costs, construction costs, energy costs and overall capital costs, these countries are likely to be in a position to offer tourists lower prices. Air ticket prices have fallen with the rise of low cost carriers and are likely to take some time to increase again. Cutting costs will always remain critical for Queensland tourism companies. However, Queensland’s best option for competition is likely to be in the space of quality differentiation. A Queensland holiday can offer a clean, green, safe and friendly experience with developed world services. If tourist expectations are met then they may be willing to accept higher prices and make return visits.
Today’s older population already enjoys a more active outdoor lifestyle than the elderly of 20 to 30 years ago.
In terms of activities enjoyed while on holidays, eating out has become more popular with this age group over recent years (TRA, 2008). Demand for these activities may grow as Australia’s population ages.
Diversity within older age cohorts. Historically, the post-retirement tourism demographic has been viewed as homogenous in terms of travel patterns, service provision and out-of home activities. However, this will change in the decades ahead. There is emerging a healthy, active and mobile older-age cohort with phased exit (also referred to as “tapered retirement”) from the workforce (Westin and Vilhelmson, 2011). This emerging “young old” age group will challenge existing paradigms. They will remain more active in the community compared to previous generations. Today’s older population already enjoys a more active outdoor lifestyle than the elderly of 20 to 30 years ago (Hjorthol et al., 2010).
46 The Future of Tourism in Queensland

4 Our Methods
This study applied both qualitative and quantitative information and has been developed using evidence-based research. The information sources include industry reports, academic papers and current affairs articles. Datasets held by the Australian Bureau of Statistics, the Organisation for Economic Cooperation and Development, the United Nations, the World Bank, the United Nations World Tourism Organisation, the World Trade and Tourism Council and Tourism Research Australia about economic, social and environmental matters have been examined.
4.1 Types of Futures
The purpose of this study is to inform decisions about the tourism sector by constructing a narrative about the future. However, the future is not known with certainty. In this study evidence and imagination are balanced to construct a narrative of the future that is both credible and insightful. To achieve this we use the concept of the “futures cone” (Figure 27) to frame the study and identify megatrends.
The diameters of the circles in the futures cone can be considered inversely proportionate to the level of certainty about the future. At the current point in time the circle is a pinpoint because, if we can access accurate data, we have perfect certainty. As we project into the future we have three circles of increasing diameter and decreasing certainty.
Figure 27. The futures cone Data source: Adapted from Voros (2003) and Hancock and Bezold (1994)
The smallest circle is referred to as the “probable”. This relates to future events that can be forecast using historical data series and statistical inference. Predictions of rainfall patterns, population growth and economic growth may fall into this category. Given the limited availability of historic time-series data on many important trends and the limited ability for statistical forecasting of those data, the probable cone is unlikely to permit novel or insightful descriptions of futures.
The largest circle is referred to as the “possible”. This captures every event that could conceivably occur in the future. The problem with working in the possible space relates to credibility. If decision-makers cannot see a solid evidence base they are unlikely to use these narratives when making important choices.
Now
The future
Possible
Plausible
Probable
In the centre of the futures cone is the “plausible” space. This moves beyond the narrow and empirically derived outcomes in the probable space. However, it avoids the speculative and hard-to-substantiate nature of the “possible” space. The plausible cone is a balance of evidence and imagination.
While probable, plausible and possible futures all have a valid role, this study aims to reside within the plausible space. It means that evidence already exists for each megatrend currently occurring. However, the megatrends are projected to play-out to a greater extent in future decades.
47

4.2 Process for Identifying Megatrends
CSIRO Futures has conducted numerous megatrends analyses in different industry and community sectors. The aim is to craft an imaginative, relevant and evidence-based narrative of the future. Based on our experiences, and publications in the foresight literature (Voros, 2003), we have developed a generic process for megatrends identification. Stakeholder and expert consultation typically occurs at each, or most, stages of the process. The process used to identify megatrends for Queensland’s tourism sector involved six stages (Figure 28).
Figure 28. Stages of the foresight study
1
2
3
4
5
6
Background Study
Collate, analyse and document historic, current and forecast data directly relating to the industry or organisation being studied.
Horizon Scan
Zoom out from the industry or organisation and identify trends, issues and events in related sectors or fields that will have future impact.
Identify Trends
Screen and prioritize the information collated in the background study and environmental scan to identify trends.
Identify Megatrends
Collate, classify and synthesize the trends. Megatrends occur at the intersection of multiple trends.
Validate Megatrends
Reality check the proposed megatrends with stakeholders, experts and/or benchmark studies to ensure they are relevant, accurate and informative.
Construct a Narrative
Craft a narrative based on the trends and megatrends which tells an engaging and evidence-based story about the future of the industry or organisation.
48 The Future of Tourism in Queensland

4.3 Interviews with Experts
Interviews with key stakeholders and experts were undertaken to capture information about trends. The trends identified by the interview process were progressively reported back to the CSIRO Futures team who were concurrently conducting the horizon scanning process.
Key stakeholders were identified and contact details provided by the Queensland Department of Tourism, Major Events, Small Business and the Commonwealth Games. An email was sent by the Acting Director General of the Department to the key stakeholders identified, inviting them to contribute to the research. If the invitation was accepted, an interview was scheduled at a suitable time and date.
Forty key stakeholders were invited to participate in the research. Thirty-two interviews were completed; thus achieving an 80 percent response rate. Figure 29 illustrates the distribution across the range of stakeholders.
Figure 29. Stakeholder distribution for interviews
Interviews were undertaken via telephone using the convergent interviewing technique developed by the University of Queensland. Convergent interviewing aims to collect, analyse and interpret people’s experiences, opinions, attitudes, beliefs and knowledge that converge around a set of interviews (Dick, 1990; Williams and Lewis, 2005).
Using this technique, interviewers engage in a constant-comparative reflexive process that permits detailed rich content and theoretical sampling as researchers seek to continuously test emerging interpretations from early interviews in subsequent interviews. This process provides rigour and structure to the analysis despite the reliance on unstructured content.
Some interviews were one-on-one, others were undertaken using a lead interviewer, but with multiple project team members listening and on occasion asking additional clarifying questions. The style of the interview was conversational, taking between 30 and 60 minutes to complete.
49

In convergent interviews, a suitable opening question is one that encourages interviewees to talk about the strengths and weaknesses of the current issue. The interview in this instance opened with the question, “What do you think tourism will look like in the year 2033 and what are the key trends you can see emerging that will lead to this future?” The interviewer purposely did not contribute content to the conversation, using only prompting questions to continue the conversation, or on occasion using questions to validate points from previous interviews. The data collected were primarily in the form of interviewer notes, but where possible interviews were audio recorded and transcribed.
The following trends were identified by interviewees:
Category Observed Trend
Social People are becoming increasingly time poor
Worldwide the population is ageing
Increased focus on service
Increased desire to immerse in unique experiences and culture
Strong friend and family networks
Dual income households are now quite common
Change in activity preferences
Economic Increasing wealth in Asia
Strong Australian dollar
High wages
Competition with other sectors
Economic positions of other economies
Introduction of tourism taxes/ levies
Environmental Extreme weather events
Perception of mining/resource impacts
Urbanisation
Greater risk for environmental health issues
Environmental and social accreditations
Technological Aviation advances
How tourists communicate
Use of online portals
Information vs. data
Infrastructure requirements
Political Change to political cycles
Border security - ease of access
Barriers to investment
Structure of industry
Information collated from the interview process was progressively reviewed and discussed with CSIRO researchers and used to inform the set of megatrends outlined in this study. A detailed report on the interview process will be completed separately and made available.
4.4 Consultative Workshop
The Queensland Tourism 2033 workshop was held on 27 March 2013 at Rydges at Southbank, Brisbane. An introductory dinner was held on 26 March. A total of 46 people attended the workshop with diverse backgrounds within the tourism sector:
◆ Queensland Government Staff and Representatives
◆ Government trade organisations
◆ Trade and industry groups
◆ Regional and local tourism organisations
◆ Research, education and consultants
◆ Transport operators
◆ Tour operators
◆ Accommodation providers
◆ Events and attraction operators
◆ The CSIRO research team
The megatrends were mostly endorsed at the workshop. However, some important modifications, edits and improvements were identified. The feedback resulted in changing titles and content for some of the megatrends. The final set is captured in this document.
50 The Future of Tourism in Queensland

5 Conclusion
The seven megatrends presented in this report describe major challenges and opportunities for the Queensland tourism sector. Harnessing the opportunities, and managing the challenges, will help industry achieve growth objectives. The largest new growth opportunities come from (a) attracting local residents to Queensland as opposed to overseas destinations; and (b) attracting the emerging and developing Asia market.
We conclude this study with five characteristics of Queensland’s unique value proposition for tourism. We suggest that these characteristics can help Queensland achieve product differentiation and market growth in the highly competitive tourism landscape. The five characteristics of Queensland’s unique value proposition include:
◆ Safe and secure – The security and safety concerns of tourists are known to be a significant factor influencing their destination choice. On the world stage Queensland and Australia are highly socially and politically stable. Whilst able to deliver adrenaline and excitement fuelled holidays for the adventure seeking traveller, Queensland is a safe and secure destination on the world map.
◆ Clean – The rise of human mobility is associated with increased infectious illness and pandemic risk. Outbreaks in the past have significantly disrupted global tourism markets. Future events will heighten the awareness and importance of this factor. On the global stage Queensland has high levels of food, water and general hygiene and excellent healthcare services.
◆ Green (breathtakingly so) – Nature, wilderness and scenic beauty is fundamental to the motivations of tourists. Perceptions of these factors will influence both eco tourists and the general market to a significant extent. Queensland’s beautiful beaches, rainforests, deserts and “great-outdoors” can deliver world class nature experiences.
◆ Friendly and authentic – People will have expectations for authentic experiences and a critical and increasingly important component of that experience is social interaction with other people and local cultures. The friendliness factor has always been important but it will continue to grow in importance over coming decades. There will be a requirement for tourist operators to ensure they understand and deliver authentic Queensland friendliness in a manner that works for multiple cultures and age demographics.
◆ Worth it – The Queensland tourism sector will most likely continue to face higher operating, labour and capital costs compared to competing tourist sectors in many other countries. Whilst efficient operations and competitive pricing will always be important, a sole focus on being price competitive, particularly with other destinations in the Asia-Pacific region, would be unsustainable. The main differentiation for Queensland will be on the quality of visitor experiences. If the expectations are met, tourists are more likely to pay a price premium and travel longer distances.
Clearly there are many other important attributes of a successful tourism sector. However, these five have arisen with particular prominence from the interviews, workshops and megatrends within this foresight study. This foresight study will support the 20 year strategic planning process for tourism by the Queensland Government.
Imag
e co
urt
esy
of
Tou
rism
an
d Ev
ents
Qu
een
slan
d
51

ABS. (2008a). How Australians Use Their Time Catalogue Number 4153.0. Canberra: Australian Bureau of Statistics.
ABS. (2008b). Population Projections Australia 2006 to 2101 Cat. no. 3222.0. Canberra: Australian Bureau of Statistics.
ABS. (2009a). Australian Social Trends Catalogue Number 4102.0. Canberra: Australian Bureau of Statistics.
ABS. (2009b). Year Book Australia - Household transport use. Catalogue Number 1301.0. Canberra: Australian Bureau of Statistics.
ABS. (2011a). Australian Demographic Statistcs, June 2011 Cat. no. 3101.0. Canberra: Australian Bureau of Statistics.
ABS. (2011b). Australian Social Trends December 2011 Catalogue Number 4102.0. Canberra: Australian Bureau of Statistics.
ABS. (2011c). International Trade in Goods and Services, Australia. Catalogue Number 5368.0. Canberra: Australian Bureau of Statistics.
ABS. (2012a). Counts of Australian Businesses, including Entries and Exits, Jun 2007 to Jun 2011 Catalogue Number 8165.0. Canberra: Australian Bureau of Statistics.
ABS. (2012b). Environmental Issues: Waste Management, Transport and Motor Vehicle Usage. Catalogue Number 4602.0.55.002. Canberra: Australian Bureau of Statistics.
ABS. (2012c). Sport and recreation: A statistical overview. Catalogue Number 4156.0. Canberra: Australian Bureau of Statistics.
ABS. (2013a). Average Weekly Earnings, Australia. Catalogue Number 6302.0. Canberra: Australian Bureau of Statistics.
ABS. (2013b). Consumer Price Index, Australia. Catalogue Number: 6401.0. Canberra: Australian Bureau of Statistics.
ABS. (2013c). International Trade in Goods and Services, Australia Catalogue Number 5368.0. Canberra: Australian Bureau of Statistics.
ABS. (2013d). Labour Force, Australia, Detailed, Quarterly. Catalogue Number: 6291.0.55.003. Canberra: Australian Bureau of Statistics.
ABS. (2013e). Overseas Arrivals and Departures, Australia for April. Catalogue Number 3401.0. Canberra: Australian Bureau of Statistics.
ABS. (2013f). Tourist Accommodation, Australia. Catalogue Number 8635.0. Canberra: Australian Bureau of Statistics.
Access Economics. (2008). Exceptional Returns: The Value of Investing in Health R&D in Australia II. Canberra: Prepared for the Australian Society for Medical Research.
ACMA. (2012a). Australia’s progress in the digital economy Communications report 2011-12 series, Report 2. Canberra: Australian Communications and Media Authority.
ACMA. (2012b). Smartphones and tablets Communications report 2011-12 series, Report 3. Canberra: Australian Communications and Media Authority.
AECgroup. (2012). Brisbane hotel investment study A Consultancy Report by AECgroup for Brisbane Marketing. Brisbane.
AECOM. (2011). High Speed Rail Study - Phase 1. Sydney: AECOM Australia Pty Ltd.
Alan Pounds, J., Bustamante, M. R., Coloma, L. A., Consuegra, J. A., Fogden, M. P. L., Foster, P. N., . . . Young, B. E. (2006). Widespread amphibian extinctions from epidemic disease driven by global warming. Nature, 439(7073), 161-167.
Allen, D. E., & Yap, G. (2009). Modelling Australian Domestic Tourism Demand: A Panel Data Approach School of Accounting, Finance and Economics & FEMARC Working Paper Series, Working Paper 0910: Edith Cowan University.
Arezki, R., & Brückner, M. (2011). Food Prices and Political Instability. IMF Working Paper, 11(62), 1-22.
Australian Government. (2010). The 2010 intergenerational report. Canberra: Treasury, Australian Government.
BAC. (2013). Passenger statistics - Passenger movements. Brisbane: Brisbane Airport Corporation.
Backer, E. (2012). VFR travel: It is underestimated. Tourism Management, 33(1), 74-79. doi: http://dx.doi.org/10.1016/j.tourman.2011.01.027
Ballou, R. H. (2007). The evolution and future of logistics and supply chain management. European Business Review, 19(4), 332-348.
Bell, S., Tyrvainen, L., Sievanen, T., Probstl, U., & Simpson, M. (2007). Outdoor Recreation and Nature Tourism: A European Perspective. Living Reviews in Landscape Research, 1(2).
Bellemare, M. F. (2011). Rising Food Prices, Food Price Volatility, and Political Unrest. SSRN eLibrary. doi: 10.2139/ssrn.1874101
BITRE. (2013). Domestic Air Fare Indexes. Canberra: Bureau of Infrastructure, Transport and Regional Economics.
Boeing. (2012). Current Market Outlook 2012-2031. Seattle: Boeing.
Buhalis, D., & Law, R. (2008). Progress in information technology and tourism management: 20 years on and 10 years after the Internet—The state of eTourism research. Tourism Management, 29(4), 609-623.
Butchart, S. H. M., Walpole, M., Collen, B., van Strien, A., Scharlemann, J. P. W., Almond, R. E. A., . . . Watson, R. (2010). Global Biodiversity: Indicators of Recent Declines. Science, 328(5982), 1164-1168.
Castillo-Manzano, J. I., & López-Valpuesta, L. (2010). The decline of the traditional travel agent model. Transportation Research Part E: Logistics and Transportation Review, 46(5), 639-649.
Chen, G., Bao, J., & Songshan, S. H. (2013). Segmenting Chinese Backpackers by Travel Motivations. International Journal of Tourism Research, DOI: 10.1002/jtr.1928.
Clements, K. W., Lan, Y., & Seah, S. P. (2012). The Big Mac Index two decades on: an evaluation of burgernomics. International Journal of Finance & Economics, 17(1), 31-60. doi: 10.1002/ijfe.432
Common Sense Media. (2012). Social Media, Social Life: How Teens View Their Digital Lives Common Sense Meda Research Study. San Francisco.
Connell, J. (2006). Medical tourism: Sea, sun, sand and … surgery. Tourism Management, 27(6), 1093-1100.
Creedy, S. (2008). Airbus A380 flight tests natural gas as a fuel alternative. Sydney: The Australian Newspaper, 8 February.
CSIRO. (2011). Flight path to Sustainable Aviation. Australia: CSIRO National Research Flagships.
DEHP. (2012). State of the Environment Queensland 2011. Brisbane: Department of Environment and Heritage Protection.
Deloitte Access Economics. (2011a). Medical tourism in Australia Report prepared for Department of Resources, Energy and Tourism. Canberra.
Deloitte Access Economics. (2011b). Tourism Investment in Queensland Report prepared for the Department of Employment, Economic Development and Innovation. Canberra.
DFAT. (2011). Composition of trade in Australia. Canberra: Australian Government, Department of Foreign Affairs and Trade.
DIC. (2011). Student visa program trends 2004-05 to 2010-11 BR0109 Student visa program trends. Canberra: Department of Immigration and Citizenship.
Dick, B. (1990). Convergent Interviewing. Brisbane: Interchange.
Dolnicar, S., Crouch, G. I., Devinney, T., Huybers, T., Louviere, J. J., & Oppewal, H. (2008). Tourism and discretionary income allocation. Heterogeneity among households. Tourism Management, 29(1), 44-52.
Du, J., Huo, Q., Sun, L., Sun, J. (2011). Snap and Translate using Windows
Phone. Paper presented at the Eleventh International Conference on Document Analysis and Recognition, 18-21 September, Beijing.
Dwyer, L., Forsyth, P., King, B., & Seetaram, N. (2010). MIgration-related determinants of Australian inbound and outbound tourism flows. Australia: Sustainable Tourism Cooperative Research Centre.
Dyer, P., Gursoy, D., Sharma, B., & Carter, J. (2007). Structural modeling of resident perceptions of tourism and associated development on the Sunshine Coast, Australia. Tourism Management, 28(2), 409-422.
Ellison, N., Steinfield, C., & Lampe, C. (2007). The benefits of Facebook “friends:” social capital and college students’ use of online social network sites. Journal of Computer-Mediated Communciation, 12(1143-1168).
FAO. (2003). Agriculture, food and water: a contribution to the World Water Development Report. Rome: Food and Agriculture Organisation of the United Nations.
FAO. (2009). How to feed the world in 2050. Rome: Food and Agriculture Organisation.
Garcia, P. G., Gomez, C. L., & Bringas, P. G. (2012). Towards a more efficient and personalised advertisement content in on-line social networks. Paper presented at the Proceedings of the 5th Ph.D. workshop on Information and knowledge, Maui, Hawaii, USA.
Garton, L., Haythornthwaite, C., & Wellman, B. (1997). Studying Online Social Networks. Journal of Computer-Mediated Communication, 3(1).
Gleditsch, N. P., Furlong, K., Hegre, H., Lacina, B., & Owen, T. (2006). Conflicts over shared rivers: Resource scarcity or fuzzy boundaries. Political Geography 25, 361-382.
Gohardani, A. S., Doulgeris, G., & Singh, R. (2011). Challenges of future aircraft propulsion: A review of distributed propulsion technology and its potential application for the all electric commercial aircraft. Progress in Aerospace Sciences, 47, 369-391.
Gretzel, U. (2006). Consumer generated content-trends and implications for branding. e-Review of Tourism Research, 4(3), 9-11.
Guttentag, D. A. (2010). Virtual reality: Applications and implications for tourism. Tourism Management, 31(5), 637-651.
Hancock, T., & Bezold, C. (1994). Possible futures, preferable futures. Healthcare Forum Journal, 37(2), 23-29.
Hannam, K., & Diekmann, A. (2010). From backpacking to flashpacking: Developments in backpacker tourism research. In K. Hannam & A. Diekmann (Eds.), Beyond backpacker
References
52 The Future of Tourism in Queensland

tourism: Mobilities and experiences. Bristol: Channel View Publications.
Henderson, J. C. (2003). Terrorism and Tourism: Managing the Consequences of the Bali Bombings. Journal of Travel & Tourism Marketing, 15(1), 41-58.
Henderson, J. C. (2007). Corporate social responsibility and tourism: hotel companies in Phuket, Thailand, after the Indian Ocean tsunami. Hospitality Management, 26(228-239).
Hjorthol, R., Levin, L., & Siren, A. (2010). Mobility in different generations of older persons: The development of daily travel in different cohorts in Denmark, Norway and Sweden. Journal of Transport Geography, 18(5), 624-633.
HSBC. (2011). HSBC Trade Connections: Trade Forecast Quarterly Update October 2011.
Hsiao, I. K., Chen, C., Tseng, W. C., Ju, L. F., & Huang, B. W. (2008). Assessing impacts of SARS and Avian Flu on international tourism demand to Asia. Tourism Management, 29, 917–928.
Hyun, M. Y., & O’Keefe, R. M. (2012). Virtual destination image: Testing a telepresence model. Journal of Business Research, 65(1), 29-35.
IATA. (2012). Fact Sheet: Fuel. Montreal, Canada: International Air Transport Association.
IBISWorld. (2011). Queensland floods: The economic impact IBISWorld Special Report. Melbourne: IBISWorld Pty Ltd.
ILO. (2010). International Labour Offfice Database. Geneva: International Labour Office Department of Statistics.
IMF. (2012). World Economic Outlook October 2012: Coping with High Debt and Sluggish Growth. Washington D.C.: International Monetary Fund.
IPCC. (2007). Climate Change 2007: Synthesis Report IPCC Fourth Assessment Report (AR4). Geneva: Intergovernmental Panel on Climate Change.
IPCC. (2012). Managing the Risks of Extreme Events and Disasters to Advance Climate Change Adaptation Special Report of the Intergovernmental Panel on Climate Change. London: Cambridge University Press.
IWMI. (2007). Water for food, water for life: A comprehensive assessment of water management in agriculture. London: Earthscan.
Jacobsen, J. K. S. (2000). Anti-tourist attitudes: Mediterranean charter tourism. Annals of Tourism Research, 27(2), 284-300.
Jacobsen, J. K. S., & Munar, A. M. (2012). Tourist information search and destination choice in a digital age. Tourism Management Perspectives, 1(0), 39-47.
Kester, J. (2013). 2012 International Tourism Results and Prospects for 2013. Paper presented at the UN World Tourism Organization News Conference, January 29, Madrid, Spain.
Khan, K., Arino, J., Hu, W., Raposo, P., Sears, J., Calderon, F., . . . Gardam, M. (2009). Spread of a Novel Influenza A (H1N1) Virus via Global Airline Transportation. New England Journal of Medicine, 361(2), 212-214. doi: doi:10.1056/NEJMc0904559
Kim, K., Uysal, M., & Sirgy, M. J. (2013). How does tourism in a community impact the quality of life of community residents? Tourism Management, 36(0), 527-540.
Kozak, M., Crotts, J. C., & Law, R. (2007). The impact of the perception of risk on international travellers. International Journal of Tourism Research, 9(4), 233-242.
Kulendran, N., & Wilson, K. (2010). Is there a relationship between international trade and international travel? Applied Economics, 32(8), 1001-1009.
Larsen, S., Ogaard, T., & Brun, W. (2011). Backpackers and mainstreamers: realities and myths. Annals of Tourism Research, 38(2), 690–707.
Leggat, P. A., & Wilks, J. (2009). Overseas Visitor Deaths in Australia, 2001 to 2003. Journal of Travel Medicine, 16(4), 243-247.
MacPherson, D., Gushulak, B., Baine, W., Bala, S., Gubbins, P., Holtom, P., & Segarra-Newnham, M. (2009). Population Mobility, Globalization, and Antimicrobial Drug Resistance. Emerging Infectious Diseases, 15(11).
Maslow, A. H. (1943). A Theory of Human Motivation. Psychological Review, 50(4), 370-396.
McCabe, S. (2009). Who is a Tourist? Coneptual and Theoretical Developments. In J. Tribe (Ed.), Philosophical Issues in Tourism. Great Britain: Channel View Publications.
Mehmetoglu, M. (2007). Nature-based tourists: The Relationship Between their Trip Expenditures and Activities. Journal of Sustainable Tourism, 15(2), 200-215.
Min-En, A. T. (2006). Travel stimulated by international students in Australia. International Journal of Tourism Research, 8(6), 451-468.
Mohsin, A., & Ryan, C. (2003). Backpackers in the Northern Territory of Australia: motives, behaviors and satisfactions. International Journal of Tourism Research, 5(2), 113-131.
Moreno, E. (2013). Backpacking industry turns to Asia as European visitor numbers fall. Monash University: Mojo Monash Journalism, University of Monash.
NBSC. (2012). Disposable Income per Capita. China: National Bureau of Statistics of China.
Nicolau, J. L., & Más, F. J. (2006). The influence of distance and prices on the choice of tourist destinations: The moderating role of motivations. Tourism Management, 27(5), 982-996. doi: http://dx.doi.org/10.1016/j.tourman.2005.09.009
Nygren, E., Aleklett, K., & Höök, M. (2009). Aviation fuel and future oil production scenarios. Energy Policy, 37(10), 4003-4010. doi: http://dx.doi.org/10.1016/j.enpol.2009.04.048
OANDA. (2013). Historical Exchange Rates. Singapore: OANDA.
OECD. (2011). Resource Productivity in the G8 and the OECD. OECD Publishing.
OECD. (2012a). Holidays are a serious business Retrieved 26 August 2012, from http://www.oecd.org/general/holidaysareaseriousbusiness.htm
OECD. (2012b). OECD Environmental Outlook to 2050: The Consequences of Inaction. Paris: Organisation for Economic Cooperation and Development.
OECD. (2012c). OECD Tourism Trends and Policies 2012. Paris: Organisation for Economic Cooperation and Development.
OESR. (2012). Census 2011: Diversity in Queensland. Brisbane: Office of Economic and Statistical Research.
OESR. (2013). Overseas exports of goods by industry, value, Queensland, 2001–02 to 2011–12. Brisbane: Office of Economic and Statistical Research, Queensland Government.
Oppewal, H., Huybers, T., & Crouch, G. I. (2010). How do Australians choose holiday destinations and experiences? Modelling consumer choice. Australia: CRC for Sustainable Tourism.
Paris, C. M. (2012). Flashpackers: An Emerging Sub-Culture? Annals of Tourism Research, 39(2), 1094-1115.
Parmesan, C. (2006). Ecological and evolutionary responses to recent climate change. Annual review of Ecology, Evolution and Systematics, 37, 637-669.
Prideaux, B. (2002). The cybertourist. In G. M. S. Dann (Ed.), The tourist as a metaphor of the social world. New York: CABI Publishing.
Priest, P. C., Duncan, A. R., Jennings, L. C., & Baker, M. G. (2011). Thermal Image Scanning for Influenza Border Screening: Results of an Airport Screening Study. Plos One, 6(1), 1-7.
PwC. (2010). Review of consumer protection in the travel and travel related services market. Australia: Pricewaterhouse Coopers.
QTT. (2013). Overseas Migration, Queensland 2011-12. Brisbane: Queensland Treasury and Trade.
Quah, D. (2011). The global economy’s shifting centre of gravity. Global Policy, 2(1), 3-9.
Queensland Government. (2012). DestinationQ Blueprint 2012-2015. Brisbane: Queensland Government.
RBA. (2011). Australia’s Tourism Industry Bulletin. Sydney: Reserve Bank of Australia.
RBA. (2013). Exchange Rate Data. Sydney: Reserve Bank of Australia.
ReAct. (2012). Burden of Antibiotic Resistance. Sweden: Action on Antibiotic Resistance (http://www.reactgroup.org/).
Refsland, S. T., Ojika, T., Addison, A. C., & Stone, R. (2000). Virtual Heritage: Breathing New Life into Our Ancient Past. IEEE Multimedia, 7(2), 20-21.
Richards, G. (2011). An Economic Contribution that Matters. In UNWTO (Ed.), The Power of Youth Travel, Affiliate Members Report, Volume 2. Spain: UN World Tourism Organisation.
Ryan, T., & Xenos, S. (2011). Who uses Facebook? An investigation into the relationship between the Big Five, shyness, narcissism, loneliness, and Facebook usage. Computers in Human Behavior, 27(5), 1658-1664.
Secretariat of the Convention on Biological Diversity. (2010). Global Biodiversity Outlook 3. Montreal.
Shaw, M. M. T., & Leggat, P. A. (2003). Country profile: travelling to Australia. Travel Medicine and Infectious Disease, 1(2), 126-133.
Sparks, B., & Pan, G. W. (2009). Chinese Outbound tourists: Understanding their attitudes, constraints and use of information sources. Tourism Management, 30(4), 483-494.
Spellberg, B., Blaser, M., & Guidos, R. J. (2011). Combating Antimicrobial Resistance: Policy Recommendations to Save Lives. Clinical Infectious Diseases, 52, 397-428.
Stevens, G. (2012). The Lucky Country Address to The Anika Foundation Luncheon Supported by Australian Business Economists and Macquarie Bank. Sydney: The Reserve Bank of Australia.
TA. (2011). 2020 New research to help Australian tourism reach its potential Tourism 2020 Research. Canberra: Tourism Australia.
TA. (2013). Thumbs up from Australians for domestic beach holidays Tourism Fact Sheets: Tourism Australia.
TEQ. (2013a). Tourism Economic Key Facts. Brisbane: Tourism and Events Queensland.
TEQ. (2013b). Tourism Facts and Figures: June Update. Brisbane: Tourism and Events Queensland, Queensland Government.
TEQ. (2013c). Tourism facts and figures: March update. Brisbane: Tourism and Events Queensland, Queensland Government.
53

Tham, A., Croy, G., & Mair, J. (2013). Social Media in Destination Choice: Distinctive Electronic Word-of-Mouth Dimensions. Journal of Travel & Tourism Marketing, 30(1-2), 144-155.
The Economist. (2012). Australia’s economy. Sydney: The Economist Group.
The Economist. (2013). The Big Mac Index. Sydney: The Economist Group.
The World Bank. (2013). Evaluation of High-Speed Rail Program Should Consider Wider Economic Benefits. Press release 21 January. Beijing: The World Bank.
Tourism Forecasting Committee. (2012). Tourism Forecasts - Updated May. Brisbane: Tourism Queensland.
Tourism Resource Consultants. (2009). New Zealand Cycleway Market Research Report. New Zealand: Southland District Council.
Tourism Victoria. (2011). Victoria’s cycle tourism action plan 2011-2015. Melbourne: Government of Victoria.
TQ. (2012a). International Backpacker Market. Brisbane: Tourism Queensland.
TQ. (2012b). Tourism Forecasts - Queensland November 2012. Brisbane: Tourism Queensland.
TQ. (n.d.). Infosheet. Brisbane: Tourism Queensland.
TRA. (2008). Through the looking glass: The future of domestic tourism in Australia Reprt prepared for Department of Resources, Energy and Tourism. Canberra: Tourism Research Australia.
TRA. (2009). Snapshots - Backpacker accommodation in Australia. Canberra: Australian Government Department of Resources, Energy and Tourism, Tourism Research Australia.
TRA. (2011). Internet Use in Trip Planning & Booking Snapshots 2011. Canberra: Tourism Research Australia.
TRA. (2012a). Forecast 2012 Issue 2. Canberra: Tourism Research Australia.
TRA. (2012b). International Visitors in Australia September 2011 Quarterly Results of the International Visitor Survey. Canberra: Tourism Research Australia.
TRA. (2012c). International Visitors in Australia June 2012 Quarterly Results of the International Visitor Survey. Canberra: Tourism Research Australia.
TRA. (2012d). Travel by Australians December 2012 Quarterly Results of the National Visitor Survey. Canberra: Tourism Research Australia.
TRA. (2013a). International Visitors in Australia December 2012 Quarterly Results in International Visitor Survey. Canberra: Tourism Research Australia.
TRA. (2013b). State Tourism Satellite Accounts 2011-12. Canberra: Tourism Research Australia.
TRA. (2013c). Travel by Australians December 2012 Quarterly Results of the National Visitor Survey. Canberra: Tourism Research Australia.
Tripadvisor.com. (2013). Fact Sheet Retrieved 20 March, 2012, from http://www.tripadvisor.com/pages/factsheet/html
Ulrich, P., Duranton, S., Koehler, M. (2009). Planes, Trains and Automobiles: Boston Consulting Group.
UNCCD. (2011). Desertification: a visual synthesis. Bonn, Germany: United Nations Convention to Combat Desertification.
United Nations. (2012). World Urbanization Prospects: The 2011 Revision. New York: United Nations Department of Economic and Social Affairs.
UNWTO. (2002). Tourism Proves as a Resilient and Stable Economic Sector. Spain: UN World Tourism Organization.
UNWTO. (2008). Youth Travel Matters - Understanding the Global Phenomenon of Youth Travel. Spain: UN World Tourism Organization.
UNWTO. (2011). The Power of Youth Travel Affiliate Members Report, Volume 2. Spain: UN World Tourism Organisation.
UNWTO. (2012). UNWTO Tourism Highlights 2012 Edition. Spain: UN World Tourism Organisation.
US EIA. (2013). Short term energy outlook. Washington DC: US Energy Information Administration.
van ben Berg, A. E., Hartig, T., & Staats, H. (2007). Preference for Nature in Urbanized Societies: Stress, restoration, and the Pursuit of Sustainability. Journal of Social Issues, 63(1), 79-96.
Voros, J. (2003). A generic foresight process framework. Foresight, 5(3), 10-21.
Webster, P. J., Holland, G. J., Curry, J. A., & Chang, H. R. (2005). Changes in Tropical Cyclone Number, Duration, and Intensity in a Warming Environment. Science, 309, 1844-1846.
WEF. (2013a). Global Risks 2013 Eighth Edition Insight Report. Switzerland: World Economic Forum.
WEF. (2013b). The Travel & Tourism Competitiveness Report 2013 Insight Report. Geneva: World Economic Forum.
Wellman, B., Carrington, P., & Hall, A. (1988). Networks as personal communities. In B Wellman & S.D. Berkowitz (Eds.) Social structures: A network approach. Cambridge: Cambridge University Press.
Westin, K., & Vilhelmson, B. (2011). Old yet young: travel-activity
patterns among new pensioners in Sweden. Social Space Journal, 1, 1-21.
Wilder-Smith, A. (2006). The severe acute respiratory syndrome: impact on travel and tourism. Travel Medicine and Infectious Diseases, 4, 53-60.
Wilks, J., Pendergast, D. L., & Wood, M. T. (2002). Overseas Visitor Deaths in Australia: 1997–2000. Current Issues in Tourism, 5(6), 550-557.
Williams, W., & Lewis, D. (2005). Convergent interviewing: a tool for strategic investigation. Strategic Change, 14, 219-229.
Wilson, D., Kelston, A. L., & Ahmed, S. (2010). Is this the ‘BRICs Decade’? BRICs Monthly (Vol. 10/03): Goldman Sachs Global Economics, Commodities and Strategy Research.
Woodbridge, J. (2011). The Australian Touism Export Council’s Backpacker & Youth Tourism Advisory Panel. In UNWTO (Ed.), The Power of Youth Travel, Affiliate Members Report, Volume 2. Spain UN World Tourism Organsiation.
World Bank. (2012). World DataBank, from http://databank.worldbank.org/data/home.aspx
World Bank. (2013a). Intenational tourism, number of arrivals World Development Indicators. Washington D.C.: The World Bank.
World Bank. (2013b). World Development Indicators Database. Washington D.C.: The World Bank.
WTTC. (2013). Travel & Tourism Economic Impact 2013 Country Profiles. United Kingdom: World Travel & Tourism Council.
Yap, G., & Allen, D. (2011). Investigating other leading indicators influencing Australian domestic tourism demand. Mathematics and Computers in Simulation, 81(7), 1365-1374.
Ye, Q., Law, R., Gu, B., & Chen, W. (2011). The influence of user-generated content on traveler behavior: An empirical investigation on the effects of e-word-of-mouth to hotel online bookings. Computers in Human Behavior, 27(2), 634-639.
Yeoman, I., Brass, D., & McMahon-Beattie, U. (2007). Current issue in tourism: The authentic tourist. Tourism Management, 28(4), 1128-1138.
Yin, X. (2005). New Trends of Leisure Consumption in China. Journal of Family and Economic Issues, 26(1), 175-182.
Yu, L., Asur, S., & Huberman, B. (2011). What Trends in Chinese Social Media. Paper presented at the The 5th SNAKDD Workshop on Social Network Mining and Analysis, California.
54 The Future of Tourism in Queensland


56 The Future of Tourism in Queensland
CONTACT USt 1300 363 400 +61 3 9545 2176 e [email protected] w www.csiro.au
YOUR CSIROAustralia is founding its future on science and innovation. Its national science agency, CSIRO, is a powerhouse of ideas, technologies and skills for building prosperity, growth, health and sustainability. It serves governments, industries, business and communities across the nation.