Embed Size (px)
Citation preview

The Future of Forecasting
MIT SCM Capstone ProjectEvan Humphrey | Federico Laiño
Advisor | Inma Borrella

MIT Supply Chain Management Program Evan Humphrey | Federico Laiño
I N T R O D U C T I O N M E T H O D O L O G Y F I N D I N G S C O N C L U S I O N S
Agenda
2
1
Introduction
1. Company Background
2. Motivation
3. Objective and Scope
2
Methodology
1. Overview
2. Discovery
3. Diagnosis
4. Demand Sensing Approaches
3
Findings
1. Characterization of Demand
2. Current Forecasting Process
3. Forecast Accuracy Analysis
4. Suggestions for Implementing Demand Sensing
4
Conclusions
1. Takeaways
2. Future work

Introduction1

MIT Supply Chain Management Program Evan Humphrey | Federico Laiño
I N T R O D U C T I O N M E T H O D O L O G Y F I N D I N G S C O N C L U S I O N S
Company Background
4
1960sCompany Founded
Originally ‘Frontier Contact Lenses’ from
Buffalo, New York. Later moved to
Jacksonville, Florida
1970sDeveloped Etafilcon
Chief Optometrist develops new
material, Etafilcon, that allowed
production of soft lenses.
1980sAcquired by J&J
Division was renamed to ‘Vistakon’.
Developed automated production system,
leading to the creation of the Acuvue brand.
1990s1 Day Lenses
Created first low-cost, daily disposable lens. Expanded globally to
Brazil, Japan, Singapore and UK. Changed name
to JJVC.
2000+Market Leader
JJVC gains and maintains leadership
in the contact lens market.

MIT Supply Chain Management Program Evan Humphrey | Federico Laiño
I N T R O D U C T I O N M E T H O D O L O G Y F I N D I N G S C O N C L U S I O N S
Company Background
5
3% of revenue1% of volume
LATAM
38% of revenue32% volume
US and Canada
15% of revenue16% of volume
Asia Pacific
21% of revenue26% volume
Japan
21% of revenue22% volume
Europe, Middle East and Africa
Production + DCJacksonville, FL
DCEVC – London, UK
DCHDC - Tokyo
$3Bn Business4Bn Lenses
22.000 SKUs
Key Insights
ProductionLimerick, Ireland

MIT Supply Chain Management Program Evan Humphrey | Federico Laiño
We must constantly strive to reduce our cost in order to maintain reasonable prices. Customers' orders must be serviced promptly and accurately.
- Lines 3 and 4 of the J&J Credo
“
6

MIT Supply Chain Management Program Evan Humphrey | Federico Laiño
I N T R O D U C T I O N M E T H O D O L O G Y F I N D I N G S C O N C L U S I O N S
Motivation
7
Market ContextContact lens global leader by market share but faces competition from other large companies and disruptive entrants.
Cost EfficiencyDriven to continuously improve forecast accuracy and capitalize on lower inventory costs and higher service levels.
Production CapacityOwns high-end manufacturing lines
that are at near-maximum utilization with expansion requiring considerable
CAPEX and time.
Forecast AccuracyWants to explore the potential of
demand sensing as a means to improve forecast accuracy
MIT Supply Chain Management Program Evan Humphrey | Federico Laiño
I N T R O D U C T I O N M E T H O D O L O G Y F I N D I N G S C O N C L U S I O N S
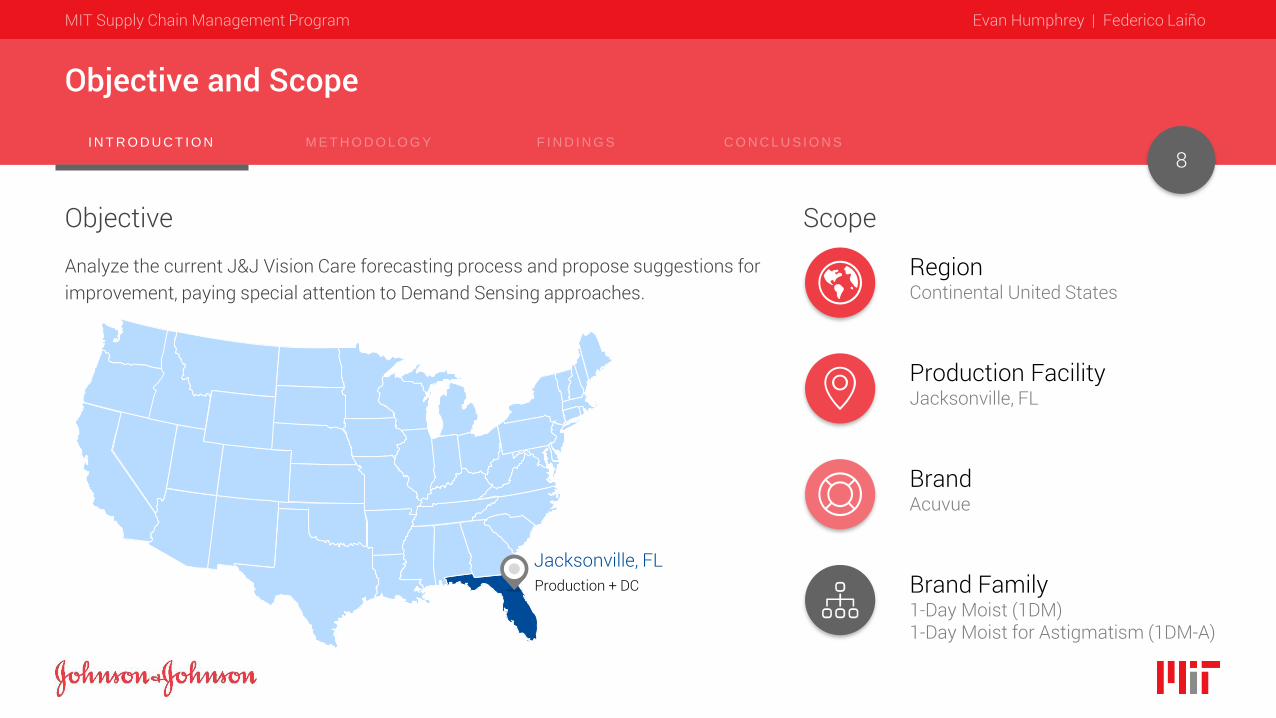
Objective and Scope
8
BrandAcuvue
Production FacilityJacksonville, FL
RegionContinental United States
Brand Family1-Day Moist (1DM)1-Day Moist for Astigmatism (1DM-A)
Production + DCJacksonville, FL
Analyze the current J&J Vision Care forecasting process and propose suggestions for improvement, paying special attention to Demand Sensing approaches.
ScopeObjective

MIT Supply Chain Management Program Evan Humphrey | Federico Laiño
Methodology2

MIT Supply Chain Management Program Evan Humphrey | Federico Laiño
I N T R O D U C T I O N M E T H O D O L O G Y F I N D I N G S C O N C L U S I O N S
Overview
10
Sep Oct Nov Dec Jan Feb Mar Apr May JunTasks
Phase I
Objective and Scope
Discovery
Demand Sensing Approaches
Phase II
Diagnosis
Capstone Write-up

MIT Supply Chain Management Program Evan Humphrey | Federico Laiño
I N T R O D U C T I O N M E T H O D O L O G Y F I N D I N G S C O N C L U S I O N S
Discovery
11
01 02
Discovery
03
ForecastingDemand PlanningS&OP
Interviews02
Jacksonville, FLProduction FacilityDistribution CenterS&OP Interviews
Site Visit03
SCM HistoryForecasting Techniques
Forecasting MeasuresDemand Sensing Case Studies
Literature Review01

MIT Supply Chain Management Program Evan Humphrey | Federico Laiño
I N T R O D U C T I O N M E T H O D O L O G Y F I N D I N G S C O N C L U S I O N S
Diagnosis
12
1 2 3
Demand Characterization
Pareto AnalysisTime SeriesDistributionStatistics
Forecasting Process Mapping
Forecast Accuracy Analysis
Cycle TimeFrameworkData InputsForecasts
Pareto BreakdownComparison with
Alternative Forecasts

MIT Supply Chain Management Program Evan Humphrey | Federico Laiño
I N T R O D U C T I O N M E T H O D O L O G Y F I N D I N G S C O N C L U S I O N S
Demand Sensing Approaches
13
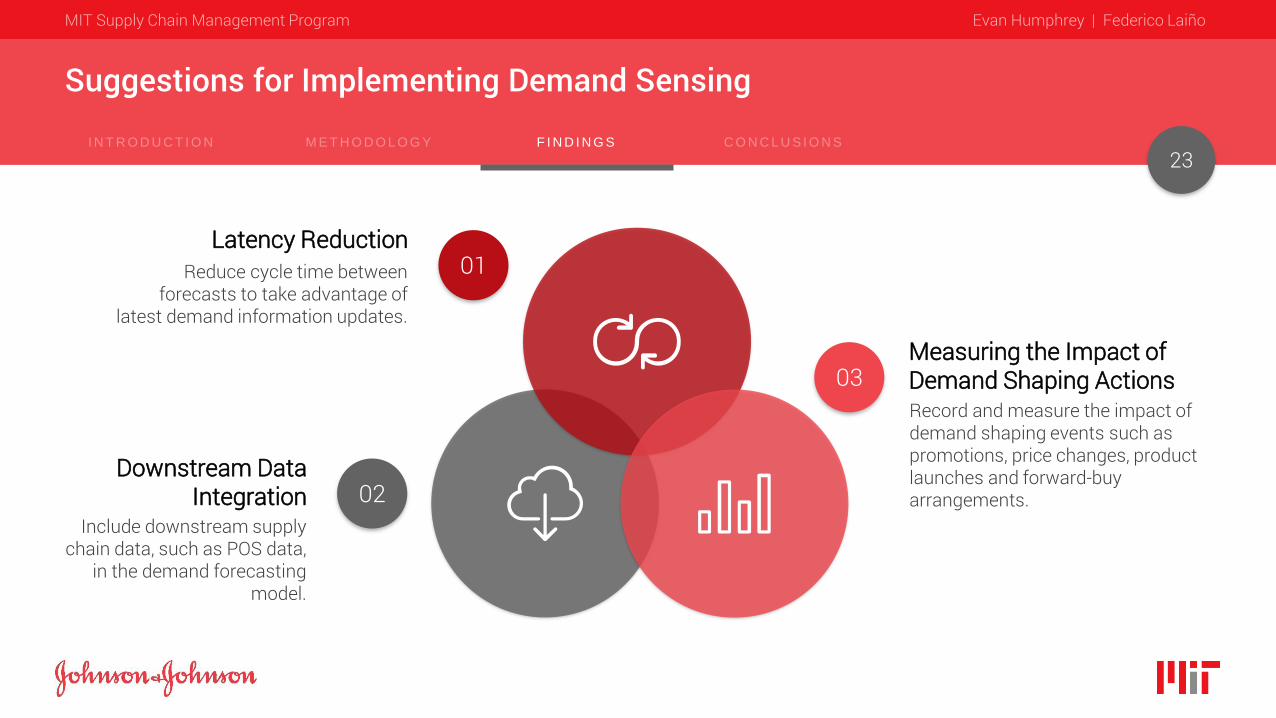
Record and measure the impact of demand shaping events such as promotions, price changes, product launches and forward-buy arrangements.
Measuring the Impact of Demand Shaping Actions03
Reduce cycle time between forecasts to take advantage of
latest demand information updates.
Latency Reduction01
Include downstream supply chain data, such as POS data,
in the demand forecasting model.
Downstream Data Integration 02

MIT Supply Chain Management Program Evan Humphrey | Federico Laiño
Findings3
MIT Supply Chain Management Program Evan Humphrey | Federico Laiño
I N T R O D U C T I O N M E T H O D O L O G Y F I N D I N G S C O N C L U S I O N S
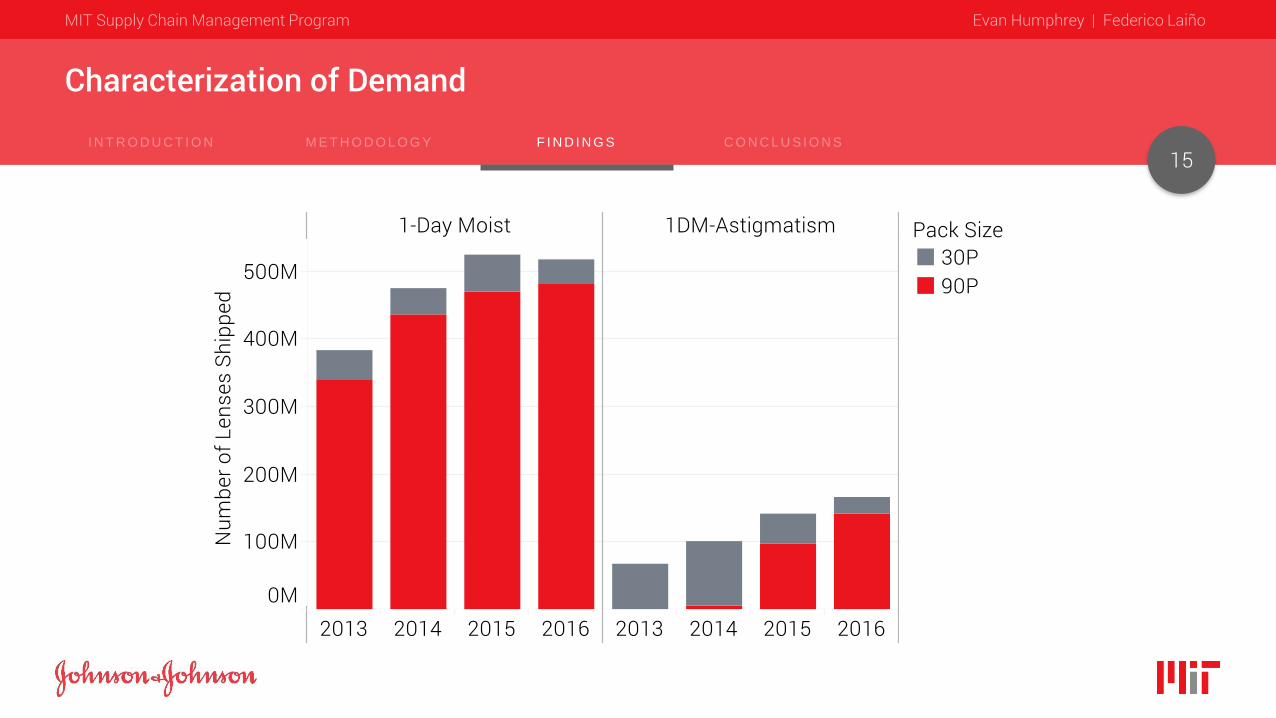
Characterization of Demand
15

MIT Supply Chain Management Program Evan Humphrey | Federico Laiño
Characterization of DemandShipments Time Series by Quarters
16
1 Day Moist 90-Pack 1 Day Moist for Astigmatism 90-Pack
1 Day Moist 30-Pack 1 Day Moist for Astigmatism 30-Pack

MIT Supply Chain Management Program Evan Humphrey | Federico Laiño
Characterization of DemandPareto Curves
17
% of Total SKUs0% 100%10% 30% 40% 50% 60% 70% 80% 90%20%
% of Total SKUs0% 100%10% 30% 40% 50% 60% 70% 80% 90%20%
1 Day Moist 90-Pack 1 Day Moist for Astigmatism 90-Pack
% of Total SKUs0% 100%10% 30% 40% 50% 60% 70% 80% 90%20%
% of Total SKUs0% 100%10% 30% 40% 50% 60% 70% 80% 90%20%
1 Day Moist 30-Pack 1 Day Moist for Astigmatism 30-Pack
116 SKUs 1528 SKUs
MIT Supply Chain Management Program Evan Humphrey | Federico Laiño
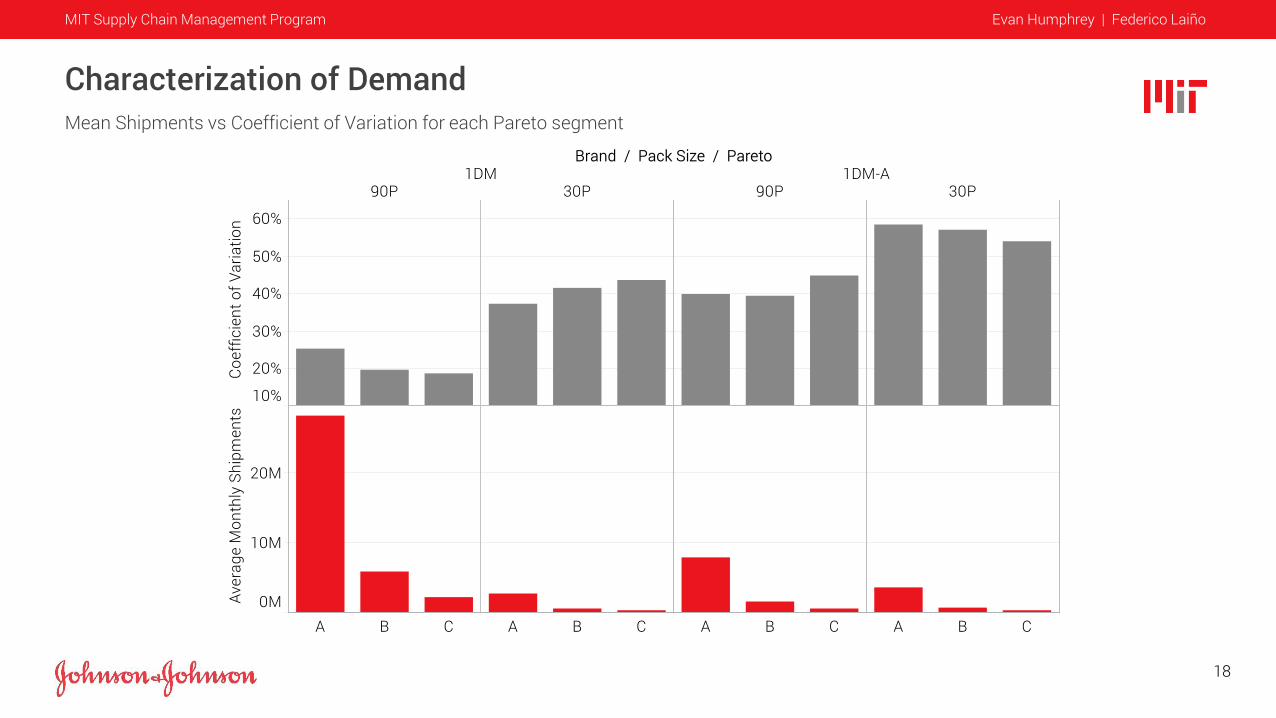
Characterization of DemandMean Shipments vs Coefficient of Variation for each Pareto segment
18

MIT Supply Chain Management Program Evan Humphrey | Federico Laiño
I N T R O D U C T I O N M E T H O D O L O G Y F I N D I N G S C O N C L U S I O N S
Forecast Accuracy Analysis
19
— Bias
— MAPE
— MAPV
— PVE
— RMSE
— 3-Month Average
— 4-Month Average
— 5-Month Average
— 6-Month Average
— Simple Exp. Smoothing
— Double Exp. Smoothing
— Brand
— Pack Size
— Pareto
— SKU
— Month
— Quarters
1 Aggregation Levels 3 Accuracy Metrics2 Forecasts Compared
— J&J Vision Care - Statistical
— J&J Vision Care - Lag 03
— J&J Vision Care - Lag 02
— J&J Vision Care - Lag 01
— Naïve
— 2-Month Average

MIT Supply Chain Management Program Evan Humphrey | Federico Laiño
Forecast Accuracy AnalysisNaïve vs Lag 01 Forecast Comparison Results
20
MIT Supply Chain Management Program Evan Humphrey | Federico Laiño
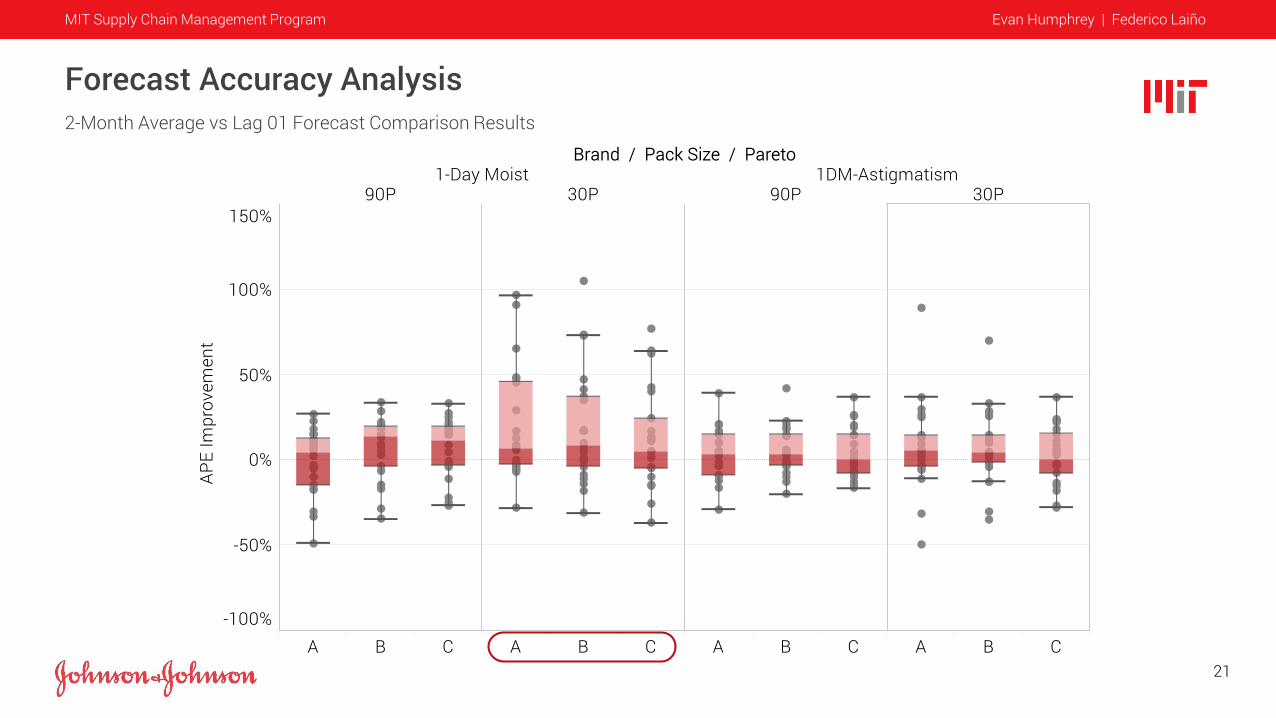
Forecast Accuracy Analysis2-Month Average vs Lag 01 Forecast Comparison Results
21

MIT Supply Chain Management Program Evan Humphrey | Federico Laiño
I N T R O D U C T I O N M E T H O D O L O G Y F I N D I N G S C O N C L U S I O N S
Current Forecasting Process
22
Input
Output
Process
Shipments Data
1
Statistical Forecast
Consensus Forecast
SKU Level Forecast
Executive S&OP
2.2 Production Planning
1.1 JDA Software
1.2 RegionalS&OP
2
3
2.1 SKU Breakdown
2 weeks
1-Month Cycle
Lag 03 Lag 02 Lag 01
MIT Supply Chain Management Program Evan Humphrey | Federico Laiño
I N T R O D U C T I O N M E T H O D O L O G Y F I N D I N G S C O N C L U S I O N S
Suggestions for Implementing Demand Sensing
23
Record and measure the impact of demand shaping events such as promotions, price changes, product launches and forward-buy arrangements.
Measuring the Impact of Demand Shaping Actions03
Reduce cycle time between forecasts to take advantage of
latest demand information updates.
Latency Reduction01
Include downstream supply chain data, such as POS data,
in the demand forecasting model.
Downstream Data Integration 02

MIT Supply Chain Management Program Evan Humphrey | Federico Laiño
I N T R O D U C T I O N M E T H O D O L O G Y F I N D I N G S C O N C L U S I O N S
Suggestions for Implementing Demand Sensing
24
Input
Output
Process
Executive S&OP
3Shipments
Data
12.2
Production Planning
1.1 JDA Software
1.2 Regional
S&OP
22.1 SKU
Breakdown
1 week
1-Month Cycle
Shipments Data
12.2 Product
Planning1.1 JDA
Software
1.2 Regional
S&OP
22.1 SKU
Breakdown
1 week
Latency Reduction01
Statistical Forecast
Consensus Forecast
SKU Level Forecast
Statistical Forecast
Consensus Forecast
SKU Level Forecast

MIT Supply Chain Management Program Evan Humphrey | Federico Laiño
I N T R O D U C T I O N M E T H O D O L O G Y F I N D I N G S C O N C L U S I O N S
Input
Output
Process
Shipments Data
1
Executive S&OP
2.2 Production Planning
1.1 DS Model 1.2 RegionalS&OP
2
3
2.1 SKU Breakdown
2 weeks
1-Month Cycle
Statistical Forecast
Consensus Forecast
SKU Level Forecast
Downstream Data
Suggestions for Implementing Demand Sensing
25
Downstream Data Integration02

MIT Supply Chain Management Program Evan Humphrey | Federico Laiño
I N T R O D U C T I O N M E T H O D O L O G Y F I N D I N G S C O N C L U S I O N S
Input
Output
Process
Shipments Data
1
Executive S&OP
2.2 Production Planning
1.1 DS Model 1.2 RegionalS&OP
2
3
2.1 SKU Breakdown
2 weeks
1-Month Cycle
Statistical Forecast
Consensus Forecast
SKU Level Forecast
Demand Shaping Data
Suggestions for Implementing Demand Sensing
26
Measuring the Impact of Demand Shaping Actions03

MIT Supply Chain Management Program Evan Humphrey | Federico Laiño
I N T R O D U C T I O N M E T H O D O L O G Y F I N D I N G S C O N C L U S I O N S
Suggestions for Implementing Demand Sensing
27
Latency Reduction
Challenges— Cost-benefit tradeoff— Cross-functional
coordination
— Cost-benefit tradeoff— Systems integration— Data access— No guaranteed benefit in
accuracy
— Cost-benefit tradeoff— Data structuring— No guaranteed benefit in
accuracy
Opportunities
— Simplest solution— Fastest to Implement— Guaranteed improvement in
accuracy
— Greater accuracy potential— Real time updates— More responsive to change
Downstream Data Integration Demand Shaping Actions

MIT Supply Chain Management Program Evan Humphrey | Federico Laiño
Conclusions4

MIT Supply Chain Management Program Evan Humphrey | Federico Laiño
I N T R O D U C T I O N M E T H O D O L O G Y F I N D I N G S C O N C L U S I O N S
Takeaways
29
We recommend J&J Vision Care consider the use of simpler forecasting techniques for the 30-Pack pack size category and, more specifically, for the 1-Day Moist 30-Pack product segment.
Forecast Accuracy Improvements01
We recommend J&J Vision Care consider the Demand Sensing initiatives we provided. Latency Reduction should be implemented first.
Demand Sensing Initiatives02

MIT Supply Chain Management Program Evan Humphrey | Federico Laiño
I N T R O D U C T I O N M E T H O D O L O G Y F I N D I N G S C O N C L U S I O N S
Future Work
30
Measuring the Impact of Demand Shaping Actions— Propose a system to capture demand
shaping events in a structured manner.
— Measure the impact of past initiatives.
— Develop predictive system to forecast
future events.
Downstream Data Integration
— Collect data at different echelons in
the Supply Chain.
— Develop predictive system to forecast
demand based on variations in
downstream supply chain data.

31
Thank YouQuestions?
Bachelor of Science Biotechnology
Indiana University
Evan Humphrey
Bachelor of ScienceIndustrial Engineering
Buenos Aires Institute of Technology
Federico Laiño