Embed Size (px)
Citation preview

“The Future is Your Decision”
August 2010Presented By:
Institute for Trend Research
Alan Beaulieu
[email protected] www.ecotrends.org

2
US, Michigan & the Midwest Annual GSP Growth Rate
-6
-3
0
3
6
9
12
15
'92 '94 '96 '98 '00 '02 '04 '06 '08 '10
U.S. Michigan Great Lakes

3
US, Illinois & the Great Lakes Annual GSP Growth Rate
-2
0
2
4
6
8
10
'92 '94 '96 '98 '00 '02 '04 '06 '08 '10
U.S. Illinois Great Lakes

4
US Industrial Production to Gross Domestic Product3/12 Rates-of-Change
-15
-10
-5
0
5
10
15
'82 '84 '86 '88 '90 '92 '94 '96 '98 '00 '02 '04 '06 '08 '10 '12
-15
-10
-5
0
5
10
15
GDP
US IP

5
12MMT = 18.70
12MMT = 18.97
Example: Revenue 12MMT
3MMT = 4.63
3MMT = 5.14
3MMT = 4.98
12MMT = 17.54
8.2%
5
3MMT = 4.223MMT = 3.953MMT = 4.24
Jun July Aug Sep
Oct Nov Dec
Jan Feb Mar
Apr May Jun
1.471.511.651.75
1.761.641.71
1.741.541.44
1.241.261.74
09090909
090909
101010
101010
12MMT:

6
ANNUAL MOVING TOTAL (12MMT) AS OF 7/10ANNUAL MOVING TOTAL (12MMT) AS OF 7/09
= 1/12
3-MOS MOVING TOTAL (3MMT) AS OF 7/103-MOS MOVING TOTAL (3MMT) AS OF 7/09 = 3/12
= 12/12
ACTUAL MONTHLY DATA AS OF 7/10ACTUAL MONTHLY DATA AS OF 7/09
RATE-OF-CHANGE

7

8Unemployment Rates
2
3
4
5
6
7
8
9
10
2000 2002 2004 2006 2008 2010 2012
U.S. Michigan
9Michigan Construction Industry Employment
Thousands of Units
-60
-50
-40
-30
-20
-10
0
10
20
'96 '98 '00 '02 '04 '06 '08 '10 12
R-O-C
100
125
150
175
200
225
250
275
300MMA
-14.6
120.050
-7.1
12MMA
3MMA
3/1212/12

10Unemployment Rates
2
3
4
5
6
7
8
9
10
2000 2002 2004 2006 2008 2010 2012
U.S. IL

11Illinois Construction Industry Employment
Thousands of Units
-32
-24
-16
-8
0
8
'96 '98 '00 '02 '04 '06 '08 '10 12
R-O-C
180
220
260
300
340
380MMA
-14.8
205.2
-10.2
12MMA
3MMA
3/12 12/12

12
50
60
70
80
90
100
110
120
130
'80 '82 '84 '86 '88 '90 '92 '94 '96 '98 '00 '02 '04 '06 '08 '10 '12 '14
50
60
70
80
90
100
110
120
130
US Industrial Production IndexForecast Through December 2011
Annual Average Index
Debt
Interest Rates
Unemployment
Inflation
Credit Crunch
International scope
Elections
Oil
Home Prices
Source: ITR’s EcoTrends®
Monthly Economic Report

13
Commercial & Industrial Loans at Commercial BanksRates-of-Change
-20
-15
-10
-5
0
5
10
15
20
25
'82 '84 '86 '88 '90 '92 '94 '96 '98 '00 '02 '04 '06 '08 '10 12-20
-15
-10
-5
0
5
10
15
20
25
3/12
12/12
Two to three year period of adjustment

14
Delinquency Rates for C&I Loans3/12 &12/12 Rates-of-Change
-80
-40
0
40
80
120
160
'90 '92 '94 '96 '98 '00 '02 '04 '06 '08 '10 12-80
-40
0
40
80
120
160
3/12
12/12
25.0%
77.8%

15
Consumer Loan Delinquency Rates
-2
0
2
4
6
'90 '92 '94 '96 '98 '00 '02 '04 '06 '08 '10 12-2
0
2
4
6
3/12
12/12

16Consumer Credit Potential Availability to Consumer Credit Demand
Net Percent Positive Respondents
-50
-25
0
25
50
'92 '93 '94 '95 '96 '97 '98 '99 '00 '01 '02 '03 '04 '05 '06 '07 '08 '09 '10 '11 '12-50
-25
0
25
50
Potential
Demand

17
-25
-20
-15
-10
-5
0
5
10
15
'94 '96 '98 '00 '02 '04 '06 '08 '10 12
R-O-C
2.0
2.5
3.0
3.5
4.0
4.5
5.0
5.5
6.0MMA
3.928
3.00.9
Sep '08
Sep '07
Jul '95
M2 Money SupplyTrillions of 82$
12MMA
Actual
12/12
1/12
Source: ITR’s EcoTrends®
Monthly Economic Report

18
Crude Oil Futures PricesLight & Sweet $ per Barrel
-300
-200
-100
0
100
200
'92 '94 '96 '98 '00 '02 '04 '06 '08 '10 12
R-O-C
-40
40
120
200
280
360MMA
19.5
77.1
13.7
Jun '07
Jul '05
Apr '07
Aug '06
1/12
12/12
Actual12MMA

19Consumer Price Index to Crude Oil Futures Prices
12/12 Rates-of-Change
-1
1
3
5
7
9
'92 '94 '96 '98 '00 '02 '04 '06 '08 '10 '12
CPI
-90
-50
-10
30
70
110OIL
CPI
OIL
Source: ITR’s EcoTrends®
Monthly Economic Report

20
Short-Term Interest Rates to US Gov’t Long-Term Bond YieldsAnnual Data Trends
0
4
8
12
16
20
'80 '82 '84 '86 '88 '90 '92 '94 '96 '98 '00 '02 '04 '06 '08 '10 '120
4
8
12
16
20
Short-Term Interest Rates
Long-Term Bonds

21
Mortgage Rates to Federal FundsRaw Data
-2
2
6
10
14
18
22
1975 1980 1985 1990 1995 2000 2005 2010 2015-2
2
6
10
14
18
22
Mortgage Rates
Federal Funds

22
President Obama’s 10-Year Deficit Projections(Baseline of Current Policy)
Billions of Dollars
-2000
-1500
-1000
-500
0
500
2000 2001 2002 2003 2004 2005 2006 2007 2008 2009 2010 2011 2012 2013 2014 2015 2016 2017 2018 2019
Based on an Average GDP Growth of 5.04 Percent perYear from 2010-2019
236128
-158
-378-413
-318 -248-161
-455
-1552-1449
-1173
-939 -938-955 -925 -988-1013
-1031-1145
Source: A New Era of Responsibility, Table S-2, budget.gov

23
Global Industrial Production Indices12/12 Rates-of-Change
-25
-20
-15
-10
-5
0
5
10
15
'00 '02 '04 '06 '08 '10 '12
-25
-20
-15
-10
-5
0
5
10
15
10.2 - SE Asia
-4.6 - Europe
3.0 - Japan
-0.6 - Mexico
6.5 - Brazil
-0.9 - US

24
2009 Exports from Michigan to World
43.3%
10.6%9.6%
6.6%
5.2%
4.2%
20.4%
336 _Transportation Equipment
325 _Chemical Manufactures
333 _Machinery Manufactures
331 _Primary Metal Manufactures
334 _Computers & Electronic Prod.
211 _Oil & Gas Extraction
All Others

25
2009 Exports from Illinois to World
23.1%
15.0%
11.1%9.7%5.9%
5.4%
29.8%333 _Machinery Manufactures
325 _Chemical Manufactures
334 _Computers & Electronic Prod.
336 _Transportation Equipment
311 _Processed Foods
335 _Elec. Eq., Appliances & Parts
All Other

26
Demographics
Winning Demographics
USA ~ 300 Million grows to 400 – 500 Million
India
Indonesia
Australia
Spain
Negative Demographics
China
Europe
Japan
RussiaSource: United Nations

27
Net Migration – Top 15
NVOR
TN
CO SCFL
NC
TX
UT AL CA VA
WA
AZGA
-10
10
30
50
70
90
110
130
150
170
190
210
230
Thousands
US Census Bureau, Annual Population Estimates, Net Migration 1 July 2008 - 1 July 2009

28
Net Migration – Bottom 15
MI
NY
OH
NJMD
RI AK VT
ND NE WI MS NH HI
ID
-100
-90
-80
-70
-60
-50
-40
-30
-20
-10
0
10Thousands
US Census Bureau, Annual Population Estimates, Net Migration 1 July 2008 - 1 July 2009

29
15
25
35
45
55
65
75
1947 1952 1957 1962 1967 1972 1977 1982 1987 1992 1997 2002 2007 2012
15
25
35
45
55
65
75
Services
Goods
GOODS & SERVICES AS A PERCENT OF GDP (real) w/o structures

30
-24
-18
-12
-6
0
6
12
'92 '94 '96 '98 '00 '02 '04 '06 '08 '10 12
R-O-C
40
90
140
190
240
290
340MMA
-0.9
Oct '07
Mar '08
May '02
Jan '01
89.9
8.2
US Total Industrial Production Index2002 = 100, S.A.
Actual
12MMA
12/121/12
Source: ITR’s EcoTrends®
Monthly Economic Report

31
US Industrial Production to Fabricated Metal Products Production12/12 Rates-of-Change
-20
-15
-10
-5
0
5
10
15
1975 1980 1985 1990 1995 2000 2005 2010 2015
US IP
-20
-15
-10
-5
0
5
10
15Metals
US IP
Fabricated Metals

32
US Industrial Production to Plastics Products Production12/12 Rates-of-Change
-18
-12
-6
0
6
12
'94 '96 '98 '00 '02 '04 '06 '08 '10 '12
US IP
-18
-12
-6
0
6
12
Plastics
US IP
Plastics

33
US Industrial Production to Equipment & Software Investment12/12 Rates-of-Change
-16
-8
0
8
16
24
'82 '84 '86 '88 '90 '92 '94 '96 '98 '00 '02 '04 '06 '08 '10 '12
US IP
-20
-10
0
10
20
30Investment
US IP
Investment

34
US Industrial Production to Tourism12/12 Rates-of-Change
-12
-8
-4
0
4
8
'00 '01 '02 '03 '04 '05 '06 '07 '08 '09 '10
US IP
-24
-16
-8
0
8
16Tourism
US IP
Tourism

35
-80
-60
-40
-20
0
20
40
'92 '94 '96 '98 '00 '02 '04 '06 '08 '10 '12
R-O-C
400
600
800
1000
1200
1400
1600
MMT
0.0
19.5
$676.429
Nondefense Capital Goods New Orders w/o Aircraft Billions of $
12MMT
3MMT
3/12 12/12
Source: ITR’s EcoTrends®
Monthly Economic Report

36
The Eco 8
Current Cycle Leading Cycle
Nonresidential Construction
New Orders
Financial
Sales
Housing
Production
Prices
Foreign
Source: ITR’s EcoTrends®
Monthly Economic Report

37
US Industrial Production to Corporate Bond Prices12/12 Rates-of-Change
-15
-10
-5
0
5
10
15
1975 1980 1985 1990 1995 2000 2005 2010 2015
US IP
-30
-20
-10
0
10
20
30Bonds
US IP
Corporate Bonds
Source: ITR’s EcoTrends®
Monthly Economic Report

38
-40
-20
0
20
40
60
80
'92 '94 '96 '98 '00 '02 '04 '06 '08 '10 '12-40
-20
0
20
40
60
80
1/12
12/12
Dec '09
Dec '08
Purchasing Managers IndexISM
Source: ITR’s EcoTrends®
Monthly Economic Report

39
-24
-18
-12
-6
0
6
12
'94 '96 '98 '00 '02 '04 '06 '08 '10 '12
R-O-C
65
80
95
110
125
140
155MMA
7.08.4
106.8
U.S. Composite Leading Indicator1996 = 100
12MMA
Actual
12/121/12
Source: ITR’s EcoTrends®
Monthly Economic Report

40
-90
-60
-30
0
30
60
'94 '96 '98 '00 '02 '04 '06 '08 '10 '12
R-O-C
200
1000
1800
2600
3400
4200MMA
16.111.6
1090.1
Aug '09
Sep '07
Sep '09
Dec '07
Stock Prices IndexS&P 500,1941 – 43 = 10
12MMA
Actual
12/12
1/12
Source: ITR’s EcoTrends®
Monthly Economic Report

41
-21
-14
-7
0
7
14
'94 '96 '98 '00 '02 '04 '06 '08 '10 '12
R-O-C
1.00
1.75
2.50
3.25
4.00
4.75
MMT
-0.1
2.6
$2.043
May '06
Jul '05
Retail Sales Excluding AutomobilesTrillions of 82-84$
12MMT 3MMT
3/1212/12
Source: ITR’s EcoTrends®
Monthly Economic Report

42
New Homes Sales Median Price to Stock Prices IndexData Trends
0
50
100
150
200
250
1970 1975 1980 1985 1990 1995 2000 2005 2010 2015
Homes
0
300
600
900
1200
1500
Prices
New Homes
Stock Prices Index

43Consumer Expectations and Retail Sales
40
60
80
100
120
'82 '84 '86 '88 '90 '92 '94 '96 '98 '00 '02 '04 '06 '08 '10 '12
Expectations
1.2
1.6
2.0
2.4
2.8
Sales
Expectations
Retail Sales

44
Light Vehicle Retail Sales to Consumer Expectations12/12 Rates-of-Change
-30
-20
-10
0
10
20
30
40
'82 '84 '86 '88 '90 '92 '94 '96 '98 '00 '02 '04 '06 '08 '10 12
Consumer
-30
-20
-10
0
10
20
30
40Sales
Consumer Expectation
Automobile Sales

45
Consumer Price Index to Gold12/12 Rates-of-Change
-4
-2
0
2
4
6
8
10
'82 '84 '86 '88 '90 '92 '94 '96 '98 '00 '02 '04 '06 '08 '10 12
Consumer
-20
-10
0
10
20
30
40
50Gold
Consumer Price
Gold Prices

46
Stock Prices Index to Consumer Expectations Index1/12 Rates-of-Change
-60
-45
-30
-15
0
15
30
45
60
'80 '82 '84 '86 '88 '90 '92 '94 '96 '98 '00 '02 '04 '06 '08 '10 12
Prices
-80
-60
-40
-20
0
20
40
60
80Index
Stock Prices
Consumer Index

47Building Permits12/12 Rates-of-Change
-50
-40
-30
-20
-10
0
10
20
'97 '98 '99 '00 '01 '02 '03 '04 '05 '06 '07 '08 '09 '10
-50
-40
-30
-20
-10
0
10
20
U.S. Michigan

48Building Permits12/12 Rates-of-Change
-60
-50
-40
-30
-20
-10
0
10
20
30
'97 '98 '99 '00 '01 '02 '03 '04 '05 '06 '07 '08 '09 '10
-60
-50
-40
-30
-20
-10
0
10
20
30
U.S. Illinois

49
-90
-75
-60
-45
-30
-15
0
15
30
'94 '96 '98 '00 '02 '04 '06 '08 '10 '12
R-O-C
0.2
0.7
1.2
1.7
2.2
2.7
3.2
3.7
4.2
MMT
-10.2
11.5
0.592
Mar '06
Feb '08
Sep '09
Mar '01
Housing StartsMillions of Units
12MMT3MMT
3/1212/12
Source: ITR’s EcoTrends®
Monthly Economic Report
Don’t forget about long-term demographics

50Michigan Building Permits
Thousands of Units
-100
-80
-60
-40
-20
0
20
40
60
'96 '98 '00 '02 '04 '06 '08 '10 12
R-O-C
-10
10
30
50
70
90
110
130
150MMT
3.3
8.353
27.7
12MMT3MMT
3/12
12/12

51Michigan Housing Price Index
Year over Year % Change
-15
-10
-5
0
5
10
15
20
25
'78 '80 '82 '84 '86 '88 '90 '92 '94 '96 '98 '00 '02 '04 '06 '08 '10
-15
-10
-5
0
5
10
15
20
25
Raw

52Illinois Building Permits
Thousands of Units
-100
-80
-60
-40
-20
0
20
40
'97 '98 '99 '00 '01 '02 '03 '04 '05 '06 '07 '08 '09 '10 11 12
R-O-C
-5
25
55
85
115
145
175
205
MMT
-14.9
12.209
32.1
12MMT3MMT
3/12
12/12

53Illinois Housing Price Index
Year over Year % Change
-10
-5
0
5
10
15
20
'78 '80 '82 '84 '86 '88 '90 '92 '94 '96 '98 '00 '02 '04 '06 '08 '10
-10
-5
0
5
10
15
20
Raw

54
US Industrial Production to Private Non-Residential Construction12/12 Rates-of-Change
-24
-16
-8
0
8
16
24
32
'82 '84 '86 '88 '90 '92 '94 '96 '98 '00 '02 '04 '06 '08 '10 12
Construction
-15
-10
-5
0
5
10
15
20US IP
Private Construction
US IP

55Company WRates-of-Change
Compute Your Rate-of-Change
-75
-50
-25
0
25
50
75
100
'82 '84 '86 '88 '90 '92 '94 '96 '98 '00 '02 '04 '06 '08 '10
-75
-50
-25
0
25
50
75
100
3/12
12/12

56Company W to US Industrial Production
12/12 Rates-of-Change
How do I fit into the economy?
-15
-10
-5
0
5
10
15
'82 '84 '86 '88 '90 '92 '94 '96 '98 '00 '02 '04 '06 '08 '10
US IP
-75
-50
-25
0
25
50
75Company W
US IP
Company
Source: ITR’s EcoTrends®
Monthly Economic Report
57
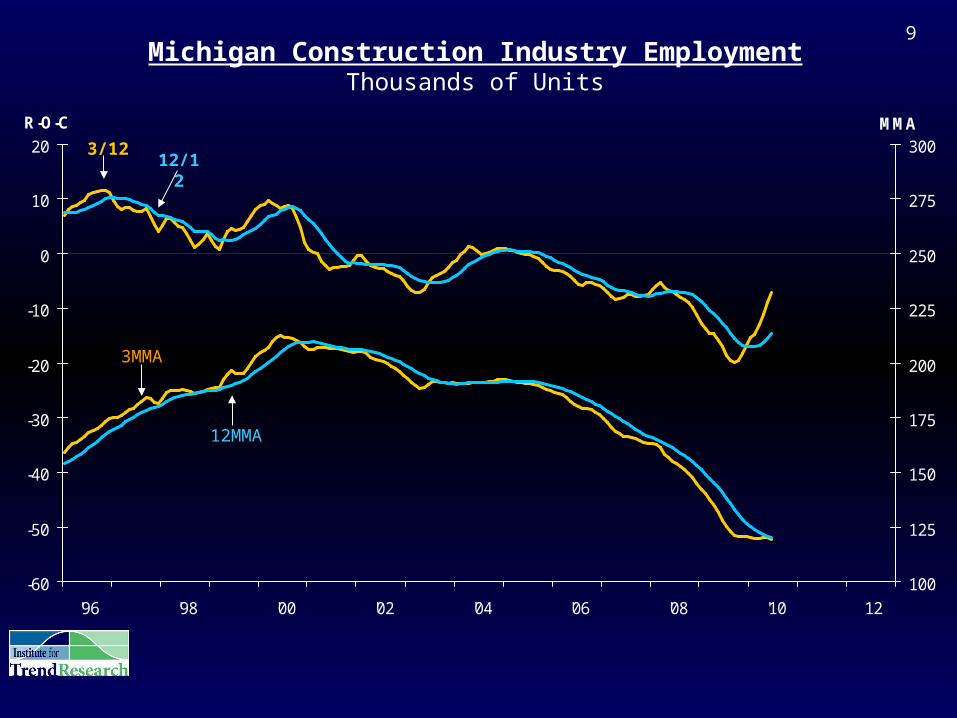
Phase A Phase B Phase C Phase DPhase A
A A
Phase A Phase B
A
B
A
B
Phase A Phase B Phase C
A
B C
A
B C
Phase A Phase B Phase C Phase D
A
B C
D A
B C
D
Make Your Move
Bankrupt
Expansion

58
Phase Management ObjectivesTM:
Phase Late D – Recession Early A - Early Recovery
1. Prepare training programs
2. Negotiate union contracts if possible
3. Develop advertising & marketing programs
4. Enter or renegotiate long-term leases
5. Look for additional vendors
6. Capital expenditures & acquisitions considered in
light of market-by-market potential
7. Make acquisitions – use pessimism to your
advantage
8. People will be scared – lead with optimism and “can
do” attitude

59
Phase Management ObjectivesTM :
1. Positive leadership modeling (culture turns into behavior)
2. Establish goals: tactical goals which lead to strategic achievement
3. Develop a system for measurement and accountability re: #2
4. Align compensation plans with #2 and #3
5. Process standardization
6. Judiciously expand credit
7. Check distributions systems for readiness to accommodate
increased activity
8. Review and uncover competitive advantages
9. Invest in customer market research (know what they value)
10. Improve efficiencies with investment in technology and software
Phase Late A - Recovery:

60
Phase Management ObjectivesTM :
1. Accelerate training
2. Check the process flow for possible future bottlenecks
3. Continue to build inventory
4. Increase prices
5. Consider outside manufacturing sources if internal
pressures becoming tight
6. Find the answer to “What next?”
7. Open distribution channels (your own or outsource)
8. Use improved cash flow to improve corporate operations
9. Use cash to create new competitive advantages
10.Watch your debt-to-equity ratio and ROI
11.Maintain/pursue quality: don’t let complacency set in
Phase Early B - Growth:
61
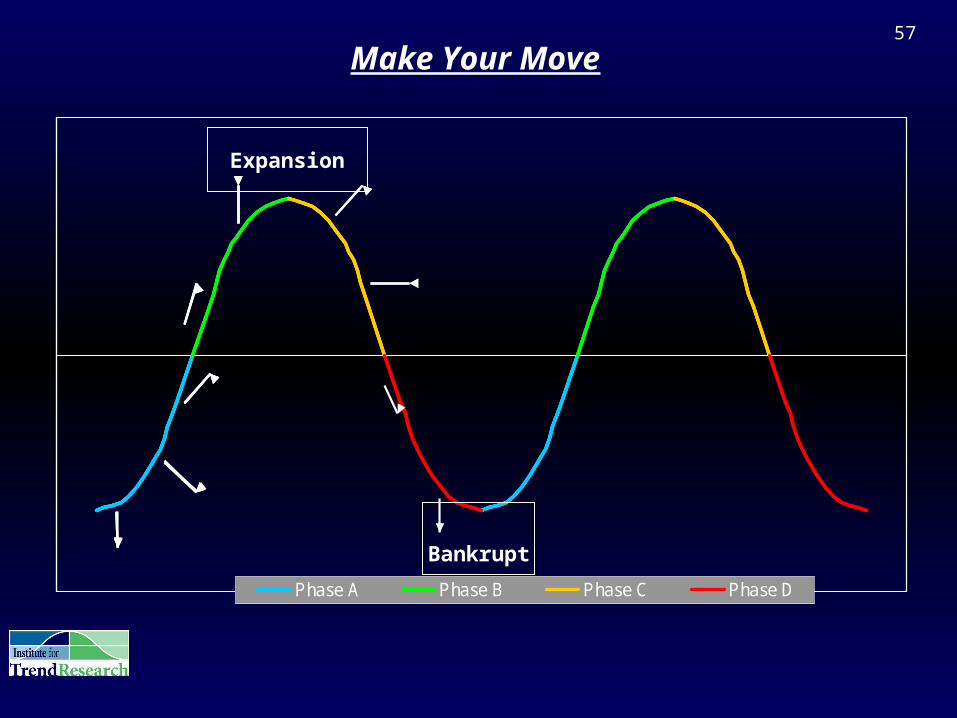
Phase Management ObjectivesTM :
1. Stay in stock on A items, be careful with C items2. Consider selling the business in a climate of maximum “goodwill”3. Penetrate new selected accounts4. Develop plan for lower activity in traditional, mature markets5. Freeze expansion plans (unless related to
“what is next”)6. Spin off undesirable operations7. Consider taking on subcontract work if the backside of the cycle
looks recessionary8. Stay realistic – beware of linear budgets9. Begin missionary efforts into new markets10.Communicate competitive advantages to maintain margins
Phase Late B Early C - Prosperity:

For follow-up questions, spreadsheet,TrendCastTM or Forecast information
please contact: