Embed Size (px)
Citation preview
The Fume Hood Sustainability Experiment SP0117 - Final Report
By: Marc-Etienne Brunet, Jonathan Glencross, & David Zangwill.
April 27th, 2015
What you set out to accomplish:
Our intention with this project was to learn how to create a scalable way to reduce waste energy
consumption in laboratory fume hoods through behavior change. Fume Hoods consume a large
amount of energy and, in many models, the energy used is directly dependent upon the user’s
behavior. These two factors present a significant opportunity for energy reduction through the
application of targeted behavior change. The project was inspired by, and built upon a previous
SPF project called Shut Your Sash (SP0041), a publication entitled “The use of feedback in lab
energy conservation: fume hoods at MIT”, Berkeley’s fume hood energy calculator, the work of
OPower, and the FitBit. Initial research and rough calculations of the energy savings potential
was conducted by students participating in the McGill Energy Project.
Important Note: This report assumes the reader is familiar with what a fume hood is, and the
difference between VAV and CAV hoods. This information can be found in either the SP0041
report or the MIT publication mentioned above. The Wikipedia page on the subject is also very
informative.
Shut Your Sash involved 55 labs in the life sciences buildings. The team cited the Berkeley
calculator, which computed that every inch a sash (sliding glass door) is lowered over the year
results in $140 in energy savings (considering McGill’s climate and energy costs of ventilation).
After being in contact with the Shut Your Sash team, we learned their project required intense
effort on the part of the organizers. The project members reported feeling burnt out as a result of
the work, and they were not excited to do it again. Their approach was hard to maintain and
would not scale well.
We set out to experiment with various interventions to see which methods best motivated
students and researchers to lower their sash height, looking for the magic combination of cost,
effort, and energy savings. Our goal was to create a social enterprise with these findings (which
turned into Equipmind), and take our waste energy reduction strategy to other institutions at
scale. For info on how we measured these goals find our SPF Impact Metrics here.

What you accomplished:
Methodology:
Our methodology was straightforward in principle.
1. Establish a sash height baseline,
2. Collect information about “lab culture” and current perceptions,
3. Design various behaviour change strategies,
4. Divide fume hoods (~200 considered) into sample groups, including a control group,
5. Roll out different strategies in different groups,
6. Analyse the results.
To measure the baseline we interfaced with the building automation system (BAS). We
requested that McGill Building Operations track a specified list of fume hood sash heights in
their logs, and give us database access to read these values. This took a long time to set up,
and the results were mediocre. In the end we collected the bulk of the data for the experiment
using html “scraping” methods (i.e. writing our own script to programmatically read values from
the BAS web dashboard). The combination of these two datasets was challenging to work with,
and somewhat limiting, but we made do.
Next we interviewed various staff and students involved in the research labs. We then applied
techniques in community based social marketing to what we learned and created an
experimental design. Its premise was based on the idea that we could impact behavior through
different types of prompts (physical reminders on the machines), and workshops (in person
“training”). See table below.
Table 1. Approximate number of hoods per category (as per original design)
Prompt Type Workshop Type
Social Pressure Sticker
Social Pressure Screen
Shock Value Sticker
No Workshop 9 12 9
Incentive Workshop 9 12 9
Commitment Workshop
9 12 9
The two workshop types we tested were “Incentive-Based” and “Commitment-Based”. The
former put labs into a competition for a cash prize, the latter had participants commit to specific
group targets. In each case, “signing up” (i.e. physically putting your name on a form) was
required.
The three prompt types we tested were “Social Pressure Sticker”, “Shock Value Sticker”, “Social
Pressure Screen”. Social pressure refers to a theme of comparison, or judgement between the
fume hood users and their colleagues. Shock Value refers to a theme of amazement and
emphasises of the massive energy savings potential. In the case of the
For the prompt-type “Social Pressure Screens”, we designed and manufactured internet
connected displays that pulled data from a web backend (that we also designed). The screens
gave the users hourly feedback on:
1. Their average sash height over the last hour,
2. Their average sash height over the last month,
3. The best (i.e. lowest) sash height on campus (from a comparable hood).
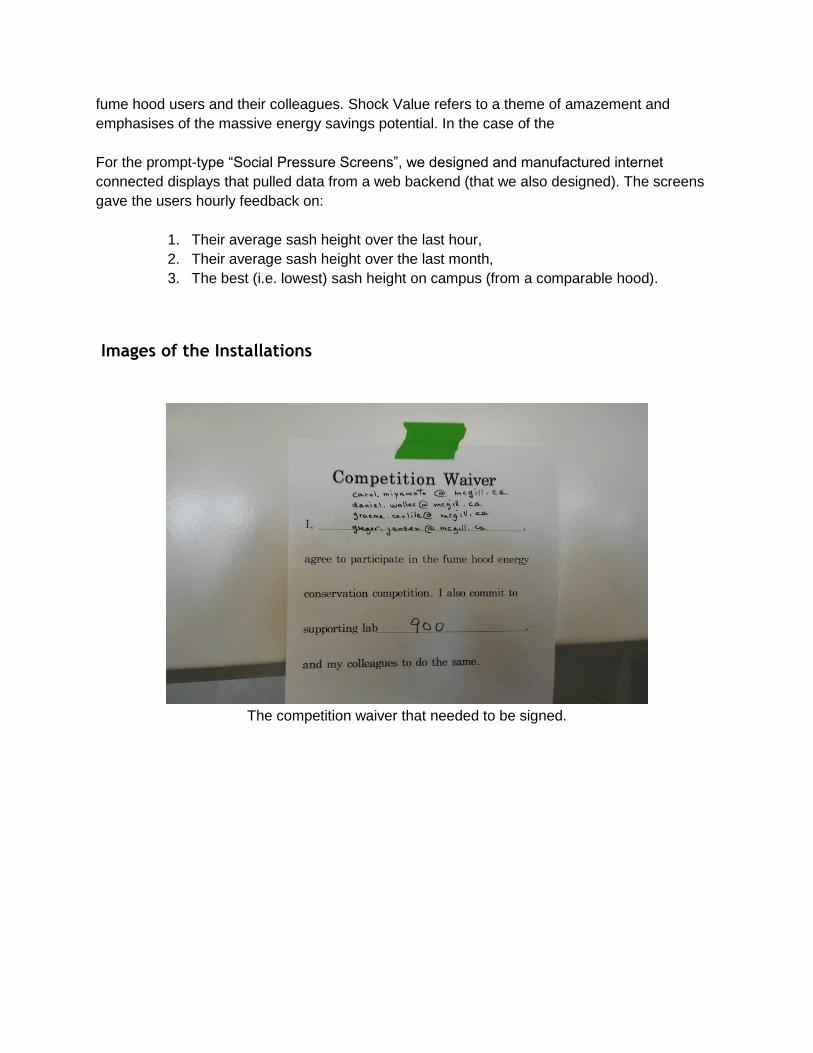
Images of the Installations
The competition waiver that needed to be signed.

The complete setup with screen (conception).
The complete setup with screen.

Sample Social Pressure Sticker, Screen Border, energy consumption measuring tape.
Results
The mean average sash height of the 232 hoods considered (including control groups) was
34.8% open before our implementation and 30.4% open after our implementation. Recall our
goal was to determine which techniques best motivate students and researcher to keep their
sash low, and not to have the highest overall impact on energy savings. It is nonetheless worth
noting that at the $140/inch cited by the Shut Your Sash Report we would have saved roughly
$40,000 / yr. However this was not the case, for reasons that will be explained later.
When analyzing the change per sample group - we found that the collected data was not
sufficiently complete, and that we did not have enough labs in each sample group to compare
results in the way we had planned. Nonetheless, you can find an example graph from each
original test group in this folder. Instead, we divided the hoods along the boundary ‘Stickers’
and ‘Screens’ and saw clear differentiated results. The histograms in the section below display
these results, while Table 2 gives a breakdown of the hoods per category.
Table 2. Number of Hoods per Category per Building
Num. of Hoods Stickers Screens Control
McIntyre 21 9 39
Otto Maass 31 27 83
Pulp & Paper None None 22
Total 52 36 144

Note: The histograms contain data from October 16th to December 19th, 2013. The intervention
date (i.e. when the prompts were installed and the workshops were given) was as early as
October 28th and as late as November 7th. The data collected was of the form (hood_id,
time_stamp, percent_open), at roughly 10 minute intervals. In the vast majority of cases 100%
open corresponds to 28 inches open - the maximum a typical sash can open. The data for each
hood was divided into samples collected “before” and “after” the intervention. For more
information on reading histograms, see this wikipedia article.

Histogram of sash height before and after intervention: all hoods

Histogram of sash height befor and after intervention: McIntyre
Histogram of sash height befor and after intervention: Otto Maass and Pulp & Paper

When considered altogether, we see that the installation of stickers had a negligible effect, while
the installation of the screens drove a 13.0% open (3.6 inch) decrease in mean sash height in
comparison to the control group.
It should also be noted that we ran into technical difficulties while installing the screens in Otto
Maass. The connection was blocked by a firewall, and it took 2 weeks before the data came
online. Moreover nobody had a definitive mapping of the data points for the hoods within the
labs in Otto Maass. In any given lab we could gather data from 10-20 different points in the
building automation system (representing the hoods), but there was no way to be sure which
data point corresponded exactly to a particular hood (the hoods were labelled differently in the
labs and in the building automation system). We were forced to make our “best guess”, but
expect that in some instances the data being displayed on the screen did not actually
corresponds to the hood it was mounted on, rendering it much less credible to the users. This
may explain why the screens had a significantly lesser impact in Otto Maass - 1.1% open (0.3
inches) compared to the mean, than in McIntyre - 29.3% open (8.2 inches) compared to the
mean.
Unfortunately, when we reviewed the collected ventilation data, we did not see the energy
savings we were expecting. As far as we could tell, the behaviour change, even in the most
successful labs, did not drive significant energy savings.
What you learnt The most important things that we learnt were:
1- Hourly feedback (through the screens), when properly executed, is considerably more
impactful than just the use of stickers.
2- As opposed to what is suggested by Berkeley’s calculator and MIT’s report, fume hood
ventilation systems are highly non-linear, and energy use is not directly linked to sash height.
The first of these points is captured by the results section above. We will discuss the second
point now.
Berkeley’s fume hood calculator, while not incorrect, is very misleading. The McGill Shut your
Sash SPF project used it to produce the following graph:

Shut Your Sash calculations: operating costs of VAV hood vs. sash height (inches).
This linear relationship fails to consider three very important influences on a hood’s flow rate,
and thus operating costs:
1- A fume hood’s flow limits,
2- The laboratory’s minimum ventilation requirements,
3- Other ventilation controllers and balancing constraints.
Fume Hood Flow Limits
The first of these was encountered after plotting ventilation data for the individual hoods. Rather
than seeing the linear relationship proposed by Berkeley, we saw a nonlinear, step like function
(see graph below).

When discussing this graph with the engineers who configured the VAV fume hoods in Otto
Maass, they told us that regulations require fume hoods maintain a minimum flow rate. This
minimum flow varies based on the size of the hood, but roughly means that from 0 to 6 inches
(0 - 21% open) a constant flow of just over 200 CFM (cubic feet per minute) is maintained.
Furthermore, in many cases fume hoods are configured with an upper limit as well. For example
in Otto Maass, the flow rate is roughly constant above 18 inches (64% open).
Laboratory Minimum Ventilation Requirements
While on the phone with engineers about fume hood flow limits, we also discussed the
laboratory’s minimum general ventilation requirements. Laboratory control systems are
configured to maintain very high general ventilation rates throughout the entire room. Typically,
they are configured to run at least 6 to 12 ACH (air changes per hour) depending on many
factors including, the time of day, room occupancy (if sensors are installed), and the type of
work being performed.
The MIT report considers this in the below paragraph, but dismisses its impact on energy
savings in the case of their study.
‘VAV hoods are considered much more energy efficient than CAV hoods, but this is not
necessarily true. CAV designs are well suited to large laboratory spaces with few fume hoods.
The ventilation through the CAV hood can be subtracted from the general laboratory ventilation,
keeping the overall energy use to a minimum (Kolkebeck, 2006). Low-flow CAV hoods can be
used to achieve this in smaller spaces (Mills and Sartor, 2005a). Small labs with a high density

of fume hoods (the vast majority of labs at MIT) benefit from VAV designs, since even the
minimum air volume through CAV hoods far exceeds the minimum requirements in small
spaces. For instance, a single 650 CFM CAV fume hood can produce six ACH in a space of
6,500 ft2 (a room 25 ft x 25 ft x 10.40 ft), which is two times larger than any lab space in the
Chemistry Department (Facilities, 2008).”
However, they make a dimensional error in their calculations. A 25 by 25 by 10.4 foot room is
not 6,500 square feet, but 6,500 cubic feet and only 625 square feet. For comparison, the
average square footage of the labs considered in Otto Maass is 3,130 ft2, so it seems very
unlikely that 625 ft2 is two times larger than any space in MIT’s chemistry department.
Therefore, a laboratory’s minimum general ventilation must also be considered when calculating
the energy savings due to behaviour change.
Other controllers and constraints
Finally, when analyzing the ventilation data from McIntyre, we found that the hoods were not
behaving like VAV systems. There was seemingly no correlation between sash height and flow
rate. (See graph below)
Further conversations with engineers led us to understand that the VAV fume hoods had been
reconfigured upon the installation of an Aircuity system. They now no longer adjust their flow
rates as a function of sash height, but as a function of the air contaminants measured in the lab.
This means that behavior change (around fume hood use) has absolutely no impact on energy
consumption in McIntyre.

Proper energy calculations
As a result of these additional influences, the relationship between sash height and energy use
becomes nonlinear. We cannot simply multiply a reduction of mean sash height by a factor to
determine energy savings (i.e. X inches of reduction times $Y/inch = Energy Savings, does not
hold generally). The entire laboratory ventilation system must be modeled and simulated, with
sash height considered as a random variable with a given distribution before and after
intervention. This can be done either through Monte Carlo techniques or via direct arithmetic
manipulation of the random variables.
These calculations are beyond the scope of this report. However, it is worth noting that McGill
Utilities and Energy Management contracted the authors of this report to use the above
mentioned techniques to assess the fume hood savings potential in Otto Maass, Life Sciences,
and Wong. The results can be summarizes as follows:
Life Sciences: Little room for improvement via behavior change, however energy use could
substantially increase if sash height habits dramatically worsened.
Otto Maass: Similar to the situation in Life Sciences, however there is a substantial energy
savings potential (~$80k / yr) if the minimum air changes per hour in the labs is reduced.
Wong: Because of how the ventilation systems are configured, strong behavioral improvements
could lead to as much as $45k of energy savings per year.
What challenges / failures were encountered, how they were
addressed, and what recommendations you would have if this
project were being replicated.
Experiment Design
Challenge
This was the first time we ran a social science experiment at scale. We designed the experiment
with 9 test conditions plus control groups. Because of the nature of the lab grouping of fume
hoods, we had to assign all of the fume hoods in a lab to a single test group.
So despite having obtained data for 210 hoods, labs could contain between 1 and 25 hoods,
making it very hard to organize an even distribution of labs and hoods in each test category.
Furthermore, there is a large amount of variance in the type of fume hood use between labs.
Making a fume hood in one lab very hard to compare with a fume hood in another.
Recommendation
Given how heterogeneous labs and fume hoods are across campus, we should have set out
with significantly simpler tests. We should have planned to test a maximum of three different
strategies, definitely not nine.

Sash Height Data
Challenge
There were numerous challenges when trying to collect fume hood data. The first challenge was
working with Building Operations. They were considerably less enthusiastic about the project,
had other priorities, and ran into a serious technical roadblock while executing our data request.
This caused major delays (over 4 weeks) in obtaining baseline data. In the end, we collaborated
with one of our software developers to devise a work around strategy. It involved using HTTP
scraping techniques, programmatically pulling sash height data right from the building
automation system’s web dashboard.
Despite finding a secondary path to collect information, both datasets were of mediocre quality,
and made analysis difficult. Neither set contained all the hoods in questions for the entire
duration of the experiment, both were patchy and both showed signed of poorly calibrated
sensors. Because of how we managed the project, we only realized this after it was too late.
Recommendation
We should have planned for a calibration process. This could have involved:
● Identifying a data source for every fume hood in question,
● Walking from lab to lab with a laptop or tablet displaying the BAS web dashboard,
matching to the data point and hood definitively.
● Running a simple test, like fully opening and closing every hood, to ensure that that
sensors were well calibrated.
Alternatively, this could have been done while running the workshops and doing the physical
installation.
Other Questions
Could you elaborate on or mention the experiential learning/ASR/MEP/Living
Lab aspect of this project. It would be great to hear about the rationale and
experience of running a sustainability experiential learning activity in a
university setting.
In many ways this project embodied a “living laboratory”. It conducted sustainability
“experiments” on campus operations. Initial research for the project, as well as rough
calculations of the energy savings potential were conducted by students participating in the
McGill Energy Project - a group that uses ASR to address energy sustainability on campus. And
the entirety of the work was carried out by students or recent alumni. However, the time and
resource commitments required for this project would have been very challenging to find
through undergraduate work alone (even if well supported by faculty and staff), and the use of
paid positions felt justified.
Do you have any recommendations on future projects/things to be
explored? You cover what should be done differently. Are there any
related or further opportunities that you/others could pursue?
Immediately following the project, further work was conducted to better analyze where sash-
height energy savings opportunities could be found on campus. This analysis pointed to a
significant potential in Wong. Equipmind is in discussions with Utilities and Energy Management
concerning how to address this potential.
Do you have any recommendations regarding the SPF/thoughts about your
experience as an SPF project team?
It seems like the SPF played an important roll enabling innovative but risky/unproven strategies
to be tested. Follow up work was paid directly by Utilities and Energy Management. One
challenge encountered was the time it took to be repaid for expenses. The existence of an SPF
credit card was not communicated until after the fact. This would have alleviated financial
pressures on the project leaders.