Embed Size (px)
Citation preview

Version Date: 11:00 PM, 711/2009
The Formation and Stability of Carbonic Acidon Outer Solar System Bodies
Z. PeeterSa,b ) R. L. Hudson a,, , M. H. Moore', Ariel Lewis`
b'Code 691, NASA Goddard Space Flight Center, Greenbelt, MD 20771
Department of Chemistry, The Catholic University of America, Washington, DC 20064cDepartment of Chemistry, Eckerd College, St. Petersburg, FL 33711
Manuscript pages: 40 (Text: 16 pages)Figures: 9Tables: 6
https://ntrs.nasa.gov/search.jsp?R=20090033103 2020-01-04T08:52:30+00:00Z

Abstract
The radiation chemistry, thermal stability, and vapor pressure of solid-phase
carbonic acid (H2CO3) have been studied with mid-infrared spectroscopy. A new
procedure for measuring this molecule's radiation stability has been used to obtain
intrinsic IR band strengths and half-lives for radiolytic destruction. Results are compared
to literature values. We report, for the first time, measurements of carbonic acid's vapor
pressure and its heat of sublimation. We also report the first observation of a chemical
reaction involving solid-phase carbonic acid. Possible applications of these findings are
discussed, with an emphasis on the outer Solar System.
Key Words: Ices, IR Spectroscopy; Satellites, Surfaces; Cosmic Rays

the closest planet. In each case, carbonic acid may be formed, and for Callisto a tentative
detection of H2CO3 already has been made (Johnson et al., 2004).
To assess the formation and stability of carbonic acid in the Solar System, it is
important to investigate the molecule's physical and chemical properties, but little such
work has been published to date. Gerakines et al. (2000) compared the yields of H2CO3
made by exposing H 2O + CO2 ice mixtures to ion irradiation (— I MeV H) and to UV
photons (— 10 eV). The same researchers measured carbonic acid's intrinsic IR band
strengths by the growth of products resulting from UV destruction of H2CO3 . Earlier
work also showed qualitatively that carbonic acid's vapor pressure is lower than that of
H2O, CO2, and the observed reaction products, since H 2CO3 is the last of these to sublime
under vacuum in the 200 — 250 K region (Moore and Khanna, 1991). A white color is
likely for H 2CO3 made by acid-base chemistry (photographs in Loerting et al., 2000), and
the work by Winkel et al. (2007) showed that the x-ray powder pattern of frozen H2CO3
is featureless. To our knowledge, little else, if anything, is known of solid-phase carbonic
acid from experiments.
In this paper, we reinvestigate the intrinsic IR band strengths of H 2CO3 and, for
the first time, measure this molecule's radiolytic destruction at several temperatures.
These new radiation experiments take into account amorphization of the sample.
Furthermore, the highest temperature at which destruction measurements are made has
been raised from —10 K to 200 K. Temperature-dependent changes in the position and
width of the H2CO3 feature at 2618 cm-1 (3.82 gm) have been recorded. The first
measurements of the vapor pressure and heat of vaporization of pure H 2CO3 are given,
along with the first example of a low-temperature acid-base reaction of the molecule.

Changes in the IR spectra of irradiated ices were followed by Fourier-transform
infrared (FTIR) spectroscopy using a Nicolet Nexus 760 instrument. In this setup, the
incident IR beam passed through the sample, was reflected by the underlying aluminum
mirror, and then passed through the ice a second time, and to the IR detector, for what are
sometimes called transmission-reflection-transmission spectra. Measurements were
made at 2-cm-1 resolution from 5000 to 650 cm -1 , averaged over 150 scans.
For studying the vapor pressure of H 2CO3 , the compound first was made by an
acid-base reaction between a 1 molar solution of HBr (Sigma-Aldrich) and a 0.1 molar
solution of KHCO3 (Sigma-Aldrich), similar to the technique of Hage et al. (1993). A
few microliters of the KHCO3 solution were injected through a septum, using a syringe,
onto a KBr substrate at 10 K, attached to the tail section of a closed-cycle helium
cryostat. Next, a few microliters of the HBr solution were injected the same way to form
a layer atop the frozen KHCO3 solution. This process was repeated about ten times to
increase the ice's thickness. Subsequent warming of the sample to — 200 K removed the
H2O and initiated a reaction between HBr and KHCO3 to form H2CO3 , changes that were
followed with IR spectroscopy. The sample then was heated to 240 - 255 K, and lR
spectra recorded over time, with a focus on the 1300 and 1500 cm-1 features of H2CO3.
Band areas were measured and combined with intrinsic band strengths, so called A
values, to determine the vapor pressures and enthalpy of sublimation (OH S „ a) of H2CO3
(Khanna et al., 1990). These measurements were made with a Mattson Polaris
spectrometer operating in a conventional transmission mode.

3.2. Radiolytic destruction
The destruction of crystalline H2CO3 by 0.8 MeV protons was followed by
measuring the decrease in IR band areas after various doses. As an example, Figs. 3a and
3b compare spectra in the 2900 — 1500 cm-1 (3.45 — 6.67 pm) region before and after
irradiation to a dose of 2.0 eV molecule 1 . The H2CO3 bands are seen to decrease,
indicating a loss of molecules, and at the same time H2O and CO-) are formed (H20 is not
shown). In addition, irradiation caused the H2CO3 bands to widen, indicating
amorphization of the crystalline sample.
To accurately quantify carbonic acid's radiolytic destruction it was necessary to
distinguish between spectral changes caused by (a) loss of H 2CO3 molecules and (b)
amorphization. This was done by warming the sample to 200 K after each irradiation
step to fully recrystallize the partially-amorphous ice and to sublime away the H2O and
CO2 formed by radiolysis. The ice then was recooled to 14 K, as shown in Fig. 3c, for
comparison to the original spectrum of the unirradiated ice, Fig. 3a. The spectra of Figs.
3a and 3c are similar, but the latter has slightly smaller H 2 CO3 bands, caused by the
destruction of crystalline H2CO3.
The normalized band areas for H2CO3 have been plotted in Fig. 4 as a function of
radiation dose. Table 2 lists all bands that were averaged for this graph along with their
integration limits. Also in Fig. 4 are linear regression lines through the data points. The
corresponding half-life doses for H 2CO3 irradiated at 14, 100, and 200 K are then 11, 11,
and 7 eV molec ^, respectively.
9

temperature. After this annealing cycle, some CO 2 often remained trapped in the H2CO3
(Fig. 3c). In order to relate only the amount of CO2 formed to the amount of H2CO3
destroyed, at each radiation step we subtracted the band area of any remaining CO 2 in the
annealed ice from the area of the CO 2 band recorded after the next irradiation. Table 3
gives the results of these A(H2CO3) measurements at 14 and 100 K, corrected for
amorphization. Because most of the CO 2 product immediately sublimed away upon
formation at 200 K, no band strengths were determined at that temperature. Note that the
measurements in Table 3 are based on A(CO 2) = 7.6 X 10⁻¹⁷ cm molec 1 (Gerakines et al.,
1995), and that no decomposition of H 2CO3 into CO appeared to occur. A few
experiments with H2 13CO3 were conducted to verify that all of the CO 2 formation
observed in our work was due to the proton irradiation, and not from leaks in the vacuum
system. No such contamination was detected in any experiment.
3.4. Radiation yield of H2CO3
The radiation-chemical yield, denoted G, of a substance is the number of
molecules produced by absorption of 100 eV. Previously-reported values for G(H2CO3)
from H2O + CO2 (1:1) ices at 14 K were 0.028, 0.030, and 0.02 for MeV protons and UV
photons (Gerakines et al., 2000), and for 10 keV electrons (Hand et al., 2007),
respectively. These values were based on the growth of H2CO3 IR bands as a function of
radiation dose, and represent the formation of H 2CO3 within an amorphous ice mixture
dominated by H2O and CO 2. We repeated this type of experiment by irradiating H2O +
CO2 (1:1) at 14 K and 50 K in small steps, the 1500 cm -1 band's area being measured
after each irradiation. The column density of H2CO3 was calculated from equation (1)
and this may account for the 8 — 18 cm-1 shift of some bands with respect to their
positions in the radiation-formed H2CO3.
Figure 6 shows the decrease in the normalized average areas for the 1300 and
1500 cm-1 bands of H2CO3 as a function of time at five different temperatures. Each
decrease is related to a change in column density, the number of molecules per cm2
leaving the ice surface as a function of time. To determine column densities we used A
values measured at 100 K. The slopes of similar non-normalized plots gave the
sublimation fluxes (molec m-2 sec 1 ) at each temperature. Equation (4) then was used to
calculate the vapor pressure, P.
Sublimation Flux = p / (27EmkT) 1/2(4)
In (4), m is the mass of an H2CO3 molecule, k is the Boltzmann constant, and T is the
absolute temperature, giving a vapor pressure in Newtons m 2, which was converted to
units of bar. A plot of the calculated vapor pressure from 238 to 256 K is shown in Fig.
7a. Figure 7b shows the same data graphed as in(p) versus 1/T, from which the slope
gives the heat of sublimation as AHsub = 65.2 U mol-1
3.6 Chemical destruction
In addition to measurements of both the sublimation and the radiolytic destruction
of solid H2CO3 , we also have observed H 2CO3 loss by chemical reaction. Previously, we
found that ammonia (NH 3) blocks H2CO3 formation in irradiated solid-phase H2O + CO2
+ NH3 mixtures (Gerakines et al., 2000). In separate experiments, we have irradiated
layered samples consisting of a mixture of solid H 2O + CO2 over a layer of NH3 , both
ices being formed at — 10 K. Subsequent irradiation produced H 2CO3 in the upper layer,
13
5 shows the results of such a calculation, giving a half-life for carbonic acid at 100 K on
both Europa and Callisto.
The spectra we have recorded, such as in Fig. 1, illustrate the differences between
carbonic acid in an amorphous matrix and pure crystalline H 2CO3 . On warming from 14
to 240 K (Figs. 1 b and 1 c), some peaks shift, some bands narrow, and some splittings are
observed. As an example, the broad, weak band near 2555 cm -1 (3.914 µm) sharpens
considerably and moves to 2612 cm-1 (3.828 µm) on warming to 240 K. Figure 2 shows
that this same feature then displays small, reversible shifts in position as the temperature
of the carbonic acid is changed. The importance of documenting such spectral variations
is demonstrated by Fig. 9, which overlays this same OH stretching feature of carbonic
acid on reflectance spectra of Callisto and Europa. The spectrum of pure crystalline
H2CO3 is shown as is one in which carbonic acid is trapped in an amorphous ice mixture.
It is seen that the band shape and position for the amorphous ice provides the better fit.
Any similar feature on Europa is within the noise of the data as demonstrated in Fig. 9.
See Johnson et al. (2004) for a suggestion of H2CO3 as a possible candidate for Callisto.
Additional details on the shifts and intensity changes of 142CO3 features can be found in
Winkel et al. (2007).
Our analysis of data from irradiated H2 CO3 considers both radiation-induced
chemistry and radiation-induced amorphization. Separating these effects is important
because measurements of both H2CO3 loss and CO2 growth are needed for an accurate
determination of intrinsic IR band strengths of carbonic acid. Along these lines, the band
strengths we report in Table 3 are significantly different (> 50%) from some of the older,
uncorrected values.
15
(25.2 U mol-1), which will assist HZCO3 in remaining on planetary surfaces after the
sublimation of the other two molecules. For comparison to other carboxylic acids, AHsub
is 62.5 U mol-1 for formic acid (HCOOH) and 67.9 U mol-1 for acetic acid
(CH300OH). See Calis-Van Ginkel et al. (1978).
Having discussed our results, it is appropriate to point out some limitations and
possible future work. Two sources of error in Table 1 are the unknown density and
radiation stopping power of a 1:1 H2O + CO2 ice. Our approach was simply to assume
these quantities to be an average of the values of the individual components. A direct
measurement, particularly of the density, is desirable.
The H2CO3 formation we report is for this molecule generated in an amorphous
mixture of H2O + CO2 (1:1). However, to quantify carbonic acid production we were
forced to use our A values for crystalline H2CO3 . The reason for this is that neither of the
synthetic techniques we used to prepare H 2CO3 resulted in the pure amorphous material.
To our knowledge, pure amorphous H2CO3 has not yet been made and so no spectra or
band strengths are available. A related difficulty concerned the purity of the carbonic
acid in our vapor pressure measurements. The acid-base reaction used to make H2CO3
gave KBr as a by-product. This is not expected to alter the vapor pressures of Fig. 7, but
a check is desirable, such as with H2CO3 made by a different method.
We also note that our vapor-pressure work was done with an IR spectrometer
operating in a conventional transmission mode, while measurements of radiolytic
destruction utilized reflection spectroscopy. The spectra in the two cases were essentially
identical, as seen in Fig. 5.
17

References
Brown, R. H., Clark, R. N., Buratti, B. J., Cruikshank, D. P., Barnes, J. W.,
Mastrapa, R. M. E., Bauer, J., Newman, S., Momary, T., Baines, K. H., and 15
coauthors, 2006. Composition and physical properties of Enceladus' surface.
Science 311, 1425-1428.
Brucato J. R., Palumbo M. E., Strazzulla, G., 1997. H 2CO3 by ion implantation in
water/carbon dioxide ice mixtures. Icarus 125, 135-144.
Calis-Van Ginkel, C. H. D., Calis, G. H. M., Timmermans, C. W. M., DeKruif, C. G.,
Oonk, H. A. J., 1978. Enthalpies of sublimation and dimerization in vapor-phase
of formic, acetic, propanoic and butanoic acids. J. Chem. Thermodyn. 1978, 10,
1083-1088.
Clark, R. N., Curchin, J. M., Jaumann, R., Cruikshank, D. P., Brown, R. H., Hoefen, T.
M., Stephan, K., Moore, J. M., Buratti, B. J., Baines, K. H., Nicholson, P. D.,
Nelson, R. M., 2008. Compositional mapping of Saturn's satellite Dione with
Cassini VIMS and implications of dark material in the Saturn system. Icarus 193,
372-386.
Cooper, J. F., Johnson, R. E., Mauk, B. H., Garrett, H. B., and Gehrels, N., 2001.
Energetic ion and electron irradiation of the ice Galilean satellites. Icarus 149,
133-159.
DelloRusso, N., Khanna, R. K., Moore, M. H., 1993. Identification and yield of H2CO3
and formaldehyde in irradiated ices. J. Geophys. Res. E 98, 5505-5510.
C
19

< Y
Grundy, W. M., Young, L. A., Spencer, J. R., Johnson, R. E., Young, E. F., Buie, M. W.,
2006. Distributions of H2O and CO2 ices on Ariel, Umbriel, Titania, and Oberon
from IRTF/SpeX observations. Icarus 184, 543-555.
Hage, W., Hallbrucker, A., Mayer, E., 1993. Carbonic acid: synthesis by protonation of
bicarbonate and FTIR spectroscopic characterization via a new cryogenic
technique. J. Am. Chem. Soc. 115, 8427-8431.
Hand, K. P., Carlson, R. W, Chyba, C. F., 2007. Energy, chemical disequilibrium, and
geological constraints on Europa. Astrobiology 7, 1006-1022.
Hansen, G. B., McCord, T. B., 2008. Widespread CO 2 and other non-ice compounds on
the anti-Jovian and trailing sides of Europa from Galileo/NIMS observations.
Geophys. Res. Lett. 35, L01202.
Hibbitts, C. A., McCord, T. B., Hansen, G. B., 2000. Distributions of CO 2 and S02 on
the surface of Callisto. J. Geophys. Res. - Planets. 105, 22541-22558.
Hibbitts, C. A., Pappalardo, R. T., Hansen, G. B., McCord, T. B., 2003. Carbon dioxide
on Ganymede. J. Geophys. Res. - Planets. 108, ID 5036.
Hudson, R. L., Moore, M. H., 2004. Reactions of nitriles in ices relevant to Titan,
comets, and the interstellar medium: Formation of cyanate ion, ketenimines, and
isonitriles. Icarus 172, 466-478.
Johnson, R. E., Carlson, R. W., Cooper, J. F., Paranicas, C., Moore, M. H., Wong, M. C.,
2004. Radiation effects on the surfaces of the Galilean satellites. In: Bagenal, F.,
Dowling, T. E., McKinnon, W. B. (Eds.), Jupiter. The planet, satellites, and
magnetosphere, vol. 1, Cambridge University Press, Cambridge, UK, 485-512.
21
10 P
Winkel, K., Hage, W., Loerting, T., Price, S., Mayer, E., 2007. Carbonic acid: From
polyamorphism to polymorphism. J. Am. Chem. Soc. 129, 13863-13871.
Wu, C. Y. R., Judge, D. L., Cheng, B., Yih, T., Lee, C. S., 1p, W. H., 2003. Extreme
ultraviolet photolysis Of CO2 — H2O mixed ices at 10 K. JGR-Planets. 108, 13-1
—13-8.
Zheng, W., Kaiser, R. 1., 2007. On the formation of carbonic acid (H2CO3) in solar
system ices. Chem. Phys. Lett. 450, 55-60.
Ziegler, J. P., Biersack, J. P., Littmark, U., 1985. The stopping and range of ions in
solids. Pergamon, New York. See also http://www.srim.org .
23

Figure 5. A comparison of the IR spectra of H2CO3 formed by the irradiation of an H2O
+ CO2 (1:1) ice and the acid-base reaction of warmed HBr + KHCO 3 . The upper
spectrum was taken with the reflection method described in the text, while the lower
spectrum was recorded in a conventional transmission mode.
Figure 6. Normalized areas (averaged) of the 1300 and 1500 cm-1 bands of H2CO3
plotted as a function of time for five different temperatures. Each point is from the
average area of the IR bands at 1300 and 1500 cm- I
Figure 7. The vapor pressures of H2CO3 at five temperatures are shown. The slope of
the regression line in the lower graph gives the heat of sublimation, AH,ub = 65.2 U
mol-I
Figure 8. The IR spectrum of the H2CO3 + NH3 solid-phase reaction product compared
to room-temperature ammonium carbonate, (NH4)2CO3.
Figure 9: The IR reflection spectra of Europa and Callisto compared to spectra of
crystalline H2CO3 at 140 K and H2CO3 mixed with H2O and CO2 at 150 K. The H2CO3
absorbance spectra were inverted and arbitrarily scaled for this comparison. Callisto's
observed 3.880 µm (2577 cm -1 ) feature is more similar to that of H2CO3 held in the
amorphous ice.
25

............
0 x 0
ex 0 a
x
r * 4
x
0
Figure
78
76
74
72
70
r 68
GO
64
«»
w^
^^
x*
0x*x
^
[ ^i x * Cooling from 24Oko 14K
° « Warming from 14bm200Kof w
2619
2818
10, 2617
2616
co0 2615
CL
2614
2813
2612
D 50 100 150 200 250
Temperature (K)
° Cooling from 24Vhn14K* Warming from 14 to 200 K
0
w^
1818
3.82
18%2
3.824 --'^
383G +^3
3.828
O 50 100 150 200 50
Temperature (K)
27

Figure 4
•• p+
H 2 CO3 dissociation
El 14K• 100 K
200 K
0 2 4 6 8 10 12
Dose (eV molecule-)
1.'
cc 1.0N
d 0.9
C
00 0.8
(U 0.7N
^0.6
LZ M
0.4
29

Figure 6
1.0
0.9
< 0.8
0.7Mco 0.6
-0 0.5(D
. N 0.4
Ecu
0.3
0 0.2
z 0.1
0.0
H2CO3
9240 K
245 K
248 K
250 K
255 K
0 100 200 300
400 500
Time (min)
31

Figure 8
2.5
Wavelength (ptm)10 20
2.5 r--
O 2.0 Reaction Product
m1.5
0Cn
1.0
a) (NH 4)2CO3 Reference
0.5Nw
0.0
4000 3500 3000 2500 2000 1500 1000
Wavenumber (cm-1)
33

Table I
Physical properties of ices
Molecular Mass Density Proton Stopping PowerIce
----------------(g mol-')
— - ------(g CM-3) (MeV cm 2 9–I)c
H2O 18 1 273
CO2 44 1.7 240
H2O + CO2 (1:1) 31 1.35a 256.5aH 2CO3 62 1 b 254
aAverage value for a H2O + CO2 (1:1) mixture.
bAssumed value.
Talculated for 0.8 MeV protons, according to method of Zeigler et al. (1985).
35
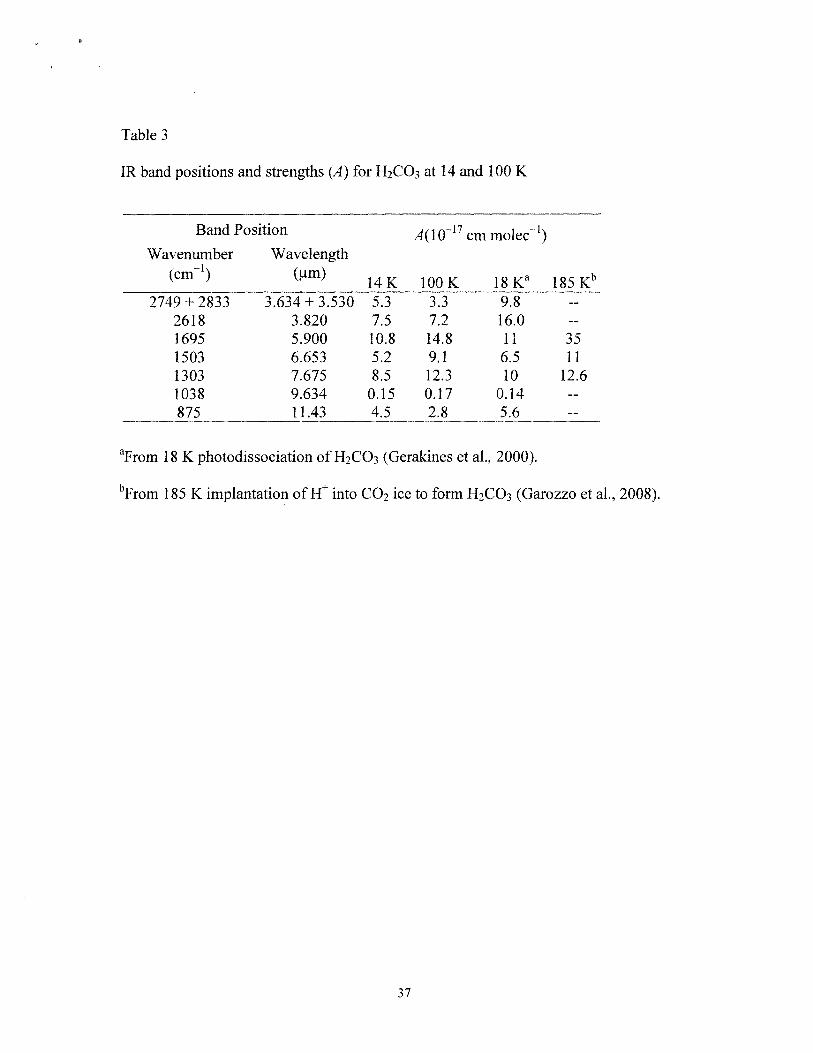
Table 3
IR band positions and strengths (A) for H2CO3 at 14 and 100 K
Band Position A(1 0-17 cm molec-1)Wavenumber Wavelength
(cm 1)(pm)14K 100 18 K
a 185 Kb
2749 +21 833 3.634 + 3.530 5.3 3.3 9.82618 3.820 7.5 7.2 16.0 --1695 5.900 10.8 14.8 11 351503 6.653 5.2 9.1 6.5 111303 7.675 8.5 12.3 10 12.61038 9.634 0.15 0.17 0.14 --875 11.43 4.5 2.8 5.6
a From 18 K photodissociation of H2CO3 (Gerakines et al., 2000).
b From 185 K implantation of H + into CO2 ice to form H2CO3 (Garozzo et al., 2008).
37

Table 5
Half-lives for crystalline H2CO3, based on the 100 K destruction rate in the laboratory,corrected for amorphization
Volume DoseDepth Rate
Environment (gm) (eV molec-I S-1 ) Half-Life
Laboratory 1.0 1.3 x 10⁻³ 2.4 h
Europa a 100 1.0 x 10⁻¹ 35 y
Callisto' 100 2.5 x 10⁻¹¹ 1.4 x 10⁴ y
aVolume dose rates for Europa and Callisto from Cooper et al. (2001).
39

41


![ACIDS, BASES, SALTStestlabz.com/modelpapers/5_17_54_305.pdf · State giving reason which is a strong acid – dil HCl or conc H2CO3. [1] Ans. Dilute hydrochloric acid is a stronger](https://img.dokumen.tips/doc/110x75/5f28e8ed64a59873812f0113/acids-bases-state-giving-reason-which-is-a-strong-acid-a-dil-hcl-or-conc-h2co3.jpg)