Embed Size (px)
Citation preview

The Forage First guide

Contents
3 Foreword
4 How to get the most out of this resource
5 Optimal Dairy Systems
6 Getting what you want from your system
9 Focus on forage
15 Setting targets
21 Know the essentials
35 Great grazing
69 Successful silage
91 Feed delivery
97 Feed performance monitoring
103 Body condition scoring
107 Dry cow and early lactation feeding
115 Nutrition and the environment
119 Summary
AHDB gratefully acknowledges the contributors of the first edition of The Forage First guide. This publication has been written and developed through a team of technical specialists from the following organisations: Oliver Hall and Tony Evans of The Andersons Centre; Ian Powell and Christine Pedersen of The Dairy Group; Will Tulley of Evidence Group; Andrew Henderson of Lambert Leonard and May vets; Dave Davies, Silage Solutions Ltd.
Photographic credits Images are copyright AHDB, except for page 50 which is courtesy and copyright of the Farmers Guardian.

This Forage First guide is for GB dairy farmers with block-calving and all-year-round calving herds. It collates the available knowledge and numbers on forage utilisation and feeding. This data is drawn from AHDB’s extensive research and resources, as well as experienced industry advisors and centres of forage utilisation expertise across the world. Forage First is for all milk production systems. It provides detailed and practical information and advice linked to reducing feed costs on farm and optimising the benefit from the farm’s available forage area. Optimising forage intakes can enhance profitability on farm and make production systems simpler and more robust for the future. Forage production in GB is a major strength, with many areas receiving enough annual rainfall to
establish production systems that make them competitive – not just in the home market, but also in the global marketplace. The information in this publication will give experienced forage utilisers the confidence and knowledge to improve, while those seeking to improve forage utilisation will identify positive and clear guidelines to do so. It will also be useful for those who wish to review their current forage production system and establish a more robust and rewarding business for the future. Forage First should be used by – and is available for – all people involved in the farm business. However, the owners, employees and/or advisors must ensure that everyone is focused in one direction to harvest high quality forage and turn it into profit.
Foreword
Justine Worsey
Rough Grounds Farm, Derbyshire
Autumn block calving
Lowering our costs and improving margins are the top priority. Getting as much milk from forage as possible is the best way to achieve this. We have always enjoyed having the cows outside grazing, so moving to a full paddock system, with a network of cow tracks, which extended the grazing season and improved grass production, was an easy decision. It took a little more thought
to gradually move from all-year-round to autumn block calving, but 4 years on, we have no regrets. We replaced 1 litre of milk from concentrates at £240 per tonne at a feed rate of 0.45, with 1 litre of milk from forage, which saved us 10p per litre. For every 1,000 litres gained from forage, we ended up saving £100 in concentrate costs.Knowing our costs like this is essential. We always want to improve, so monthly costings and benchmarking analysis gives us targets and lets us know what is achievable. Paying attention to detail with our grazing system and silage-making all helps with this. Whatever system you decide to implement, it is important that it is one you believe in and are going to enjoy working with.
William Baillie
Hillhead of Covington, Lanarkshire
All-year-round calving
Nutrition is highly important in the modern dairy cow. We want these cows to give us large volumes of milk, have good fertility and good health, which means good nutrition is essential. The cornerstone of any good diet is high-quality forage. The better the quality of the forage, the better the performance of the animal.In our system, the main forage is grass silage. We are continually trying to make better quality silage by
making more frequent cuts. Maize is not an option in our area. We continue to make some wholecrop silage and this provides an addition of consistent quality to the ration – especially if some cuts of grass silage are of lower dry matter. High-quality forage is the most cost-efficient way of producing milk.Going forward, we are exploring the areas in which we can improve. We have set ourselves targets for increasing milk from forage and reducing concentrate feed rate. Currently, we are in a reseeding programme to improve grass quality and, in turn, improve silage quality. Having invested in our own silage-making equipment, we can take more control over when we make silage; cutting at optimal times and maximising weather windows.
Foreword 3
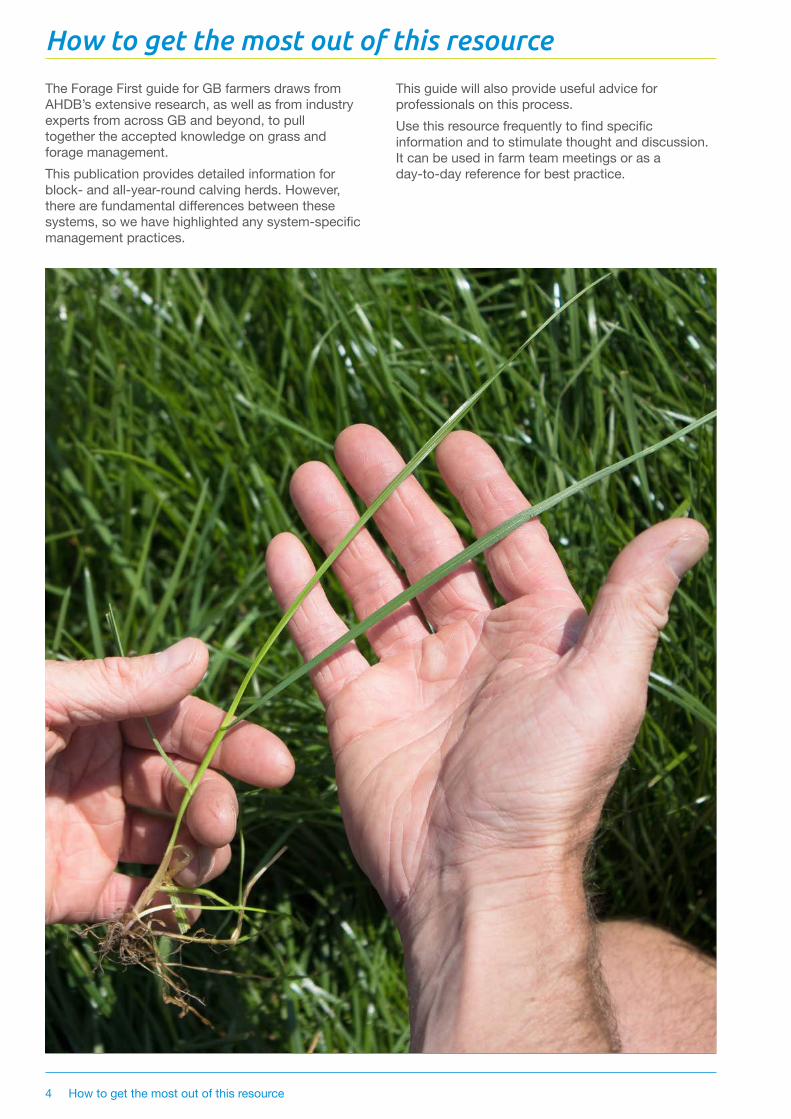
The Forage First guide for GB farmers draws from AHDB’s extensive research, as well as from industry experts from across GB and beyond, to pull together the accepted knowledge on grass and forage management.This publication provides detailed information for block- and all-year-round calving herds. However, there are fundamental differences between these systems, so we have highlighted any system-specific management practices.
This guide will also provide useful advice for professionals on this process.Use this resource frequently to find specific information and to stimulate thought and discussion. It can be used in farm team meetings or as a day-to-day reference for best practice.
How to get the most out of this resource
4 How to get the most out of this resource

Following discussions with a number of stakeholders and farmers across the industry, our sense is that those farms that focus on a clearly defined production system tend to be more profitable and competitive. We also know the best British dairy farmers can compete on a ‘marginal cost’ basis with the best in the world.However, there is significant scope for the industry to narrow the range in performance. The key is to identify the production systems that will enable British farmers to compete, while still satisfying both domestic and international market demand.Fundamentally, we believe that British dairy farmers should focus on one of two systems:
• All-year-round calving system (AYR) – cows calve all year round with no seasonal emphasis and no period where the entire herd is dry. Inputs may vary from extensive herds mainly grazing to fully housed herds with very high yields
• Block-calving system – all cows calve within a 12-week window (spring or autumn), get back in calf, peak in milk production and are dried off together
In Britain, over 72% of dairy farmers identify themselves as all-year-round calvers. This raises a question as to whether this is a conscious decision.
We want farmers to understand their current system, judge their performance by holding a mirror up to themselves and make a conscious, strategic choice about the system that is optimum for them. The following is designed to help farmers start to make that decision.For further details, including background, evidence and our commitment, please read our Delivering a more competitive industry through optimal dairy systems paper, available on the AHDB website.Watch an introduction to the OptimalDairySystems on AHDB Dairy YouTube channel. The AHDB Dairy performance results provide full economic costings of GB dairy herds for the three different calving systems. The figures allow dairy farmers to compare the performance of their own business with others operating the same system and help identify areas where changes might improve profit margins.For the most up-to-date figures across all systems, please see the latest version available from the AHDB website.
Optimal Dairy Systems
Optimal Dairy Systems 5

Getting what you want from your system
1.Mindset
Think about the mindset and approach you have to your business. Do they match with what you are trying to achieve? Will your mindset get you what you are striving for? For example, could you be open-minded to new ideas?
4.Milkbuyerrequirementsandmilkcontract
Understand your current contract and how you can most efficiently produce milk to meet its requirements. If considering making changes, discuss your plans with the milk buyers and, where possible, secure the contract best suited to your chosen system.
2.Currentsystemperformance
A thorough understanding of the farm’s current financial performance and recognition of its key strengths and weaknesses will help inform decisions about future plans. Before considering any change to farming systems, you can benchmark your current performance and compare it against other systems.Use the Optimal Dairy Systems (ODS) KPI benchmarking calculator to input your own data and benchmark yourself, available on the AHDB website.
5.Cashavailability
If you are considering a change of system, be aware that cash flows throughout a year are significantly different between all-year-round and block-calving systems. Any change in system will require careful budgeting and a cash requirement to manage the change process.
3.Currentcalvingpattern
Is the system that you operate giving you what you want, such as a sufficient income, a good lifestyle, a legacy for your family?
6.Labour
Consider whether you have the right labour required to successfully run your system. If labour shortages are an issue, would a change of system help?
Reviewcurrentfarmperformance Considerbusinessimplications
The following flow diagram summarises key factors to consider when reviewing your business.
6 Getting what you want from your system

7.Physicalfarmlimitationsandstrengths
There are key aspects of infrastructure that are required to successfully operate a grassland system. Reviewing these can provide ideas on how farm layout can be further improved to suit the system.
10.Continuetomonitorandreviewcurrentperformanceandyourfutureplans
On-going performance checks and regular reviews of best practice will help ensure that the farm maintains focus and knows its key strengths and areas for development. Testing plans with trusted advisers and fellow farmers is a valuable way of avoiding common mistakes made by others.
8.Skillsandknowledge
Review your own skills and knowledge and/or that of your staff and be honest in assessing areas of strengths and where further skills and knowledge would help the business become more focused.
11.Personaldevelopment
Maintain your own skill sets through initiatives, workshops and courses. These will support you in reaching your business aims.
9.Cowtype
Select the right genetics for traits that reflect the needs of the all-year-round or block-calving system, feeding system and milk quantity/quality desired.
Consideryourtechnicalchallenges Maintainandfurtherdevelop
ForageFirst–Youarehere!
If you are jumping in at this step to improve your technical skills, it may be beneficial to go back a few steps and review your whole farm performance and consider your business implications. A thorough understanding of your farm’s current financial performance and recognition of its key strengths and weaknesses will help inform decisions about future plans and how to get what you want from the business.This will help you identify where to focus to get maximum return for your effort.
Getting what you want from your system 7

8

Focu
s on
fora
ge
10 Overview
11 Foragedrivingprofitability
11 HowcanIcalculatemymilkfromforage?
12 Whymoremilkfromforage?
13 Increasingforageproduction
13 Workingoutforagecosts
Focus on forage

Overview Grazing and forage making are influenced by many factors. Monitoring herd performance, identifying areas of improvement and considering options can help build a framework to improve forage management in your herd.
Focus on forage
10 Overview

Forage First focuses on improving feed efficiency through forage utilisation. Get the most you can from grazed grass, then silages and, finally, make up the deficit with concentrates and other purchased feeds.
Forage driving profitabilityFeed and forage are the biggest costs to GB dairy farms and, on average, account for 33% (10 pence per litre, ppl) of the total production cost. Maximising milk from forage by using home-grown forages and reducing the cost of feed and forage production on farm remains a key driver for increasing farm profitability. Figure 1 shows the average cost of milk production and the share of feed and forage within cost of milk production.
Figure 1. Average cost of milk production and the share of costs attributed to feed and forage on GB dairy farms
Britain’s climate favours growing grass. When efficiently grown and utilised, grass that is harvested by the cow remains the dairy farmer’s cheapest source of feed. As a rule of thumb, grazed grass costs half as much as silage, which, in turn, is half the price of concentrate feed (Figure 2), offering a huge potential to reduce cost in all systems.
Figure 2. Total production costs of home-grown forages versus bought-in concentrates for GB farms Source: Kingshay forage costings report 2017
How can I calculate my milk from forage?Your current milk from forage figure can be:
• Taken from your annual dairy costings report
• Calculated from annual data using the Optimal Dairy Systems KPI calculator
• Benchmarked against other businessesTo get the most from forage, the main aim is to reduce the quantity of purchased feed. This can be achieved by:
• More efficient use of grazed grass
• Better silage quality reducing waste at feeding
*Adapted from data from the College of Agriculture, Food and Rural Enterprise (CAFRE)
Farms with high-yielding herds should aim to achieve at least 3,000 litres of milk from forage. This can be done through a combination of focusing on grazing and the quality of home-grown silages, though the weighting given to each will depend on the production system.The Kingshay Milk Map (Figure 3) is used to identify the efficiency of purchased feed utilisation. It compares tonnes of bought in feed with milk produced per cow. This directly relates to production from forage, so the map gives a reliable comparison of performance without the effects of milk price variation.By moving north or west on the graph, you are either producing more milk from the same concentrates, or the same amount of milk from fewer concentrates. Either way, these represent positive change and you can set a target and compare with previous years.
Figure 3. Total milk produced per cow in relation to purchased feed (kg/cow)Source: Kingshay 2018
Regardless of system, improving milk from forage offers huge potential for most dairy farms in GB to increase profit.
For a 150-cow dairy farm, each additional 1,000-litre increase in milk from forage is equivalent to a difference in net profit of almost £16,000*.
Feed and forage
Other
33Costs of
production (%)
67
250
200
150
100
50
0
Cos
t (£/
t util
ised
DM
)
Grazed grass
Cash costs Fixed costs
Grazed silage (first cut)
Parlour concentrates (18%)
3137
6691
227
Focus on forage 11

Why more milk from forage?It is a good idea to assess the amount of milk you are currently achieving and explore the potential increase in milk from forage your herd can make. Table 1 shows an example farm with a current amount of milk from forage of 1,750 litres. In this example, we use at least 3,000 litres as an achievable target. To meet this target, there are four key actions to be taken to reduce the amount of bought in concentrates.1. Assess current grass quality. Is there a need
to reseed?2. How well is grazed grass being managed?
Rotational grazing, measuring and recording grazing all improve milk production from grazed grass.
3. Assess the current diet. Could cows eat more forage? Check if you are offering at least 12 kilograms of dry matter per cow per day (kg DM/cow/day) from forage.
4. Assess silage quality. Is the energy at least 10.5 MJ/kg DM?
It can be very worthwhile to explore how other farmers are achieving good yields of milk from forage. Discussion groups, meetings and visiting other farms can provide valuable insights about things you can implement to improve your own performance.Take a look at our events page at ahdb.org.uk/events to see what is happening in your area.
Table 1. Potential for improving milk from forage; comparison of multiple factors
Factor Current performance Opportunity Difference (150-cow herd)
Milk yield (L/cow) 7,000 7,000
Butterfat (%) 4.0 4.0
Protein (%) 3.3 3.3
Energy per litre of milk (MJ/L) 5.3 5.3
Concentrates fed (kg fresh weight) 2,500 1,850
Concentrates, DM (%) 87 87
Concentrate energy (MJ/kg DM) 12.8 12.8
Feed rate (kg/litre) 0.36 0.26
Feed cost (ppl) 7.92 5.72
Milk from forage (L/cow) 1,750 3,363
Butterfat price (p/1%) 3.595 3.595
Protein price (p/1%) 3.954 3.954
Milk price (p) 29.40 29.40
Less feed price (ppl) 7.92 5.72 –2.20
Margin/litre (p) 21.50 23.70 +2.20
Herd margin, 150 cows (£) 225,750 248,850 +23,100
Stocking rate (LSU/ha) 1.9 1.9
Nitrogen usage (kg N/ha) 150 200
Cost of N/ha (£) 44 59 –£1185
Tonnes grass utilised (DM/ha) 7.1 8.5
Utilised metabolisable energy (GJ/ha) 107 107
Source: Andersons
12 Focus on forage

Increasing forage productionResearch shows a strong correlation between nitrogen (N) input and dry matter (DM) yield, with an economic response up to at least 300 kg/ha of nitrogen (Figure 4).
Figure 4. The response rate of nitrogen
A good starting point is to look at how much fertiliser was bought last year and what was an average across the land you use for forage production. Now compare your average nitrogen use to the utilised metabolisable energy (UME) you achieved.1. How much scope is there to increase fertiliser
use and DM output from the farm?2. How could you utilise the additional DM?A key target is to provide ad lib forage for the production system. However, when that target has been achieved, additional DM output can be used to improve silage quality by cutting grass at an earlier stage of growth; for example, moving from cutting intervals of 6–8 weeks down to 4–6 weeks and taking more, lighter cuts in a season, also known as the Dutch multi-cut system. Further details of this can be found in the Successful silage chapter (page 70).
Working out forage costsForage costs are often talked about, but rarely calculated. We know grazed grass is the cheapest
feed, but other forage crops can also be used. The additional costs for these (below and in Figure 5) should be calculated:
• Variable costs, such as seed, fertiliser, sprays, crop sundries, contractors
• Overhead costs, such as labour, machinery costs, depreciation and land value
• Dry matter yield (utilised)
• Forage gross margin
Figure 5. Forage factors driving profitability
Feed value versus costBecause different forages and feeds have varying moisture contents and require very different production, handling and storage inputs, it is difficult to compare their values on a like-for-like basis.Forage costs for your farm are influenced by:
• Soil fertility
• DM yield – which crops grow well on your farm?
• Forage quality
• Relative value of energy and protein
• Use of own labour and machinery, or contractors
If grass is grazed, nitrogen makes grass a very cheap feed. It also makes silage production a low cost option compared with purchased concentrates.
1 kg N @ 60p/kg
15 kg DM of grass
Cost of grass = 4p/kg
➔ ➔ £40/t DMor
Increasing forage production really means increasing dry matter yield.
Forage costs
Forage DM output
Profitability
Forage quality
Focus on forage 13

Utilised dry matter costingsVariables across different forages and feeds can be accounted for by basing comparisons on the amount of feed DM compare the economic value of consumed by the cows, known as ‘utilised DM’ (Figure 6).Utilised DM costings are most valuable for comparing similar types of feed ingredients because they do not account for the differences in individual energy and protein contents.They are particularly useful for establishing the relative costs of different forages compared with purchased feeds.Cost comparisons show that:
• Grazed forages are cheapest – particularly clover-rich swards and stubble turnips
• Conserved forages are good value when good yields are achieved and quality is optimised
• Maize remains a good value crop, but only when yields are greater than 7 t/ha
Metabolisable energy (ME) and crude protein (CP) costingsAnother way to compare the economic value of different feeds is to analyse their metabolisable energy (ME) and crude protein (CP) content.The AHDB Dairy relative feed value calculator allows you to do this by using figures for rapeseed meal and barley as comparable feeds. You can add feeds and own forages alongside common products.Calculate and compare different feeds on the basis of ME and CP they supply using the AHDB relative feed value calculator at ahdb.org.uk/relative-feed-value-calculator
Figure 6. Total production costs (£/t DM) of forages versus bought-in concentratesSource: Kingshay Forage costings report, 2020
Notes: WC = White clover, PRG = Perennial rye-grass, RC = Red clover
Prod
uctio
n co
sts
(£/t
utilis
ed D
M)
Grazed
gras
s
Grazed
gras
s (20
% WC)
Chicory
, PRG an
d WC
Grazed
gras
s (old
pastur
es)
Cut an
d carry
Cash costs Fixed costs
Grazed
kale
Stubble
turnip
s
Summer
turnip
s
Forag
e rap
e
Forag
e rye
Grass s
ilage (
first c
ut)
Grass s
ilage (
late f
irst c
ut)
Grass s
ilage (
seco
nd cu
t)
Grass s
ilage (
third cu
t)
Round
bale (s
econ
d cut)
Italian
ryeg
rass (
three
cuts)
Hybrid
ryeg
rass +
RC (three
cuts)
Red cl
over
(three
cuts)
Wester
world
Luce
rne
Fodder
beet (l
ifted)
Forag
e pea
sMaiz
e
Maize u
nder
plastic
Crimped
maiz
e
Wholec
rop
Wholec
rop ur
ea tre
ated
Alkalag
e
Crimped
whe
at
Causti
c whe
at
Hybrid
rye
Wheat
distille
rs
Feed
whe
at (brou
ght in
)
Feed
barley
(brou
ght in
)
Soya (
Hipro)
Parlou
r con
centr
ates 1
8%
400
350
300
250
200
150
100
50
0
Cost of bought-in concentrates
14 Focus on forage

16 Overview
17 Keyperformanceindicators(KPIs)anddrivers
18 Feedconversionefficiency(FCE)
19 Utilisedmetabolisableenergy(UME)
Setting targets Settingtargets

Overview Setting targets for your herd gives you a framework to help identify the things that need to change.It is important to set realistic objectives to assess the performance of your herd. This will help you as you apply and adapt your forage and feeding management plan for your farm. This chapter discusses:
• Feeding-related performance that can be monitored by GB farmers
• Industry performance targets and drivers
• How targets and drivers can be used to identify areas requiring attention in your forage and feeding plan
Discuss your results and proposed targets with your farm team and advisers so they can help to achieve them. Review progress and targets regularly to ensure you are making timely decisions and that good progress is being made.Individual targets must be revised as they are achieved, or as the farm situation changes. After you have evaluated your current level of feeding performance and considered the standard GB targets, it makes sense to select your own target for each measure of performance and to review the following.
• If you have achieved the target, is it economically viable to set the bar even higher?
• If you are far from the target, take small steps to improve by setting a slightly easier target
Setting targets
16 Overview

Key performance indicators (KPIs) and driversOptimal Dairy Systems (ODS) outlines total purchased feed costs as a top-level key performance indicator (KPI) for all-year-round (AYR) herds. Milk from forage is a top-level KPI for block herds and is also useful for AYR herds. These two KPIs demonstrate the performance required for a profitable and sustainable business.Improving overall forage efficiency is integral to reducing total purchased feed costs and maximising milk from forage in any system. Table 2 shows a breakdown of the key drivers relating to milk from forage and total purchased feed costs across different GB calving systems.Enter your own performance and financial figures into the online ODS calculator to see how you benchmark against other dairy businesses in Table 2 below. Visit ahdb.org.uk for more information.
Understand your current performance, work out where improvements can be made and set realistic targets for what can be achieved from the current system.
Table 2. Comparison of key drivers of milk from forage and total purchased feed costs
All figures are 5-year averages
AYR 7–9,000
litres
AYR 9–11,000
litres
AYR >11,000
litres
Autumn 12-week block
calving only
Spring 12-week block
calving only
ODS key performance indicators relating to forage efficiency
Total purchased feed costs (ppl) 8.0 9.0 9.5 6.0 3.0
Milk from forage (L) 2,904 2,765 2,612 3,456 3,809
Key drivers for ODS KPIs (above)
Average cow milk yield (L) 8,000 10,000 12,000 6,650 5,170
Average butterfat (%) 4.05 3.98 3.86 4.35 4.70
Average protein (%) 3.28 3.26 3.23 3.63 3.66
Energy required (MJ/L) 5.3 5.3 5.1 5.7 6.0
Total milk energy required (MJ/L) 42,400 53,000 61,200 37,905 31,020
Concentrates use (kg/L) 0.31 0.34 0.37 0.24 0.14
Concentrates per cow (kg) 2,505 3,440 4,412 1,627 730
Full economic cost of production, dairy only (ppl) 29.9 29.0 27.8 28.6 27.6
Source: AHDB Performance Report 2018/19. Please see our latest performance report figures on the AHDB website
The figures explainedThe data shown in Table 2 represents 5-year rolling average figures for 2015–2020. Note that these include some extreme years for forage growing. Details can be found below.For 12-week spring block calvers:
• In the last 2 years, purchased feeds have gone up by nearly 4 ppl (4.5 ppl in last 3 years)
• The really dry summer(s) has led to this increase in purchased feed
• In the last 2 years, this has contributed to total costs going up by 6 ppl (8 ppl in the last 3 years)
• This scale of increase has subsequently affected the 5-year average
For 12-week autumn block calvers:
• In the last 2 years, total feed and forage costs have gone up by nearly 1.5 ppl (2.5 ppl in the last 3 years)
• The really dry summer(s) has led to this increase in purchased feed, but to a lesser extent than for spring block calvers
• Increases to overhead costs, such as labour and fuel, will affect autumn block calvers more than spring block calvers
• In the last 2 years, total costs went up by 4 ppl
• This scale of increase has also subsequently affected the 5-year average
BLOCK HERDS
Setting targets 17

Feed conversion efficiency (FCE)Feed conversion efficiency (FCE), also referred to as feed efficiency (FE), is a useful measure to determine cows’ relative ability to turn feed nutrients into milk and/or milk components. It is the ratio of milk output to feed input, usually expressed as milk volume or solids yield per unit of dry matter intake (DMI).
FCE is easier to calculate for housed systems, but more difficult for grazing herds for which DMI is hard to accurately estimate. Therefore, FCE is not a particularly useful measure to use with grazing herds.High-yielding cows on high concentrate inputs tend to have a higher FCE – especially if forage quality and digestibility are suboptimal.
Step 1 – Correct milk for fat and protein To make comparisons when milk composition is variable, corrected milk (for energy or energy and protein) should be used instead of milk volume. Several formulas are available to calculate corrected milk. Whichever you choose, make sure you continue to use the same one. One formula used by the International Farm Comparison Network (IFCN) is:
When estimating FCE, it is important to include all feeds used for the milking herd, but not dry cows or youngstock feed.
Step 2 – Calculate FCEThe following formula can be used to calculate FCE:
• Daily milk production (kg) ÷ daily DMI (kg)
• For example: 30 kg milk ÷ 22 kg DMI = 1.4 FCEAs shown in Table 3, FCE of 1.4 indicates a good FCE. Table 3 indicates good and poor FCEs, depending on milk production and DMI. As a general rule, the whole milking group should have an efficiency value of between 1.4 and 1.6. Higher levels (up to 1.8) can be found in early lactation groups, while lower levels down to 1.3 (1.2 for first lactation cows) can be found in late lactation groups*.To improve the FCE of your groups or herd, you can:
• Evaluate the forage energy content (ideally >10.5 MJ ME/kg DM)
• Ensure forage DMI is sufficient (2% of mature bodyweight; e.g. 700 kg Holstein = 12 kg DM/day)
• Make sure your concentrates have a good energy content (13 MJ ME/kg DM)
• Make sure your cows have continuous and easy access to feed. Measure the space available (at least 60 cm/cow – refer to Red Tractor standards for more detailed information on feed space for cattle at different weights)
* Penn State University, 2014
Feed conversion efficiency improves with increasing diet energy content, diet digestibility and milk output because the proportion of the overall energy supply required for maintenance falls.
Solid Milk production x (fat % + true protein %) corrected = milk 7.3
Table 3. Feed conversion efficiency (FCE) ranking relating to milk production and dry matter intake (DMI)
Milk (kg/day)
Dry
mat
ter i
ntak
e (k
g/da
y)
20 21 22 23 24 25 26 27 28 29 30 31 32 33 34 35 36
15 1.3 1.4 1.5 1.5 1.6 1.7 1.7 1.8 1.9 1.9 2.0 2.1 2.1 2.2 2.3 2.3 2.4
16 1.3 1.3 1.4 1.4 1.5 1.6 1.6 1.7 1.8 1.8 1.9 1.9 2.0 2.1 2.1 2.2 2.3
17 1.2 1.2 1.3 1.4 1.4 1.5 1.5 1.6 1.6 1.7 1.8 1.8 1.9 1.9 2.0 2.1 2.1
18 1.1 1.2 1.2 1.3 1.3 1.4 1.4 1.5 1.6 1.6 1.7 1.7 1.8 1.8 1.9 1.9 2.0
19 1.1 1.1 1.2 1.2 1.3 1.3 1.4 1.4 1.5 1.5 1.6 1.6 1.7 1.7 1.8 1.8 1.9
20 1.0 1.0 1.0 1.1 1.1 1.2 1.2 1.3 1.3 1.4 1.4 1.5 1.5 1.6 1.6 1.7 1.7
21 1.0 1.0 1.0 1.1 1.1 1.2 1.2 1.3 1.3 1.4 1.4 1.5 1.5 1.6 1.6 1.7 1.7
22 0.9 0.9 1.0 1.0 1.0 1.1 1.1 1.2 1.2 1.3 1.3 1.3 1.4 1.4 1.5 1.5 1.6
23 0.9 0.9 1.0 1.0 1.0 1.1 1.1 1.2 1.2 1.3 1.3 1.3 1.4 1.4 1.5 1.5 1.6
24 0.8 0.9 0.9 1.0 1.0 1.0 1.1 1.1 1.2 1.2 1.3 1.3 1.3 1.4 1.4 1.5 1.5
18 Setting targets

Utilised metabolisable energy (UME)To assess home-grown forage potential and improve milk from forage, we must look at the energy output from land and benchmark what is currently being achieved.Land is one of the main limiting resources for grazing herds, so it is an advantage to have a guide to the overall effectiveness of land use. A valuable measure of energy output from land is utilised metabolisable energy (UME). UME can be calculated as shown below:
The UME targets shown in Table 4 show the variability between GB dairy farm systems. Poor UME on your farm could be attributed to many factors, including forage quality and yield, which could indicate the need to improve your grassland management, review your nutrient management plan, correct your stocking rate and reseed and/or ensure good soil fertility to optimise grassland efficiency.Key ranges for UME:
• Excellent: >90 GJ/ha
• Good: 70–90 GJ/ha
• Average: 40–70 GJ/ha
• Poor: <40 GJ/ha
A good starting point is to look at your latest soil analysis results and if the results from any fields are more than 4 years old, then resample those fields. Any fields that have a low pH (below 6.0) or have low indices (below 2) for phosphorus and potassium will be limiting grass growth potential and response to nitrogen fertiliser. More detail on this can be found in the Great grazing chapter (page 36).
Table 4. Utilised metabolisable energy comparison of factors between different calving system examples
AYR (per cow)
Autumn (per cow)
Spring (per cow)
Milk yield (L) 8,762 8,470 5,150
Butterfat (%) 4.00 4.22 4.99
Protein (%) 3.22 3.29 3.92
Energy requirement (MJ/L) 5.29 5.46 6.17
Total milk energy required (MJ) 46,354 46,206 31,769
Cow maintenance (MJ/year) 30,000 30,000 27,000
Stocking rate (GLU/ha) 2.0 2.0 1.7
UME (GJ/ha) 101 93 91
GLU: grazing livestock unitSource: The Dairy Group
A calculation for determining the energy requirements of your milk solid production (MJ ME/litre) is shown in the next chapter, Know the essentials (page 22).
UME (GJ/ha) = (Total herd energy requirement – energy supplied from all purchased feed ÷ Total grassland area (ha of land used to support the dairy cows – grazing and silage)
Total herd energy requirement 17,000 GJ/yearEnergy supplied from all purchased feed 7,500 GJ/year
Balance 9,500 GJ/year Total grassland area 170 haUME (GJ/ha) 56 GJ/ha
Efficiency gains in milking cows might be offset by inefficiencies in other areas, so a more accurate way of measuring efficiency would be to estimate the whole farm feed efficiency (WFFE). This includes feed used for dry cows and youngstock, as well as feed wasted. AHDB is currently funding a study with the University of Nottingham under the Research Partnership to estimate WFFE in different dairy farm systems.
Setting targets 19

20 Setting targets

22 Overview
23 Keystepsforyourfeedingstrategy
23 Step1–Establishcowrequirements
28 Step2–Maximisegrassandforageinthediet
30 Step3–Choosehowtofillinthegaps
32 Step4–Feedmineralsandothersupplements
Know the essentials
Kno
wth
ees
sentials

Overview Many home-grown and purchased feeds are available to meet dairy cow energy, protein, mineral and vitamin requirements.Each feed has its own strengths and limitations. It is important to evaluate feed ingredients with ruminant digestion dynamics in mind to ensure that the feeds you choose will improve performance.Even for those with limited interest in nutrition and who prefer to delegate the job to advisors, it is important to understand feedstuffs to ensure cost-effective purchasing and utilisation. The key is to balance available forages with home-produced or bought-in concentrates to meet your herd’s dietary needs in the most efficient way possible.
Know the essentials
22 Overview

Key steps for your feeding strategyThis chapter outlines how to plan a feeding strategy and the feed options available in three key steps.
In rationing, the priorities are:
• Supply – Deliver a good supply of the nutrients required to meet the cows' needs
• Balance – Achieve a balance of ingredients that will optimise rumen function and utilisation
• Intake – Ensure the ration can provide the required nutrition within the cows’ intake capacity
• Cost – Make the most of lowest cost (often home-grown) feeds
• Delivery – Provide rations that can be fed effectively with the equipment and facilities available
Step 1 – Establish cow requirementsThe most important elements to consider when rationing are:
• DMI
• Energy
• Protein
• Minerals and vitamins
Dry matter intake DMI is a measure of feed consumption; it is the weight of feed consumed, excluding water. An accurate estimate of DMI is important when formulating diets to prevent underfeeding or overfeeding nutrients.How much can your cows potentially eat?Before formulating a diet, we need to know the potential DMI of the cows we are feeding (Figure 7). The first determinant of DMI in dairy cows is body weight: big cows eat more than small cows. A typical Holstein–Friesian cow will eat 3.0–3.7% of her bodyweight in DM each day; breeds such as Jersey and Guernsey tend to achieve similar, relatively high DMIs for their size. Finally, first-lactation cows eat less than older cows.
However, other important factors affecting potential DMI are milk composition (or milk quality), milk yield (high yielders have bigger appetites than lower yielders) and days in milk (early lactation cows eat less than mid- and late-lactation cows). Changes in these variables can significantly affect potential DMI.
Figure 7. Dry matter intake affected by management factors (modified from Weiss (2015))
In reality, how much are your cows likely to eat? Potential DMI depends on cow-associated factors, but dietary factors, management and health issues, including excessive fat mobilisation after calving, affects cows’ actual intake.Top tips for feeding management in housed and grazing systems:
• Provide easy, comfortable and sufficient access to fresh feed: check stocking rates, social group (to identify undesirable hierarchy), frequency of push-up and feeding
• Always provide easy access to fresh and clean water
• Monitor any unexpected feed rejection – this may indicate spoiled or contaminated feed, or the inclusion of too much of a new, unpalatable feed (e.g. anionic salts)
While we need to make sure that DMI does not limit milk production, high DMI not accompanied by reasonable increases in milk production are not economically justifiable.
Step 1Establish cow requirements
Step 2Maximise forage in the diet
Step 3Choose how to fill the gaps
Milk yield and quality
Days in milk
Body weight
Actual DMI
Potential DMI
Diet: ingredients, nutrients,
physical formFeeding
management
Know the essentials 23

• Avoid abrupt changes to the diet by gradually adjusting feed over a few days to allow cows to adapt (for example, when opening a new silage clamp with considerably different feed characteristics, or changing paddocks from rye-grass only to rye-grass and clover)
• Reduce stressful events, such as group changes, heat stress, or other environmental triggers, like poor housing
How do you estimate actual DMI?• Total mixed ration (TMR): all ration delivered minus
leftovers, multiplied by DM% of the TMR and divided by the number of cows
• For partial mixed ration (PMR) the calculation is the same as for TMR, plus the extra feed (you will need to know the amounts and DM content of the extra feed)
• For separate ingredients, you will need to repeat the same process above for all ingredients
• Grazed grass – estimate fresh intakes from pre- and post-grazing cover measurements using a rising plate meter or quadrat (details of how to do this are in the Great grazing chapter, page 36), then multiply by DM of the grass and divide by the number of cows that grazed the area
What if cows are eating less than expected?The most common reasons for a lower-than-expected DMI are:
• Low diet digestibility – this is probably the most important factor controlling DMI. The dietary level of neutral detergent fibre (NDF) in bulky diets can greatly affect DMI via a rumen-fill effect. However, this can be mitigated if the NDF digestibility is high
• Unpalatable diet – for example, one that contains spoiled silage or has unpleasant ingredients added, and/or where poor feed trough hygiene and cleanliness is an issue
• Insufficient protein levels in the diet (i.e. <15% DM for cows producing more than 40 kg/day)
• A ration that is too dry (DM content >55%) or too wet (DM content <45%) – this is true for mixed rations
• Unbalanced composition
• Particle size is too long (true for mixed rations)
Example: 100 cows, total delivered: 5,200 kg of a TMR at 45% DMLeftover 200 kg5,200 – 200 = 5,000 kg5,000/100 = 50 kg (fresh intake/cow)50 x 0.45 = 22.5 kg (DMI)
Table 5.The impact of yield on energy and dry matter intake (DMI) requirements
Annual milk yield
(litres)
Typical peak yield (litres/day)
Intake requirement to support peak yield (kg DM/day) Total ration energy concentration (ME/kg DM)
11 MJ 12 MJ 12.5 MJ
Weight loss (kg/day) Weight loss (kg/day) Weight loss (kg/day)
1.0 2.0 1.0 2.0 1.0 2.0
5,000 23 15 13 13 11 12 10
6,000 27 17 15 15 13 14 12
7,000 32 19 17 17 15 16 14
8,000 36 21 19 19 17 18 16
9,000 41 24 21 22 19 20 18
10,000 45 26 24 24 21 22 20
11,000 50 28 26 26 24 24 22
12,000 55 30 28 28 26 25 23
13,000 59 33 30 30 28 27 25
= Areas shaded in red indicate where there is high risk weight loss which could be having a negative influence on the cow.
At peak milk yields of up to 40 litres/day, and providing their diets are sufficiently concentrated, palatable and available, most cows can consume sufficient feed to support their production without drawing too heavily on their body fat reserves.
However, problems can arise when daily DMIs of 24 kg or more are required by yields much in excess of 40 litres/day – even with particularly high energy density diets and relatively high daily weight losses.
24 Know the essentials

See the AHDB webinar Theroleoffibreinthe dairy cow, available on the AHDB Dairy YouTube channel, for further information on dietary fibre.
How to estimate dry matter content of feedOnce you have formulated your animals’ diet, you must check if the actual DMI is close to the predicted value.The DM of forage can vary considerably as you progress through the clamp or the paddock and this can lead to variation in the feed.DM content is probably the most critical and variable component in forage, so it is essential to be able to assess it quickly, easily and regularly to ensure accurate feed formulation – ideally on a weekly basis.Forage for Knowledge provides weekly updates on the DM content of fresh grass across GB. Sign-up for more details: visit ahdb.org.uk/knowledge-library/grassThe DM content of purchased feed is available on the ticket.
Substitution ratesDaily fibre intake is limited by rumen fill. This means that cows could eat more low-fibre feeds than high-fibre forage. Since cows will eat less forage when non-forage feeds are fed, this has important implications on costs and health (Figure 8).Higher fibre feeds (e.g. palm kernels, soya hulls, wheat feed and sugar beet) have higher substitution rates. When buffer-feeding at grass, feeds higher in fibre can lead to significant reductions in grass DMI. Only buffer feed with high-fibre feeds when grazed grass is in short supply.
Figure 8. Forage substitution rates
Energy requirementsEnergy is the first thing to consider in rationing and is usually the first performance-limiting factor. The UK system uses metabolisable energy (ME) expressed in MJ for the total daily energy
requirement, or in MJ/kg DM for energy density of the diet. In adult cows ME is used to cover the needs for maintenance, milk production and reproduction (Figure 9).The example below is based on a typical 600 kg Holstein–Friesian cow producing 30 L of milk/day.
Figure 9. Factors affecting energy requirements
In this example, a lactating cow producing 30 litres, with 3.8% fat and 3.2% protein (2.1 kg milk solids) will require an ME of 226 MJ/day. The same cow in her final weeks of pregnancy will have an ME of approximately 100 MJ/day (maintenance and reproduction).Other external factors influence energy requirements, such as climate/temperature and activity i.e. walking.
0.25 kg silage (48% NDF)1 kg wheat
(12% NDF)
0.67 kg silage (48% NDF)1 kg sugar beet pulp
(12% NDF)
1 kg grazed grass
1 kg buffer
Displaced feed
Maintenance
Supports basic bodily functions
10% of bodyweight + 10 MJ
ME required per day:600 kg = 70 MJ/day
Milk production
Depends on yield and solids (Table 6)
5.2 MJ for every litre of milk(fat 3.8%, protein 3.2%)
ME required per day:30 litres = 156 MJ/day
Reproduction
Higher in final months of pregnancy
40% more ME for maintenance + pregnancy
ME required per day:70 x 40% = 28 MJ/day
Know the essentials 25

Body reservesWhen establishing cow requirements, it is important to consider body reserves because they provide a balancing mechanism between a cow’s energy needs and the energy provided by the diet. When a cow eats less than she needs, she will use her body reserves to maintain bodily functions – in particular milk production (up to a point). Body condition score (BCS) is used to estimate body fat reserves. The ME required to increase BCS, or the ME obtained by losing BCS, depends on liveweight. The complexity of the metabolic pathways involved means more ME is required to gain weight than the ME released by losing weight. The chapter Dry cow and early lactation feeding (page 108) provides further detail and guidance on body condition scoring and negative energy balance.
Table 6. Energy requirements for milk production (MJ/litre)
Milk protein
(%)
Milk fat (%)
3.5 3.6 3.7 3.8 3.9 4.0 4.1 4.2 4.3 4.4 4.5 4.6 4.7 4.8 4.9 5.0 5.1 5.2 5.3 5.4 5.5 5.6 5.7 5.8 5.9 6.0
3.0 4.9 5.0 5.0 5.1 5.2 5.2 5.3 5.3 5.4 5.5 5.5 5.6 5.7 5.7 5.8 5.9 5.9 6.0 6.0 6.1 6.2 6.2 6.3 6.4 6.4 6.5
3.1 4.9 5.0 5.1 5.1 5.2 5.2 5.3 5.4 5.4 5.5 5.6 5.6 5.7 5.8 5.8 5.9 6.0 6.0 6.1 6.1 6.2 6.3 6.3 6.4 6.5 6.5
3.2 5.0 5.0 5.1 5.2 5.2 5.3 5.3 5.4 5.5 5.5 5.6 5.7 5.7 5.8 5.9 5.9 6.0 6.0 6.1 6.2 6.2 6.3 6.4 6.4 6.5 6.6
3.3 5.0 5.1 5.1 5.2 5.3 5.3 5.4 5.5 5.5 5.6 5.6 5.7 5.8 5.8 5.9 6.0 6.0 6.1 6.1 6.2 6.3 6.3 6.4 6.5 6.5 6.6
3.4 5.0 5.1 5.2 5.2 5.3 5.4 5.4 5.5 5.5 5.6 5.7 5.7 5.8 5.9 5.9 6.0 6.1 6.1 6.2 6.2 6.3 6.4 6.4 6.5 6.6 6.6
3.5 5.1 5.1 5.2 5.3 5.3 5.4 5.5 5.5 5.6 5.6 5.7 5.8 5.8 5.9 6.0 6.0 6.1 6.2 6.2 6.3 6.3 6.4 6.5 6.5 6.6 6.7
3.6 5.1 5.2 5.2 5.3 5.4 5.4 5.5 5.6 5.6 5.7 5.7 5.8 5.9 5.9 6.0 6.1 6.1 6.2 6.3 6.3 6.4 6.4 6.5 6.6 6.6 6.7
3.7 5.1 5.2 5.3 5.3 5.4 5.5 5.5 5.6 5.7 5.7 5.8 5.8 5.9 6.0 6.0 6.1 6.2 6.2 6.3 6.4 6.4 6.5 6.5 6.6 6.7 6.7
3.8 5.2 5.2 5.3 5.4 5.4 5.5 5.6 5.6 5.7 5.8 5.8 5.9 5.9 6.0 6.1 6.1 6.2 6.3 6.3 6.4 6.5 6.5 6.6 6.6 6.7 6.8
3.9 5.2 5.3 5.3 5.4 5.5 5.5 5.6 5.7 5.7 5.8 5.9 5.9 6.0 6.0 6.1 6.2 6.2 6.3 6.4 6.4 6.5 6.6 6.6 6.7 6.7 6.8
4.0 5.3 5.3 5.4 5.4 5.5 5.6 5.6 5.7 5.8 5.8 5.9 6.0 6.0 6.1 6.1 6.2 6.3 6.3 6.4 6.5 6.5 6.6 6.7 6.7 6.8 6.8
4.1 5.3 5.3 5.4 5.5 5.5 5.6 5.7 5.7 5.8 5.9 5.9 6.0 6.0 6.1 6.2 6.2 6.3 6.4 6.4 6.5 6.6 6.6 6.7 6.7 6.8 6.9
4.2 5.3 5.4 5.4 5.5 5.6 5.6 5.7 5.8 5.8 5.9 6.0 6.0 6.1 6.1 6.2 6.3 6.3 6.4 6.5 6.5 6.6 6.7 6.7 6.8 6.8 6.9
4.3 5.4 5.4 5.5 5.5 5.6 5.7 5.7 5.8 5.9 5.9 6.0 6.1 6.1 6.2 6.2 6.3 6.4 6.4 6.5 6.6 6.6 6.7 6.8 6.8 6.9 6.9
4.4 5.4 5.5 5.5 5.6 5.6 5.7 5.8 5.8 5.9 6.0 6.0 6.1 6.2 6.2 6.3 6.3 6.4 6.5 6.5 6.6 6.7 6.7 6.8 6.9 6.9 7.0
4.5 5.4 5.5 5.6 5.6 5.7 5.7 5.8 5.9 5.9 6.0 6.1 6.1 6.2 6.3 6.3 6.4 6.4 6.5 6.6 6.6 6.7 6.8 6.8 6.9 7.0 7.0
4.6 5.5 5.5 5.6 5.7 5.7 5.8 5.8 5.9 6.0 6.0 6.1 6.2 6.2 6.3 6.4 6.4 6.5 6.6 6.6 6.7 6.7 6.8 6.9 6.9 7.0 7.1
4.7 5.5 5.6 5.6 5.7 5.8 5.8 5.9 5.9 6.0 6.1 6.1 6.2 6.3 6.3 6.4 6.5 6.5 6.6 6.6 6.7 6.8 6.8 6.9 7.0 7.0 7.1
4.8 5.5 5.6 5.7 5.7 5.8 5.9 5.9 6.0 6.0 6.1 6.2 6.2 6.3 6.4 6.4 6.5 6.6 6.6 6.7 6.7 6.8 6.9 6.9 7.0 7.1 7.1
4.9 5.6 5.6 5.7 5.8 5.8 5.9 6.0 6.0 6.1 6.1 6.2 6.3 6.3 6.4 6.5 6.5 6.6 6.7 6.7 6.8 6.8 6.9 7.0 7.0 7.1 7.2
5.0 5.6 5.7 5.7 5.8 5.9 5.9 6.0 6.0 6.1 6.2 6.2 6.3 6.4 6.4 6.5 6.6 6.6 6.7 6.8 6.8 6.9 6.9 7.0 7.1 7.1 7.2
More than required =
fat deposition
Less than required =
energy mobilisation
Cows increase body condition
Cows milk off their back and lose body condition
Intake
26 Know the essentials

Protein requirements Several systems have been developed to assess protein requirements for dairy cows and to formulate diets appropriately (see Figure 10).Metabolisable protein (MP) is widely used in the UK. MP is the protein fraction that reaches the intestine and is absorbed and used by the cow. A variable proportion of the MP is made of microbial protein flowing out of the rumen, while the remainder is dietary protein that has bypassed the rumen and reached the intestine (RUP). To maintain good milk production, it is essential to meet the MP requirements, maximising microbial protein and, when necessary, by including appropriate sources of RUP.
Mineral and vitamin requirements Minerals and vitamins are needed for optimal milk production, reproductive performance and herd health. Classical deficiency symptoms are rare, but, in many cases, under- or overfeeding certain minerals and vitamins can occur. Even small imbalances can impair reproduction, health and milk production.
• Macrominerals – calcium (Ca), phosphorus (P), magnesium (Mg), potassium (K), sodium (Na), chloride (Cl-) and sulphur (S); requirements expressed in g/kg or in %
• Microminerals or trace elements – copper (Cu), cobalt (Co), selenium (Se), zinc (Zn), iodine (I), manganese (Mn), iron (Fe); requirements are expressed in mg/kg
• Vitamins: requirements are expressed as IU/dayThe National Research Council (NRC, 2001) provides an overview of the mineral requirements of dairy cows – an extract is provided in Table 7.
Table 7. Main macrominerals, trace minerals and vitamin requirements for lactating dairy cows
Holstein (680 kg, 90 days in milk)
Jersey (454 kg, 90 days in milk)
Macromineral (% DM)
Ca 0.62–0.67 0.57–0.63
P 0.32–0.38 0.33–0.36
Mg 0.18–0.21 0.18–0.20
Cl 0.24–0.29 0.26–0.27
K 1.00–1.07 1.03–1.04
Na 0.22–0.23 0.20
S 0.20 0.20
Trace mineral (mg/kg)
Cu 11.00 10.00–11.00
Co 0.11 0.11
I 0.40–0.60 0.34–0.40
Mn 13.00–14.00 12.00–13.00
Zn 43.00–55.00 45.00–51.00
Fe 12.30–18.00 14.00–17.00
Se 0.30 0.30
Vitamins (IU/day)
A 75,000 49,500
D 21,000 13,500
E 545 360
Source: NRC, 2001
Figure 10. Protein requirements and sources
Crude protein (CP)
•Analytical value
•Simple and universal
•Sufficient for traditional feeding systems with modest yields
•Does not take into account the nutritional dynamics of the cow
Rumen degradable protein (RDP)/rumen undegradable protein (RUP/UDP)
•Evolution from CP system
•RDP = fraction available for rumen microbial use
•RUP/UDP = unavailable for rumen microbial use
•For low yielders, RDP is generally sufficient
•High yielders will need the best combination of RDP and RUP/UDP
Metabolisable protein (MP)
•Further development, more sophisticated
• It considers several dietary interactions affecting protein utilisation, especially energy
•Widely used in computer rationing programs
•Essential for high-performing herds
RDP requirement (g) = energy supplied (MJ) x 11.8
RUP/UDP requirement (g) = RDP/100 x yields (litres)
Know the essentials 27

Water requirements Water is often called the ‘forgotten nutrient’, yet milk production means modern dairy cows have a very high daily requirement for drinking water per unit of body mass. High-yielding cows can drink well over 100 litres of water per day and this amount can double in a hot climate.Plenty of good quality water is key to cow performance. Good management of water supplies is essential throughout the year and in all production systems.
Step 2 – Maximise grass and forage in the dietWhen you have established your cows’ requirements, the main goal is to formulate a diet that not only meets these requirements, but also maximises the inclusion of grazed grass and conserved silages, on a least-cost basis.The amount of forage that can be included in the diet depends on several factors, such as the type, quantity available and its nutritional quality (Table 8).
The value of forage• Excellent, generally dilute sources of nutrients
• Valuable fibre for rumen digestion
• Home-grown, so more economically sustainable than other feeds
When deciding which forage to potentially include in the diet, nutritional analysis of the forage and its ability to support milk production, is key.
Grass silageGrass silage offers flexibility, can provide high-quality forage and be integrated into a grazing rotation. It also offers the option of aftermath grazing, or surplus grass can be ensiled as needed.From a feeding perspective, the combination of nutrients plus DM is the key to determining silage feed value and the potential inclusion in a diet. Therefore, to make the best diet formulation decisions, it is essential to regularly analyse clamps and bales for at least dry matter, energy content and protein. Table 8 shows how much daily ME silage can provide depending on its DM and ME content.
Table 8. Effect of DM and ME on the nutritional value of silage
Silage DM (%)
Silage ME (MJ/kg DM)
ME of 40 kg of fresh silage (MJ)
2310.7 98
11.2 103
2810.7 120
11.2 125
Maize silageBehind grass, maize silage is the second most commonly conserved forage in GB. If well managed, it can be a valuable home-grown forage for many herds. Things to remember when feeding maize silage are that:
• Another forage is needed as a source of fibre
• High starch levels boost milk production
• Protein supplementation is essential to meet MP requirements
Table 9. Typical maize silage analysis
DM (%)
ME (MJ/kg DM)
CP (%)
NDF (%)
Starch (%)
25–35 10.5–11.5 7–9 35–45 25–35
Alternatives to maize silage are corn cob mix and crimped maize. Keep in mind that these products have a higher starch content and ME than maize silage (Table 9 and 10).
Table 10. Contents of corn cob and crimped maize
DM (%)
ME (MJ/kg DM)
CP (%)
NDF (%)
Starch (%)
Corn cob mix 55 13 10 45 45
Crimped maize 70 14 10 15 70
Wholecrop cerealsRather than being combine-harvested for grain, cereal crops that are harvested with a forager before they are fully ripe can produce valuable wholecrop silages. These are versatile feeds and a useful alternative when growing maize for silage is challenging. Wholecrop cereals boast generally high DM and reasonable combinations of energy and protein, although actual nutritional values vary with cutting stage and the way in which they are preserved. It is recommended to analyse wholecrop silage before formulating a ration. Well-produced wholecrop can be particularly valuable in forage mixtures to improve dairy cow intake and performance – primarily milk quality, rather than volume.
If well managed, forage can be more cost-effective than many concentrates in any system.
28 Know the essentials

Wholecrop can be ensiled in a similar way to maize (fermented wholecrop), or treated with feed-grade urea before ensiling. Note that, in this case, the content of ammonia-N will be higher and this must be considered in the diet formulation (Table 11).
Legume silagesBecause they tend to have high fibre levels, legume silages have relatively low energy content (typically an ME of 9–10 MJ/kg DM for pure legumes). However, this fibre is digested rapidly and, for this reason, the effective ME is much higher than indicated by the analysis. ME and protein content are both boosted by harvesting at the early bud stage. Laboratory analysis remains valuable because the protein content of legume silage varies widely depending on species, sward content and harvest. Since protein is contained mainly in the leaves, a high degree of leaf shatter (when crops are harvested too dry, over 35% DM) decreases protein content. The high buffering capacities of legumes make these silages more resistant to acidification, so greater care and attention is needed when ensiling to ensure stable fermentation and good preservation.
Hay and strawHay normally has a lower nutritional value than silage, but is a better source of fibre to stimulate rumination. Quality hay with high digestibility can provide good
levels of energy. Poorly made hay (for example, hay that is heated or mouldy) is not only unpalatable, but has a low nutritional value. Heating can increase the amount of unavailable protein (Table 12).Straw, particularly barley straw, can be a useful filler. Furthermore, because of its low nutritional value, it is particularly suitable for dry and low-yielding, late lactation cows.There is no recognised laboratory method for evaluating straw, so assessing feed quality involves determining the ratio of leaf to stem. The more leaf (with a typical ME of around 9 MJ/kg DM) to stem (4 MJ/kg DM), the better. Palatability is also critical: feeding straw should have no mould and bales should spring apart when the strings are cut.
Buffer cropsBuffer (or catch) crops are valuable for filling gaps in grazed pasture supply. They can also be used to extend the grazing season for some or all classes of dairy stock in spring and autumn, or during the summer as grazing, or when feeding during drought.Most buffer crops give high yields of nutritious feed per hectare. However, variable – and often relatively low – feeding values can make buffer crops unreliable and better suited to late lactation, or dry cow feeding.Buffer crops must be managed correctly for maximum yields and utilisation (Table 13).
Table 11. Typical values of fermented and urea-treated wholecrop
DM (%) ME (MJ/kg DM) CP (%) Starch (%) pH Ammonia N (% of total N)
Fermented wholecrop 30–50 9.5–11.5 9–11 15–30 3.8–4.8 3–7
Urea-treated wholecrop 50–80 9.5–11.5 15–25 25–35 8.0 25–35
Table 12. Typical nutritional value of hay
DM (%) ME (MJ/kg DM) CP (%) NDF (%)
Highly digestible hay 85 10.1 9.0 55
Poorly digestible hay 85 7.5 7.5 65
Table 13. Typical buffer crop feeding values
DM (%) ME (MJ/kg DM) CP (%) NDF (%) Maximum daily intake (kg/cow fresh weight)
Kale 13.0–15.0 10.0–12.0 16.0–22.0 20.0-35.0 25
Stubble turnip 8.0–11.0 11.0–12.0 17.0–18.0 20.0–25.0 40
Forage rape 9.0–12.0 9.5–11.5 18.0–20.0 20.0–22.5 50
Swede 10.5–11.5 12.5–13.5 9.0–11.5 22.0–25.0 20
Turnip 10.0–11.5 11.0–13.5 17.0–18.0 22.0–25.0 50
Fodder beet 17.0–20.0 12.0–13.5 12.0–13.0 15.0–20.0 25
Forage rye 13.0–20.0 9.0–12.0 11.0–12.0 25.0–50.0 50
Know the essentials 29

Fodder beet• Significant yields of highly digestible DM for winter
grazing or lifting and feeding
• Add long fibre to complement high sugar levels
• Soil contamination can be a risk
• Beet tops can taint milk – wilt before feeding
• At normal rates of 25 kg/cow/day, 1 ha of fodder beet feeds 100 cows for 1 month
Kale• Useful for late summer strip grazing
• Flowering plants unsuitable for dry cows (they contain goitrogens, which affect the thyroid)
• Feeding large amounts can taint milk
• Supplementing with selenium or iodine may be required
• At a normal rate of 20 kg/cow/day, 1 ha of kale feeds 100 cows for 1 month
Stubble turnip• Useful for late season strip grazing
• Short 10-week growing period
• Variable yields, especially in dry season
• Low fibre and protein levels mean it can support only low production levels
• At normal rates of 40 kg/cow/day, 1 ha of stubble turnip feeds 100 cows for 10 days
Forage rape• Late season strip grazing
• Variable yields
• Low fibre means it can support only low production levels
• Supplement with fibre sources (for example, baled silage)
• At normal rates of 45 kg/cow/day, 1 ha of forage rape feeds 100 cows for 1 week
Swedes and turnips• Large quantities of high-energy DM for winter
grazing or lifting and feeding
• Both highly palatable
• Successfully grazed by older cattle with fully mature teeth; not suitable for heifers
• Swedes tend to be consistently higher yielders and energy producers
• High levels of soil contamination and wastage
• Swedes can taint milk if fed in excess before milking
• Like kale and forage rape, there are various hybrids for feeding
• At normal rates of 20 kg/cow/day (swedes) and 25 kg/cow/day (turnips), 1 ha of swedes or turnips feeds 100 cows for 2 weeks
Forage rye• Fast-growing rye-grass
• Useful provider of early spring grazing
• Can quickly run to stem and lose feeding value
• Start grazing early
• Control fertilisation to avoid excessive growth
• Cut and carry to improve intakes and reduce waste
• Low protein levels and modest energy values
• At normal rates of 30 kg/cow/day, 1 ha of forage rye feeds 100 cows for 1 week
Step 3 – Choose how to fill in the gapsWhile forages are the ideal natural basis for ruminant feeding, supplementation is usually necessary to fulfil requirements when feeding herds with high production levels.
Choice of concentratesConcentrates provide highly concentrated sources of energy and protein to supplement forages and fill the gap to meet cow requirements.
Diminishing response to concentratesAs with most inputs, there is a diminishing response from additional concentrates, with the first 3 kg/day resulting in a small substitution of forage. However, as feed level rises, the amount of substitution increases to a point at which there is no economic gain from feeding more concentrate.The economics depend on the ratio of milk price to feed cost, which varies from farm to farm. The AHDB milk to feed price ratio (MFPR) shows the 5-year rolling value (Figure 11).
Figure 11. Calculated milk to feed price ratioSource: AHDB/Defra
1.50
1.45
1.40
1.35
1.30
1.25
1.20
1.15
1.10
1.05
1.00
Milk
pric
e ra
tio
Jul 1
6
Sep
16
Nov
16
Jan
17
Mar
17
May
17
Jul 1
7
Sept
17
Nov
17
Jan
18
Mar
18
May
18
Jul 1
8
Monthly 5-year rolling average
30 Know the essentials

As feed level increases, the amount of substitution increases to a point at which there is no economic gain from increased concentrate feeding.
When deciding what to use to top up the forage component of a diet, there are several options, including cereals, legumes, oilseeds, roots, fruit and coproducts.
Which concentrate to use?There are several aspects your nutritionist will consider when including concentrates as straights or blends, or when suggesting a parlour cake.
Table 14. Overview of concentrate types
Type of concentrate Advantages Remember
Straights
Individual feed ingredients, home-grown or purchased
Best utilised through forage boxes or mixer wagons
Wide variation: often derived from many different factories and countries and may have been transported over long distances in different conditions
If coproducts, the nutritional value depends on both the value of original raw materials and how these have been processed
Known nutrient sources and analyses
Cheaper than blends or compounds if bought well
Complete flexibility to fine-tune rations as required
Ingredients with similar names can have very different nutrient values – ask for a precise description and value before purchase
Quality can vary between loads – purchase from a reputable source and, if possible, analyse each load
Large loads are often necessary to secure best prices
Good, dry, vermin-free storage is needed
Minerals and vitamins need to be added on-farm
Farm ration formulation skill is required
Blends
Unpelleted mixtures of ingredients in varying degrees of sophistication
Halfway between straights and compounds
Best utilised through forage boxes or mixer wagons
Known nutrient sources and analyses
Some economy compared with compounds, depending on sophistication level
Improved cash flow compared with large loads of individual straights
Saving on-farm mixing and ration formulation complexity
Different sources vary in the sophistication of blending
Mixing can be variable, depending on product
Ingredients can separate out during storage and handling
Quality and analyses can vary between loads
Minerals and vitamins may not be included
Good, dry, vermin-free storage is needed
Some degree of farm ration formulation skill is likely to be required
Compounds
Pelleted mixtures of ingredients, generally well balanced and mineralised
High sophistication and convenience
They can be parlour-fed or via out-of-parlour feeding systems, as well as in midday mixes, forage boxes and mixer wagons
Nutritionally consistent from pellet to pellet
No opportunity for ingredient selection during feeding
Fully balanced feeds with mineral and vitamin inclusions
Greatest ease and convenience of use
Improving cash flow compared to blends or straights
Formulation and processing make them more expensive than either straights or blends
Little information may be provided on the precise formulation
The only flexibility offered to adjust rationing is by the amount fed
On most units it is generally difficult to simultaneously store more than two compounds
The consistency and quality of pelleting may vary between suppliers, mills and deliveries
Know the essentials 31

The most important are:
• Forage nutritional characteristics – when you know the share of requirements that can be met through maximised forage intake, you and your nutritionist can work out the type and quantity of concentrates needed
• Availability of home-grown feeds
• Availability and price of purchased ingredients
• Facilities (for example, storage, machinery, feeding options such as in-parlour or trough)
Before using less common feeds, specialist advice may be needed to avoid pitfalls. These feeds will also benefit from analysis to ensure their most cost-effective utilisation. Table 14 provides further details of different types of concentrates.Relative feed value (RFV)Concentrate feed rate per litre relates directly to milk from forage and is affected by the energy content of the concentrate feed. For straight feeds, standard values can be used. The energy value of purchased compound feeds varies considerably and the only certain way of knowing is to have the feed analysed. It is not currently compulsory to include information about energy content on the feed label.One way to compare the economic value of different feeds is to assess the ME and CP they supply.The AHDB Dairy relative feed value (RFV) calculator allows you to do this, using figures for rapeseed meal and barley as comparable feeds. You can also add feeds and own forages alongside common products.
Key points • The total amount of concentrates fed per year is
likely to be in the range of 1,000–3,000 kg/cow
• Cows may be grouped depending on their stage of lactation, with high and low yielders receiving different diets and levels of concentrates
• In-parlour feeding may be needed for all-year-round calving herds to adjust concentrate level for different stages of lactation and for yield potential
• Shedding gates can be helpful for allowing cows to graze as one group and then separating high yielders so they can be buffer fed with a higher level of concentrates
• The concentrate allocation is generally 5–8 kg/cow/day for the first 100 days (depending on concentrate characteristics, forage quality and yield potential) before being reduced
Step 4 – Minerals and other supplementsAs well as providing the right combination of energy, protein and fibre, dairy rations need to be well balanced for various macrominerals, trace elements and vitamins. These support the level of performance required for your herd – especially high-yielding cows.Several feed supplements also promise various benefits from the provision, for example, of specific amino acids, protected fats and other digestive aids. The potential benefit of these products must be assessed against their costs.
Evaluating mineral and vitamin supplementsCows require sufficient minerals and vitamins to avoid imbalances or deficiencies. Although deficiencies can seriously affect performance, most feed ingredients (especially forages) provide reasonable levels of minerals and vitamins. A final check when rationing will disclose any need for supplementation.
Generally, the use of proprietary mineral mixes and/or supplemented compound feeds providing 40% of energy intake means deficiency problems are unlikely. On the other hand, there may be a risk of overfeeding certain minerals; for example, copper, which causes toxicity in excess amounts. The chapter on Nutrition and environment (page 115) provides further information. For many herds, overfeeding minerals can also be a source of serious financial wastage.
MacromineralsTo avoid metabolic disorders, such as milk fever or hypomagnesaemia (staggers), extra calcium (Ca), phosphorus (P) and magnesium (Mg) may be required at specific times.Rather than avoiding deficiency, often, the main challenge with other major minerals, such as sodium (Na), potassium (K) and sulphur (S), is to
Even though you may not have a direct role in the formulation of your herd’s diet, an understanding of the main characteristics of the ingredients will be invaluable for ensuring the greatest value from feed purchasing and utilisation.
Mineral analysis of forage and feedstuffs is essential to ensure that levels are correct.
Many farms feed minerals above requirements to address fertility, health and performance problems. This results in considerable unnecessary expense.
32 Know the essentials

avoid levels that are too high, or imbalances that may reduce the utilisation of other nutrients or induce metabolic disorders.Trace mineralsMany of the key trace elements, especially copper (Cu), cobalt (Co), selenium (Se), zinc (Zn) and iodine (I), are adequately supplied in most diets, but it is always advisable to check rations and balance them as required.Such checks are particularly important in areas with a history of trace element deficiency, as shown by soil testing.Copper deficiency is common in dairy cows, so they are generally given supplements to avoid it. However, there is increased evidence of oversupplementation, which can impair health and productivity and – in acute cases – can be fatal. See our webinars on copper for more information, available at AHDB Dairy Youtube channel.
Methods of supplementationBoluses typically contain no macro-minerals, but can help to ensure consistent trace element supplementation.Mineralised compounds can be expensive, but are a simple way to introduce consistent supplementation.Custom minerals are essential in a mixed ration, based on a review of the diet and changes such as forage type or quality.Water supplements can lead to issues with variable intakes within groups. It is also important to test water quality at the point of use for mineral content and bacteriology, regardless of source.Mineral licks can be expensive and intakes are unpredictable.
Pasture dusting is an appropriate way to supplement minerals. However, there are losses at application, particularly in windy conditions.
Other supplements: some examplesAmino acids• A balanced combination of protein from feeds
and microbial protein from the rumen can provide perfectly adequate levels of amino acids
• In certain situations (for example, in high-yielding cows, >10,000 L or imbalanced diets), synthetic versions of the essential amino acids lysine and methionine may need to be added
• Supplements providing these amino acids are expensive. Use sparingly and only give to groups that are likely to show a performance response, rather than feed across the whole herd
Protected fats• A rich source of energy – small quantities of fats
or oils offer the opportunity to increase the energy density of rations
• Excessive amounts of fat may impair rumen fermentation. In a TMR do not exceed 6% of oils (DM basis)
• Fats protected from breakdown in the rumen can help to prevent any negative effect on fibre digestion
• Effectiveness depends on the extent to which fats are protected in the rumen, while still allowing the fats to be available for digestion in the small intestine
• The most cost-effective response is likely to be seen from high-yielding cows
Know the essentials 33

Yeasts• Claim to improve performance by helping to
stabilise rumen conditions and allow optimum fibre digestion
• Although they may be beneficial in some feeding systems, it is difficult to independently quantify response and calculate whether their inclusion is cost-effective
• Introducing a yeast product for 1 month in a period of stable milk output should allow any response to be detected
Sodium bicarbonate• Can be fed to help maintain rumen pH levels for
optimal fibre digestion in the rumen
• Cows have a tremendous rumen buffering ability, particularly through saliva production. Bicarbonate supplementation is probably unnecessary in most circumstances
• It can be valuable in situations in which the diet is very acidic (for example, if there is a high content of fermentable ingredients) or when the effective fibre content of the diet is low
Checklist for mineral management• Dedicate one team member to control the herd’s
mineral supplementation
• Analyse all forages for mineral composition. Grass-based forages are more variable than straw, maize silage and wholecrop
• A mineral review must consider mineral supply from the total feed, including the trough ration and any additional concentrate feeds; for example, dry cow rolls, mineral licks, boluses and drenches.
• Do not overlook the duration of activity of supplements such as boluses – always record when they were administered
• When calculating mineral supply from variable rate feeds (for example, parlour cake), work out the rate for the average cow in the herd, then check for under- or oversupplementation by calculating supply for animals receiving the lowest and highest allocations. Then, compare total mineral supply for the individual animal with their requirements
• If required, a bespoke mineral supplement can be formulated
• Review mineral provision every 6 months
34 Know the essentials

36 Overview
37 Whatisgrazedgrassworthyouto?
38 Grazingandforagecalendar
40 Understandingthegrassplant
41 Basicgrazingterminology
43 Basicgrazingmanagement
44 Residuals–howhardtograze?
46 Infrastructureset-up
52 Managingandallocatinggrazinggrass
56 Preparingandmanagingagrazingplan
58 Autumnclosing
60 Springturnout
63 Wetweathermanagementplan
64 Mid-seasonmanagement
65 Dryweathermanagementplan
66 Weedcontrol
67 Peopleandgrasslandmanagement
Great grazing
Greatgrazing

Overview Making the most of grazed grass on your farm offers a huge opportunity to increase profits. There are ideas in this chapter for you, whether you are new to grazing, or want to improve your skills to become a top performer. A flexible approach, combined with planning for different scenarios, will equip you with the tools and confidence needed to adapt to the different requirements of each season.See the Grazing and forage calendar (page 38) for key information for each month to get you started.
Key pointsTo get the best productivity from grazed grass, we must ensure three things:
• Optimum production (quantity) – In most of GB, pasture is capable of growing over 12 tonnes of dry matter per hectare (t DM/ha). Set realistic targets for your farm, depending on rainfall and your own data or Forage for Knowledge historic data
• Optimum quality – An average metabolisable energy (ME) of 12 MJ/kg DM throughout the grazing season
• Optimum utilisation – For maximum intakes with minimal wastage, aim for 80–85% utilisation rate of grass grown
Great grazing
36 Overview

What is grazed grass worth you to?Often overlooked, grass is the most important resource for dairy enterprises. Well-managed grassland provides the most economic feed throughout the year, either as grazed or conserved forage.As production costs continue to rise, well-managed grazed grass is undoubtedly increasingly important for on-farm profitability for milk producers. Focusing on both growing and utilising more, high-quality grazed grass will reduce dependence on purchased feed and, in return, improve farm profit.
AHDB Forage for Knowledge (FFK) delivers the latest information about grass and forages, providing weekly grass growth and quality data from contributor farms located across GB. FFK aims to help you monitor seasonal grass growth, manage accordingly and benchmark against your own grass growth data.To sign up for FFK updates, visit ahdb.org.uk/knowledge-library/grass
The first and foremost aim for any grazing system is to increase the proportion of high quality grazed grass in the diet. A key lesson learned from FFK is that well-managed grazed grass will provide a feed with an ME average of 12 MJ/kg DM throughout the grazing season. See Figure 13.
Figure 13. Seasonal metabolisable energy (ME) content for Forage for Knowledge (FFK) contributors
Increasing grass ME value from 10.5 to 12.0 MJ/kg DM increases production from grass by 2.8 litres/cow at a dry matter intake (DMI) of 10 kg DM of grazed grass. See Table 15.
Table 15. What is grazed grass worth?
DMI (kg DM) Category
Grass ME 10.5 MJ/kg
DM
Grass ME 12.0 MJ/kg
DM
10
Energy from grass (MJ) 105 120
Energy for milk production (MJ)
105 – 70* = 35
120 – 70* = 50
Milk from grass (litres) 6.6** 9.4**
12
Energy from grass (MJ) 126 144
Energy for milk production (MJ)
126 – 70* = 56
144 – 70* = 74
Milk from grass (litres) 10.5 14
14
Energy from grass (MJ) 147 168
Energy for milk production (MJ)
147 – 70* = 77
168 – 70* = 98
Milk from grass (litres) 14.5 18.5
* Maintenance requirement calculated for a 600 kg cow** Energy required to produce 1 litre of milk = 5.3 MJ (based on production of 4% butterfat and 3.3% milk protein). See the Know the essentials chapter for further guidance
Increasing the proportion of grazed grass in the diet of cows will further improve production from grazed grass. By increasing the DMI of 12 MJ/kg DM grass from 10 to 14 kg, milk production increases by 9 litres to 18.5 litres.
Improving pasture utilisation by 1 t/ha is worth an additional profit of £334/ha/year (AFBI, 2017). For a farm with a grazing platform of 50 ha, this is worth an additional £16,700/year.
Figure 12. Locations of FFK contributor farms
11.0
11.5
12.0
12.5
13.0
8 Mar 8 May 8 Jul 8 Sep 8 Nov
Gra
ss M
E co
nten
t (M
J/kg
DM
)
2007–2019 average
Great grazing 37

Grazing and forage calendarMonth Grazing tasks Silage tasks
Aug
The next grazing season starts now with managing autumn pastures
Finalise your autumn rotation plannerReview grass silage yields and reseed where necessary to improve sward quality
‘Clean out month’ and time to ensure pastures are grazed down to target residual, 1,500 kg DM/ha Prepare clamps for maize silage
Sep
Highest average farm cover (AFC) should be achieved in mid-to-late September, with a rotation length of more than 35 days from mid-September
Keep an eye on maize crop ripeness to harvest at optimum dry matter
Assess roadway surface quality and water supply through assessing water flow and trough size
When all silage is harvested, review the silage budget for this cropping year and reconcile with silage requirements for the next 12 months
Apply lime in accordance with your most recent soil pH results. Re-test soils if your analysis is over 4 years old
Closed period for applying manufactured nitrogen fertilisers starts 15 September for grassland across all soil types until 15 January in NVZ's
Closed period for applying organic manure with readily available nitrogen content (e.g. slurry, poultry manures) on shallow or sandy soils starts 1 September for grassland in NVZ's
Sample silages for analysis and formulate rations
Oct
Start last rotation around 5–10 October and aim to graze and close 60% of the platform in October
Graze all covers >3,000 kg DM/ha in October, especially on wet farms
Use multiple access points and use back fencing if needed to reduce poaching
Review silage yields and quality analysis and identify possible areas for improvement next season
Closed period for applying organic manure with readily available nitrogen content (e.g. slurry, poultry manures) on all other soil types apart from shallow or sandy soils starts 15 October for grassland in NVZ's
Soil sample any fields not sampled within the last 3–4 years and develop a nutrient management plan for the following spring
Nov
Aim to graze the remaining 40% of the platform and finish the last rotation by 15–20 November
Target closing AFC at housing should be around 2,150–2,230 kg DM/ha on 20 November
Review silage budget for this cropping year and reconcile with silage requirements for the next 12 months
Dec Conduct annual tonnage report and set targets for following year and identify paddocks for improvement
Jan
Fencing, tracks and water troughs MOT to be carried out before turnout
Analyse borehole water
Finalise spring rotation planner
Ensure silage clamp face is kept clean to reduce wastage
Test any newly opened silage clamps or new set of bales
Feb
Soil sample 25% of the farm (rotating to ensure each field is sampled every 4 years)
Capitalise on grazed grass by turning out to pasture as soon as possible when covers are around 2,400–2,600 kg DM/ha
Achieve target residuals of 1,500 kg DM/ha at the start of the season
Begin nutrient applications for grass, as per nutrient management plan and in line with NVZ's regulations
Aim for 30% of the grazing platform to be grazed by the end of February
Discuss your requirements and expectations and agree a price for silage-making with your contractor
38 Great grazing

Grazing and forage calendar (continued)Month Grazing tasks Silage tasks
March
Wait until soil temperatures rise to 5–6°C for five consecutive days before applying N fertiliser
Practice on/off grazing; be flexible in wet weather conditions and use multiple access points
Review silage budget for this cropping year and reconcile with silage requirements for the next 12 months
Aim to graze 60% of the platform by 20 March Roll silage fields if necessary
Ensure livestock magnesium requirements are met to prevent grass staggers Prepare clamps for first cut
April
Aim to complete first rotation (100% grazed) 7 days before magic day
For GB farms, magic day normally arrives between 4 and 20 April. Make a note of when grass supply matches grass demand on your farm for future reference
After magic day you will need to shift from managing a deficit to dealing with a surplus
Drill forage maize and apply nutrients, as per nutrient management plan
Cows should be offered an all-grass diet if appropriate Aim to take first cut in early May – analyse grass for nitrates and sugars pre-cutting to achieve high-quality
May
Reduce rotation length depending on grass growth rates, usually between 18 and 21 days
Have a dry weather management contingency plan in place to minimise the effect on forage stocks and livestock performance
Prepare a silage budget for this cropping year and reconcile with silage requirements for the next 12 months
June
Measure grass twice a week when grass growth rates hit 75 kg DM/ha Estimate the quantity of silage required for the next 12 months
Remove grass surplus as silage. Do not wait to bulk up; focus on the grass quality in the next grazing round
Develop a cropping strategy to produce sufficient silage to meet estimated requirements for the next 12 months
Aim to take second cut 30–35 days after first cut
Aim to take third cut 30–35 days after second cut
July
Monitor grazing to ensure residuals are consistently met and that wastage does not build up in the bottom of the sward Prepare clamps for wholecrop silage
In a hot summer, consider the implications of heat stress on your herd and have a ‘Plan B’ to reduce exposure to heat
Keep an eye on cereal crop ripeness, if harvesting as fermented wholecropAim to take fourth cut 30–35 days after third cut (multi-cut system)
Great grazing 39

Understanding the grass plant
Perennial rye-grass • Leaves are hairless, have a defined mid-rib,
are ribbed on the upper surface and shiny underneath
• Emerging leaf is folded
• Reddish/purple base (you may need to peel back dead leaf material to see this)
• Plants are made up of several tillers
• Each tiller has its own leaves and rootsRye-grass is a living plant in a continuous cycle of growing and dying (Figure 14), but it only has three live green leaves at any given time. Water and fertiliser influence the size of those leaves.To start growing, rye-grass plants typically require a soil temperature of about 5°C at a depth of 10 cm for five consecutive days. The growth cycle occurs in four stages:1. A central leaf is pushed up from the growing
point at the base of the tiller.2. The second leaf collects sunlight and
produces sugars.3. The third leaf then collects sunlight and
produces sugars.4. The oldest (first) leaf will die as the fourth
leaf appears.
Key steps in the growth of rye-grassFirst-leaf stageThe first leaf that grows after grazing uses up the sugars that are stored in the bottom 4 cm of the tiller, not from the plant roots, to initiate its growth. This sugar store is built up again as the plant puts out its second and third leaves. The first leaf is the smallest, the second leaf is larger and the third leaf is the largest.
Roots do not start to grow until at least one leaf has grown because all the plant’s energy is diverted to this first leaf. If cows graze off the pale lime-green first leaf, the plant will be unable to replenish its sugar store, so regrowth slows down. It is critically important not to let cows overgraze on grass that is at the one-leaf stage Second- and third-leaf stageThe plant grows fastest between the emergence of the second and third leaves, when the amount of sunlight captured is maximised. This increases the rate of photosynthesis and therefore the rate of growth.To maximise grass’s sunlight-capturing ability, it is essential to prevent back grazing and grazing of silage aftermaths when the grass plant is at the one-leaf stage.In spring, a new leaf takes between 7 and 10 days to appear, but – depending on temperature – this extends to 30–40 days in winter. This timing is influenced by other factors, such as soil moisture, temperature and, in extreme cases, nutrient supply and poor management. When the third leaf is present, 25–30% more grass is grown than with just two leaves. Grass on the fastest growing paddock on farm will have three leaves. Allow the third leaf to grow before the plant is grazed again. When grazed too frequently, parent tillers are unable to support the development of daughter tillers because insufficient sugar is available and growth rate declines.Nutritional valueGrass that has only the first leaf makes an unbalanced feed because it is high in nitrate and potassium, but low in sugar, calcium and magnesium. Allowing the tiller to grow its second leaf gives it a chance to rebuild its sugar stores, which will increase its rate of growth.Naturally, the grass plant wants to reproduce. As such, it aims to grow reproductive tillers, which put all their energy into producing a seedhead. This is influenced by:
• Day length
• Temperature
• Grass varietyFigure 14. The leaf life cycle of a rye-grass plant
A reproductive tiller becomes fibrous and suppresses the development of new daughter tillers at the bottom.
Postgrazing
Grazingheight
1 2 2 23 34
1 1
1dying
Plan
t res
erve
s le
vel
1stnewleaf
2ndnewleaf
3rdnewleaf
4thnewleaf
Reservesused to producenew leaf
Graze at 2.5–3new leaves whenreserves are restored
Time after grazing
40 Great grazing

This lowers sward palatability and digestibility (D-value) as the stem lengthens the lignin and fibrous content increases. In grazing systems, it is important to prevent this from happening and to keep grass plants in a vegetative cycle so that quality and quantity is maintained throughout the grazing season.Set stocking versus paddock grazingSet stocking allows the grass plant to go through its natural cycle and produce a seedhead. Grazing paddocks in a rotation, however, keeps the grass plant in a vegetative cycle. This is because cows graze the plant when it is growing fastest, with the highest ratio of leaf to stem, before it goes into the reproductive cycle and produces a seedhead.Pros of paddock grazing:
• Highest forage production and use per hectare
• Provides very high-quality feed: 12 MJ/kg DM of ME
• Higher stocking rates can be sustained
• More even manure distribution
• Weeds can be suppressed through grazing
• Reduced need for conserved forage by extending the grazing season
Basic grazing terminology
Average farm cover (AFC)Average farm cover (AFC) is the average amount of grass on the grazing platform on a given day. It is calculated by taking an average of all grass measurements across the grazing area (see page 48 for advice on measuring grass). Across the whole farm, the target AFC is the midpoint between the pre-grazing target and the residual.
The difference between the current AFC and the last AFC recorded shows the balance of supply of grass and herd demand on the grazing platform. If the AFC has increased, then the farm is growing more than the herd is eating, but if AFC has fallen, the herd is eating more than the farm is growing.
Rotation or ‘grazing round’ lengthThis is the time taken, in days, for cows to return to their first paddock after grazing. It is used to understand how fast the herd is currently rotating around the paddocks. Rotation lengths can be estimated or set, depending on grass growth. At peak growth, grass plants will grow one new leaf every 6–7 days. It takes between 18 and 21 days to reach the three-leaf stage; this means that, at peak
growth, your rotation length is likely to be 18 days after grazing or cutting. When new leaves appear at a slower rate – for example, during the autumn – the optimum time between grazings will be longer.
Grass wedgeWhen grass measurements are obtained, a grass wedge can be established. In Figure 15, individual green bars represent each paddock: the highest cover on the left-hand side, down to the lowest on the right. Typically, the width of these bars indicates the size of the paddocks; that is, the thinnest bar is the smallest paddock on the grazing platform and the widest bar is biggest.
ExampleOn a farm with a pre-grazing target of 2,900 kg DM/ha and a residual of 1,500 kg DM/ha, the AFC would be 2,200 kg DM/ha
Examples1. It is the end of March and growth rates
are low at 32 kg DM/ha/day. It will take 44 days from grazing a paddock down to 1,500 kg DM/ha for it to grow enough grass to reach pre-grazing target of 2,900 kg/DM/ha.
• (2,900 – 1,500) / 32 = 44 days
• Grazing platform is 100 ha
• 100 ha / 44 days = 2.3 ha of grazing available in 1 day
2. In May, grass growth rates are increasing to 66 kg DM/ha/day. It will take 21 days from grazing a paddock down to 1,500 kg DM/ha for it to grow enough grass to reach pre-grazing target of 2,900 kg/DM/ha.
• (2,900 – 1,500) / 66 = 21 days
• Grazing platform is 100 ha
• 100 ha / 21 days = 4.8 ha of grazing available in 1 day
If the cows do not return to the paddock to graze for 35 days, there would be a total of five grass leaves: two dying leaves and three growing leaves. This would result in 40% wastage in the paddock compared with grazing at 21 days, as rotation length dictated.
Paddock grows at 66 kg DM/ha to target
2,900 kg DM/ha
Paddock grows at 32 kg DM/ha to target
2,900 kg DM/ha
Herd grazed on 2.3 ha platform for
44 days, then return to paddock
Herd grazed on 54.8 ha platform for 21 days, then return
to paddock
Great grazing 41

A perfect wedge is one in which the green bars representing each paddock all meet the demand line (shown here in blue), but do not cross it (i.e., there are no surpluses) or fall short of it (i.e., there are no deficits).Grass wedges:
• Illustrate the breakdown of the pre-grazing yield distribution on the farm
• Show a profile of the paddocks from highest DM/ha to lowest
• Have a line overlaid onto the graph, which is calculated from the intended herd demand, rotation length and grazing residual
• Enable identification of potential surpluses or shortfalls in forage supply in the near future
Management using a grass wedge is covered in more detail on page 53.
Grass utilisation and profitUtilisation is a measure of the grass that has been eaten or conserved compared with the grass that has been grown. It is a key profit driver in all pasture-based systems; see Figure 16.Good utilisation occurs when fields are grazed at the correct pre-grazing covers, to the target post-grazing residuals, with the correct stocking rate. Within a grazing season, there is a compromise between grass intake (kg DM/cow/day) and grass utilisation (%), but it is key to graze to the target residual, 1,500 kg DM/ha, to ensure sufficient quality for the next grazing round.
Figure 16. The relationship between estimated grass utilised per hectare and net profit per hectareSource: Teagasc, 2009
Figure 15. Example of a grass wedge
Calculating grass12 kg/head/day grass intake = 0.8 = 80% utilisation rate15 kg/head/day allocation
3,000
2,600
2,200
1,800
1,400
1,000
Paddock number23 24 8 5 19 15 26 12 16 2721 22 17 18 20 11 13 10 25 31
Past
ure
cove
r (kg
DM
/ha)
Estimated grass utilisation (kg DM/ha)
4,000
3,500
3,000
2,500
2,000
1,500
1,000
500
02,000 6,000 10,000 14,000
R2=0.44
4,000 8,000 12,000 16,000
Net
pro
fit (£
/ha)
42 Great grazing

Basic grazing managementThe theory of rotational grazing management is based on: 1. Putting cows to graze in an area with the correct
pre-grazing cover at the correct stocking rate.2. Taking off those cows that grazed the area
when the desired post-grazing residual was achieved (preferably between 12 and 24 hours).
3. Repeating steps 1 and 2 throughout the grazing season.
Optimum stocking ratesWithin grazing systems, optimum stocking rate (cows per hectare) balances the competing objectives of adequate grass intake to optimise milk production per cow, while also maximising grass utilisation and milk production per hectare.Increasing stocking rate is related to increases in grazing intensity and grass utilisation, resulting in higher grass growth and improved sward quality. When trying to identify your optimum stocking rate, it is important to consider how much grass you are growing and how much supplement you are planning to feed your herd. If you improve grass production, you can stock the farm at higher rates. However, if cow numbers are increased and shortfalls in grass production are not addressed, you will be more reliant on silage or purchased feeds. Table 16 defines the optimum stocking rate for farms producing different quantities of grass and feeding different levels of supplement.
Table 16. Grazing platform stocking rate (cows/ha)
Grass grown (t DM/ha)
Concentrate (t DM/cow/year) 10 12 14 16
0.00 1.5 2.0 2.3 2.6
0.50 1.8 2.2 2.5 3.0
1.00 2.0 2.4 2.9 3.2
Source: Teagasc
For example, if a farm can grow 10 t DM/ha of grass and the system involves feeding 0.5 t of concentrate per cow, the overall optimum stocking rate for the farm is 1.8 cows/ha. In comparison, a farm capable of growing 16 t DM/ha of grass and feeding 0.5 t concentrate per cow, should achieve a stocking rate of 3 cows/ha.
Increasing stocking rate is only profitable when grass utilisation increases by maximising grazing days per hectare. Consider how much extra grass can be utilised on farm by increasing stocking rate further, because if the amount of grass grown cannot support the increased animal numbers, you will either increase your reliance on purchased feed, or cow performance will decrease.
Comparative stocking rateThe following information has been taken from the Dairy NZ farm factsheet Comparative stocking rate (CSR), performance and operating profit.CSR is a method of assessing the balance between feed demand and supply on farm. It is a much better indicator of the match between feed demand and supply than cows per hectare, because not all cows are the same weight, not all hectares grow the same amount of feed and purchased fee per hectare is not counted using cows per hectare.CSR is defined as the amount of liveweight (lwt) per hectare creating feed demand and the annual feed available to meet that demand (kg lwt/t DM):
Average liveweight (kg/cow) for the herd (including first calvers) is measured or estimated 2 months before calving starts. Total feed is the total amount of feed supplied to the herd over 12 months, including pasture, forage crops and any bought-in supplement. This is best expressed as t DM/ha (Figure 17).
Figure 17. The components of CSR that must be balanced for efficient and economical milk solids production
The optimum CSR for achieving an appropriate combination of milk solids (MS) production per cow is currently between 80 and 90 kg lwt/t DM.Autumn block-calving herds should monitor their grass production from year to year. Lower demand at turnout and drying off during the summer months means it is common for them to be able to carry a stocking rate that is 10% higher than a spring-calving herd. However, make sure you calculate the
CSR = Average lwt (kg/cow) x number of cows/ha total feed (t DM)
For dairy farms, target grass utilisation is at least 80%. For example, if you grow 15 t DM/ha/year, you should be utilising 12.75 t DM/ha/year.
Home-grown feed
Cow liveweight
Imported feedStocking rate kg lwt / t DM/ha offered
Feed supply
Feed demand
Great grazing 43

possibility depending on your own farm system and situation.
Residuals – how hard to graze?Improved pasture quality is a result of hitting good residuals, which you then capture at the following grazing. Target a post-grazing residual of 1,500 kg DM/ha or 4 cm.
It is good to define this target residual so that all team members working with the cows and grass are clear about the aim. This consistency also helps train the cow to accept and graze down to the desired residual.
• Lower residuals will reduce regrowth because of a lack of sugar available in the stubble to generate a new leaf
• Higher residuals contain more stem and will reduce pasture quality at subsequent grazings, increase wastage and reduce grass utilisation
It takes a positive attitude to achieve positive resultsHaving a positive attitude and confidence in your abilities means you know how to manage your thoughts and behaviours to keep them focused on the results you want to deliver.We cannot control everything, but we are always in control of our thoughts. Negative thoughts and worries leave less space in our minds for thinking clearly, making good decisions and solving problems. Replace negative thoughts with thoughts about what you can do and what you can influence, so that you become more productive.When dealing with challenging situations, think about how you will tackle these. Visualise what success looks like and use this to focus your time and effort: do not leave any room in your mind for worry or concerns.Trying new things and making changes on farm can be challenging, so when the going gets tough, stick with it and push through. Successful people know that they do not always get it right and they accept failure as a part of learning.The most important thing is to review every success – and every failure – and learn from them. Share your experiences with others and tell them your story. This will help you to think through what you did well and what you need to do differently next time. It is only when we take the time to look backwards, that we realise how far we have come.
Regrowth
Target pre-grazing cover 2,900 kg DM/ha
Target post-grazing residual
1,500 kg DM/ha
The key to post-grazing residuals is consistency. This way, cows are eating high-quality plant leaf at each grazing.
44 Great grazing

Looking at clumps left behind in the paddock can help to determine whether your grazing pressure and feeding levels are right. The aim is to achieve residuals of 4 cm. Above 5 cm, clumps tend to be smooth and rounded and clumps are little grazed. Below 4 cm, clumps tend to be well grazed, with sharp shoulders on the edges and are not obvious when looking at the paddock.1,300 kg DM/ha or 3 cm − below target and over-grazed
• Very little (or no) leaf remaining in the paddock
• Lots of bare ground visible
• Little herbage remaining around clumps and clumps are not obvious in the paddock
1,500 kg DM/ha or 4 cm − target residual
• Very little leaf remaining between the clumps
• Clumps are small (dinner plate size) with a sharp shape and are distinct across the paddock, making up about 15% of the area
• Tops and sides of the clumps are well eaten into
1,900 kg DM/ha or 6–8 cm − above target
• Areas between the clumps are not grazed well
• Too much good-quality leaf remaining
• Very large, rounded clumps with some clumps completely ungrazed
• Little herbage is removed from around dung pats
• Clumps make up about 30% of the areaSee actions for correcting residuals on page 53.
Dung patchesWhen cows receive a grazed grass-based diet, their dung will be of a liquid consistency that splatters across an area (Figure 18A). Such dung is easier to break down by the next rotation. When grazing cows are buffer fed, their dung becomes thicker and more fibrous (Figure 18B). This takes a lot longer to break down and will often still be evident at the next grazing. This increases the number of rejection sites in paddocks and reduces utilisation. See the section on supplementing on page 57 for more information.
Figure 18. Consistency of cow dung on (A) a grazed-grass diet and (B) a buffer fed diet
A B
Great grazing 45

Infrastructure set-upGood grazing infrastructure:
• Gives more days at grass
• Makes management easier at times of peak grass growth and at the shoulders of the season
• Makes grazing less weather dependent
•
Grazing infrastructure comprises four major components:1. Paddock layouts – covered in this chapter.2. Tracks – please see the AHDB Cow tracks
booklet for further guidance.3. Electric fencing – please see AHDB Electric
fencing for livestock for further guidance.4. Water provision.The Teagasc Dairy farm infrastructure handbook provides excellent detailed guidance on grazing infrastructure.
Each extra day at grass is worth between £1.00 and £2.34 per day through improved cow production and grass utilisation and reduced housing costs.
Sarah and Duncan Howie, Welbatch Farm, ShropshireWe are targeting a herd of 300 autumn calving cows, so, with the end in mind, we divided up our existing fields into smaller paddocks. We calculated that 300 cows requiring 16 kg DM grass per day would need a total of 4,800 kg DM per day. If we anticipate entering covers at 3,000 kg DM/ha and grazing to a residual of 1,500 kg DM/ha, this means we need 3.2 ha for a 24-hour period (4,800 kg DM per day ÷ 1,500 available per hectare). As far as possible, we have fenced everything into 3.2 ha paddocks, which we ideally then split into two for each 12-hour grazing. It doesn’t always work perfectly: we are transitioning from all-year-round calving to an autumn block, we haven’t always got 300 cows grazing, or the cover might be higher or lower than ideal, so paddocks are split into three, or random amounts.Several of our furthest fields, which have been down to maize or wheat, have been put back into grass to bring these into the grazing platform. These fields are quite far for the cows to walk (1.4 km each way to the furthest) and one involves crossing our farm lane, a main road and another side road. As much as possible, we use these for grazing heifers or for cutting silage, but they are available to graze when we dry up in the summer, which has happened for the last 2 years.We have installed a pressurised water system and are working towards having a ring main around the whole platform. The pressurised system has revolutionised the amount of water available to the cows; previously, on a hot day, you would see cows queuing at troughs with water just trickling out.Two years ago, we put in some railway sleeper tracks – and we are putting some more in now. They work brilliantly, allowing us to access paddocks when it is wet. Where we still have dirt tracks, some seem to hold up, but some get very poached and slippery.
46 Great grazing

Paddock layoutsWhat is the correct number and size of paddocks?• Minimise the number of grazing groups so that,
by default, you maximise the number of cows per group. This has the two-fold effect of reducing the number of paddocks needed, while keeping the paddocks as large as possible to make management easier
• Establish the number of cows in the largest grazing group. This will determine the size of paddocks you need on the farm
• Establish the herd’s daily grass demand based on the ideal pre-grazing yield of 2,900 kg DM/ha for the main part of the grazing season
On average, cows will eat 3% of their bodyweight as total DMI, including other forage and feed offered. For example, a 600 kg-cow will eat 18 kg DM. This also depends on milk yield. For more detail on calculating herds’ DMI requirement, see the Know the essentials chapter (page 21).
For all-year-round calving herds, pasture demand will vary throughout the grazing season as cows are dried off or freshly calved cows join the milking group. In this situation, it is helpful to have capacity for some variance in paddock sizes. Planning a grazing platform layoutThe grazing platform is defined as the area of land immediately adjacent to the milking unit, where all paddocks are designated for grazing. Silage-making should only occur on surplus grass in these paddocks.
• Start by obtaining a map of the farm, marked with existing field or paddock boundaries
• Try using online mapping tools, which often have satellite images of the farm. You can also hire professionals from farm planning and mapping services who use GPS technology
• If re-planning your farm layout for the long term, think flexibly and try not to be constrained by current infrastructure
Step 1Draw a farm plan, including the milking parlour, homestead and main buildings, existing access ways (in another colour) and all field boundaries.
Step 2Trace over the original plan to produce a duplicate without any field boundaries.
Step 3Draw new field boundaries and routes on the duplicate plan to improve access.
Example1. 200 cows x 16 kg DM = 3,200 kg DM per
24 hours.2. 2,900 kg DM/ha cover – 1,500 kg DM/ha
target residual = 1,400 kg DM/ha available. 3. 3,200 ÷ 1,400 kg DM/ha = 2.28 ha for 200
cows for 24 hours. Maximum paddock size for 48 hours = 4.56 ha. Minimum paddock size for 12 hours = 1.14 ha.4. Aim for paddock size to be no larger than
would be required for 48 hours of allocation, without options to back fence or enter from different entrances.
1
23
45
67
8910
11
12
21
22
2019
1817
16
1413
15
1
23
456
7
8910
11
15
16
1214
13
1820
19
17
21
22 23
24
28
27 29 3031
3334
3226
25
Great grazing 47

Top tips for designing a paddock layout • Establish multiple entrances (front and back)
for wet weather periods
• Keep paddocks square if possible – long, thin paddocks can cause cows to travel excessively over already grazed ground, reducing regrowth
• Make paddock entrances on dry ground
• Position water troughs at the back of what would be the first 12-hour grazing break to avoid cows traveling unnecessarily for water in subsequent grazings
• Keep machinery off cow tracks
• Put paddock exits in corners, heading towards the milking parlours, to make it easier to get cows out
• Good paddock identification is important, so use numbers, maps and paddock gate numbers to avoid mistakes when several people are working in a team
• Position marker posts showing where to erect break fences to allocate 50% of the paddock
Paddock layoutsTraditional: graze whole field
Erect a temporary electric fence track along headland and allocate grazing, starting in paddock 1, finishing in paddock 4. This minimises traffic on temporary track and prevents back grazing
Divide with temporary track as well as fencing, grazing each allocation for one feed
Measuring grassRegular farm walks are essential for good pasture management. They allow you to measure grass on your whole farm and assess ground conditions and sward quality, giving you the data you need to make correct decisions and, in particular, budget feed (Figure 19). This data provides:
• Current farm growth rates
• Current amount of grass on your farm (AFC)
• Information to build a grass wedge
• Precise information for feed budgets and planning
• Individual paddock growth rates
• Annual farm growth ratesGrass production in organic systemsOrganic systems will have lower growth rates in the spring and autumn; this should be taken into consideration when managing the grass wedge throughout the grazing season. Overall, organic systems will probably produce a lower total yield per hectare than conventional systems (up to 30% lower).On grass-based organic farms, white clover is crucial for production and profitability. The primary benefit of clover is the ability to capture, or ‘fix’, nitrogen from the air and feed it into the soil and surrounding plants. White clover can supply 100–150 kg N/ha/year, which helps drive output on organic systems. For anyone considering organic farming, a grasp of the role and establishment of white clover is essential. For more information please see Establishing and growing clover for Better Returns, available at ahdb.org.ukGoing from good to excellent – the importance of measuringMeasuring grass should tie in with how fast it is growing and how fast you need to make grazing decisions.
A good time to carry out your first farm walk of the year is at the beginning of February, when you can assess wet ground conditions and note down which paddocks are wetter or drier. Measuring soil temperature also indicates when grass may start to grow.If you have a spring-calving herd, the month of February will be busy with calving, but aim to get out and measure grass growth between 5 and 10 March, then again within 7–10 days.
As a rule of thumb, you should measure grass every time it has grown 350–500 kg DM. This often means you end up measuring 35–40 times a year.
Graze 4
Graze 3
Graze 2
Graze 1
Temporary fenced track
48 Great grazing

0
10
20
30
40
50
60
70
80
90
100G
rass
gro
wth
rate
(kg
DM/h
a)
Mar Apr May Jun Jul Aug Sep Oct Nov
2017 2018 2019
Figure 19. Seasonal grass growth rate from Forage for Knowledge contributors
At this point, it is a valuable exercise to take grass growth measurements to build a grass budget and prepare your spring rotation planner. Continue your weekly grass measurements from this point onwards, until grass growth takes off. Then, more regular measurements are suggested to help you manage your grassland (Table 17).
Table 17. Recommended number of days between measurements based on grass growth
Growth rate (kg DM/ha/day)
Suggested days between measurement
25 10
50 7
75 5
100+ 4
The rising plate meterThe rising plate meter is the most common measuring device used to measure grass swards. Benefits of the rising plate meter are that it:
• Is easy to input data into online spreadsheet packages; this helps with budgeting, calculating wedges and alerts to looming deficits
• Calculates density and height, whereas alternative methods, including sward sticks, beer cans and a visual assessment of the three-leaf stage measure just height
• Gives you a good opportunity to assess pastures and grazing infrastructure, by taking the time to conduct the farm walk yourself
It is important that the data recorded can be associated with what you have seen on the walk to obtain a full judgement of paddock condition.To obtain the full picture, the person who is responsible for feed budgeting and making grazing decisions should be the one to do the farm walk and measuring.If, for any reason, someone else in the team takes the measurements, ensure that person is fully trained (see page 67 on people management and grassland) and that they can add notes to the figures taken to provide detail for the next rotation plan.Key points to consider when using a plate meter:
• It measures height then converts it into kilograms of dry matter (kg DM)
• The equation that converts height to kg DM should be seen as a guide
• Maintain and calibrate the plate meter to ensure accuracy and reliable readings
• Operator technique must be consistent
• Bad weather, poached soils and other poor environmental conditions affect accuracy
See our video, How to use a plate meter, on the AHDB Dairy YouTube channel for further support on how to use a plate meter.
Great grazing 49

Background calculations for a plate meter equation are: Average Grass at compressed x Season + bottom of = kg DM/ha pasture average sward not height measured
Readings from the x The + The = kg DM/ha meter multiplier adder
Example 15 cm x 140 + 500 = 2,600 kg DM/ha
Ben WalkerBen milks a 160-cow Holstein-Friesian and Kiwi-cross autumn-calving herd on 82 ha of grassland in a family partnership in Norfolk. The herd is calved in a 12-week block from 1 September, averaging 8,300 litres sold per cow, from 2,020 kg concentrates per cow, with milk from forage at 41%. The herd is rotationally paddock-grazed from mid-February. The target is to maximise milk from forage – especially from grazed grass.Breeding wise, the herd is moving to Kiwi-cross, with the aim of further extending the grazing season and maximising profit from the dairy unit. The herd is all loose-housed throughout the winter and fed on TMR, with around 30 ha of maize grown each year. Wheat grown by the arable unit is caustic-treated and fed along with other bought-in concentrates.“I have been routinely measuring grass with a plate meter every week for 6 years. The combination of regularly measuring growth and quality through Forage for Knowledge has given me enormous confidence in what we can achieve
from grazed grass. Knowing exactly what we are dealing with in each paddock on a weekly basis allows me to manage cows accordingly.The variable weather over the last few years makes it hard to quantify the effect on yield grown, but our best paddocks hit 17 t DM/ha in 2017 compared with 12 t DM/ha back in 2014. Confidence in the system has resulted in an increase in milk from forage from 414 litres/cow to 3,786 litres/cow!”
What does the plate meter measure?Each of the clicks made by the plate meter represents 0.5 cm of compressed height; i.e., a reading of seven clicks is a compressed pasture height of 3.5 cm. However, remember that the plate meter is a management tool used for approximating pasture mass. It should not be used as the only method to allocate grass to cows. You should also:
• Observe that the stock are grazing for sufficient time and are fully fed
• Check that post-grazing residuals are hitting the 1,500 kg DM/ha desired targets
The plate meter equationThe plate meter uses a formula to convert the compressed height (number of clicks per 0.5 cm of grass height) to kilograms of dry matter per hectare (kg DM/ha). This formula is a guide and does not give an absolute measure of quantity, because the DM composition has seasonal variations.For simplicity and convenience, a default calibration equation is usually used in GB. This is the best fit for most situations throughout the grazing season. It makes the data easier to understand and allows consistent comparisons to be made (see example on the right).
In the equation:
• The ‘multiplier’ of 140 reflects the DM per centimetre of the compressed sward height
• The ‘adder’ of 500 compensates for the amount of grass at the bottom of the sward not measured by the plate meter
Range of the multiplier:
• 115 – when grass is growing fastest (low DM)
• 140 – this is about the average (best fit for the whole season)
• 185 – used in very dry conditions or during slow growth, e.g. drought (higher DM)
50 Great grazing

Plate meter maintenance To ensure consistent readings, carry out routine maintenance and refer to the manufacturer’s guidelines. Common problems usually include:
• Flat batteries (for electronic meters)
• Grass and mud build-up on the plate and shaft
• Corrosion on the shaft
• Poor wheel alignment in the shaft’s grooves
• A bent shaft
• Grass sugars making the shaft stickyBefore every grass walk, check your plate meter for a:
• Charged battery (if using an electronic meter)
• Freely moving shaft and correctly aligned cog
• Clean plate that is free of grass and mud When the farm walk has been completed, clean and dry the plate meter and store it correctly until needed for the next measurement.Plate metering technique Incorrect operator technique gives inaccurate readings. The most common operator problem is applying too much pressure to the plate meter when taking a measurement (by pushing the plate down, or using it like a walking stick). Plate meters are calibrated with the plate falling under its own weight, so by creating extra force the plate falls faster and the shaft can be pushed below the soil surface. Correct technique is to place the plate on the top of the sward with no downward force and then push the shaft to the ground, making sure the shaft remains vertical at all times. If you rock it as you would a walking stick, the measurement will be exaggerated. Measurements are taken when the plate moves up and down the central shaft.When the correct technique is used, there should be no difference between readings taken using electronic or mechanical plate meters.
To ensure that consistent measurements are taken during the farm walk:
• Take a minimum of 30 readings as you walk across a representative part of the paddock
• Avoid gateways, troughs and fence lines
• Ensure the walk gives a fair representation of the paddock. To do this walk a ‘W’ within the paddock
• Take the same route across the paddock week after week so that you have comparable data
Do not choose where to measure: it must be random so that you get the best and worst measurements that are representative of the field. A guide is to take a reading every 2–3 steps.Weather conditions can also affect accuracy, so postpone the walk in extreme conditions and remember:
• If the soil is frosted, apply pressure to the shaft to break the standing ice crystals so that the bottom of the shaft reaches the soil surface
• Strong wind compresses long pasture, resulting in lower readings
• In wet conditions, water can accumulate on the plate meter. This increases the weight of the plate meter and causes lower readings. Regularly shake the plate to remove any surface water
• After heavy rain, pasture can be flattened, resulting in a lower height reading
• Snow compresses pasture, resulting in lower height readings
• If paddocks have been topped in previous rounds, beware of topped areas that contain weed stems. Often the weed stems are very hard and woody and create an artificial residual
• Previously mown paddocks can also contain dead stubble grass, which can add to the residual (this can add 200–300 kg DM to the reading). It often takes one grazing round for these to decompose before you get a true reading
• Poached paddocks do not give an accurate assessment of pasture cover. Visual assessment should be used after calibrating the eye using the plate meter on paddocks that have not been damaged
Accurate technique is very important. Inaccuracy can lead to estimates of pasture cover varying by up to 600 kg DM/ha and this, in turn, can lead you to believe you have adequate covers, or surplus when you may not.
Great grazing 51

Other methods of grass measurementCut and weighThis is a good technique to ‘get your eye in’. The technique is as follows.
• A 0.5 x 0.5 m quadrat is placed in an area that is representative of the amount of grass in the paddock
• If wet, knock water off the grass before cutting
• Cut the grass at 4 cm and weigh, then use the following equation:
• Estimate DM by sending for laboratory analysis, or a simple on-farm DM test (Table 18)
Table 18. Dry matter percentage ranges for fresh grass based on weather conditions
Weather DM %
Continuous rain 10–12
Mixed sunshine and rain (small amount of surface moisture) 13–16
Mainly dry (no surface water) 17–19
More than five dry days and high temperatures 20–22
Drought 23–24
Trailed pasture meters and satellitesOther pasture measuring devices can be used, which are either trailed, or sonar-based. These are designed for measuring many large paddocks. It is always recommended to understand the principles and follow manufacturer’s instructions.The increasing use of satellite information means that it is now possible to monitor and manage agricultural systems remotely by measuring grass from space. They are combining growth predictions with satellite data to provide weekly grass growth figures.
Managing and allocating grass
Using grass measurement dataOnce the pasture walk is complete and grass measurements for a grazing area have been collected, there are several things that can be done to aid grassland management decisions.Several online and computerised grass management programs are available, which make the following calculations and data processing steps very quick and easy. However, to avoid making mistakes, you should first have a good, basic understanding of the calculations and processes.
Grass growth ratesGrowth rates can be calculated by measuring the change in grass levels in individual paddocks over a period of time. This is expressed in kilograms of dry matter grown per hectare per day (kg DM/ha/day).
When this has been done for every paddock on the grazing platform over the same period, an average growth rate can then be calculated across the grazing platform.This data can be used in several ways: the main use will be explained in the following sections of this resource, but other uses include:
• Obtaining a total paddock growth rate over the whole season to give a yield in tonnes of DM grown in each paddock. This can be used to identify the paddocks that need attention to increase overall DM growth
• Obtaining total growth rates and seasonal growth rates to provide accurate information about the farm’s ability to grow grass. This helps farm budgeting and achieving optimum stocking rate
• Linking with online grass software packages to allow grazing managers to share data and compare grass growth between different farms, as well as seeing what decisions other managers are taking
If you have other species of grass that are more prominent in your ley, you will need to adjust the equation to obtain a more accurate reading – different grass types have different plant structures.
Weight of grass (kg) x grass DM% x 40,000 = kg DM/ha available in the paddock, then add the residual to give total DM in the paddock Remember to subtract the weight of the empty bag
ExampleIf the paddock was 2,300 kg DM/ha, is now 2,450 kg DM/ha and there were 10 days between measurements: 2,450 kg DM – 2,300 kg DM = 150 kg DM/ha150 kg DM/ha ÷ 10 days = 15 kg DM/ha/day growth
52 Great grazing

Basic grass wedge managementTo start simply, you are managing grass on a farm in one of the following three scenarios.
Scenario 1. The ideal situation is where supply equals demand
Scenario 2. A surplus is developing where supply is greater than demand
Scenario 3. A deficit is developing where demand is greater than supply
• Growth rates = herd demand
• AFC is stable
• Maintain round length
• Growth rates are greater than herd demand
• AFC is rising
• Increase demand
• Reduce other feeds to increase grazed grass intake per cow
• Take out paddocks for silage
• Shorten rotation length
• Increase stocking rate (e.g. youngstock, dry cows)
• Cows are eating grass faster than it is growing
• AFC is falling
• Bring more grazing area into the rotation to meet cows’ demand (bring silage fields onto the grazing platform)
• Reduce demand by buffer feeding silage and/or concentrates
• Increase rotation length
• Reduce demand by culling or drying off unproductive cows
3,800
3,400
3,000
2,600
2,200
1,800
1,400
1,000Paddocks
Past
ure
cove
r (kg
DM
/ha)
3,800
3,400
3,000
2,600
2,200
1,800
1,400
1,000Paddocks
Past
ure
cove
r (kg
DM
/ha)
3,400
3,000
2,600
2,200
1,800
1,400
1,000Paddocks
Past
ure
cove
r (kg
DM
/ha)
Great grazing 53

Managing a deficit Several deficit scenarios can occur when managing grass. It is important to recognise a deficit early and to implement strategies to protect future grass supplies. Some of the information below has been adapted from the Teagasc publication, Managing your grass.
The next three graphs show examples of farms with deficits. Serious deficit
It is clear that there is a serious deficit of grass on the farm because all of the bars representing paddock covers fall below the demand (blue) line. Action must be taken to address this problem. A prescribed long rotation and including buffer silage or parlour concentrates in the diet will help reduce the shortfall. A false surplus
Here, the first two paddocks are above pre-grazing cover targets. However, in one or two weeks’ time, there may be a deficit if growth rate remains low. Therefore, it is better to be cautious and not remove the surplus out of the rotation as silage fields, but skip over them into paddocks at target pre-grazing covers. If growth continues to be low, you can go back to these skipped-over paddocks and graze them to fill any small deficit.
Looming deficit
It can be difficult to make decisions when faced with a looming deficit. In this situation, the next three paddocks to be grazed have a pre-grazing yield that is higher than the target post-grazing covers (i.e. there is surplus grass).However, a deficit is on the way: dry weather conditions means that grass growth in paddocks that have been grazed more recently have not recovered as quickly as would be expected. Again, do not make quick decisions to remove surpluses; instead these should be kept as a ‘plan B’ if grass growth continues to fall.
Top tips for managing a deficit• Lower your demand by adding another feed
source (forage, moist feeds, concentrates)
• Lower your demand by removing grazing animals (culling early, removing youngstock from the grazing platform, drying off earlier if autumn block calving)
• For grazing paddocks that may have been shut up for silage, use pre-mowing and temporary fences to increase utilisation and reduce wastage
• Continue to monitor AFC and supply and demand to allow forward planning for a greater deficit
• Use historical or comparison data for your local area (e.g. available via AHDB Forage for Knowledge) to know the usual grass growth on your farm for that time period
• Use other indicators (soil temperature, soil moisture deficit) to determine whether or not growth is to be expected
Ultimately, to make sure you maintain grass on the platform, it is important to let the grass grow and not to graze it too early.
Golden rule: silage is made from an excess of grass grown – all land that can be grazed should be done so first and only cut for silage when a genuine surplus has occurred.
54 Great grazing

Managing a surplus The next three graphs show examples of farms with surpluses.
From the wedge above, it is evident that this farmer has lost total control of the grass on the farm. Pre-grazing yields are too high and are well above target – as are residuals. Decisions must be made to rectify the problem.
In the wedge above, although the paddocks with the highest covers are on target, the rest are all above target. It is clear that in 1 weeks’ time there will be a large surplus on the farm and action must be taken to ensure target pre-grazing yield is not exceeded. In addition, the target residual is not being achieved; this must be addressed, or there will be sward quality issues in subsequent rotations.
It is clear from the above wedge that the farm has a grass surplus and this must be addressed. When taking action, the farmer should be mindful that some paddocks are below target; therefore, not all paddocks with surplus should be removed.
Top tips for managing a surplus • Remove surplus paddocks as silage – this should
be completed as soon as possible so that the paddocks can be put back in the grazing rotation as quickly as possible
• Do not delay the reaction to high grass growth• Do not increase stocking rate on the grazing area
by closing too many paddocks for long-term silage• Caution should be exercised so that excessive
grass is not removed, which would result in a deficit• If surplus grass is removed as soon as it is
identified, this will result in the area being included in the grazing round, thereby making it available to cope with a slowing of pasture growth
Getting the buy-in to changeWhen you are keen to introduce changes that you believe will be beneficial to the farm, it is important to use a ‘pull’ rather than a ‘push’ style of communicating with your team.When a push style is used, people can feel as though they being are told what to do and the benefits this will bring are being forced upon them. This often occurs when a manager has invested heavily in planning the change before involving the team. It is easy to forget that team members are not in that same place. Attempts to convince them that the change will be good for them can lead to resistance, lack of understanding and fear.People embrace change when they feel as though they have been a part of that change; consulted, listened to and involved. In this ‘pull’ style of communication, people are engaged and start to understand the benefits and what is in it for them.This involvement allows you to check understanding and prevent confusion. By listening to people and engaging them in change, you also learn about the training or support they will need to build their confidence and create an environment in which you all learn from mistakes and share successes.Remember to build a common understanding with your team members about what ‘good’ looks like, by working together, carrying out visual assessments and sharing knowledge.
Great grazing 55

Preparing and managing a grazing planAfter walking and measuring grass, a grazing plan is prepared that allocates grass to the herd until the next planned pasture walk, e.g. in 1 week's time. Ultimately, grass growth cannot be controlled, so this allows you to plan ahead for a short amount of time. Taking into account your current supply of grass, average amount of grass on your farm (AFC) and expected weather and ground conditions, your options to manage pasture are as follows.
• Change the demand (number of cows, or amount of grass fed per cow)
• Change the area of grazing land (add land, or take paddocks out for silage)
Step 1: Calculate the grazing demand
Growth rates are historic, dating from the last measurement, so it is important to also assess growth indicators such as soil temperature, changing day length and soil moisture. Other information, such as last year’s growth rates or what is happening on farms in your area can also help you to assess what the expected growth rate will be and plan the right strategy for the next grazing period.
Step 2: Set the grazing plan until the next planned measurementDo this by calculating how much grass is available in the paddock: Pre-grazing cover - residual = grass available
Multiply by area of paddock (grass available per hectare x hectares in paddock = grass available in paddock).
Divide by herds’ 24-hour demand (available in paddock ÷ herd demand)
This gives the number of days needed in a paddock to achieve target residual.
Do this for the whole grazing platform to work out the grazing plan for the following week.To begin with, calculate your grazing requirements in days to keep things simple. If you choose to use 12-hour breaks for your grass allocation, use a temporary fence in the paddock to allocate your feeds following the morning and afternoon/ evening milking.
How to be flexibleWhen allocating paddocks, always check that the cows are fully fed and hitting target residuals after each grazing. Rounding up or down is expected, but if you are far from meeting your targets for a 12-hour grazing plan, your options are to:
• Move the whole herd to a new paddock partway through a 12-hour grazing if you are short of grass in the current paddock
• Split the herd when exiting the parlour and, for example, send one-third of the cows to tidy up a paddock and the other two-thirds to the next full paddock. Put them back together at the next milking
Being part of a good grazing discussion group is an excellent way to hear how others manage challenging situations and to learn from their experiences.
Total number of demand per demand = grazing animals x head (kg DM)
This can then be divided by the area of grass on the farm to give demand per hectare Total land area demand per demand ÷ (ha) = hectare
Example200 cows x 16 kg DM/head = 3,200 kg DM/dayOn 100 ha of land area3,200 kg DM/day ÷ 100 ha = 32 kg DM/ha
3,190 kg DM ÷ 3,200 kg DM = 1 day - assume 2 x 12-hour feeds
200 cows requiring 16 kg DM = 3,200 kg DM
2.2 ha x 1,450 kg DM/ha = 3,190 kg DM/ha
2,950 kg DM/ha - 1,500 kg DM/ha = 1,450 kg DM/ha
It is important to remember that grass measurements represent feed available on that day. In 5 days’ time, grass covers will be higher, so adjustments must be continually made.
Grazing is always trial and error, but the more you do, the more experienced you will become. This will help you to be flexible, able to adapt and make management decisions to keep things on track.
56 Great grazing

12-hour, 24-hour or 36-hour breaks?The number of times in a day that fresh pasture is offered is called a ‘break’. The primary aim should be to provide access to new grazing for each feed, with cows spending a maximum of 1 day on the same pasture. Decisions about grazing frequency are often down to farmer preference and are influenced by specific farm characteristics; for example, even or uneven paddock sizes, farm shape, soil types and labour availability.If you are planning your first season of rotational grazing, longer allocation times can give more flexibility and room for trial and error. Lessons learned throughout the grazing season can help you gain confidence and experience to allocations to herd demand. In wet weather, 12-hour grazing breaks help limit damage and pasture wastage by moving cows on and off areas. After each break, it is important to assess cows and residuals and review the second allocation, if necessary. For example, if cows are not hitting target residuals and are leaving too much behind, learn from this and reduce the next fresh break. Some farmers use 12-hour breaks until the end of the first rotation, restricting cows from going back onto recently grazed ground, then moving them to 24- or 36-hour breaks at the beginning of the second rotation.
Supplementing versus substituting In a pasture system, supplementary feeding at grass is recognised as a mechanism to help fill pasture deficit. It is most often used during the shoulders of the grazing season, or when grass growth is below herd demand. See Figure 20. When high-quality grass is readily available, research has shown that supplementary, or buffer feeding, will always substitute for grazing, reducing grass intakes and utilisation.The extent of this substitution depends on the type of supplement (Table 19).
Table 19. Substitution from supplementary feeding with a plentiful grazing supply
Type of grazing Substitution rate (kg grass DM replaced per kg supplement DM)
Grass silage 0.89
Hay 0.77
18% protein cake 0.50–0.69
Source: Mayne and Leaver, 1997
The reduction in intake from supplementary forages results from less time spent grazing. Generally, forage supplements offered in spring have little or no effect on cow performance and are consumed at very modest levels.
Figure 20. The role of supplementation to optimise grazing management
Grass growth can be BELOW HERD
DEMAND at the shoulders of the grazing season
Grass growth slows and falls BELOW HERD
DEMAND at the end of the grazing season
Supplement feeding with SURPLUS
SILAGE
For this, you can supplement feeding with
SURPLUS SILAGE
This is taken when grass supply is
ABOVE HERD DEMAND in mid-season
Concentrates should only be used to help fill the pasture deficit at the shoulders of the grazing season
HERD DEMAND
Great grazing 57

Although concentrates also displace pasture, they do so to a much lesser extent, enabling daily DMIs to be increased by around 30–50%. Early lactation cows are the most responsive to concentrate supplementation because of their higher yield levels.When supplementing, you should use concentrate feed strategically:
• To fill gaps in grass supply, particularly during spring and autumn
• During the breeding season when grazing conditions are poor or grass supply is limited. Be prepared to remove the supplement when grass supply and intake are adequate
For more information on options for concentrates, see Know the essentials chapter (page 22).
Grazing high yielders – what is possible?Grazing high yielders and topping up requirements with concentrates in parlour presents an opportunity for relatively low cost of milk production for a proportion of a high-yielding herd. High-yielding cows need leafy swards with an AFC of at least 3,000 kg DM/ha. The sward should be upright, dense and palatable to provide easily grazed grass. This ensures that high yielders do not have to work too hard to achieve target grazed grass intakes. The residual will be 6–8 cm – higher than the target residual of 4 cm, or 1,500 kg DM/ha. A higher yielding cow may limit her total DMI if forced to graze down, which would reduce yield and body condition, so it is a compromise. In these circumstances, corrective sward management may be needed to regain good residuals by operating a follower group system with low yielders, dry cows or youngstock.A word of caution about the leader–follower system: generally, the leader (high-yielding cow) will consume less grass and require more concentrate to sustain her yield than the follower (lower yielding cow), who will support her production from mainly grazed grass. When using this management tool, make sure the followers do not end up short of grass.The balance between grazing pressure and sward growth must be carefully planned and flexibly managed throughout the season, in just the same way as with lower-yielding cows, but with more emphasis on cow management.
There are more options for grouping cows in large herds, allowing earlier spring turnout of moderate yielding in-calf cows, with higher yielders put to grass later in the grazing season. It also enables pasture supply to be tailored to cows’ changing nutrient requirements as they progress through lactation.
Autumn closing*
Autumn plan to housing (August to December)The next grazing season starts now. Autumn grassland management determines the supply of grass available for grazing in the following spring.
Use of segregation gates can allow low yielders to be split from a group so they can graze, while high yielders remain on full TMR.
Continuous improvementGrazing can be a trial and error process, which is a fundamental part of problem solving. Using information to establish your current position allows you to plan, do, then monitor and review. That way, when things do not go to plan, you will know why and how to move forward.Using the ‘plan, do, monitor, review’ model makes you better able to deal with change and make necessary adjustments to the cows, or the pasture, more quickly.Monitoring and reviewing your plan encourages you to learn from experiences – both good and bad. When you focus only on ‘plan’ and ‘do’ but miss out ‘monitor’ and ‘review’, you tend to repeat the same mistakes and make reactive decisions. The result is you often waste time and money.
Finish well, start well. The grazing season begins when you close your paddocks in the autumn and – if done right – can set you up for the next year.
* Information taken from Andre Van Barneveld, Graise Consultancy
58 Great grazing

The main objectives of autumn grazing management are to:
• Maximise the proportion of grazed grass in the diet
• Increase the number of days at grass before housing
• Finish the grazing season with the desired AFC to carry throughout the winter and ensure sufficient grass for early turnout the following spring
Grassland budgeting is essential to achieve these objectives. Only allow AFC to lift if you are certain that the herd’s pasture demand will be above grass growth rates in October, to graze back down to target residuals (1,500 kg DM/ha) by November.
How to manage autumn pasturesTo ensure that adequate quantities of grass are available at the start of calving on highly stocked spring-calving systems should aim for an AFC between 2,150–2,230 kg DM/ha at closing. Building higher pasture covers would lead to grazing higher covers with freshly calved animals, which will make it harder for them to hit target residuals and achieve optimal DMI.Autumn-calving farms should avoid building higher pasture covers during the autumn because, depending on calving date, herd demand can be low. For autumn block systems, follow the same principles as an autumn rotation planner, but be prepared to close 15–20 days earlier because the demand to utilise autumn grass will be lower than that of a spring-calving system.If grass growth rates continue to be high, be prepared to take more of the surplus out as silage when herd demand falls in August. The same targets for autumn grazing apply to AYR systems.
August is ‘clean-out’ month; the time to ensure that pastures are grazed down to 1,500 kg DM/ha. Adjust rotation length and aim for a length of around 25 days by the end of August. If pasture growth exceeds the herd’s pasture demand, allow covers to build slightly to lift AFC up to 2,400–2,600 kg DM/ha. This means that pre-grazing covers will be higher (3,400–3,600 kg DM/ha). However, this is not recommended if you are on a wet farm because it carries the risk of lower utilisation and soil damage during wet conditions. Highest AFC should be achieved in mid to late September. Aim for the rotation length to be more than 35 days from mid-September.Tailor your autumn rotation plan for your own farm’s climate and soil type. Some spring-calving herds can successfully graze higher covers in the autumn to help them achieve needed grass supply to extend their grazing days in the autumn. To achieve target closing covers, the last rotation round should start around 5–10 October and finish 15–20 November. Every paddock grazed in the last rotation should be closed; that is, not grazed again until spring. Ensure that all covers with greater than 3,000 kg DM/ha are grazed in October – especially if wet soils are a risk.High covers take more time to recover from grazing: if left very late, they go into the winter, with decomposing clumps and are at risk of coming into the spring with nil available cover. Lower covers recover quicker after grazing and carry throughout the winter better.The 60:40 rule is a good rule of thumb: aim to graze 60% of the platform in your last rounds during October and the remaining 40% in November (Figure 21).
Am I supposed to be redrawing
this?
Figure 21. The proportion of the grazing platform that should be grazed during October (60%) and November (40%) to achieve good opening covers in early spring
October–November
• Last round
• 60:40
Great grazing 59

How to manage autumn closingEach day delayed after 15 October reduces spring grass supply by 15 kg DM/ha (Teagasc).
• Target post-grazing residuals of 1,500 kg DM/ha (4 cm) during the last rotation to encourage winter tillering
• Do not regraze paddocks unless the farm is well above the closing cover target
• Be flexible – graze the lower grass covers in wet weather (see the section on Wet weather management on page 63)
• Close drier paddocks earlier in the autumn to allow earlier spring turnouts
• Close at least 60% of the farm by the end of the first week of November
• The target closing AFC should be around 2,150–2,230 kg DM/ha) on 20 November
• For farms with heavy soils or slow spring grass growth, it is wise to start the last rotation by 1 October and close in mid-November
Outwintering sheep is not economically viable for a dairy farm targeting an early spring turnout because they reduce the amount of grass available in early spring. On some farms, where bad weather has caused closing targets to be missed, sheep could be used, but they must be removed before 1 January.
Spring turnoutTurnout to magic day (February to April)Early spring grass is very digestible and high in crude protein (CP) and metabolisable energy (ME) (see Figure 22). Spring grazing is established by planning during the previous autumn.To capitalise on the benefits of grazed grass, dairy cows should be turned out to pasture as soon as possible, when covers are around 2,400–2,600 kg DM/ha (AFC = 2,500 kg DM/ha).
In GB, February and March turnouts are possible – ground conditions permitting. The main objectives of spring grazing management are to:
• Increase the proportion of grazed grass in the diet (thus saving money on feed and housing costs)
• Condition swards for subsequent grazing rotations and establish target residuals for the season
• Promote regrowth ready for the second round of grazing of high-quality grass
What is ‘magic’, or balance, day? This is the day that grass supply matches grass demand. It means you shift from managing a deficit, to dealing with a surplus. Normally, in GB, magic day is around 4–20 April, depending on growth rates and farm stocking rates.
Figure 22. Crude protein (CP) and metabolisable energy (ME) content throughout the grazing season on Forage for Knowledge (FFK) contributor farms
10.5 0
5
10
20
15
25
30
11.0
11.5
12.0
12.5
13.0
13.5
8 Mar 8 May 8 Jun 8 Aug8 Apr 8 Jul 8 Sep 8 Oct 1 Nov
ME
(MJ/
kg D
M)
CP
(%)
ME 2019 CP 2019
60 Great grazing

Top tips for maximising spring grass intakes• AFC target at turnout should be 2,000–2,500 kg
DM/ha, although this will depend on your ability to grow and store grass over winter, ready for the planned turnout date and spring demand
• Have a planned reduction in AFC – this can be controlled with a spring rotation planner (SRP) and a spring grass budget. Therefore, grass that would have been a surplus in late April is, instead, eaten in late March, thus negating the need for silage and increasing the number of days at grass in the year
• Do not drop AFC below 1,900 kg DM/ha. At this point, grass growth is restricted by taking too much grass out of the quick-growth zone, therefore total feed grown is reduced
• When first turning out, lower covers (under 2,400 kg DM/ha) are desirable because they are easier to graze down, early residuals can be met and cows can be trained to graze effectively again
• In spring, paddocks do not have to be grazed in order of highest to lowest cover. When grass growth is slower, you can pick and choose depending on weather and ground conditions. The important thing is to remove cover and clear the set area in the SRP
• Do not graze all of your dry fields at once. When there are 3–4 consecutive dry weather days, try to clear the challenging wetter paddocks on the farm
• Aim to offer 800–1,000 kg DM/cow of grass from turnout until the end of the first rotation; for example, 14 kg DM/cow for 64 days. This is achievable on farms where animals are turned out early
• Available grass supply should be budgeted so that the first grazing rotation finishes on, or 7 days before, magic day. This will ensure a consistent supply of grass in the diet
• Post-grazing height should be maintained at 4 cm (1,500 kg DM/ha) during the first rotation to ensure high pasture quality during subsequent rotations
• Early grazed swards (February–March) have similar grass growth potential to later grazed swards (April), but higher sward quality means they are capable of sustaining higher milk yields and grass intakes in subsequent grazing rotations
• Excessive pasture damage should be avoided (see Wet weather management on page 63).
If spring turnout is left until April, this will mean that by the time the cows have tried to clear away older growth and set the residual, grass growth has overtaken them. This wastes excess grass because cows struggle to graze it or to achieve residuals.
Turnout does not have to be a one-off event in spring. Getting out early in February, removing some pasture and starting the spring rotation planner means the herd can be rehoused during short periods of wet weather in March or April.
Great grazing 61

Spring rotation planner and feed budgetsThe SRP is used to divide the farm up into weekly portions and can help take the guesswork out of planning the first grazing rotation. Below are examples from software programmes (Figures 23 and 24).Information required:
• Date you want to turn out the cows
• Predicted magic day
The planner is a simple tool and, if used properly, it:
• Ensures that sufficient grass is grazed early enough to allow time for regrowth for the second rotation
• Creates a wedge-shaped grass supply to give a continuous grass supply during the second rotation
• Can be used alongside a grass budget, which looks at forward expected growth rates and predicted AFC
Average farms in GB aim to have 30% grazed by the end of February, 60% by 20 March and 100% grazed 7 days before magic day (early- to mid-April). For wetter or slower growing farms, these dates may be pushed back by 7–14 days, but they often catch up and still hit magic day by the end of April.
Turnout for spring calving systemA key point for GB spring-calving systems is to have a rising demand for grass as cows calve in. A farm’s strategy should be to match the calving pattern to the grass growth. The mean calving date should be 42 days before magic day. It is desirable to begin calving and grazing at the same time, so that grass can form part of the diet from the start. Freshly calved cows should be out grazing as soon as possible after calving, with their feed allowance of grazed grass increasing steadily until the breeding season. Make sure that grazed grass is not being substituted with a high volume of forage or concentrates in the diet. Various grazing software programs can help you decide when to pull forage out of the diet without running into a deficit.
Figure 23. Rotation chart example from AgriNet
Figure 24. Grazing targets example from AgriNet
The SRP will not tell you whether or not you are feeding cows enough grass. You must decide this by walking your paddocks to assess the grass supply and residuals and by observing whether or not your cows are underfed.
62 Great grazing

Turnout for autumn calving and AYR systemsFor autumn-calving herds and AYR herds, the main difference in early spring is a high feed demand from the outset. Despite this, grazing percentage targets do not change and at least one-third of the area should be grazed by 1 March. This early grazing by in-calf and late lactation cows sets up grass quality and residual for the season ahead. Plan to balance the demand by feeding high-quality silage at night. This is rationed out daily to ensure cows have an appetite to achieve these targets when going to grass after morning milking. It also helps to ensure that grazed grass is not substituted for silage. See page 57 for more details on supplementing versus substitution.
Hypomagnesaemia (grass staggers)Throughout the grazing season, livestock magnesium (Mg) requirements must be met to prevent ‘grass staggers’ (Mg deficiency). This occurs when the output of Mg is greater than the input. In spring, high dietary intakes of potassium (K) and rumen degradable protein from rapidly growing spring grass combine to pose a considerable threat of Mg deficiency.Although it increases as the year progresses, Mg uptake by grass is typically low in spring (Figure 25). At the same time, grass K levels are high: sometimes this causes reduced Mg uptake by grass, but it also supplies a high level of K to the diet, which affects Mg absorption.
Figure 25. Seasonal uptake of macronutrients in grass swardsSource: Potash Development Association
The recommended daily amount of Mg for a lactating cow ranges between 0.2 and 0.3% of the diet DM, with higher levels required for cows grazing pasture. For example, a cow consuming 17 kg DM/day equates to a minimum daily requirement of 34 g of Mg. Mg can be supplemented via compound feeds, mineral supplements, Mg bullets, pasture dressing, Mg in water, licks and boluses.
Affected animals can often be hyper-excitable and have an over-reaction to being touched. Animals showing these signs need immediate treatment to prevent further deterioration. Discuss appropriate treatments with your vet.
Magnesium Network (MAG-NET)Integrating Soil-Crop-Animal Pathways to Improve Ruminant Health is a 4-year (2016–2020) project that aims to improve our understanding of Mg nutrition in UK dairy, beef and sheep farming systems. The project seeks to deliver new decision-making support tools based on mapping and modelling the movements of Mg and other cations in animals, forages and soils. It explores the use of Mg by farmers and is testing the potential to improve forage nutrient management through crop improvement and fertiliser use. Visit MAG-NET's website for further information.
Wet weather management planThe main impact of wet periods is poaching. During wet periods, damage to soil can reduce pasture yield by 20–80% for 4–8 months after the event (depending on soil type, severity of the damage and assuming remedial action is taken).It is important to distinguish between tolerable and genuine damage and to bear in mind the value of grass in the cows’ diet and the benefits of grazing grass in early spring. Knowing where you are in your spring and autumn grazing plans can also set the level of desire to get out and graze cows in imperfect conditions.If soil is poached, water sits on the surface for longer and soil stays softer, wetter and colder. Subsequent grazing by the herd results in further damage (Figure 26).
Look out for livestock that are twitching, or that seem unsteady on their feet. This can be a sign of magnesium deficiency.
Figure 26. Poaching caused by wet conditions
Min
eral
leve
l of h
erba
ge
May
YIELD
Jun Aug Sep
KCaNa
Mg
Great grazing 63

Crushing, bruising and burial of pasture in the mud makes it unpalatable and difficult to eat, reducing utilisation by up to 50%. This not only reduces cow intake at the time of grazing, but also affects feed quality in subsequent grazings. Ungrazed clumps reduces yield and affects target residual.
Top tips for dealing with wet weather• Be flexible
• Do not miss the opportunity to graze, especially in early spring
• Turnout does not have to be a one-off event in spring
• You do not have to follow the wedge exactly – move to a dry paddock for a period, then go back to the rotation
• Do not expect cows to graze as well as they normally would. Slacken off the residuals and make a note that next time you will need to correct the residual in that paddock; for example, by taking the paddock out for silage
• Use on/off grazing – this is where cows are let out to graze and are then brought straight back in when they have eaten their allocation. Or, they can go to be buffer fed on a concrete pad if pasture is at 2,800 kg DM/ha and cows can eat in 4 hours what they require in 12 hours- Cows must have an edge to their appetite; in
other words, do not buffer feed just before turnout and aim to run out of silage in the trough about 3 hours before going out to graze so they eat grass instead of damaging pasture
- Cows can be kept fully fed with two 4-hour grazing periods in 24 hours and then be returned to housing with access to water
- Avoid putting freshly calved cows to grass because they can spend time pacing the paddock rather than eating
- Any cows needing extra care should be kept back and fed full ration inside
• Avoid allocating long, thin areas of grass. Allocate a block area and back fence it so that cows do not travel often across grazed ground; this causes damage. Ideally, cows should only graze a section of ground once
• Using multiple paddock entrances and small tracks up the sides of paddocks can work to sacrifice an area along the fence line to avoid damaging the whole area. This can be done with well thought out temporary fences
• Monitoring the strategy you adopt is critical to make sure it is working and that neither pasture nor cows are suffering
Mid-season management
Magic day to start of autumn planner (April to August)During the main grazing season, the primary objective is to optimise animal performance from maximum grass intakes, while also maintaining pasture quality. Improvement of pasture quality offers the potential to achieve further increases in animal performance from pasture.
How to maintain high quality mid-season• Rotation length should be 18–21 days
• Cows should be offered an all-grass diet (see grazing high yielders on page 58 if this is not possible)
• Target pre-grazing covers of 2,800–3,100 kg DM/ha with high leaf content
• Graze to the residual target of 1,500 kg DM/ha (4 cm)
• Remove grass surpluses as silage. Avoid going for bulk: instead, focus on the next grazing round’s feed supply and quality. Use silage-making as a way to correct poor residuals on the grazing platform
It is important to recognise a surplus and take it out: do not wait a week if grass growth rate is high. The best option is to identify a surplus, remove it quickly and get the grass growing again. See page 55 for more information on identifying a surplus.
Mid-season pasture quality can be improved by alternating grazed paddocks with those that have been harvested for silage cuts.
How to get back on track if grass gets out of controlToppingIt can be tempting to ‘top’ grass to make paddocks look tidy. However, topping grass is very labour- and power-intensive and delays pasture regrowth. Topping should only be done to correct and re-set paddock residual if grass gets out of control.If topping, use a mower with a disc or drum so the cut is clean. Top as soon as the cows leave the paddock, or you risk topping valuable regrowth. It is not recommended to use a topper because it will not correct the situation and will leave a very poor residual. If you are new to pasture management, consult an adviser to discuss when topping should be carried out.
Surplus paddock silage can be very high quality. With systems such as big bales, silage wagons, or forage harvesters paid per tonne of DM, it can be harvested very effectively.
64 Great grazing

Pre-mowing Mowing before grazing is a management strategy sometimes used to achieve target pasture residuals when there is a surplus of pasture. Pre-mowing might suffice from mid-May to late June if a management correction is needed to re-set residuals, or clear up seedheads and rejection sites.Pre-mowing entails mowing to a residual of 1,500 kg DM/ha on allocations that the cows will realistically clear up in one feed. Generally, in dry weather conditions, most people mow 8–12 hours ahead of cows being turned into the paddock to avoid spoilage.
Research from Dairy NZ indicates that, compared with good pasture management, pre-graze mowing during spring:
• Does not increase cow intake or performance (milk solids production or body condition score gain)
• Reduces pasture performance (tiller numbers, growth rates and density)
• Reduces pasture surplus available for silage
• Increases the requirement for imported feed
Dry weather management planDry weather conditions bring challenging situations, but having a plan B ready to put in place to try and minimise the effect on forage stocks and livestock is key.
During dry conditions, it is important to try to stretch grass supply to keep grass in the animal’s diet for as long as possible. This is done by reducing daily grass demand to below the daily growth rate. See how to manage a deficit on page 54, but here are some points to consider:
• Increase and hold rotation length to between 24 and 30 days and avoid overgrazing regrowths (do not graze below 3 cm)
• Regularly monitor winter forage stocks and assess how much you can afford to feed
• Supplement with silage prior to afternoon milking to reduce the compromise on grass utilisation
• Assess how certain feed options stack up in terms of relative cost per unit of energy and protein
• Reduce the cost of bought-in feeds and forage by buying in bulk, locating local sources to keep transport costs down and asking several suppliers for quotes
• Check water pressures and trough access to ensure sufficient supplies to meet animals’ water requirements
• Investigate changing to once-a-day milking
In high temperatures and dry conditions, put preventative steps in place to reduce the risk of heat stress in livestock at pasture. Consider these points to protect your herd during hot conditions.
• Choose fields with adequate shade by trees or hedges where possible
• Reduce walking distance to the parlour and time spent in holding areas
• Reduce stocking rates. Avoid keeping cattle too tightly stocked in collecting areas or pens and consider using fans
• Move, gather, handle or transport animals only in the cooler conditions of the early morning or late evening wherever possible
• Control flies to reduce the risk of disease spread
• Give livestock the option to go inside if they find that more comfortable
• Cool cattle before and after milking by sprinkling them with water to wet their coats
Only pre-mow paddocks with high quality and highly palatable grass that you would want the cows to eat. If it is full of stem, consider topping post-grazing.
Figure 27. Dry weather affecting grazing paddocks
Figure 28. A Forage for Knowledge contributor farmer feeding out silage in the paddocks to reduce herd pasture demand
Great grazing 65

• Buffer feed in the late afternoon to allow the heat produced from rumen fermentation, which peaks 4–6 hours after feeding, to be dissipated during the cooler evening/night time
• High temperatures can affect fertility, so be aware of the potential for reduced intensity of expression of heat and longer oestrus periods in breeding females
• Protect yourself and your staff tooFor more information, see our EuroDairy webinar Managing heat stress in dairy cattle, available on the AHDB YouTube channel.Keep an eye of the signs of heat stress. These include refusal to lie down, huddling in shaded or cooler areas, body splashing, increased respiration rate, high rectal temperature (>41°C), open mouth breathing, head extended, tongue protruding and profuse salivation.
How to manage grass when the rain comesAfter a prolonged period of dry weather, supplements should be maintained to give grass a chance to recover. This is likely to be for around 21 days so that grass plants can push up some leaves and rebuild root reserves before grazing animals remove the leaves. You may maintain animals on sacrifice fields that need reseeding or that can be allowed to recover later in the year.
Nitrogen mineralised from the soil, or not utilised from previous application, will probably drive the recovery growth, but additional N will be needed to boost grass production – especially if silage cuts are required. Remember to only apply N when soils are moist enough for active growth, or N will be lost to the environment.
Weed controlThe Voluntary Initiative suggests that little more than 5% of UK grassland receives a weedkiller in any given year and few grassland farmers treat more than 10% of their pasture in any season.Where weed control is rarely practiced, consider whether the job is best left to a qualified contractor with modern National Sprayer Testing Scheme (NSTS)-tested equipment and qualified operators who are members of the National Register of Sprayer Operators (NRoSO). If you need more information or advice, consult a BASIS-registered agronomist, or your supplier for information specific to a given farm or field.
Think water – keep it cleanMany grassland weedkillers are detected in drinking water sources. Take extra care to avoid overspraying ditches and streams and to avoid any run-off into watercourses when filling and washing the sprayer. Several grassland weedkillers may face further restrictions unless users take more care with regards to when and where these products are applied.To prevent weedkillers reaching watercourses, current best practice is to:
• Use currently approved products recommended by an agronomist
• Keep weedkillers in a locked, bunded store
• Use trained operators with current qualifications
• Regularly check and test spray equipment
• Fill in areas away from drains and watercourses
• Clear up spills immediately
• Spray when soil and weather conditions are suitable; for example, when there is no risk of drift and soils are not too wet
• Leave buffer strips between watercourses and sprayed areas
• Clean and wash down sprayers at the end of the day
66 Great grazing

People and grassland managementThis section is designed to help dairy farmers to build teams and coach individuals to operate an effective grassland management process.
Key points for paddock identificationAny member of your team can identify paddocks so that it is easy to communicate where the cows are to graze. Some things that can help are to:
• Display a large, clear map on the wall in an area regularly seen by staff, such as an office or staffroom
• Have smaller, laminated maps for people to carry in pockets or that are fixed to the quad bike
• Stick to a system of identifying paddocks to avoid confusion among team members
• Put physical markers on gate posts to assist people when moving cows around the farm
• Paint fence posts within paddocks to indicate different splits in the paddock for a new break
• Use mobile GPS apps when trying to allocate specific areas
Key skills and how to coach the team Measuring grass• Conducting grass walks, either as a team, or
in a buddy system, is often the most practical and effective way to teach people how to measure grass
• Use two plate meters to see how close measurements are. Or, use one plate meter but walk a few paddocks twice, to see if it has been used accurately
• When entering a paddock, explain how to make a visual assessment of the pasture cover as a way to train someone’s visual judgement. This is important because it will help them to spot mistakes when measuring grass on their own
• When a few walks have been completed, the individual should be able to understand, measure and assess levels of pasture in a paddock
More coaching will be required when:• Making adjustments for large variances in grass
DM and plate meter formulae
• Adjustments are needed for a paddock that has been mowed or topped and where grass stubble is holding the plate meter up
Making short-term management decisionsTrain individual staff to be able to manage a herd of cows, follow the grazing plan and make adjustments when necessary. The important points to learn are as follows.
• Has the desired residual been reached? Clearly communicate what the targets are, both numerically and visually, and how it ties in with the ability to make a pasture cover assessment
• What action must be taken to correct a poor residual? Make practical decisions on returning the whole herd to the paddock, or returning a proportion of the herd to the paddock for a period of time
• How do you make quick calculations and understand herd DMI? For example, how do you calculate how many cows must go back into a paddock to get the correct residual?
• How do you assess cow rumen fill and milk output on a daily basis to check that cows have had the correct daily allocation of grass to hit optimal performance?
• How do you make flexible decisions in bad weather? For example, what is an acceptable level of poaching? Have the confidence to change the grazing plan to find dry fields and open up the allocation of grass to compensate for underutilisation. Alternatively, be confident in making a decision to stop grazing for a set period of time
Complying with latest spray legislationThese measures now apply to grassland weedkillers. Demonstrate that integrated pest management (IPM) is followed on your farm. The sprayer operator on your farm must hold a recognised certificate. Grandfather rights are no longer valid.All pesticide application equipment (excluding handheld equipment) in use must have a valid National Sprayer Testing Scheme (NSTS) certificate.These measures, which form part of the UK’s Sustainable Use Regulations, are legal requirements for farmers. Non-compliance could lead to prosecution and threaten your Single Farm Payment. They will also feature in farm assurance schemes.
Great grazing 67

Support with grazingLearning about grazing is best when coached by a mentor. Particularly at critical times, it is helpful to be able to regularly contact each other to discuss decisions that have been made, and why. Mentors can do the grass walk and help interpret the grass measurements, as well as set the plan for the next week. It would still be important for the mentor to walk at least some of the farm and look at recent residuals and entry covers.Discussion groups and consultants specialising in grazing are also an excellent way to learn – whatever your level or system. Grazing is about experience – learning from other people’s successes and mistakes can save you a lot of time and money.Despite teaching and coaching, people can make the wrong decisions, or may not be decisive enough. However, it is important to deal with this in a positive way and build people’s confidence in their decision-making skills and learning experiences. Getting to know the farm you are operating and having a year’s experience helps with decision-making on wet areas and understanding the risks of damage when grazing.
Longer-term managementBuilding on the experience of the previous section, the next steps would be for learners to:
• Start doing weekly grass walks and processing the data to set a grazing plan
• Understand and use grass management software
• Make surplus and deficit management decisions
• Understand the planning and implementation of autumn and spring rotation planners
68 Great grazing

70 Overview
71 Planyoursilagestrategy
75 Preparetomakegood-qualitygrasssilage
78 Safetyconsiderationsduringsilage-makingandfeeding
79 Cutting,wiltingandharvesting
83 Ensilingbestpractice
86 Feedingoutsilage–keepingontrack
87 Interpretingsilageanalysis
89 Whatifitgoeswrong?
Successful silage
Succ
essfulsilage

Overview Making and feeding high quality, digestible silage encourages higher feed intakes and better cow performance. High-quality forage has a high nutritional value in terms of energy and protein and is also well preserved. This makes it highly palatable, which supports high levels of forage dry matter intake (DMI).Monthly analysis of the clamp will capture changes in quality over time. This allows more accurate diet formulation, so that nutrients are not under- or oversupplied.Two keys to achieving high-quality silage are:1. To allow sufficient time to plan and prepare your
silage-making strategy.2. Paying attention to detail at all stages of silage-
making – in the field, ensiling and at feed-out.
Successful silage
70 Overview
Grass silage can only be as good as the sward from which it is made. Integrating grazing and silage-making by producing and utilising sufficient, high-quality forage is key to profitability.

Plan your silage strategyA good management plan will deliver on the three main objectives for high-quality silage:
• Good yield for first cut silage and high annual grass tonnage per hectare
• A clean, well-preserved feed with good palatability
• Appropriate nutritional quality
Source: Teagasc, 2017
Step 1: Decide which silageSilage-making starts in June with crop planning. Deciding which forages to grow in summer – and where – allows you to decide which crops to drill in autumn and the following spring. This will determine your forage production for the following year.Key points to consider when assessing your forage options:
• Yield – this is the main factor determining the cost of forage (£/t DM)
• Nutritional quality in relation to the type of livestock to be fed
• Agronomic considerations, such as how the crop will fit into the farm’s rotation and suit the farmland
• Practical issues, such as storage, feeding method and farm infrastructure
• Your own farm targets
Grass silage Grass silage remains the most common forage in GB. Some key benefits of grass silage are that it:
• Meets the nutritional requirements of the livestock
• Is the lowest cost forage option
• Fits agronomic and practical issuesFlexible forage, with between one and five silage cuts per year, is possible, or it can be grazed depending on grass growth rates and grazing demand.Silage quality, intake and milk production potential are governed by the quality of the grass being ensiled, as well as management of the ensiling process. Permanent pasture can produce grass silage, but higher yielding grass leys with a high rye-grass content (+70%) are essential for an efficient, lower-cost silage system.
The average cost to produce one tonne DM of grass silage is £120, so it is crucial to work through a farm action plan to capitalise on the return on investment.
Step 1Decide which silage is best for your system
Step 2Prepare a silage budget so you know
how much you need
Step 3Produce a cropping plan with target yields
Step 4Compare your budget with your cropping
plan and estimated production
Attention to detailWhen time is precious, it is even more important to know where to focus your effort and energy.If you know that soil fertility has a major impact on silage yield and quality, then take control of all the factors that will get you the results you are looking for, rather than leave it to chance. Using information that tells you what is working and what is not will help you focus your time and effort and help you to move from decision-making based on assumptions, towards decision-making based on facts.When using information to make good decisions, make sure you KISS: Keep it Simple and Straightforward. Involve the team, so they learn the importance of cause and effect – great results do not happen by chance, they happen when you stop guessing and start managing production.
Successful silage 71

Maize silageA well-managed, successful maize crop is one of the lowest cost options for GB farms. Some key benefits of maize silage are that it:
• Provides high-quality forage in terms of starch, energy and intake characteristics to meet nutritional requirements of the livestock
• Has a high DM yield potential
Maize silage is a high quality, conserved forage option for livestock in areas that experience high temperatures during the summer, have medium textured soils and are at low altitude (Figure 29).Maize can also be grown on less favourable sites, where techniques such as drilling under degradable film will increase the rate of crop maturity. However, remember to consider your return on investment.Forage maize does have some drawbacks: like wholecrop, protein needs to be added for it to become nutritionally balanced.Farm location, soil type, altitude and field aspect must be carefully considered before deciding if and where to grow maize. Wherever it is grown, maize requires attention to detail, from ground preparation right through to ensiling.
Figure 29. Suitability of ground for growing maize in GB
Fermented wholecrop silage Fermented wholecrop can meet all criteria for an appropriate forage option. Wheat, barley, triticale and oats are equally suitable for wholecrop cereals. High yields are needed to make wholecrop cost-effective, so attention to detail is key when growing for grain. Generally, only winter-sown crops are suitable for urea-treated wholecrop and the additive must be applied evenly at the correct rate and precisely to manufacturers’ instructions.
Flexibility is one benefit: deciding whether or not to harvest for forage or grain can be made fairly late in the growing season, based on your demand for additional forage and the value of the cereal crop and straw.Legume silage Legume silages are very palatable and are especially valuable as protein sources in organic and conventional systems. It is best not to feed legume silages alone, because they have high protein contents and low fermentable energy levels. Mixing with a readily available energy source will improve utilisation.Lucerne is a useful source of protein for cattle. As a high-yielding legume, its roots naturally fix nitrogen, making it a cost-effective crop to grow on its own.However, it is not suitable for all farms and will not perform or persist on heavy land or waterlogged soils; these conditions can rot its deep taproot. Farms that experience high rainfall are unlikely to grow lucerne successfully.Lucerne is valued for its yield, protein and digestible fibre content and drought tolerance. See our Growing and feeding lucerne webpage (ahdb.org.uk/knowledge-library/feeding-lucerne-silage).
Step 2: Prepare a silage budgetPrepare an annual silage budget to estimate the total quantity of silage required per annum. To do this, estimate:
• The number in each class of livestock
• The number of days for which each class of livestock will need silage – adjusted for expected turnout and housing dates and including any buffer feeding
• Daily forage DMI for each class of livestock (see Table 20)
Higher forage DMI can be achieved with a mix of forages. For instance, when grass and maize silage are fed together, milking cow intakes of up to 10–15 kg DM/day should be assumed for Holstein-Friesians.
Table 20. Typical forage dry matter intake (DMI) for livestock
Average daily forage DMI
(kg/head/day)
Typical range of daily forage DMI
(kg/head/day)
Milking cows 12 10–15
Dry cows 9 8–12
Heifers (1–2 years) 8 7–10
Heifers (0–1 year) 4 2–6
Maximising forage yields spreads the fixed costs of growing it; there is a 6–8% yield variation between varieties within the same maturity class.
Marginal
Favourable
72 Successful silage

The AHDB Feed and forage calculator provides guidelines for preparing an annual silage budget. Examples are shown below for AYR (Figure 30), autumn block (Figure 31) and spring block (Figure 32) herds.
Do not forget to consider:
• Animal size, yield level and desired growth rate when estimating DMI
• That a silage budget should be prepared in June for harvest the following year
• Total annual silage requirement based on estimated average livestock numbers from June to May
Figure 30. All-year-round herd example of a silage budget Source: Screenshot from AHDB Feed and forage calculator
Figure 31. Autumn block herd example of a silage budgetSource: Screenshot from AHDB Feed and forage calculator
Figure 32. Spring block herd example of a silage budgetSource: Screenshot from AHDB Feed and forage calculator
Animal type No. of stock No. of weeksAllocation
(kg DM per day)Dry matter (%)
Total requirements (tonnes FW)
Bales (@0.6t FW)
Dairy cows - milking 212 16 15 30 1187.2 1979Dairy cows - dried off 38 16 12 30 170.2 284Lactating suckler cows 12 30 0.0 0Dry suckler cows 10 30 0.0 0Cattle (up to 200 kg) 65 16 6 30 145.6 243Cattle (up to 400 kg) 75 16 9 30 252.0 420Cattle (up to 600 kg) 12 30 0.0 0Ewes (>65 kg) 1.6 30 0.0 0Ewes (>50 kg) 1.3 30 0.0 0
TOTAL 1755.0 2925Add safety margin (10-20%) 10 175.5 293
1930.5 3218TOTAL including safety margin
Animal type No. of stock No. of weeksAllocation
(kg DM per day)Dry matter (%)
Total requirements (tonnes FW)
Bales (@0.6t FW)
Dairy cows - milking 212 15 15 30 1113.0 1855Dairy cows - dried off 12 30 0.0 0Lactating suckler cows 12 30 0.0 0Dry suckler cows 10 30 0.0 0Cattle (up to 200 kg) 65 16 6 30 145.6 243Cattle (up to 400 kg) 75 16 9 30 252.0 420Cattle (up to 600 kg) 12 30 0.0 0Ewes (>65 kg) 1.6 30 0.0 0Ewes (>50 kg) 1.3 30 0.0 0
TOTAL 1510.6 2518Add safety margin (10-20%) 10 151.1 252
1661.7 2769TOTAL including safety margin
Animal type No. of stock No. of weeksAllocation
(kg DM per day)Dry matter (%)
Total requirements (tonnes FW)
Bales (@0.6t FW)
Dairy cows - milking 212 2 15 30 148.4 247Dairy cows - dried off 212 8 12 30 474.9 791Lactating suckler cows 12 30 0.0 0Dry suckler cows 10 30 0.0 0Cattle (up to 200 kg) 65 16 6 30 145.6 243Cattle (up to 400 kg) 75 16 9 30 252.0 420Cattle (up to 600 kg) 12 30 0.0 0Ewes (>65 kg) 1.6 30 0.0 0Ewes (>50 kg) 1.3 30 0.0 0
TOTAL 1020.9 1701Add safety margin (10-20%) 10 102.1 170
1123.0 1872TOTAL including safety margin
Successful silage 73

Remember to allow some tolerance (20–25%) when preparing a silage budget. You may need more than you planned; for example, because of adverse weather conditions.
Step 3: Produce a cropping plan with target yieldsProduce a cropping plan using information from Steps 1 and 2, as well as target crop yield data, to estimate silage production. Use yield data from your own farm, or use target yields from Table 21.
Table 21. Targets yields for forage crops
CropTarget dry
matter yield (t DM/ha)
Target fresh weight yield
(t/ha)
1st cut grass 5.8 23
2nd cut grass 3.8 13
3rd cut grass 3.0 11
4th cut grass 2.5 8
Forage maize 13.5 42
Fermented wholecrop 12 30
Lucerne silage 12 40
Source: The Dairy Group Ltd, AHDB, Germinal
Calculating your own crop yields on a crop-by-crop and field-by-field basis is also useful for comparing forage costs and identifying under-performing fields. In turn, this will help identify reasons for poor performance so you can make improvements. You can calculate crop yields by:
• Dividing the total tonnes in the clamp by the number of hectares harvested
• Weighing 4–5 loads of silage and multiplying the average weight by the number of loads harvested from each field
• Using a yield monitor on the forage harvester – discuss with your contractor
Step 4: Compare your budget with your cropping plan and estimated production When a considerable surplus or shortage is identified, management decisions should be made to address this.
How to address a deficit
• Monitor dry matter (%) as this will have effect on over- and under-feeding of silage
• Reduce waste during feeding out and double check the accuracy of weighing scales on mixer/feeder wagons
• Evaluate livestock and sell any surplus stock, such as empty heifers or cows, and cull cows earlier
• If planning early enough, sow a brassica crop for outwintering youngstock
• Find alternative forage sources – for example, standing maize – or buy in moist feeds. Secure at least 60% of your silage requirement before looking at other options. Purchase alternatives on a per unit of energy and protein basis
• Reduce the cost of bought-in feeds by taking full arctic loads; use local sources to keep transport costs down and ask several suppliers for quotes. Always check that the final diet is balanced for energy, protein, fibre and minerals
• Plan and prepare for earlier turnout in spring, if weather conditions allow. For more information on spring turnout, see the Great grazing chapter (page 36)
The rest of this chapter will focus on grass silage, but if you have identified alternative forage as a suitable option for your system or would like further information please see the following:
• AHDB Growing and feeding maize silage for Better Returns
• Maize Growers Association
• AHDB Growing and feeding lucerne webpage
• Harvesting wholecrop videos on the AHDB Beef & Lamb YouTube channel
• Teagasc Guide to DM content for whole crop and moist grain harvest
Act early if deficits are likely – a range of measures may be needed.
74 Successful silage

Prepare to make good-quality grass silage Having planned your silage strategy, it is important to prepare crops and clamps carefully in advance to ensure that:
• High yields of silage (t DM/ha) are ensiled
• Rapid fermentation takes place to preserve nutrients and increase silage palatability
• The silage is of high nutritional quality
Grassland soilsCorrect soil indexes are fundamental to successful silage production. Soil testing is vital to help identify nutrient availability.
• Ensure you sample every 3–4 years because considerable levels of nutrients are removed from fields that are regularly cut for silage
• Light, sandy soils, or those in areas with high rainfall, may need sampling every 3 years
• Use the results to develop an annual nutrient plan for organic manure and purchase fertiliser to match crop demand
• Ensure that sufficient account is taken of nutrients supplied by clover and organic manure. This will minimise establishment and production costs, while optimising DM yield
How to sample grassland soilsIdeally, samples should be taken in the same season and at least 3 months after the last application of manure, fertiliser or lime. Prioritise underperforming fields, those that will be reseeded, those that have received a lot of organic manures (such as muck, slurry or digestate), or where perennial rye-grass content is in noticeable decline.
For areas of the field that are known to differ; for example, by soil type, previous cropping and nutrient applications, sample these separately. Small areas that vary from the majority of a field should be excluded from the sample.
How to test• Twist a gouge or pot corer down to a depth
of 7.5 cm
• Walk the field in a ‘W’ shape. Avoid gateways, feeding areas or former muck-heap sites
• Collect 25 plugs of soil in a clean bucket
• Seal a well-mixed subsample in a plastic bag or box and label
• Send to an accredited soil testing laboratory (either directly or via a local cooperative, fertiliser merchant or independent company)
Optimum soil pHCorrecting the pH of an acidic soil by applying lime improves the yield response of grass to applied nutrients (Figure 33). It also helps soil structure, optimises the availability of soil trace elements, increases earthworm numbers and reduces the risk of nutrient losses to the environment.
Figure 33. Ideal soil pH is essential for interactions between nutrients and optimising plant growth
*Ideal pH for continuous grass on mineral soils. Increase pH on mineral soils to 6.2 if occasional barley crops are grown and to pH 6.6 for leafy forage crops and lucerne.
** Ideal pH for continuous grass on peaty soils. Increase pH on peaty soils to 5.5 if occasional barley crops are grown. Peaty soils are unsuitable for leafy forage crops and lucerne.
Liming silage ground for best yields and qualityTable 22 shows the yield reduction seen at lower soil pH.
Table 22. Yield versus pH
pH Yield (%)
<4.5 87
4.5–5.0 88
5.0–5.5 91
5.5–6.0 96
6.0–6.5 100
It is important to collect a representative soil sample from the field. Poor sampling can give inaccurate results, which can increase costs through unnecessary applications or reduced yields.
Mineral soil
Peaty soil
Apply lime at maximum 5t/ha per application
Monitor effect after 12 months
6.0 and 6.5 depending on the cropping
5.3 and 5.5 depending on the cropping
Heavy cropping will bring pH down
Very difficult to
change naturally
Avoid applying digestate
TOO LOW IDEAL TOO HIGH5
5 5.5
76*
5.3**
Successful silage 75

The ideal is pH 6–6.5. Below this optimum:
• Yield decreases
• There is a reduced response to phosphorus, potassium and nitrogen fertiliser applications
Phosphorus and potassium indexFields that are regularly cut for silage have a higher requirement for phosphorus and potassium. One tonne of fresh silage with 30% DM contains 2.1 kg of phosphorus and 7.2 kg of potassium. The addition of potassium is particularly important to maintain grass yields (Figure 34). Even at a potassium index of 2+, the requirement of a multi-cut silage system is between 40 and 60 kg/ha at each cut. At index 2, on a grazing-only pasture, the maintenance requirement is nil.
• Low soil phosphorus and potassium levels reduce yield and quality of silage
• Poor nitrogen fertiliser response on low index soils
• Optimum index for phosphorus is 2 and 2- for potassium
Note: if preparing silage for dry cows do not use farm manures, slurry or apply artificial fertilisers containing potassium to help reduce problems pre and post calving.
Sulphur Sulphur deficiency is increasingly common in grassland, especially in second or later cuts where high rates of nitrogen have been applied. Sulphur is important for protein formation in grass; deficiencies can cause large reductions in yield and may be worse on shallow or sandy soils. Sulphur deficiency is indicated by poor growth and a yellow tinge to young leaves. When this is observed, apply 40 kg/ha SO3 as sulphate-containing fertiliser, at the start of growth before each cut.Analysis of uncontaminated grass just before cutting is a useful indicator of deficiency. The information can be used to assess the need for sulphur for future cuts. The critical level is 0.25% total sulphur, or an nitrogen:sulphur ratio greater than 13:1.
NitrogenUnder ideal growing conditions, grassland can utilise 2.5 kg/ha/day nitrogen (around two units of nitrogen per ha per day). When calculating nitrogen requirements, supply from other sources must also be considered.
It is also important to take the factors below into account when calculating nitrogen:
• Soil nitrogen status
• Grass growth class
• Yield potential (Figure 35)
Nitrogen deficiency can be observed by yellowing of older leaves within a grass ley.
Figure 35. Effect of nitrogen on grass yield Source: IGER
Do not cut silage for 4–6 months after liming. For silage, it is better to lime after cutting because high uptake of lime can increase the pH in the silage pit, which affects silage preservation.
Too much nitrogen produces grass with low sugar levels. The resulting silage can have high ammonia and butyric acid levels, making it less palatable. Too little nitrogen compromises yield and protein levels can be low. Target 0.15% nitrate nitrogen on a fresh matter basis before cutting.
1 2 3 4
Severe restriction on growth
Nutrients limiting grass growth Optimum index P and K not limiting
growth
Reseeds do not perform
Annual DM yield reduced
Good silage yield and dry matter digestibility
Reserve of nutrients in soil
Silage yield and quality poor Silage yield and quality poor Ensure fertiliser
replaces off-takeMonitor and apply P and K
when index falls to 3
Figure 34. What does your phosphorus (P) and potash (K) index mean? Source: Teagasc
Crop requirement
Supply from soil
Supply from manures
Supply from air
Supply from clover
- = Fertiliser requirement
Nitrogen application (kg/ha/year)
14
12
10
8
6
4
2
0 0 50 100 150 200
Annu
al g
rass
yie
ld (t
onne
s DM
)/ha)
76 Successful silage

Seed varieties Production costs can be reduced by selecting appropriate seed varieties for grassland reseeds. Seeds should be selected on the basis of DM and/or energy yield per hectare. For example, diploids Moira (heading date 23 May) and AberBann (heading date 6 June) perform very differently under silage and grazing management (see Figure 36), resulting in differences of approximately £60/ha in yield.Grazing
Silage
Figure 36. Annual grazing and silage yield (t DM/ha/year) for Moira and AberBann
Grass varieties have different heading dates, which are trigged by different temperatures. For example, early heading grasses can start to grow at lower temperatures, earlier in spring. Grasses are classified according to heading date. This is the date on which 50% of the ears in fertile tillers have emerged. Choose a silage mixture that contains grasses with similar heading dates. The Recommended Grass and Clover Lists are available as a handbook and interactive spreadsheet. These resources provide information on the varieties that have been trialled in the UK, as well as technical information on formulating mixes for cutting based on your system.
Preparing the clamp checklistTime spent preparing clamps ahead of silage-making can considerably speed up operations at harvesting, as well as improve silage quality. Work your way through this checklist to give silage clamps an MOT before harvesting:
• Remove any mouldy or rotting silage from the clamp and clean the clamp thoroughly
• Ensure block walls are rendered with cement or cement/sand and covered with a chlorinated rubber paint, or pitch epoxy to make them airtight
• Clamp walls should be sealed by lining with plastic sheets that can be overlapped with the top plastic sheets
• Lay plastic sheeting under the base so that unwalled faces can be covered and sealed
• Check there is good effluent drainage at floor level within 50 cm of the inside faces
Machinery and contractorsPlan cutting and harvest dates early and make sure that your own machinery is serviced and ready to go, or that contractors are booked well ahead of time. Clearly set out your requirements and expectations for the timing of cutting, degree of conditioning, target DM, duration of wilting, chop length and additive application. You can only be in control of these variables if you make it clear what you are trying to achieve. Whether you put your forage harvesting out to tender, or have a regular contractor, it is in everyone’s best interests to agree the price of the job up front and be clear about who will be supplying fuel.
Remember• Slurry or muck should not be applied within
6 weeks of cutting because of possible contamination
• Fertiliser practice should not cause swards to lodge because this will reduce yields and can compromise harvesting efficiency and quality through soil contamination
• Check grass fields in early spring to identify those that may need rolling to flatten molehills, remove stones and eliminate any unevenness that might hamper forage harvesting, or increase soil contamination. Any holes that might damage machinery should also be filled
For detailed guidance on soils and fertiliser, refer to the AHDB Nutrient management guide (RB209) and the Healthy grassland soils pocketbook, both available from ahdb.org.uk, or seek advice from a FACT-registered adviser.
10.9
10.7
10.5
10.3
10.1
9.9Moira Aber Bann
Annu
al g
rass
yie
ld (t
DM
/ha/
yr) Difference of
0.6 t DM/ha per year = £73/ha per year
10.6
10.4
10.2
10.0
9.8Moira Aber Bann
Annu
al s
ilage
yie
ld (t
DM
/ha/
yr)
Difference of 0.4 t DM/ha per year
= £49/ha per year
Successful silage 77

Top tips to maintain a good relationship with contractors• Aim to build a relationship on communication
and trust
• Consider the contractor – how far are they from your farm
• Don’t shop around on price only
• Make sure your buildings, clamps and tracks are as ‘contractor-friendly’ as possible
• Start a conversation with your contractor at least 1 month before you think you’ll be cutting
• Be prepared for when the contractor arrives – clean out the pit, have the side sheets and additive already on the farm
• Keep the contractor in the loop for the next job
• Pay your bills in a timely fashion
Safety considerations during silage-making and feeding
Guidelines and good communication can dramatically reduce the risk of serious injuries and fatalities. Every farm and silage contractor should:
• Have written safety policies and procedures for their silage program
• Schedule regular meetings with all employees to discuss and demonstrate safety
In every silage programme, the most important goal is to send all employees home safely to their families at the end of the day.
Some silage-making tasks might not have been considered since the previous year. Therefore, help to refocus the silage team by holding training sessions with all parties involved before the silage season begins.Long harvesting, transporting, filling and packing hours, without periodic breaks and adequate nutrition, can increase fatigue, drowsiness and illness. Here are some guidelines for promoting a safer working environment:
• The silage team should be of an appropriate size to allow all tasks to be performed safely
• All employees should get a good night’s sleep – tired equipment operators are more likely to make mistakes
• Periodic breaks of 15–20 minutes have proven effective for keeping employees alert
• Rotating work shifts will help keep employees fresh and alert
• Ensure all employees have nutritious meals on a regular schedule throughout the day
• Children, pets and uninformed bystanders should be kept out of the way of the silage-making operation. They only distract from the many responsibilities that equipment operators have and pose a safety risk
WarningWorkers and bystanders of all ages have been killed in silage accidents.Even the best employee can become frustrated with faulty equipment and poor weather conditions and take a hazardous shortcut, or misjudge a situation and take a risky action.
Getting people ready for the long hours of silage-making is just as important as preparing the equipment for the task.
78 Successful silage

Key hazards directly associated with silage-making and feeding include:
• Tractor or truck rollover
• Run-over by, or entanglement in, machinery
• Falls from height
• Crushing by an avalanche or collapsing silage
• Silage gases
• Complacency and fatigueMore information on each of these hazards is available in the Silage review by Keith Bolsen, at bit.ly/3qYMZIK
Information provided here is taken from Bolsen, 2018, Silage review: safety considerations during silage making and feeding. Further information can also be taken from Farmwise and What a good farm looks like resources, available on the Health and Safety Executive (HSE) website (hse.gov.uk).
Figure 37. Photo taken minutes after a silage avalanche Source: Keith Bolsen
Before silage-making begins, have you:
• Written your safety policies and procedures?
• Scheduled time with all your employees to discuss and demonstrate safety?
Cutting, wilting and harvestingResearch shows that in multiple-cut silage systems (two or more), total yields of DM are similar, but total yields of energy are increased with earlier and more frequent cutting. The single biggest factor to influence nutritional quality is cutting date. Yield and quality are often considered to be incompatible, which is not the case.When crops have been prepared to achieve high DM yields, cutting date is a management decision rather than a trade-off between quality and quantity. There should be no need to delay cutting to bulk up yields. It is possible to achieve both quality and quantity.
Multi-cut system The multi-cut system has been a success for Dutch dairy farmers. They tend to cut silage little and often, making the decision to cut every 5–6 weeks to achieve high-quality silage.Advice for switching to a multi-cut system• Prepare in advance so you can take advantage
of that window in weather. You should speak to your contractor weeks beforehand
• Grass should be cut when it is still green (not yellow) in the bottom of the plant so there is sufficient quality and regrowth for subsequent cuts. If it is green, the plant is still able to absorb sunlight (photosynthesise) and grow rapidly
• To know when to apply nutrients, start with anticipated cutting dates and work backwards. As a rule of thumb, put on enough fertiliser for 30 days if you are cutting every 5 weeks
Pros and cons of switching to a multi-cut systemPros • Produces better quality forage – higher in ME
and protein
• Reduces wilting times
• Reduces exposure to volatility by reducing reliance on bought-in feed
• Increases milk solids output
Typical concerns• Additional contracting charges
• Leaves yourself vulnerable to weather
• Increases soil compactionSource: Dave Davies, Farmers Weekly
Grass silage – target cutting stageFor the highest quality silage, aim for an early May cutting date. Nutritional quality is principally governed by grass digestibility (D-value), which starts to fall with the onset of stem formation and heading by up to 0.5 units/day.Research from Northern Ireland has shown that grazing silage fields until the beginning of March has no impact on silage yield or quality. Later grazing, or overgrazing fields in spring, could reduce the grass recovery rate, subsequent yield of silage and/or delay the cutting date.Do not be tempted to sacrifice quality for quantity by delaying harvest. The cutting date is also critical to the quality of second and subsequent cuts. To maximise quality, take further cuts at 30–35 day intervals.
Successful silage 79

How does grass growth stage at cutting affect silage quality?There is a tricky balance to achieve between producing low yields of highly digestible young grass and high yields of mature, stemmy herbage with low digestibility (see Figure 38). The target depends on the type of stock being fed; for example, milking cows or growing heifers.
Figure 38. D-values vary depending on the proportion of leaf and stem present, which is governed by heading date
Before cutting, targets to aim for include:
• DM 28–32% at harvest
• Crude protein (CP) 16%
• Water soluble carbohydrate (WSC), sugars and fructans of 3% in the fresh crop (for good fermentation)
• Target nitrate-nitrogen levels below 0.15% fresh matter. Higher levels can lead to ammonia production, which is alkaline and raises pH
Top tips for cutting grass for silage • Set up machinery correctly to avoid ground
contact, thus reducing the risk of soil/organic manure contamination. Leave 4 cm stubble to avoid soil and manure contamination and encourage regrowth
• Mow when dry (no rain or dew) and preferably in the morning if ensiling can be later the same day and the target DM reached
• Once cut, the grass leaf starts to die and continues to respire, thus losing DM and nutritional value. A longer wilting time leads to bigger losses
• Spread grass rapidly and evenly within 1 hour of cutting to encourage wilting – aim for 30% DM in 12–24 hours to concentrate the WSC and promote faster fermentation. Crops with high clover content can be wilted for longer: up to 48 hours
• Cut, spread and pick up grass the same day in poor weather. Always row up swaths immediately before pick-up
• Have the forage in the pit or bale within 24 hours, if possible
• Adjust chop length based on crop DM to optimise clamp consolidation. Grass that is chopped when being picked up gives more efficient silage fermentation, more sugars are released and trapped oxygen is dispersed. This makes it easier to consolidate and it breaks down more rapidly in the rumen, leading to higher DMI and performance (Table 23)
Table 23. Target chop length for grass silage based on dry matter (DM) content.
Silage DM (%) Ideal chop length (cm)
28–35 2.5–5.0
20–28 8.0
<20 8.0–10.0
Cutting silage in difficult weather conditions• Delay mowing until it seems very likely that the
harvest can be completed once started
• Check sugar content of fresh grass
• Reduce soil contamination by using multiple field access points and keeping a concrete area in front of the clamp clean of soil
• Part fill trailers, work downhill on steep slopes, have low ground pressure tyres (<1.0 bar)
• Postpone harvest of the very steepest or wettest areas to a later bale cut if necessary
• Be prepared to handle high effluent outflow from wet crops
• See page 82 to determine whether an additive is necessary
Source: Teagasc
Wilt and harvest quicklyTarget DM at harvest is 28–32% and requires close monitoring throughout the wilting period. Make informed decisions on crop DM by following AHDB’s guide on how to Calculate DM of silage – there is a section dedicated to in-field sampling.Alternatively, use the ‘hand squeeze’ method for estimating DM.
• Collect representative samples of the forage
• Mix the samples thoroughly and take a subsample
• Cut the forage into lengths of 1–2 cm
• Tightly squeeze a handful into a ball for about 30 seconds
• Quickly open your hand
• Use Table 24 to estimate DM content
72 D-value, leafy growth. Typical first cut yield of
a long-term ley – 4.6t DM/ha
68 D-value, lengthening of stems.
Typical first cut yield of
a long-term ley – 6.1t DM/ha
65 D-value, flower heads
emerging. Typical first cut yield
of a long-term ley – 7.5t DM/ha
80 Successful silage

Always evaluate the use of an additive before buying, considering its effect on the forage and livestock performance verses cost. Follow the manufacturer’s application instructions. Ask the retailer/sales representative for independent scientific trial results.
Table 24. Estimated dry matter (DM) content from hand squeezing
DM content (%) Condition of the sample
Below 25 Ball retains its shape and some free juice expressed
28–32 Ball just holds its shape. No free moisture expressed.
32–40 Ball falls apart slowly.
Over 40 Ball springs apart quickly
The change to grass DM content caused by wilting is affected by duration of wilt and mechanical treatment of the swath (Table 25). Dry matter of grass cut into large rows will change little in a 24-hour period. Tedded swaths wilted for more than 24 hours may become excessively dry. Pit silage DM over 33% will not improve animal performance, will be harder to consolidate and may have poor aerobic stability at feed-out.
Table 25. How wilting duration and swath treatment affects dry matter (DM)
DM% of cropWilting hours
0 24
6 metres per row 17 19
3 metres per row 17 23
Tedded out 17 30
Source: Adapted from information sourced from Teagasc
A conditioner on the mower splits the grass, so there is a greater surface area for water loss. This can increase wilting speed by up to 20%. Figure 39 demonstrates the effect of drying treatments on DM.
Figure 39. The effect of drying treatments on dry matter (DM) content of pasturesSource: Dairy Australia
Strategies that can increase wilting rates include:
• Mowing crops at canopy closure (lighter crops with more leaf and less stem) leaving a stubble height of 5–7.5 cm to improve air flow
• Using a mower-conditioner with flail or tines
• Following the mower with a tedder to spread the forage. If possible, ted within 2 hours of mowing, while plant stomata remain open, to substantially increase wilting rate
• Leaving the swath of the conditioned forage as wide as possible (moisture evaporates quicker from thin, wide swaths)
• Avoiding over-wilt – field losses increase and silage is harder to compact
Source: Dairy Australia
To use or not to use an additive?Additives containing 1,000,000 L plantarum inoculation/g fresh forage improves silage quality and animal permanence (Davies et al., 1998), but they do not compensate for poor management. Application is at pick-up or baling. The choice of additive depends on crop DM, digestibility and buffering capacity. It is worth discussing the use of additives with your contractor because some additives require specific machinery applicators, which may differ between brands.
35
30
25
20
15
10
5
0Rotary mower
Abrasion conditioner(nylon brush)
Crusher conditioner (roller)
DM c
onte
nt (%
)
No tedding With tedding
Successful silage 81

Protect forage quality by ensuring rapid and effective fermentation. Heterofermentative and homo-fermnetative additives reduced protein quality and sugar preservation compared to untreated and homofermentative only inoculants (Davies et al 2002). See Figure 40. Table 26 outlines some key considerations and features of the most common types of additives.
Figure 40. Making good silageSource: Adapted from Teagasc
Table 26. Silage additives: mode of action and when to use
Additive type Mode of action When to use
Bacterial inoculants
Homofermentative inoculants contain bacteria such as Lactobacillus plantarum, Pediococcus and Lactococcus, which convert grass sugar to lactic acid. They improve the speed of pH decline and reduce protein breakdown. To be effective on grass, 1 million bacteria per gram of fresh forage must be applied
High-quality grasses over 25% DM, late-cut grass
Heterofermentative inoculants contain species such as Lactobacillus buchneri, L. brevis, L. hilgardii and L. kefira, which convert grass sugars to lactic and acetic acids, ethanol, mannitol and carbon dioxide. Designed to improve aerobic stability not fermentation quality. Require more sugar for the fermentation
High DM silage over 32%; not on bales or low-sugar crops such as legumes
Molasses (sugar supplements)
Increase fermentable sugars. High rates and equal distribution needed
Low grass sugars, poor weather. Direct supply of available sugar. Often needed with a homofermentative inoculant to convert the added sugar into lactic acid. They give a lower fermentation response than formic acid and are rarely used because of cost and limited potential benefit
Acid/salts
Accelerates drop in pH. Propionic acid inhibits yeasts and moulds and can improve aerobic stability. Can be hazardous. Sodium nitrite inhibit enterobacteria and clostridia and potassium sorbate and sodium benzoate inhibit yeasts and moulds and can therefore improve fermentation quality and aerobic stability.
Low sugars, low DM, poor weather. Can be useful under wet or low sugar conditions
Absorbent Retain effluent, increases sugars Wet conditions; 50–100 kg of pulp or hulls per tonne fresh silage
EnzymesConvert fibre into sugars, which bacteria can convert to lactic acid, or improve digestibility of low D-value silage at feeding
Crops low in sugar, results are generally marginal. Particularly suited for high DM silages
Points to remember:
• High quality silage can be improved by using the correct additive
• No one additive is ideal in all circumstances
• Make an informed decision based on current conditions
Risk factors for poor ensilability include:
• High leaf content
• Short N application interval
• Lack of sunshine
Sugars 2–3%(plus elevated nitrate
0.15% FM)
Additive required (see below)
Seek independent
adviceWilting not an option
Wilting to above 32% DM
Test grass sugars and nitrate
Sugars 3%Sugars <2%
82 Successful silage

Ensiling best practiceBacteria naturally present on the fresh crop produce lactic acid. Silage-making preserves grass in this lactic acid. These beneficial bacteria allow fermentation to take place, which maintains nutrient content even after months of storage. This process also prevents undesirable bacteria and moulds from growing. Fermentation begins after oxygen in the pit is depleted during the initial aerobic ensilage phase.
Wilting As soon as the crop is cut, plant respiration and the growth of unwanted microorganisms cause the grass to lose nutrients as sugars and proteins are broken down. Rapid wilting and ensiling minimises these losses by quickly creating acid levels to stop further undesirable processes. This is why good consolidation in the clamp and quick sealing is crucial.
Sugar For best results, the crop requires adequate sugar content: 2–3% FM sugar in the fresh grass is equivalent to 10–15% sugar in the DM. Young, leafy grass that has received full nitrogen recommendations, grass/clover mixtures and autumn cuts tend to have low sugar levels, thus lactic acid production may be insufficient to stop all undesirable processes. Applying additives can help prevent this.
pH The required pH drop will depend on the DM of the crop: low DM silages need a greater pH drop than higher DM silages. Clamp silage of a given DM will generally have a lower pH than baled silage of the same DM. This is because baled silage is not as well chopped, so there is less fermentation and a higher pH is acceptable to achieve a stable silage.If the conditions described above are met, lactic acid bacteria (LAB), which are present on the grass, multiply rapidly and convert available sugars to lactic acid (Figure 41). This causes pH to decline quickly; the optimum endpoint depends on silage DM. Some nutrient losses and protein degradation to ammonia occur during this phase. However, once target pH is reached, the result is clean forage with good DMI potential. The nutrient value of this silage is preserved until re-exposure to air at feed-out.
Figure 41. Comparison of good and poor fermentation processesSource: Teagasc
In contrast, poor silage fermentation occurs when one or more of the necessary conditions (high sugars, low buffering capacity, oxygen-free conditions) are not met. In the example shown in Figure 41, low initial available sugars restrict the growth of LAB, causing an insufficient drop in pH. This allows Clostridia bacteria – also present on the crop but increased with soil contamination – to begin a secondary fermentation. Ammonia levels rise as protein is broken down. Clostridia convert residual sugars and lactic acid to butyric acid, which results in a dark, foul-smelling silage with low feed value and poor intake characteristics.
Top tips for clamping silageEnsiling and clamp-sealing must be done quickly, paying great attention to detail. For all silages, good consolidation from the start of ensiling is vital to ensure stability during storage and feeding and to minimise losses.
Well-fermented silage has a fruity smell. The average cost of filling the clamp is around £21,000. The vulnerable zone for waste in a clamp is up to 0.5 m from the sidewall or the top sheet, which accounts for 27% of the volume (21% fresh weight). This means that, on average, over £4,000 worth of silage is in a vulnerable zone.
Fermentation time – Good fermentation
Con
tent
in s
ilage
Fermentation time – Poor fermentation
Con
tent
in s
ilage
LAB pH SugarsProtein
ClostridiaAmmonia
Successful silage 83

Key points• Keep the clamp floor clean by avoiding dirty
wheelings where forage will be tipped
• Fill the clamp in thin, even layers, no more than 15 cm deep
• Roll regularly, right to the edges of the clamp where possible – shoulders are often poorly consolidated and lead to high losses
• Harvesters are now capable of high work rates, so cross-rolling with a second tractor, or using a purpose-built weighted silage roller, will increase consolidation
• Fill clamps in a wedge shape from one end, but never fill an angle of the clamp more than 20° horizontally
• Keep clamp sides slightly above the level of the centre, so the tractor leans away from the walls
• Sheet or seal the clamp each night, even if it means achieving fewer loads each day, to allow lactic acid fermentation to begin. However, avoid rolling before the next day’s filling because this encourages air penetration
• If silage is of high DM (+35%), consider taking the last few hectares as direct cut, which will consolidate well and seal the top of the clamp
• Where subsequent cuts are clamped on top of a previous cut, remove sheets just before the first load of the next cut arrives. Aim to have a clean surface and remove any waste. If in doubt, spray with propionic acid, or another acid salts additive product
• Aim for 750 kg/m3 or 250 kg DM/m3 to improve quality and reduce DM losses and aerobic spoilage at feed out
Once the clamp is full and consolidation is complete, seal quickly and thoroughly by folding exposed side sheets in first, then covering the whole area with black plastic sheeting. Alternatively, a thin oxygen barrier sheet can be used. This will create an airtight clamp and reduce waste.Follow this with conventional black plastic sheets to reduce the risk of puncture. Weight the sheets with tyres, gravel bags or sandbags to ensure they stay in close contact with the silage and create an anaerobic environment. A net over the clamp will protect silage sheets from bird and wildlife damage.
Managing silage effluentEffluent must be collected because it is highly polluting. Government silage, slurry and agricultural fuel oil (SSAFO) regulations state that effluent must not reach field drains, watercourses or water supplies.Most effluent will be produced in the first 10 days after ensiling. Short chop lengths increase early peak flow rates, as will the use of acid-based additives.
Silage clamps should have an effluent storage capacity of at least 2 days at peak flow rate, which increases rapidly with declining DM levels (Table 27).
Table 27. Effluent released from silage
Crop dry matter at ensiling (%) Expected effluent released
25 Little effluent
18 100 L/t DM/day at peak flow
15 200 L/t DM/day at peak flow
Collected effluent can be spread on land, but should be diluted with water to a ratio of 1:1 to reduce the risk of pollution and sward scorch. Aim for a rate of between 25 and 30 m3/ha and do not spread within 10 m of inland freshwater or 50 m of any water supply. In Nitrate Vulnerable Zones (NVZs), silage effluent must be treated as an organic manure, so closed periods must be followed.
For further information, see Government guidance on slurry storage.
Big bale silageWell-made big bale silage can be of similar quality and nutritional value to clamp silage, with similar costs. There are benefits to integrating baled silage with clamp silage.• Baling a small area of surplus grazing will provide
high-quality forage and will return one or two paddocks to the grazing rotation more quickly, ahead of the main aftermath area
• Having a stock of bales to buffer feed can remove the need to open a clamp and expose a slow-moving clamp face to aerobic spoilage in periods of low growth rates
• Bales of different quality can be made to target small groups of cattle (e.g. dry cows)
Good-quality big bales must meet the same criteria as good-quality clamp silage in the field. The higher DM – generally 35–45% to avoid bale distortion, which leads to air ingress – means that fermentation is more restricted so it is essential to speed up this process by using an additive to enhance speed of fermentation which will reduce the growth of undesirable microorganisms, improve nutrient preservation and aerobic stability.
Do not mix effluent with slurry in a confined area or in under-shed tanks because this will release toxic gases that are deadly to both humans and livestock.
It is vital to avoid soil contamination, which can introduce potentially damaging microorganisms into the bale.
84 Successful silage

Top tips for baling silage• Gather several swaths into a windrow for improved
baler performance
• Produce uniform box-shaped windrows matching the baler’s pick-up capacity
• Make firm, well-shaped bales that are easier to enclose and store
• Chop bales to maximise density. This will lead to improved fermentation and savings in baling, wrapping and transporting costs
• Wrap promptly, within a maximum of 12 hours of baling and close to the stack, rather than transporting wrapped bales from the field. This reduces physical damage and prevents soil compaction in the field
• Use six layers of wrap to improve sealing and protect from physical damage. IGER research has identified big increases in listeria contamination associated with uneven wrapping
• IGER research showed that it is important to set up the wrapper properly to cover the entire bale with the requested number of layers of wrap. A small region with one layer of wrap less significantly increased the levels of Listeria growing in the silage
• Using black wrap has been shown to be beneficial for UK conditions according to trials at IGER
Storage quality can be best ensured by:
• Storing bales on hard-standing within 24 hours of bailing (or as quickly as possible) and covering immediately
• Avoiding spear-type equipment to move bales, since taping over holes rarely produces a good seal
• Follow HSE guidance on stacking bales:- One bale high = < 25% DM- Two bales high = 25–35% DM- Three bales high = >35% DM
• Stack more than 10 m away from watercourses
• Controlling pests, especially rats, repairing any damage to bale wrap promptly and covering with netting to keep away birds and farm cats
• Identifying bales of different quality to feed to different classes of stock
Contamination of clamp and bale silageListeria thrive in soil and can be picked up at harvesting if the crop is cut too low, or there are many molehills in a field. It is also a particular problem of low DM, later-cut silage, which is more difficult to consolidate. These forages often have low sugar content, leading to poor fermentation and a high pH, which allows the bacteria to multiply throughout the bale or clamp – even at low temperatures.In cattle, silage eye (bovine iritis) can be caused by listeria infection. Healthy cattle are tolerant, but poor feed quality, cold, wet weather and transport stress can increase the risk of infection. Cattle affected by listeriosis tend to walk in circles. The disease also causes abortion in pregnant ewes and presents a risk to pregnant women.Silage can also become contaminated with Clostridium botulinum picked up from soil. If fermentation is poor, spores can germinate and produce the deadly toxin. Fields spread with poultry litter containing animal carcases are another serious risk.
Minimising silage lossesKeeping post-harvest losses to a minimum is key to maximising utilised silage DM production and reducing production costs. The wastage occurring between field and trough is often underestimated, yet total field, in-silo and effluent losses of between 20 and 30% are widely reported (see Figure 42).For further information, see our webinars Improving silage making and How to minimise losses during storage and feed-out of silage, both available on the AHDB Dairy YouTube channel.
Figure 42. Typical dry matter (DM) losses in silage-making Source: J Bax
20
16
12
8
4
015 3525 4520 4030
Crop DM at ensiling (%)
Loss
of D
M (%
)
Field – respiration, leaf shatter and leachingIn-silo – respiration and fermentationEffluent
Successful silage 85

Top tips for minimising losses• Wilt as efficiently as possible to minimise field
and effluent losses
• Improve preservation by cutting crops at the right stage
• Fill the clamp rapidly, spread silage evenly and consolidate well
• If silaging continues the next day, sheet down overnight
• Do not roll the following morning because this creates a vacuum and pulls more air into the silage – the aim is to get all of the air out
• Prevent soil contamination by cleaning tractor tyres before rolling. Keep tipping area clear of mud and manure
• Aim for 250 kg DM/m3 or 750 kg FM/m3. This will improve quality, reduce DM losses and aerobic spoilage at feed-out
• Do not overfill a clamp. Compaction above the walls is at least 10% lower than if the silage is level with the walls. Poor compaction increases silo losses both during storage and at feed-out
• Cover and seal it effectively to exclude air
• Ensure a rapid pH decline through a strong lactic fermentation
• Make big bale grass silage instead of clamped silage on smaller and more extensive units
Feeding out silage – keeping on trackWhen the clamp is airtight and a low, stable pH has been achieved, acidic conditions limit microorganism activity and their populations gradually decline. However, some microorganisms can remain active – particularly if pH is not low enough – and Clostridia and Bacilli can survive as spores.Aerobic spoilage starts as soon as the clamp is opened. The pH rises, heat is generated and yeasts degrade preserving acids, causing the proliferation of moulds that can produce harmful mycotoxins.For more information see our webinar on Reducing feed waste, available on the AHDB Dairy YouTube channel.
Clamp managementGood clamp management techniques can minimise aerobic spoilage and protect silage quality when the clamp is open (Figure 43).
• Use narrow clamps and, where possible, limit the number of clamps open at any one time to reduce the total area of exposed silage face. This is particularly important during warmer months, when aerobic spoilage is more rapid
• Ensure you move quickly across clamp faces to avoid aerobic spoilage. Aim to work across the face in 3–7 days and take the clamp face back by at least 2 m per week. The importance of this speed across the clamp varies according to consolidation, DM, fermentation, residual sugars and climatic conditions
• Pull back the top sheet to expose only the silage that is needed on a given day
• Keep a tight clamp face – use a shear grab and sharpen regularly
A well-managed clamp:
• Has a narrow pit 3–4 days across
• Has a shear-grab cut face
• Is sealed at edges
• Gives clean, stable silage
Figure 43. Example of well-managed clamp silage
Feeding managementReview your assessment of silage stocks every 3 months and analyse quality every month to match forage supplies with livestock requirements. Silage quality is variable within a clamp and changes over time, so rationing must be adjusted to account for the variability.
How much silage is available?For budgeting purposes, the amount of silage clamped can be easily calculated from clamp dimensions and silage DM using the AHDB Feed and forage calculator (Figure 44).To obtain the most accurate results for your farm, it is best to weigh 4–5 silage blocks from the pit using a weighing bridge or a mixer/feeding wagon. In a recent AHDB study, the silage density across 20 farms in GB was 292–805 kg FM/m3, demonstrating a wide range and the importance of weighing. For grass silage that is 28–32% DM, the minimum target for density is 750 kg/m3.
86 Successful silage

Assessing big bale silage stocks Silage destined for bales can be wilted to 35–45% DM. Drier crops are lighter, but are more prone to moulds and are used less efficiently by livestock. The weight of big bales varies widely (350–800 kg), so for an accurate assessment of quantity it is important to weigh a representative sample of bales to obtain an average. Weights will be affected from field to field, depending on DM, baler speed and settings and grass species.Factor in at least 8% DM in fermentation losses from each bale, between being wrapped and feeding. Effluent means that losses in wet bales may be even greater – up to 10%.Regularly estimating stocks throughout the season will allow forage supplies to be matched to livestock requirements as precisely as possible. Identifying a shortfall of silage at first cut means there is time to make it up with subsequent cuts, or extend the grazing season into autumn to reduce silage needs. Another option is to plan early for purchasing bulk feeds, such as brewers’ grains or pressed pulp, or sowing/buying alternative forage crops.
How many kg DM are available in baled silage?For round bales, the calculation is (no. bales x bale fresh weight (t) x DM %) / 100. As a guide: 5-ft wide round bales = 0.63 t FW 6 ft x 4 ft rectangle bale = 0.35 t FW. Weigh a sample of bales to obtain an average; wide variation in weight is common.
Interpreting silage analysisA basic laboratory analysis of silages will provide useful information about various nutritional parameters (ME, D-value, DM, CP, NDF and WSC), preservation (WSC, pH, ammonia, lactic acid, volatile fatty acids) and mineral profile.
Before planning winter rations, analyse silage quality to decide if supplementation is needed and, if so, what level is required. There are two types of analysis:1. Wet chemistry uses laboratory techniques to
analyse the sample.2. Near-infrared spectroscopy (NIRS) measures the
way light is absorbed and reflected to analyse the components of a sample.
If the amount of clover in a sample is greater than 30%, NIRS results for protein content may not be accurate. To obtain the protein content, ask for wet chemistry analysis.
Taking silage samplesIf feed-out management is poor, the silage at the clamp face can be very different from that in the cored silage sample. If this is the case, take more samples from the face at feed-out and adjust the ration accordingly. Poor sampling technique is one of the main causes of unreliable silage analysis results. Follow this guide to taking a representative sample:1. Wait until 6 weeks after clamping.2. Take several cores across the clamp at least
1.5 m deep, or from five bales of the same batch to make it representative. Sample different cuts and fields separately.
3. Pack into a polythene bag and squeeze air out before sealing tightly.
4. Send to laboratory early in the week.5. Give the laboratory as much information as
possible; for example, grass only, red clover, first or second, bale or clamp, additives used.
Figure 44. Grass silage stocksSource: AHDB Feed and forage calculator
PreservationNutritional
valueMineral profile
Silage quality
Length Height Width1 Clamp 1st cut 30 12 3 600 6482 Clamp 2nd and 3rd cut 30 12 2.8 600 6053 WC and maize 30 20 3.2 600 1152
TOTAL 2405
Clamp details (m)Tonnes (FW)Silage clamp
Density (kg FW per m3)
Successful silage 87

Understanding your silage analysis
Plan to make the silage the required quality for your different stock groups. If you are struggling to improve poor quality silage, it is very important to immediately identify the root causes and formulate an action plan to rectify them for the following year. Small steps can make big gains.
Table 28. Use of silage depending on quality
Good Moderate Low
DM (%) 28–32 26–34 <25 or >35
ME (MJ/kg DM) >11.5 10.5 10
D-value % >70 65 <58
CP (% DM) >16 and <18 14 <10
pH (will depend on DM and fermentation) >3 or <4.5 <4.5 <3 or >4.5
Ammonia N (% N) 4–6 7 >8
VFAs (g/kg DM) <20 20–40 >40
Lactic Acid (g/kg DM) 90–120 50–90 <5
Ash (%) 8 7 >10
NDF (%) 42–50 50–55 >55
88 Successful silage

What if it goes wrong?Poorly made silage has a noticeable, bad smell. Animals will not be keen to eat it and there will be a high degree of wastage. Some silages can be dangerous to feed (see Table 29).
Table 29. Troubleshooting your silage management
Problem Cause What to do in this situation
Rancid, fishy odour/slimy, sticky texture/olive green colour
High butyric acid level caused by:• Soil contamination • Late manure application • Low DM (<30%)• Poor consolidation• Poor sealing• Clostridium contamination
Take appropriate action to reduce soil and manure contamination and wilt to >30% DM next season
Review consolidation and clamp sealing
Avoid feeding silage contaminated with Clostridia to animals
Mouldy silage with a musty odour Presence of oxygen caused by:• Poor filling and sealing• High DM (>35%) • Poor management at feeding out
Discard mouldy silage to avoid negative impacts on animal productivity and health
Increase feed-out rate across the clamp to reduce further aerobic spoilage
Smells of vinegar Low DM silages that can result in acetic acid (vinegar) fermentation caused by high air levels and high levels of undesirable bacteria
Next time increase the % DM by rapid wilting and consider a silage additive that improves fermentation quality such as a chemical or homofermentative inoculant
Sweet-smelling silage High levels of ethanol produced by yeasts, enterobacteria and lactic acid bacteria
Revisit packing density and adjust if needed next year
Ammonia odour Caused by:• Excessive protein breakdown
to ammonia • Clostridial fermentation • High pH
Be careful when feeding. If the silage is butyric, be careful with rate of inclusion in the ration. If not butyric, be careful with level of non-protein-nitrogen (NPN) in a ration
Tobacco or burnt odour – looks dark brown/burnt and friable/grainy texture when rubbed between fingers
Caused by:• Poor consolidation• Excessive heating in first few
days after sealing • Too high pH• Not sheeting overnight when
filling takes longer than one day
Reduce DM content of silage and adjust chop length accordingly next year
Successful silage 89

90 Successful silage

92 Overview
93 Practicallimitationsandconsiderations
93 System-specificmethodsoffeeding
Feed delivery
Feed
delivery

Overview Feeding in the right way is just as important as what you are feeding, for many reasons – time saving, ensuring correct intakes and reducing waste, to name a few. This overview discusses the most common feeding systems.
Feed delivery
92 Overview
Unless the system can store, handle and utilise feeds effectively, much of its potential value is lost through wastage, excessive capital or operating costs.

Practical limitations and considerationsThe most appropriate feeding system for any herd depends upon:
• Production objectives
• Output potential
• Farm layout
• Labour availability
• Cow accommodation
• Feed storage facilities
• Diet formulation abilities
• Overall herd management priorities
Specific considerations include:• High genetic merit cows may require more
than two daily concentrate feeds to exploit their potential
• High constituent value milk requiring access to various feed ingredients to optimise milk constituent precursors, such as starch and digestible fibre
• Minimal labour availability requiring the simplest possible system and/or a single diet for all animals
• Buildings with limited access preventing large feeding machines from being used
• Poor feed storage facilities making the use of various feed ingredients difficult and costly
• Tenancy arrangements limiting the opportunity or incentive to invest
It is worth bearing in mind that those who treat and manage their cows as individuals, rather than as a herd, are likely to effectively operate systems that offer some way of feeding to yield, such as in parlour and/or out of parlour.
System-specific methods of feedingAs well as different grazing regimes, various systems have been developed to deliver individual feeds and mixes to dairy cows.
Other methods of feeding are discussed in Cut and carry – a best practice guide, available at ahdb.org.ukMany feeding methods can be used across different calving systems, but some are more suitable than others. Table 30 shows the different feeding systems.
Self-feed and easy-feedSelf-feed silage involves cows eating directly from the forage clamp, usually under the control of a barrier or electric wire set across the face to ensure even feeding.Easy-feed silage is an adaptation of this system, with silage pulled down from the face and fed behind a barrier set across the clamp. It is usually used with taller silage faces. In an easy-feed system, silage might also be cut from tall clamps and fed in ring feeders to help improve intakes, or for shy feeders and heifers.Beware that self-feed on a high clamp can become compacted, reducing intakes.
Key advantages for self-feedNo additional machinery is required and the labour input is confined to re-setting the feed barrier or wire and keeping the feeding area clean.Usually linked with parlour concentrate feeding, such systems are best suited to lower yielding herds.LimitationsSince cows can only reach a certain height, the depth of silage storage must be kept within this level, or silage above the effective feeding height must be removed mechanically (easy-feed).The silage face must be wide enough to give all cows sufficient access and the feed barrier re-set regularly to avoid restricting dry matter intakes (DMI).
The main advantage of self-feed and easy-feed silage systems is their simplicity.
Table 30. Feed options, from simple to complex, and suitability for calving systems
Feeding method All-year-round All-year-round, fully housed Autumn block Spring block
Self-feed
Easy-feed
In parlour
Out of parlour
Partial mixed ration
Total mixed ration
= suitable = unlikely = not suitable.
Feed delivery 93

Eight top tips for self-feed silage, by consultant Kay Carslaw
Silo management1. Approximate width of feed face per cow with
24-hour access: 22.5 cm for grass silage only; 17.5 cm for 50:50 grass and maize.
2. Height of face: for cows, 210 cm (if higher, shear-grab grass or pull down maize to this height each morning). For youngstock, 120–180 cm.
3. Silo width: any width and, with proper tension and level concrete, extra wire support can be avoided up to about 39 m. Wide silos can be filled sideways so that some of the silo space can be used twice by starting feeding (at 90°) from the side, until the day maize is harvested. From then on, self-feed both grass and maize from the front in the normal way.
Face management4. Type of barrier: use electric tape (narrow),
or – preferably – string with sprung handles, so the barrier can be moved live, with two pairs of screw-in insulators per clamp. The fencer should be on a low power setting.
5. Height of barrier: for cows, 80–85 cm; for youngstock, about 75 cm – except when they are first being trained to eat over it. Then, you may need to lower the tape (alternate sides) to just below the animal's brisket. All ages of stock should be trained to self-feed over, as well as under, the tape just as they can be trained to graze pasture properly. For wider silos, attach the fence at 87.5–92.5 cm.
6. Distance of barrier from feed face: ad-lib grass silage feeding for cows is achieved by moving the tape, preferably just once in the afternoon, to 47.5–52.5 cm from the face (for maize 62.5–75 cm). Do not move the tape closer to the face, or there will be overhangs, waste and unnecessary work with no intake benefits.
Tidiness7. Top sheet management: cut off the plastic
every few days so it always overhangs the silage by at least 30 cm to shed rain away from the feed face. Keep one complete row of tyres along the front to hold the sheet down. Use heavy silage covers and gravel bags instead of tyres for the rest of the silo. Do not try to make cattle self-feed through any water cones in grass silage (caused by rain running in at the sides, or through a hole in the top sheet) because they will not do it. Shear or fork the cone down and then they might.
8. Yard routine: if any silage needs to be pulled or cut down, do it in the morning, with the wire moved at least 1 m back from the face, so that it is all eaten by the time of the regular move forward later in the day. Fence off empty silo space as it expands during the winter to save scraping. Get a large yard scraper, which scrapes, rather than a small one, which smears. Then get a slurry ramp extension so you can always scrape forwards – this can save up to one-third of your scraping time.
Silage clamps must be close to cow accommodation and constructed to ensure that slurry flows away from the feed face.As cows work their way through the clamp and the face moves back, the area to be scraped gets bigger. This can be fenced off to reduce the scraping area.There is more yard area to be contaminated, which turns rain into dirty water. Therefore, good storage for effluent is needed.
Overhead cost implicationsThe capital cost of self-feeding and easy-feeding is generally minimal, being confined to gating and feed barriers or wire. However, the layout of the unit must be carefully planned to ensure good cow movement between silage clamp and cow accommodation. Generally, roofed clamps are valuable to minimise rainwater adding to slurry volumes.The systems allow machinery and labour costs to be kept to a minimum, although they are not suited to high-output businesses.
FEED FACE22.5 m for 120 cows eating grass silage
Any silage above here will need to
be taken
Height of face2.1 m for cows
94 Feed delivery
Most common mistakes with self-feed:• Fencer power too high
• Barrier wire too low or too close to the feed face
• Insufficient sheet overhang and too many tyres, or sheet removed from near the face too soon
In-parlour feedingThe simplest way to provide accurate daily allocations of concentrates to individual cows is in the parlour. However, on most units, this can be combined with total mixed ration (TMR) feeding or out-of-parlour feeders to spread concentrate feeding across the day.Key advantagesApart from being simple, parlour feeding enables individual feeding with considerable accuracy according to performance or need, especially when linked to computerised yield recording systems.For parlours without backing gates, parlour feeding is valuable for ensuring a smooth flow of cows into the parlour with minimum labour input. In this respect, it is essential in automatic milking systems (AMS).Main limitationsMost parlour feeders can only accurately dispense pelleted feeds, confining concentrate feeding to proprietary dairy cakes, which tends to mean higher concentrate costs.Parlour feeding can make it more difficult to get cows out of the parlour and may be dusty.Parlour feeders need regular calibration to ensure accuracy and many modern systems will not operate in the event of component failures.Maintenance is key to avoid unnecessary wastage of feed.Fixed cost implicationsWhile parlour feeders undoubtedly save labour costs, they can add considerable cost to a parlour and, unless they are simple batch feeders with low maintenance costs and demands, they require good maintenance for accurate and reliable functioning.
Out-of-parlour feeders (OOPF)Out-of-parlour feeding systems offer the ultimate in automated concentrate allocation to individual cows by using electronic collar identification.Key advantagesThey can be programmed to deliver specific feed to each cow in small amounts throughout the day, linked to parlour feeding and yield recording in the most sophisticated computerised systems.Providing there are sufficient feed stations and they are well sited within the cow accommodation, OOPF can reliably support large herds with highly individual feeding.
LimitationsApart from the substantial capital cost, the main limitation of out-of-parlour feeders is that they only tend to accurately and reliably dispense pellets, thus forcing all concentrate feeding to be based on relatively expensive dairy cake.Insufficient numbers of feeding stations and poor siting in narrowly accessed ways can mean some cows or heifers fail to eat concentrates because they are bullied or obstructed by other cows.If cows are fed through OOPF, they may need to spend more time on concrete, with more slurry being generated.Maintenance is key to avoid unnecessary waste of feed.Overhead cost implicationsOOPFs need storage bins and conveyors to keep them topped-up and all cows need electronic collars to use them.However, once the system is set up, it can offer valuable labour savings over other ways of feeding concentrates outside the parlour.Regular monitoring, maintenance and calibration are essential to ensure smooth and accurate operation.If some feed is already being provided through a forage box or mixer wagon, the labour savings will be less apparent.
Total mixed ration (TMR) and partial mixed ration (PMR)A step up from forage box feeding is to use a mixer wagon to feed cows all (TMR) or the majority of their diet (PMR) in a thorough mixture along a feed passage, barrier or trough.In most cases, TMR (in which no other feeds are fed separately) has given way to more flexible systems, involving base diets topped-up with additional concentrates to individual animals, or groups as required.Key advantagesThorough mixing of forage and concentrates in a single ration maximises DMI and optimises rumen fermentation. It does this by avoiding the swings in pH and microbial activity resulting from separately feeding different ration components.TMR also offers the greatest possible flexibility in the number and types of feed ingredients that can be utilised.LimitationsWhile offering the greatest feed flexibility, mixer wagons are costly and can overcomplicate a feeding system, giving more room for error in day-to-day operation. If not correctly operated, they can also lead to under- or overmixing problems.An AHDB-funded study carried out on 50 farms revealed that 58% of the herds had poorly mixed
Feed delivery 95

rations and 66% had diet selection. The webinar Theroleoffibreonthedairycow, available on the AHDB Dairy YouTube channel, provides more information.Where facilities are insufficient to adequately group cows by stage of lactation and performance, complete diet feeding has also been found to pose individual under- and overfeeding problems. Issues can also arise with a herd of mixed cow types: for example, feeding extreme Holsteins and traditional Friesians with the same diet may lead to wider variability in body condition because of differences in their metabolism and requirements.Overhead cost implicationsA mixer wagon typically costs £15,000–30,000 (£3,000–15,000 second-hand) and, like a forage box, requires a loader, as well as a towing tractor. It also demands secure, weatherproof, bird and rodent-free storage for feed ingredients.As well as machinery purchase and maintenance, mixer wagon feeding requires more labour than with forage boxes and sufficient time must be set aside for diet formulation.Parlour feeders are not required with TMR regimes, which reduces both capital and maintenance costs.
Mixing systemsThe choice of mixing system largely depends on how much flexibility is required in forage handling. A vertical auger may be preferable if whole bales are to be used on a regular basis, whereas any system will be suitable if predominantly clamp silage is used.Different types of machines discharge at different heights – some with just a slide tray from a high discharge point, others with a height-adjustable conveyor from a low discharge point.Depending on a farm’s trough design, discharge height could well be more important when considering wagon suitability than mixer type.As mixer wagons are large, cumbersome pieces of equipment, the overall length and turning circle must be considered, as well as the height required for building access.Key considerations when buying a mixer wagon include the:
• Method of mixing and discharge
• Height of machine in relation to buildings
• Height of discharge in relation to feeding facilities
• Chopping ability
• Size of machine in relation to herd and group size
• Maintenance costs and depreciation of the whole system
Common mixing systemsVertical augerOne or two vertical cone-shaped augers, which mix by moving feed vertically around the auger and dropping it to the outside of the box. These can chop whole bales of straw, hay or silage quickly and effectively, with the degree of chopping controlled via retractable knives or movable wedges around the side of the tub. They are probably the most versatile type of mixer, but tend to cost more.Horizontal augerTwo or four augers, which mix by moving feed up and down the length of the box. These mix thoroughly and have knives available to chop feed. However, they do not tend to handle whole bales well.Paddle augerA variety of paddle arrangements, which mix by tumbling the feed around the box. Machines with straight paddles tend not to mix well from end to end, but provided feeds are added to the wagon thoughtfully, a good mix can be achieved. Some newer models have split paddles that mix more thoroughly. Knives can be included on the paddles to chop bales, but most models do not handle whole bales. Some models have a tendency for wet silage to form into fist-sized balls, rather than mix evenly.
Diet feeder mixingThe aim of diet feeder mixing is to provide a consistent mix of feeds with minimal sorting by the cow. A feeding protocol will help ensure consistency if you have more than one person feeding.The protocol will vary depending on the type of machine being used and the feeds in the mix.Straw is often included in feed mixes to provide long fibre, but cows can easily sort poorly chopped straw and it ends up being wasted. Pre-chopping straw to a consistent length, about the size of a 50p coin, reduces cow sorting and waste.Chopping can involve a contractor with a tub grinder, which reduces mixing time and waste, but will come with a cost. The chopped straw must also be stored. Compact feeding is a relatively new technique developed in Denmark. The aim is to reduce selection by adding water to make the diet wetter and to mix for longer. This allows all cows in the group to access the same diet throughout the day. The EuroDairy webinar Compact TMR for improved feed efficiency provides further details on this way of feeding and is available on the their YouTube channel.
96 Feed delivery

98 Overview
99 Monitoringdailyfeedrecords
99 Feedusemonitoring
100 Lactationmonitoring
Feed performance monitoring
Feed
perform
ance
mon
itorin
g

Overview As well as demonstrating full traceability, good feed records are invaluable for investigating nutritional links to production, fertility or health records.They can also be useful for tracking value for money in feed purchasing and for comparing current volumes, values or quotes from previous suppliers.
Feed performance monitoring
98 Overview

Monitoring daily feed recordsFor purchased feed ingredients, records should include:• Feed description (with analysis, if available)• Date of supply• Fresh weight• Load/batch reference (if available)• Supplier name and address• Feeding period (dates)• CostMost of this information is available from feed delivery notes and invoices.For home-grown feeds, records should include:
• Feed description (with analysis)
• Observations about preservation/physical quality
• Fresh weight (approximate)
• Reference to field sources (if required for management improvement)
• Feeding period (dates)
• Cost (it is important to calculate these as accurately as possible rather than to estimate)
For rations, the minimum requirement is to keep a record of the quantity of feeds given to each group of stock.However, supporting information, such as silage analyses or computer print-outs with nutrient breakdowns, should also be kept.Home-mixing records should include the dates of mixing, the ingredients and the quantities mixed.
Target diet and operator instructionsThe target diet should be available and is often needed for dairy audit purposes. An example diet is shown in Table 31.The target diet is for maintenance +33 litres, which must then be communicated to the feed operator, as shown in Table 31.
The operator can vary the load size depending on how many cows are in the group. If the amount fed varies from the target diet by more than 5%, this should be reported back to the feed adviser for ration adjustment. A wagon with electronic scales can check accuracy.
Feed use monitoring For all-year-round calving herdsA simple check to monitor feed use is to calculate the feed rate per litre on a daily basis. For example, suppose the farm sold 6,000 litres of milk yesterday and discarded 100 litres: the feed rate in Table 32 is 0.34 kg/L at a feed cost of 7.5 ppl.
Table 32. The Dairy Group daily purchased feed cost calculator
Milk sold (L) 6,000
Milk discarded (L) 100
Milk produced (L) 6,100
Purchased feed (ppl) 7.5
Amount fed Feed costs
kg p/kg £/day
Parlour compound 500 22.5 112.50
Rapeseed meal 800 24 192
Sugar beet pulp 800 19 152
Total 2,100 456.50
Feed rate (kg/L) 0.34
When monitoring feed use, it is important to compare values against farm targets and to review them in line with your whole farm budget.
It is important to monitor daily purchased feed use. Waiting until the end of the month or the next feed order is too late.
Table 31. Example of breakdown ration (targeted at M+33) for feed operator
Awaiting advice on this table
Number of cows
TOTAL Chopped Straw
Rapeseed meal
Sugar beet pulp PDV Salt Limestone
flour Urea Sodium bicarb Mineral Maize
Silage Grass silage
55.35 0.5 2.5 4.8 0.05 0.05 0.15 0.2 0.1 21 26kg/head/day
100 5,535 50 250 480 5 5 15 20 10 2,100 2,600110 6,089 55 275 528 6 6 17 22 11 2,310 2,860115 6,365 58 288 552 6 6 17 23 12 2,415 2,990120 6,642 60 300 576 6 6 18 24 12 2,520 3,120125 6,919 63 313 600 6 6 19 25 13 2,625 3,250130 7,196 65 325 624 7 7 20 26 13 2,730 3,380135 7,472 68 338 648 7 7 20 27 14 2,835 3,510140 7,749 70 350 672 7 7 21 28 14 2,940 3,640145 8,026 73 363 696 7 7 22 29 15 3,045 3,770150 8,303 75 375 720 8 8 23 30 15 3,150 3,900
Source: The Dairy Group
Feed performance monitoring 99

Lactation monitoringCow performance and dietary sufficiency can be monitored through:• Milk output, yield and composition – is the
expected daily milk yield being achieved?
• Feed intake – are cows eating the planned diet? This is much easier for cows eating a total mixed ration (TMR) or partial mixed ration (PMR) diet. For grazing cows, a guide to intakes can be estimated by using a plate meter
• Regular body condition scoring (BCS)
• Rumen fill and dung characteristics
• Health and fertility indicators, such as the occurrence of metabolic diseases or timing of first bulling, post calving
• Metabolic profiling – this is not routinely used, but in certain situations it is valuable for detecting and preventing metabolic imbalances
Monitoring milk quality and outputMilk quality and yield are the first things to be affected by the diet, whether positively or negatively. Therefore, they are the most important elements of performance to be monitored.Bulk milk collectionDaily bulk milk collection is the simplest and most immediately available measure of yield. It can be very useful as an immediate indicator of improvement or difficulty.However, changes in herd milk production must be interpreted with care because they can be disproportionately affected by the performance of a few animals, or one particular group.Bulk milk collection will, of course, also be affected by several non-feeding factors, including the number of cows, the weather, other management changes and large numbers of bulling cows. It also excludes the amount of milk that is not sold but is instead fed to calves or discarded.Individual milk recordsIndividual records of milk production, whether obtained through daily measurements or official milk recording, are more valuable tools for performance monitoring.They are not only essential for feeding to yield in the most accurate way, but they can also offer many other benefits for management, such as somatic cell count (SCC) and dry cow therapy selection, Johne’s disease control programmes and breeding decisions.
Lactation curves plotted for individuals or groups of animals illustrate their performance (Figure 45).
Figure 45. Typical lactation curve plots for autumn calvers
Recording dataIf milk yields are not as expected, it is advisable to check whether or not:
• Feed intakes are as expected
• The diet is adequately balanced
• Feed ingredient analyses remain accurate
• Cows are grouped correctly
• The calving pattern has changed
• There have been greater or fewer calvings than planned in the past 3 months
• More cows have been dried off
• Milk withheld from the bulk tank has not been accounted for
Milk constituentsButterfat and protein levels are valuable indicators of whether or not a diet is up to scratch.Low milk proteins may result from:
• Imbalanced nutrition – low dietary energy levels, inadequate dietary protein
• Poor nutrition during autumn grazing
• Low body condition or excessive weight loss
• High yields in early lactationLow butterfat levels may result from:
• Poor forage intakes
• Poor forage quality
• Low dietary fibre levels
• Low fibre levels in spring grass
• Clinical or subclinical rumen acidosis
• High yields in early lactation
• High dietary oil levels or high inclusion of sources of polyunsaturated fatty acids, especially in low-fibre diets
Individual milk recording flags changes in specific cows, or in particular groups. It allows dietary effects to be separated from non-feeding factors far more accurately than bulk milk records.
45
40
35
30
25
20
15
Recording monthOct Feb
Heifer target Heifer yield Cow target Cow yield
JunDec Apr AugNov Mar JulJan May Sep
Daily
yie
ld (l
itres
)
100 Feed performance monitoring

Milk ureaMilk urea levels are available on most daily test reports from milk buyers. They can provide a useful indication of the efficiency of rumen protein utilisation.The normal range is 0.020–0.035%, with higher levels normally seen when cows are turned out at pasture on high-protein grass.However, these results must be interpreted carefully: levels reflect an interrelationship between energy and protein metabolism, so can mean different things under different conditions. It is also important to continually monitor urea levels to detect and tackle significant shifts from the herd’s average levels.Expert adviceExpert advice is particularly valuable when the diet needs to undergo major changes, such as moving from one forage to another, at turnout, or when performance falls below expectation.Nutritional advice comes in various forms, with varying degrees of commercial independence.The best advice invariably comes from professionals who:
• Have a good practical knowledge of feeding cows
• Understand the herd’s requirements, limits and feeding resources
• Are able to relate feed costs to milk value and understand the variation in value of fat and protein between different milk contracts
You can also ask if the adviser is registered with the Feed Adviser Register (FAR) and check their status on the FAR website (feedadviserregister.org.uk).For health-related problems, veterinary advice is always required. The vet, herd manager and nutritionist should meet regularly to review progress, assess problems and agree forward plans.Good expert feeding advice should include:
• A review of the existing diet
• A check of feed analyses
• An examination of milk records
• An assessment of cow body condition
• An assessment of dung consistency
• A general appraisal of herd health
Feed performance monitoring 101

102 Feed performance monitoring

104 Overview
105 Whatisbodyconditionscoring(BCS)?
105 Bodyconditionscoring(BCS)targetsfor all-year-round(AYR)calvingherds
106 Bodyconditionscoring(BCS)targetsfor block-calvingherds
Body condition scoring
Body
con
ditio
n
scor
ing

Overview To be able to manage something effectively, you must measure it reliably, so you can monitor change and detect at an early stage whether or not things are going to plan.Routine scoring is key so that body condition score (BCS) trends can be monitored to identify problems earlier – the change in BCS is more important than the score itself.
Body condition scoring
104 Overview
Change in BCS is more important than the absolute value; therefore, scoring should be done regularly.

What is body condition scoring (BCS)?BCS is a practical means of assessing the impact of negative energy balance (NEB) in early lactation. It provides a standardised measure of a cow’s energy and protein reserves.It is an assessment of the amount of fat and muscle covering a cow’s bones, regardless of breed or body size. It is not affected by gut fill or pregnancy (unlike liveweight).Ideal body condition falls within a range and depends on the stage of lactation. Dry cows need sufficient body reserves to support early lactation milk production when energy intake lags energy output in milk. However, fatter, dry cows lose more body condition and have lower dry matter intakes (DMIs). Fat cows are also at more risk of metabolic problems after calving. For these reasons, overconditioning should be avoided. Reasonable body condition at calving would be that which provides enough reserves without depressing intake. Cows will lose body condition in early lactation.In GB, BCS is assessed on a five-point scale, with increments of 0.25. The scale is applied to specific areas of the cow to determine how thin or fat she is. The BCS system concentrates on determining scores between 2.0 and 4.0 because these are the most critical for management decisions.Scores outside of these values are extreme: a score below 2.0 indicates a seriously underconditioned cow that requires immediate attention, whereas cows with a score of 4.0 or more require controlled weight loss.Scorers using this system will be able to assign BCS consistently and accurately. It can also highlight previous levels of feeding, probable future productivity and future feed requirements.
There are several AHDB support tools to help you measure and monitor BCS, including:
• Laminated visual aid
• Score pad
• Online quizThese resources can be found at ahdb.org.uk
Body condition scoring (BCS) targets for all-year-round (AYR) calving herds
How many cows do I need to score? It is important to score a representative sample of the cows in your herd. For smaller, AYR herds in which there are few cows in a given category, this can be difficult – especially in the transition group.
Table 33. When to score all-year-round calving herds
When to score Why Target body condition score (BCS)
At calving
To check whether a consistent BCS has been maintained during the dry period
To review whether diet changes need to be made during the dry period
2.5–3.0
60 days post-calvingTo check for excessive BCS loss
To show whether the diet needs reviewing, or if lactation management needs changing to prevent this
2.25
100 days pre-drying offTo check whether specific management must be applied to groups, or individual outliers to ensure correct BCS at drying off
2.5–3.0
At drying off To assess whether cows are meeting the desired BCS profile 2.5–3.0
Scoring animals at critical timepoints builds an accurate picture of condition score change across lactation – even in the smallest herds.
Body condition scoring 105

Body condition scoring (BCS) targets for block-calving herdsFor block-calving herds, achieving optimum calving BCS is the most important factor for future production and fertility.To improve herd reproductive performance in a block system, it is useful to conduct body condition scoring at five points during the fertility cycle.Body condition scoring across the year accounts for seasonal variations in cow demand and feed supply.
Change in body condition score across the dry period can negatively affect the incidence of transition diseases. Aim to dry all cows off in the body condition that is optimal for calving.
Table 34. When to score block-calving herds
When to score Why Target body condition score (BCS)
8–10 weeks before drying off
To check whether cows are on track to dry off at the correct BCS target
To adjust the diet to increase/decrease BCS if needed2.5–3.0
At drying off To check whether cows have achieved the desired BCS profile and manage outliers appropriately 2.5–3.0
Just before calvingTo check whether cows have maintained a consistent BCS across the dry period
To help assess dry cow diets and adjust if necessary2.5–3.0
2 weeks before planned start of mating
To check for excessive loss in BCS since calving and to determine whether diets need adjusting 2.0–2.5
3 weeks after mating starts
To check whether cows are gaining body condition
To determine whether the diet is appropriate2.0–2.5
106 Body condition scoring

108 Overview
109 Keypointsfortransitionmanagement
109 Earlylactationtargets
109 Minimisingnegativeenergybalance
111 Close-upnutritionalrequirements
113 Monitoringintakes
114 Forageinthedrycowdiet
114 Mineralsfortransition
114 Effectsoftransitiononthecalf
Dry cow and early lactation feeding
Drycow
and
early
lactationfeed
ing

Overview The transition period includes the last 3 weeks before calving and the first 3 weeks after calving. At this time, the cow can face huge challenges and changes, as well as increasing nutritional requirements.
Far off dry period
Close-up dry period
Fresh/early lactation
-60 -21 21 days days days
Dry cow and early lactation feeding
108 Overview
Correct nutrition management during transition is essential to prevent a breakdown in the complex chain of events around calving. It also ensures a successful start to lactation.
Calving0

Key points for transition management• Estimate the requirements needed across each
stage of transition
• After calving, meet the cow’s high demand for energy and avoid excessive weight loss by supplementary feeding when necessary
• Ensure that the formulated diet is fed and eaten
• Monitor feed use and performance
• Optimise concentrate input, taking into account the diminished response from additional concentrates
Checklist• Body condition score (BCS) your herd regularly
and consistently (see: Body condition scoring, page 107) to monitor variability in condition across the dry period and into peak lactation
• Ensure cows are not overconditioned or underconditioned at calving
• Minimise the risk of negative energy balance (see page 110) by identifying potential factors affecting your herd
• Assess mineral levels, sources and method of feeding and identify any actions that could prevent issues during transition
Early lactation targets
Production• Time to peak milk yield – 50–60 days. Earlier
peaks with poor persistency can indicate excessive negative energy balance in early lactation
• Peak milk yield – heifers should achieve 75% peak milk yield, or higher, relative to mature cows
• Lactation persistency – cows should decline at less than 9% of milk yield per month after the peak. Heifers have flatter lactation curves and should decline at no more than 6% per month
• Use monthly milk recordings to assess milk constituents. In herds yielding over 7,000 litres, cows less than 50 days in milk should produce more than 1 kg/day of protein. High milk fat levels (around 5.5%) in the first month of lactation can suggest excessive body fat mobilisation
Herd health at early lactationBelow are the acceptable targets for incidence of key metabolic and uterine diseases.
• Retained fetal membranes (RFM) – less than 5%
• Abnormal vaginal discharge – less than 10%
• Left displaced abomasum (LDA) – - 0% incidence for herds yielding less than
8,000 litres- <2% for herds yielding 8–10,000 litres- <3% for herds yielding more than 10,000 litres
• Ketosis – less than 3% clinical; less than 15% subclinical (blood or milk sample diagnosis)
• Grass staggers (hypomagnesaemia) – less than 1%*
*Acute, clinical cases. See the Hypomagnesaemia factsheet at ahdb.org.uk/knowledge-library/hypomagnesaemia for further information. Please find information for other Herd health factsheets on page 110.
Minimising negative energy balanceNegative energy balance (NEB) occurs when a cow does not consume enough energy to meet her daily energy requirement. Managing negative nutrient balance is key to the success of the transition period.
All dairy cows in transition will encounter negative energy balance, but the extent of the negative energy balance is important. The aim is to try and minimise it.
Target heifer yield
(% mature yield) 75%
Dry cow and early lactation feeding 109

What causes NEB? A cow is in NEB when her feed intake is insufficient to support the energy demand for milk production and maintenance. NEB can last for several weeks, as cow’s appetite takes longer to peak than daily milk yield. Fresh cows normally have low dry matter intakes (DMI) because of their physiological status after calving. DMI gradually increases in the weeks following calving, but several factors can compromise this recovery.
Six factors affecting NEB1. Transition cow diseases, such as milk fever,
ketosis, metritis and retained placentas reduce DMI, as do lameness and mastitis.
2. Poor feed access limits time or space for cows to eat, reducing DMI.
3. Pain, fear and other stressors. This is particularly important for heifers in a new environment (see the AHDB InCalf guides for AYR and block-calving herds for further information on transition management).
4. Insufficient nutrient (especially energy) density of the diet.
5. Poor rumen adaptation to the milking diet.6. Poor palatability of the milking cow ration.
Consequences of NEBA NEB in early lactation leads to body condition loss as cows utilise body resources (fat and muscle) to compensate for insufficient energy in their diet. Excessive body condition loss has detrimental effects on cows’ health and fertility; for example, delayed first oestrus after calving and lower conception rates.
NEB and loss of body condition can negatively affect reproductive performance, irrespective of the yield of the herd.
How to avoid excessive body condition loss in transitionUnderfeeding transition cows leads to excessive fat mobilisation, which is usually detected through body condition scoring (BCS). Avoid excessive body condition loss after calving by:
• Calving cows down in the BCS range 2.5–3.0. This is a key determinant for managing BCS loss and NEB. Optimal BCS at calving depends on close monitoring and management during the whole lactation cycle. This will influence the extent and severity of fat mobilisation and BCS loss across the herd
• Maximising the intake of an energy-dense milking cow diet with an appropriate level of protein. This allows cows to eat as much as their appetite allows (ad libitum)
• Effectively managing pre-calving transition feeding for good rumen adaption and minimal reduction in DMI
• Avoiding feeding rations with too high energy density throughout the dry period. This is a greater risk with single group dry cow diets and cows with prolonged dry periods
See our herd health factsheets for further information on:
• Negative energy balance and ketosis
• Milk fever
• Displaced abomasum
• Hypomagnesaemia (grass staggers)
• Retained foetal membranes
• Uterine infections - metritis and endometritisNegative energy balance is related to feed intake more than milk production.
110 Dry cow and early lactation feeding

All-year-round (AYR) group feeding strategiesDecide whether you will have two groups for far-off and close-up, or one group for the whole dry period. The AHDB InCalf Calving management chapter contains detailed information and examples of how you can establish stable calving groups for transition cows in an AYR herd.Two groups:
• Allows more focus to cows approaching calving
• Enables recently dried-off cows to graze relatively distant pastures
• Minimises costs associated with dietary cation–anion balance (DCAB) feeding, which is fed only to the close-up group
A single dry-cow group:
• Enables a single basal forage diet to be fed throughout the dry period
• Reduces the time involved sorting cows between groups
• Minimises social stress caused by group changes
Whatever system is used, the gold standard is for cows to be fed twice a day – although once may be acceptable. Feeding every other day should only be used for dry rations, such as hay and dry cow rolls – especially when the risk of feed spoilage is high (e.g. in summer).General considerations• Whichever strategy you choose, it is important
to maintain DMI throughout the dry period. Ideally, average intakes should be around 12–13 kg DM/day
• During the far-off period, the metabolisable energy (ME) requirements for a 600 kg cow are approximately 90 MJ/day, increasing to 120–130 MJ/day in the last 3 weeks of pregnancy (close-up)
• The main goal is to avoid underfeeding and overfeeding, regardless of the feeding strategy you choose
• Dry cow diets should be high in fibre from forage (neutral detergent fibre [NDF] content 45–55% in the far-off group, 40–45% in the close-up)
• Aim for a minimum of 1,200 g/day of metabolisable protein
Nutritional considerationsDo not feed unnecessary fat supplements. If necessary, feeding propylene glycol or glycerol can reduce fat mobilisation in transition.Consider supplementing the diet with protected choline, methionine and biotin. These have demonstrated positive effects on liver functionality; for example, fat and glucose metabolism.Speak with your vet for alternative options to support individual animals with issues such as:
• BCS of 3.5 or more
• Considerable lameness issue
• Previous high incidence of metabolic disease
• Heifers calving down over 27 months of age
AYR two dry cow groups feeding exampleOn a grass silage-based system, be cautious of proper metabolic transition. This is because grass silages have higher mineral contents (for example, of potassium) than maize silage. Below are two examples; one of a far-off diet and one of a close-up diet.Both groups are fed the same basal ration so they still have a consistent mix when there are fewer cows in the close-up transition group.Far-off dry group:• 18 kg fourth cut grass silage (19% protein)
• 6.5 kg chopped wheat straw
• 0.5 kg milking cow blend
• 3 kg moist feed
• 0.2 kg dry cow minerals
Close-up transition:• 18 kg fourth cut grass silage
• 6.5 kg chopped wheat straw
• 0.5 kg milking cow blend
• 3 kg moist feed
• 0.2 kg dry cow minerals
• 2.5 kg dry cow nuts with calcium binder
AYR HERDS
Close-up nutritional requirements
Dry cow and early lactation feeding 111

Autumn block calvingIn this system, cows are calved in a 12-week block between August and November.Cows can calve at pasture, be housed after calving, or continue to graze and move toward housing at the end of the calving block.These decisions depend on:
• Availability of grazing
• Quantity of conserved forage
• Infrastructure and machinery for feeding
• Quality of housing
• Weather and soil typeTransition management in autumn block-calving herds can be achieved in several ways:
• Grazing requires high management standards during peak spring growth when cows are in the tail end of lactation, or are dry
• Dry cows must be grazed tightly to avoid excessive BCS gain during the dry period (on stemmy seeded grassland)
• Additional high-quality straw can be provided to achieve an average intake of at least 3 kg/day straw
• Dry cow minerals and/or magnesium chloride should be provided and included in the diet
• Feeding may require additional supplementation, such as from silage or concentrates
In higher yielding autumn-calving herds, it is appropriate to house dry and transition cows using the strategies described earlier for year-round calving herds – particularly if early lactation cows are housed.If the appropriate infrastructure and equipment are available, total mixed rations (TMR) can be used by autumn block systems aiming for higher outputs.
BLOCK HERDS Spring block calving
This system focuses on calving from February to May.Spring block herds require high grazing management standards during spring growth.Concentrates• May be necessary if fed post-calving to
transition the rumen
• Can be used to help DMI with early season grass variability, as well as silage
• Supply macro- and microminerals and help control milk fever
• Can be used to avoid tetany or milk fever by using magnesium chloride in water to supply magnesium
Control of metabolic disease in block-calving herdsControlling milk fever and managing energy balance is challenging in herds in which both dry and transition cows graze.Normal grazed grass is typically too high in potassium and calcium, low in magnesium and contains excessive energy to be suitable as a sole feed for calving cows. For far-off dry cows, appropriate management consists of controlling BCS and providing additional fibre to maintain rumen fill.In situations in which cows dry off in less than optimal body condition, they will need to gain condition in the early dry period to maximise production and fertility in the subsequent lactation. However, this will still negatively affect energy metabolism in early lactation and can lead to increased incidence of ketosis.See herd health factsheets on Milk fever and Ketosis for further detail.
BLOCK HERDS
112 Dry cow and early lactation feeding

Monitoring intakesFeeding levels during far-off and close-up dry periods can affect early lactation performance: overfeeding can be just as, if not more, harmful than underfeeding.Prepare a feed budget and analyse forage to ensure you have enough good-quality forage and feeds based on the estimated quantities needed. Appropriate dry matter requirements are shown in Table 35. For cows in the transition period, feed intakes should be monitored and reviewed weekly. Regular assessments of weigh backs of delivered ration and formulated ration (DM content) will allow relatively accurate assessment of DMI.
Table 35. Estimated dry matter intakes (DMIs) at different stages of transition
Estimated dry matter intakes
Date Number of cows Total fed (kg)
Waste (kg)
Eaten (kg)
Diet DM (%)
DM/cow (kg DM)
Early dry group
9 Jan 2019 60 1,935 120 1,815 43 13.0
10 Jan 2019 55 1,805 105 1,700 43 13.3
Close up group
9 Jan 2019 50 1,550 100 1,450 47.91 13.9
10 Jan 2019 55 1,650 130 1,520 47.91 13.2
Table 36. Feeding observations
Observation Targets and indicators
When done properly, rumen fill is a very good indicator of DMI. Dry and transition cows should be assessed daily, with formal scoring once a week. Use our rumen fill scorecard to ensure scoring consistency
Aim for a score of 4–5 in dry cows and score 3 in early lactation, according to the AHDB Rumen scorecard. This can be used as a marker for DMI
At least 85% of the assessed transition group should be within a defined target for their stage of lactation
See our Rumen fill scorecard for further details
Dung score: monitor dung appearance closely. Far-off dry cows, especially those at grass, should be monitored too
Dung should be quite stiff and about 5 cm high. There should be very little variation among the herd on the same diet
Dung should be firmer in dry cows than in milking cows and be well digested
Observe rumination in early lactation cows at least weekly – this could be done when assessing rumen fill
At least 50% of fresh cows that are not eating or drinking when watched should be ruminating at any point in time
Ration sorting means that every cow eats a different ration and no cows eat the formulated ration. Ensuring TMR is mixed well to prevent sorting is particularly important for high straw dry cow rations
Use the Penn State particle separator to help identify any sorting between feed-out and later assessments
There should be no long (i.e. >10 cm) fibre left in the feed passage
Straw chop length to the size of a 50p coin
Identify holes in the ration (known as ‘bird’s nests’)
Feed fractions distribution should be as consistent as possible between feed delivery and later assessments
Dry cow and early lactation feeding 113

Ration consistencyRegularly assessing ration consistency and sorting can be done using a Penn State particle separator. This tool estimates the quantity (%) of a forage or TMR that provides physically effective fibre to the dairy cow.Full details of calculations, weights and guidelines can be found on the Penn State Extension website.You can also see our webinar, The role of functional fibreinthedairycow, which is available on the AHDB Dairy YouTube channel.
Feeding managementMany aspects of feeding can affect production. The tips below can also act as a checklist – discuss these points with your nutritionist to identify priority areas for you to improve.Work on a few areas first – and get these right – before moving on to different ones. It is much easier to focus on one or two action points at a time than try and do them all at once. You will also be able to more clearly see the impact of each improvement, which can be motivating.
Forage in the dry cow dietThe low use of concentrates and high forage intake of a dry cow means that maintaining rumen health across the dry period should be easy.Consider using later cut hay/haylage (also known as fibrous big bale silage) from pasture, or standing hay that has had no slurry applied (or potash if using a DCAB-based milk fever control method).This can provide a palatable, relatively low energy, high-fibre forage, which can reduce straw usage and requires no processing to prevent sorting.See the AHDB Milk fever focus factsheet for further details.Run a complete analysis, (with minerals) of these forages when:
• Opening new clamps
• Feed intake changes considerably
• Different layers or different dry matters are encountered in the clamp
See the Successful silage chapter for further information on forage management. Ensure the ration you feed is palatable. Cows have a highly sensitive sense of smell – 17 times more sensitive than that of humans. Excessive ash content (such as from minerals or limestone), or too many unpalatable ingredients, such as urea and rape, can reduce intakes.
It is important to avoid feeding dry cows:
• Mouldy, or poorly managed (for example, contaminated) forages because these can cause abortion or decrease intakes
• Late-season grass from areas in which soil potash is likely to be high, or high-clover silage, which can increase the risk of milk fever
Minerals for transitionIncorrect macromineral supplementation can cause metabolic disease issues, particularly milk fever (see our AHDB Herd health factsheets).
Review all mineral sources, as described above, including those commonly bought off the shelf, or bespoke mineral formulations specifically for lactating and dry cows.A mineral included in the TMR might be more appropriate at a set feed rate because then, the only change is the number of portions fed as the dry cow group changes. Again, a bespoke mineral would need reviewing alongside any dietary changes.Ask a nutritionist and vet for advice when assessing minerals and formulating diets.Micromineral supplementation also has a considerable impact on immune function and calf health. In particular, make sure to avoid deficiencies in iodine, selenium and zinc, and excess of copper.
Effects of transition on the calfThe precise relationship between transition cow health and the health of the calf is not yet fully understood. However, there is abundant evidence that successful transition for the cow also improves the performance of the calf.Both over- and underfeeding the pregnant cow and heifer can affect future growth, reproduction and productivity of the calf. For example, overfeeding in the early dry period may predispose the calf to metabolic disease when she herself calves. These effects may also be passed on to future generations.Controlling body condition throughout rearing and the lactation cycle can minimise the risk of calving difficulties.
In all phases of transition, accurate mineral nutrition is critical to avoid metabolic diseases and to maintain good health and performance in early lactation.
114 Dry cow and early lactation feeding

116 Overview
117 Proteinnutritionandtheenvironment
118 Dietaryphosphorusandtheenvironment
Nutrition and the environment
Nutritionan
dthe
environm
ent

Overview Minerals are a key component in the diet of dairy cows and their effects on performance, health, fertility and welfare are well documented. Traditionally, dairy cows have been supplemented to avoid deficiencies; however, more recently, dietary recommendations incorporate effects on animal health, fertility and product quality. Reducing dietary levels to the recommended amounts to meet requirements not only decreases diet cost, but also minimises potential negative effects on the environment.
Nutrition and the environment
116 Overview

Protein nutrition and the environmentFeeding sufficient and balanced amounts of protein is key to achieving good production levels in the dairy cow. However, feeding protein in excess of the cow’s requirements can lead to the excretion of large amounts of nitrogen (N) to the environment. Most nitrogen is excreted as urea via the urine. Nitrogen losses from a dairy farm contribute to:
• Air pollution – Urea, excreted in urine, is a building block for ammonia, a key air pollutant that damages the environment and is harmful to human health. Ammonia reacts with nitrogen oxide (NO) and sulphur dioxide (SO2) in the atmosphere to form secondary particulate matter that can considerably affect human health
• Acidification – When deposited on land, ammonia acidifies soils and freshwater. The extra nitrogen leads to increased growth rates of some species, such as rough grasses and nettles. This is at the expense of other species with lower requirements, for instance, sensitive lichens, mosses and herbs
• Water pollution – If excreted nitrogen enters a watercourse, it can easily lead to eutrophication, a nutrient enrichment seen as algal bloom. As the algal bloom dies off, it depletes oxygen levels in the water, reducing the amount of oxygen available for fish. Areas in which the concentrations of nitrate in water exceed, or are likely to exceed, the levels set in the EU Nitrates Directive are designated as Nitrate Vulnerable Zones (NVZs)
• Greenhouse gas (GHG) emissions (nitrous oxide, a GHG with a Global Warming Potential 298 times higher than CO2)
Overfeeding nitrogen is expensive and provides no proven benefit when the metabolisable protein needs of dairy cows are met.Urea synthesis in the liver requires energy to detoxify excess protein supplied in diets. This is energy that could otherwise be used for functions such as milk production.
Figure 46. The nitrogen cycle
Correctly matching protein supply in the diet with actual cow requirements has proven to be the first step in lowering nitrogen excretion and cutting nitrogen emissions. Cows fed accurate levels of dietary protein are more efficient at converting dietary nitrogen into milk protein.Milk yield and composition are important factors for determining protein requirements; high levels of crude protein (CP) up to 18% DM are commonly used for high yielders. However, AHDB-funded research has shown that, in maize silage-based diets, the CP content of early lactation cows can be reduced from 18% to 15% with no detrimental effects on performance or reproduction, as long as the metabolisable protein requirements are met.More information can be found in the Code for Good Agricultural Practice (COGAP) for reducing ammonia emissions and in the Clean Air Strategy.
Further information on NVZs can be found on the gov.uk website by searching ‘Nitrate Vulnerable Zones’
Leaching
plant uptake
eaten by
Atmospheric N
Inorganic N
W A T E R
DAIRY COW
Dung & urine N-fertiliser
Organic N
Nutrition and the environment 117

A Defra report shows that using a feed planning system to match phosphorus and nitrogen levels in diets to actual livestock needs saves the average farm £7,700 per year.
Diets based on home-grown, high-protein forages are naturally rich in CP (particularly soluble protein) and, for this reason, it may be more challenging to reduce dietary protein levels. AHDB Dairy is currently funding a research project that aims to evaluate the possibility of reducing CP in forage-based diets. Average CP levels in fresh grass can be seen in the Great grazing chapter (page 35). Further information can also be seen from AHDB research Low protein diets based on high protein forages.
Checklist for good dietary N management:• Check the protein content of your forages
through laboratory analysis and formulate rations accordingly
• If you are feeding mixed rations, send a TMR sample to the lab to be tested for ME and CP
• Consider protein degradability as well as content. Different protein sources may be more efficient with a different diet composition (such as a suitable energy source)
• Diet should be balanced for metabolisable protein, not CP (for further details see Know the essentials chapter on page 21)
Dietary phosphorus and the environmentIn dairy cows, phosphorus has more known biological functions than any other mineral. For example, it is mostly found in bones and teeth, it is involved in energy metabolism and is part of the buffer system that maintains a constant blood pH.The current National Research Council (NRC, 2001) recommendation for phosphorus content in the diet of lactating cows is to achieve 0.32–0.38% (on a DM basis). AHDB-funded research on 50 farms has shown that it is common to overfeed this mineral by more than 20% – especially in early lactation. However, on some farms, phosphorus was also underfed.For more information on mineral feeding of dairy cows, see AHDB's research report ahdb.org.uk/ a-comparison-of-current-dairy-cow-mineral- intake-on-commercial-farms-relative-to-recommended-levels
Table 37. Recommended and actual dietary levels of phosphorus (P) for lactating cows on 50 farms (average, min and max) and excess of requirements
Recommended* (% DM)
Average (% DM)
Minimum (%DM)
Maximum (%DM)
Early lactation 0.35 0.45 0.28 0.58
Late lactation 0.32 0.39 0.21 0.62
*National Research Council, 2001. DM: dry matter
When cows are overfed phosphorus, the efficiency of its use falls because more of it is lost in the muck. This is a risk for the environment – in particular, for freshwater ecosystems. Phosphorus is a major cause of eutrophication (triggering algal bloom) and poor water quality.Feeding phosphorus above the cows’ requirements is costly and has no proven benefit. Canadian research estimated the potential savings of precise phosphorus feeding to be equivalent to almost £12/cow/year.
Top tips for good dietary phosphorus management• Have your forages analysed for phosphorus and,
if you are responsible for the diet formulation, update the feed library of your rationing software with the results
• When adding phosphorus-rich feeds, especially coproducts, review the diet formulation to adjust mineral content
• If you use any mineral supplements (compounds included), make sure they do not create an imbalance in dietary phosphorus. If necessary, request a bespoke formulation for your farm
• Avoid both over- and underfeeding
118 Nutrition and the environment

SummaryGrazing and forage is influenced by many factors. Monitoring herd performance, identifying areas of improvement and considering selection options can help build a framework to improve grassland management in your herd.For a range of resources to help you improve grazing and forage utilisation in your herd, take a look at the Forage First webpage, ahdb.org.uk/knowledge-library/forage-first and our YouTube channel, AHDB Dairy.

Produced for you by:AHDB Dairy Stoneleigh Park Kenilworth Warwickshire CV8 2TL
T 024 7669 2051 E [email protected] W ahdb.org.uk
@AHDB_DairyIf you no longer wish to receive this information, please email us on [email protected]
AHDB is a statutory levy board, funded by farmers, growers and others in the supply chain. Our purpose is to inspire our farmers, growers and industry to succeed in a rapidly changing world. We equip the industry with easy to use, practical know-how which they can apply straight away to make better decisions and improve their performance. Established in 2008 and classified as a Non-Departmental Public Body, it supports the following industries: meat and livestock (cattle, sheep and pigs) in England; horticulture, milk and potatoes in Great Britain; and cereals and oilseeds in the UK. AHDB’s remit covers 72 per cent of total UK agricultural output. Further information on AHDB can be found at ahdb.org.uk
While the Agriculture and Horticulture Development Board seeks to ensure that the information contained within this document is accurate at the time of printing, no warranty is given in respect thereof and, to the maximum extent permitted by law, the Agriculture and Horticulture Development Board accepts no liability for loss, damage or injury howsoever caused (including that caused by negligence) or suffered directly or indirectly in relation to information and opinions contained in or omitted from this document.
© Agriculture and Horticulture Development Board 2021. All rights reserved.
40007 0823