Embed Size (px)
Citation preview

Goldman Sachs does and seeks to do business with companies covered in its research reports. As aresult, investors should be aware that the firm may have a conflict of interest that could affect theobjectivity of this report. Investors should consider this report as only a single factor in making theirinvestment decision. For Reg AC certification and other important disclosures, see the DisclosureAppendix, or go to www.gs.com/research/hedge.html. Analysts employed by non-US affiliates are notregistered/qualified as research analysts with FINRA in the U.S.
The Goldman Sachs Group, Inc.
EQUITY RESEARCH | October 12, 2018
Neil Mehta+1 212 [email protected] Sachs & Co. LLC
Michele Della Vigna, CFA+44 20 [email protected] Sachs International
David Chreng+44 20 [email protected] Sachs International
RE-IMAGINING BIG OILS How Energy Companies can successfully adapt to climate change
Big Oils have shown tremendous ability to adapt totechnological change in their 100+ years of history. Webelieve it is now strategic that they drive a low carbontransition consistent with the global ambition to containglobal warming within 2° C. Big Oils have manytools to achieve this transition towards BigEnergy and become broader, cleaner energyproviders: a deeper presence in the global gas andpower chains, including retail, EV charging andrenewables; biofuels; petrochemicals; improvedupstream and industrial operations; and carbon capture.
In this report, we discuss the optionsavailable and argue that the strategic objectivecan be delivered with improving corporatereturns and renewed value for scale andintegration. This transition will require deepcultural and corporate changes and may leave thehigher carbon parts of the value chainfinancially stranded and underinvested,such as oil production (particularly oil sands andolder fields) and refining, leading to potentiallyhigher oil prices and refining margins in thecoming decade and to a bigger role for privatecapital in those areas.
Alberto Gandolfi+44 20 [email protected] Sachs International
The following is a redacted version of a report originally published Oct. 8, 2018 (51pgs). All company references in thisnote are for illustrative purposes only and should not be interpreted as investment recommendations.

Big Oils can lead a profitable path towards Big Energy and a 2° C scenario
Low carbon: Some context around climate change and greenhouse gas (GHG)emissionsClimate change is a widely debated topic, with ongoing diversity of views. However,there is growing consensus among policy makers and scientists that global surfacetemperatures are rising and that the main cause is human-induced emissions ofgreenhouse gases (GHGs), which include carbon dioxide (CO2), methane (CH4), watervapour (H2O) and nitrous oxide (N2O). Carbon dioxide and methane are the major GHGcomponents, representing 76% and c.16% of the overall emissions mix, respectively.According to the International Energy Agency (IEA), over two-thirds of these GHGemissions can be attributed to the energy sector (c.32 GtCO2 in 2015), with coal, oil andgas representing 45%, 35% and 20% of the global energy-related emissions,respectively. Of note, power generation accounts for 42% of those CO2 emissions(c.13.4 GtCO2), dominated by coal (72%).
Big Oils directly generate only 1% of the world’s GHG emissions, but influence 10% of‘well-to-wheel’ and ‘well-to-wire’ emissionsIn this report, we do not enter into the scientific debate about global warming and howbest to contain it. We take the International Energy Agency (IEA)’s scenarios as areference point and analyse Big Oils’ strategic options to deliver carbon emissionreductions in line with society’s (here referring to the world) ambitions to remain within2° C of global warming, while achieving universal access to modern energy by 2030, aslaid out in the IEA’s ambitious Sustainable Development Scenario (SDS). Big Oils are keyto the global carbon debate, as they produce and market energy products that accountfor c.10% of the global energy sector carbon emissions. In 2017, on a scope 1 and 2basis (i.e. the emissions directly generated in their operations and those indirectlygenerated by the power and heat consumed), Big Oils reported an aggregated GHGemissions of 523 MtCO2eq (c.1% of global energy-related GHG emissions), whilescope 3 (the emissions generated at the point of consumption by the products sold)amounted to 3.1 GtCO2eq (c.9% of global energy-related GHG emissions).
Big Oils have a major role to play in de-carbonization, as ‘Big Energy’, in an evolvingcompetitive landscapeWe believe that the low carbon transition is changing the competitive landscape inglobal energy, with tightening financial conditions for all hydrocarbon investments (coal,oil production - particularly oil sands and mature fields, oil refining and - to a lesserextent - gas) creating a better industry structure and higher returns for Big Oils in theirtraditional oil & gas business. We analyse this industry structure change in detail in ourAge of Restraint report. The higher returns from the traditional oil & gas businesses willprovide Big Oils the funding to re-imagine their business, showing renewed value andstrategic importance to scale and vertical integration. They can build on their competitiveadvantages in global supply chain management, recognised brands, technologicalexpertise, risk management and global footprint to become Big Energy, replicating their
12 October 2018 2
Goldman Sachs

century-old vertical integration in oil (well-to-wheel) to the gas and power value chains(well-to-wire), but also to petrochemicals (well-to-high performance material), biofuels(waste-to-wheel), renewables (sun & wind-to-wire), with carbon capture and naturalsinks (such as re-forestation) opportunities to offset their carbon emissions.
We estimate that this transition, if fully embraced and executed, can lead to a 20%+‘well to wheel’ (and ‘well to wire’) carbon emission reduction that is consistent withsociety’s 2° C ambition. We estimate that the blended returns on new investments,leveraging our Top Projects database, could be materially higher than over the past 10years, through a mix of a c.400 bp enhancement of returns in hydrocarbon investmentsand a c.100 bp dilution from low carbon investments.
Key parts of the oil value chain may end up financially stranded and under-invested,leading to higher prices at the pump in the 2020sThe push for de-carbonization is impacting long-term oil & gas investment: banks arereducing financing for new hydrocarbon projects; Big Oils are committing to lowercarbon intensity, implying a shift away from oil production and refining; US E&Ps arefocusing entirely on short-cycle developments; NOCs are focusing more on gas. Weestimate that this may lead to structural underinvestment in key parts of the oil & gassupply chain, particularly in refining, oil sands, mature oil fields and broader long-life oilproduction assets. This is consistent with our Top Projects 2018 analysis, where weshow that the pace of long-cycle oil mega-projects’ ramp-up is likely to slow down from1.2-1.4 mn bls/d at present to 0.6-0.8 mn bls/d from 2021, potentially laying thefoundations to a very tight oil market in the 2020s.
Exhibit 1: The pace of non-OPEC mega-projects (Top Projects) growth is likely to halve after 2020YoY oil production growth (kboe/d) from non-OPEC, excluding shale projects
-200
0
200
400
600
800
1,000
1,200
1,400
1,600
2015 2016 2017 2018E 2019E 2020E 2021E 2022E
Brazil Canada Russia US Norway Kazakhstan Guyana Others
Source: Goldman Sachs Global Investment Research
12 October 2018 3
Goldman Sachs

From Big Oils to Big Energy in 10 charts
Exhibit 2: The IEA lays out an aggressive 23% carbon intensityreduction by 2030 (SDS) consistent with a 2° C ambitionCO2 emissions intensity under three scenarios (CPS, NPS, SDS)
Exhibit 3: We estimate that Big Oils can deliver an equivalent 20%+reduction in GHG by 2030 in their direct operations...Big Oils scope 1/2 GHG emissions intensity 2017-30 bridge
0.0
0.5
1.0
1.5
2.0
2.5
3.0
2015
2016
2017
2018
E20
19E
2020
E20
21E
2022
E20
23E
2024
E20
25E
2026
E20
27E
2028
E20
29E
2030
E20
31E
2032
E20
33E
2034
E20
35E
2036
E20
37E
2038
E20
39E
2040
E
CO2
emis
sion
s in
tens
ity (t
CO
2/to
e)
CPS NPS SDS
70%
75%
80%
85%
90%
95%
100%
2017 Zero routineflaring
Methane (-50%)
Oil sandsexit
1% pa shiftto gas
5%renewablesin energyprod. mix
10% biofuelin refining
mix
Impr. Inefficiency -
scope 1
Impr. Inefficiency -
scope 2
2030E
Scop
e 1/
2 G
HG e
mis
sion
s
Source: OECD/IEA 2017 World Energy Outlook, IEA publishing Source: Goldman Sachs Global Investment Research
Exhibit 4: ...and on a ‘well to wheel’ basis, transforming themselvesinto ‘Big Energy’Big Oils scope 3 GHG emissions 2017-30 bridge
Exhibit 5: This strategic shift will be important to avoid investordivestments, as suffered by the coal industry...# of divesting institutions (LHS) vs Coal stocks EV/EBITDA
70%
75%
80%
85%
90%
95%
100%
2017 Increase inpetchem capacity
(5%)
10% energy sold ispower (50%CCGT, 50%
renewables), incl.EVs
1% pa shift to gas CCS and naturalsinks (5% ofenergy mix)
10% biofuel inrefining mix
2030E
Scop
e 3
GH
G e
mis
sion
s
0.0x
1.0x
2.0x
3.0x
4.0x
5.0x
6.0x
7.0x
8.0x
9.0x
10.0x
0
200
400
600
800
1,000
1,200
2013 2014 2015 2016 2017
EV/E
BIT
DA
(x)
No.
of D
ives
ting
Inst
itutio
ns
No. of Divesting Institutions (LHS) EV/EBITDA (Coal stocks - RHS)
Source: Goldman Sachs Global Investment Research Source: FactSet, DivestInvest, 350.org
Exhibit 6: ...and may leave the higher carbon parts of the energychain financially stranded and under-invested...Lifecycle GHG intensity by provenance/product in kgCO2eq/boe
Exhibit 7: ...as financing for independent long-cycle oil & gasdevelopers dries upEU E&Ps total amount raised through credit facilities/bank loans US$bn
0
100
200
300
400
500
600
Sola
r
Win
d
Biof
uel
Nat
ural
gas
LNG
Saud
i oil
Nor
way
oil
Rus
sia
Shal
e oi
l
UK
GoM
Iran/
Iraq
Braz
il
Nor
th A
frica
Wes
t Afri
ca
Coa
l
Can
ada
Hea
vyO
il
Life
cycl
e G
HG
em
issi
ons
inte
nsity
(k
gCo2
eq/b
oe)
Upstream Refining Consumption
0
1
2
3
4
5
6
7
0.0
2.0
4.0
6.0
8.0
10.0
12.0
14.0
16.0
2000
2001
2002
2003
2004
2005
2006
2007
2008
2009
2010
2011
2012
2013
2014
2015
2016
2017
2018
Total amount available - Credit facilities / Bank loans - US$bnAverage years to maturity (RHS)
Source: IPCC, Company data, Goldman Sachs Global Investment Research Source: Bloomberg
12 October 2018 4
Goldman Sachs

Exhibit 8: Even the IEA’s most ambitious low-carbon scenariorequires more oil & gas production by 2030...SDS Energy demand in 2015 and 2030
Exhibit 9: ...but the industry’s shift of capital away from oil isalready creating a 6 mn bls/d gap in the 2020s...Top Projects 2018 lost offshore and onshore oil production fromlong-cycle developments; 2018 vs 2014 expectations.
0
2
4
6
8
10
12
14
16
2015 2030
SDS
Ener
gy d
eman
d (M
toe)
Oil Gas Renewables Nuclear Coal
-5,000
-4,000
-3,000
-2,000
-1,000
0
1,000
2014
2015
2016
2017
2018
E
2019
E
2020
E
2021
E
2022
E
2023
E
2024
E
2025
E
Lost onshore oil production Lost offshore oil production
Source: OECD/IEA 2017 World Energy Outlook, IEA Publishing Source: Goldman Sachs Global Investment Research
Exhibit 10: ...while creating an upcoming LNG construction boom...Top Projects reserves sanctioned by the ‘Seven Sisters’ (RDShell, BP,TOTAL, ENI, Equinor, ExxonMobil, Chevron)
Exhibit 11: ...led by Big Oils, as they shift hydrocarbon productiontowards global gasLNG production capacity (producing, under dev.) and as % 2017 total oil& gas production by company
0
2
4
6
8
10
12
14
16
18
20
2000
2001
2002
2003
2004
2005
2006
2007
2008
2009
2010
2011
2012
2013
2014
2015
2016
2017
2018
E
2019
E
Rese
rves
san
ctio
ned
(bn
boe)
Oil Gas LNG
0%
5%
10%
15%
20%
25%
30%
0
10
20
30
40
50
60R
DSh
ell
Che
vron
Tota
l
BP
Exxo
nM.
Con
ocoP
.
ENI
Equi
nor
LNG
pro
d. /
unde
r dev
as
% o
f 201
7 O
&G
pr
od.
LNG
pro
duct
ion
capa
city
(mtp
a)
Pre-Sanction Under DevelopmentProduction (2017) LNG prod. / under dev. as % of 2017 O&G prod.
Source: Company data, Goldman Sachs Global Investment Research Source: Company data, Goldman Sachs Global Investment Research
Exhibit 12: A more concentrated, under-financed oil & gas industry provides Big Oils with improving corporate returns, including thedilution from low carbon investmentsBig Energy % energy portfolio mix and IRR in 2003-14 and in the ‘Future’
% mix IRR % mix IRROil 48% 10% 26% 16%Gas 11% 12% 19% 17%LNG 14% 7% 20% 13%Refining and Marketing 20% 10% 10% 15%Petchems 5% 10% 10% 10%Renewables, CCS and re-forestation 2% 0% 15% 5%Big Energy 9% 13%
2003-14 Future
Source: Company data, Goldman Sachs Global Investment Research
12 October 2018 5
Goldman Sachs

Re-imagining Big Oils in numbers
pa in renewables capex by Big Oils in our scenario for a low carbon transition (or 9% of 2019 capex).
$9bn
$170bn
of new LNG projects expected to be sanctioned by Big Oils in the next two years as the industry shifts towards gas.
reduction in carbon emission intensity by 2030 and 44% reduction by 2040 required for the IEA’s Sustainable Development Scenario
which is consistent with keeping global average temperature to well below 2 °C
above pre-industrial levels…
23% reduction by 2030 implied by the Current
Policy Scenario, making the 2 °C scenario a challenging ambition.
…4% of global emissions accounted for by
power generators (c.13.4GtCO2), dominated by coal (72%).
42%
of global carbon emissions from energy is from Big Oils ‘wheel to wheel’—generating
directly 0.5 GtCO2eq (1% of global emissions), and their clients generate 3.1 GtCO2eq burning the fuel they sell (9% of
global emissions).
C10% reduction of Scope 3 emissions (86% of the total) is possible by 2030 through a
shift of upstream towards gas, of downstream towards petrochemicals and
of retail towards clean power and biofuels. This requires big Oils to embrace the shift to Big Energy.
c20% de-rating for coal producers since 2013 as the number of divesting institutions increased to 1,000.
c60%
of investment required in oil & gas production by 2030 as the IEA’s
Sustainable Development Scenario envisages a higher oil & gas production
by 2030 than in 2015.
$3.2trn fall in incremental credit facilities to the
EU E&Ps from the peak in 2014.
95% higher returns than the past decade for Top Projects led by competition
and the resurgence of the ‘Seven Sisters,’ with 70%+ of the capex still invested in these areas, contributing
to a 400bp returns accretion.
c5%
Source: OECD/IEA 2017 World Energy Outlook, IEA publishing, Company data, Goldman Sachs Global Investment Research

The IEA Sustainable Development Scenario requires a 23% reduction in carbon emission intensity
by 2030 and 44% by 2040
The Paris Agreement (even before the US exited) was an important step towards global coordination incurbing carbon emissions, but the policies in place are not sufficient to achieve the 2° C goal. The IEAforecasts emissions under the current policies (CPS) and the expected new, tighter policies that are likelyto be implemented in the future (NPS). Neither of these scenarios comes close to reducing carbonemissions in line with the 2° C scenario. Only the ambitious sustainable development scenario isconsistent with achieving the 2° C goal. The three scenarios, named Current Policies (CPS), New Policies(NPS), and Sustainable Development (SDS) highlight the discrepancy between the proposed policies andthose required to contain global warming. In this report, we hold Big Oils to the highest ambitions (SDS)and look at how they can achieve a reduction in the well-to-wheel carbon emissions (scope 1/2/3) of 20%+by 2030. Below as per ‘OECD/IEA 2017 World Energy Outlook, IEA Publishing’.
Current Policies (CPS):The Current Policies Scenario excludes the realisation of announced, newn
policy targets and considers only the impact of those policies and measures that are firmly enshrined inlegislation as of mid-2017. In addition, where existing policies target a range of outcomes, theassumption in the Current Policies Scenario is that the least ambitious end of this range is achieved. Inthis way, the scenario provides a cautious assessment of where momentum from existing policiesmight lead the energy sector in the absence of any additional impetus from governments.
New Policies (NPS):The New Policies Scenario aims to provide a sense of where today’s policyn
ambitions seem likely to take the energy sector. It incorporates not just the policies and measures thatgovernments around the world have already put in place, but also the likely effects of announcedpolicies, as expressed in official targets or plans.
Sustainable Development (SDS):The Sustainable Development Scenario takes a fundamentallyn
different approach from those discussed above. While the Current Policies and New Policies scenariosstart with certain assumptions about policies and see where they lead the energy sector, theSustainable Development Scenario starts with a certain vision of where the energy sector needs to goand then works back to the present.
Exhibit 13: Carbon intensity is expected to fall by 23% by 2030(vs 2017)...CO2 emissions intensity under three scenarios (CPS, NPS, SDS)
Exhibit 14: ...and by 44% by 2040 under the IEA’s mostambitious scenario (SDS)GHG emissions under three scenarios (CPS, NPS, SDS)
0.0
0.5
1.0
1.5
2.0
2.5
3.0
2015
2016
2017
2018
E20
19E
2020
E20
21E
2022
E20
23E
2024
E20
25E
2026
E20
27E
2028
E20
29E
2030
E20
31E
2032
E20
33E
2034
E20
35E
2036
E20
37E
2038
E20
39E
2040
E
CO
2 em
issi
ons
inte
nsity
(tC
O2/
toe)
CPS NPS SDS
0
5
10
15
20
25
30
35
40
45
50
2015
2016
2017
2018
E20
19E
2020
E20
21E
2022
E20
23E
2024
E20
25E
2026
E20
27E
2028
E20
29E
2030
E20
31E
2032
E20
33E
2034
E20
35E
2036
E20
37E
2038
E20
39E
2040
E
GH
G e
mis
sion
s (G
tCo2
eq)
CPS NPS SDS
Source: OECD/IEA 2017 World Energy Outlook, IEA Publishing Source: OECD/IEA 2017 World Energy Outlook, IEA Publishing
12 October 2018 7
Goldman Sachs

Energy mix: Big Oils have a major part to play in the global low carbontransition
The aim to stay within 2° C of global warming requires a strong focus and investment inall carbon reduction initiatives: energy efficiency across the oil & gas chains, cleanerpower generation, cleaner transportation fuels, lower methane emissions and flaring,carbon capture and natural sinks. We believe that Big Energy has a major role to play inall of these initiatives. The most important initiative by 2030 will be to transition awayfrom coal in power generation and industrial uses. The IEA’s Sustainable DevelopmentScenario (SDS) assumes that the share of coal in energy production declines from 28%(2015) to 18% (2030) of the energy mix. This shift is driven by gas demand growth of+19% (SDS) by 2030, and renewable energy demand by 50% (SDS). The IEASustainable Development Scenario envisages higher oil & gas production by 2030 thanin 2015. If we assume an industry average 5% pa decline rate in oil & gas productionfrom 2017 until 2030, this implies that the industry will need to replace c.50% of today’sproduction, equivalent to almost 80 mn boe/d of oil & gas production. At the industry’scurrent average replacement cost of c.$40k/boepd, this equates to $3.2 tn ofinvestment required in oil & gas production by 2030.
Exhibit 15: Under the SDS scenario, demand for coal is expected todecline by 36% by 2030SDS Energy demand in 2015 and 2030
Exhibit 16: Oil & gas is expected to be broadly flat as part of theenergy mixSDS Energy mix in 2015 and 2030
0
2
4
6
8
10
12
14
16
2015 2030
SDS
Ener
gy d
eman
d (M
toe)
Oil Gas Renewables Nuclear Coal
0%
10%
20%
30%
40%
50%
60%
70%
80%
90%
100%
2015 2030
SDS
Ener
gy m
ix (%
)
Oil Gas Renewables Nuclear Coal
Source: OECD/IEA 2017 World Energy Outlook, IEA Publishing Source: OECD/IEA 2017 World Energy Outlook, IEA Publishing
12 October 2018 8
Goldman Sachs

From Big Oils to Big Energy, a de-carbonization path compliant with a 2° Cscenario
In this report, we analyse how Big Oils can utilize their areas of technical expertise,competitive advantage and brands/customer relationships to evolve into Big Energy anddeliver a carbon reduction in their portfolio consistent with the most ambitious of theIEA carbon reduction paths: the Sustainable Development Scenario. To better analysethe ‘well-to-wheel’ carbon reduction opportunity, we analyse separately what theindustry can deliver in each of scope 1, scope 2 and scope 3 carbon emissions. For anexplanation of the different scopes, see Appendix A. In this analysis, we look at the %change in Big Oils’ emission intensity (MtCO2eq/Mtoe), and compare it to the IEAintensity reduction path. We do not analyse the absolute amount of emissions, in ordernot to penalize companies that are growing their business vs. shrinking corporates. Welook out to 2030 in this analysis (rather than to 2030 and 2040, as the IEA does), as webelieve that technological advancements in the coming decade will materially re-shapethe carbon strategy beyond 2030, making today’s analysis obsolete.
A deep dive into the GHG reduction initiatives on scope 1, 2 and 3We analyse first the emissions that Big Oils generate directly through their operations,including methane emissions (scope 1) and the indirect generation through their powerand heat consumption (scope 2). These are the carbon emissions that are directlyattributable to Big Oils. Although they make up only 10%-15% of ‘well to wheel’emissions, Big Oils have strong control over this set of emissions and are driving severalkey strategic initiatives to curb them. The reporting of this set of emissions is broadlyconsistent throughout the industry, with operated scope vs. equity production being thekey difference. Then we analyse the emissions generated through consumption of theproducts sold by Big Oils (scope 3). These represent the vast majority of the ‘well towheel’ emissions, but are generated outside the control of the oil companies. Thereforethe key drivers of emission reductions lie in shifts in the sales and production mix.Scope 3 also shows large discrepancies in the reporting methodology, as it can becalculated using upstream production, refining throughput or final sales (whichever thelarger).
Scope 1 emission reduction (13% of total) depends on both process and mixn
changes and we see six main areas of action: (1) reduction in flaring; (2) reduction ofmethane emissions; (3) exit from highly carbon-intensive extraction processes (suchas Canadian oil sands); (4) improvement in overall production efficiency (helped bydisposing of older fields and refineries); (5) production shift towards gas (althoughLNG does not have materially lower scope 1 CO2 emissions than conventional oil);(6) an expansion in renewable production capacity. An increase in biofuel productionwould actually increase the scope 1 CO2 intensity, although it has lowerwell-to-wheel emissions. Overall we believe that scope 1 and 2 GHG emissionscould be lowered by c.24% by 2030 following the adoption of all these initiatives,achieving a reduction in carbon intensity in line with the IEA’s SDS.
12 October 2018 9
Goldman Sachs

Scope 2 emission reduction (1% of total): we assume that the carbon intensity ofn
third-party power and heat acquired to run the operations improves in line with theaverage improvement in power generation laid out by the IEA’s SDS. It could actuallyimprove faster if Big Oils used only renewables and gas to power their ownoperations (for instance Shell’s decision to source hydro power for its Canada LNGdevelopment).
Scope 3 emission reduction (86% of total): these emissions are the mostn
important, as they constitute 80%+ of well-to-wheel emissions, but Big Oils havethe least control over them, as they are generated by their customers and notdirectly. The accounting of scope 3 matters, as the levers available to reduce theGHG intensity change according to whether it is calculated at production, refiningthroughput or final sales. Final sales offer more options of lower-carbon productdiversification, especially if the intensity is calculated including the petrochemicaloutput (where carbon is not burned, but sequestered in the materials produced). InExhibit 18, we take the broadest definition, although we do discuss thecompany-specific reporting and commitments in the section below ‘Big Oils andGHG reduction’. We see five main areas of action that can drive scope 3 carbonintensity reduction and the move of Big Oils towards Big Energy: (1) the shift ofproduction from oil towards gas (including LNG); (2) the shift of downstream oil fromrefining to petrochemicals; (3) an expansion downstream in gas (similar to what BigOils have always had in oil, with production/refining/retail marketing) to gas & powerretail, including power supplied through CCGTs and renewables; (4) increased salesof biofuels; (5) carbon capture and natural sinks (re-forestation), to reduce netemissions. If Big Oils use all these levers, on our estimates they can achieve ac.21% reduction in scope 3 carbon intensity, allowing an overall ‘well-to-wheel’reduction in line with the IEA SDS ambitions.
Exhibit 17: Scope 1/2 GHG emissions intensity can be reduced byc.24% by 2030...Scope 1/2 GHG emissions intensity 2017-30 bridge
Exhibit 18: ...while scope 3 can be cut by c.21%, through a mixchange of the energy products produced and soldScope 3 GHG emissions 2017-30 bridge
70%
75%
80%
85%
90%
95%
100%
2017 Zero routineflaring
Methane (-50%)
Oil sandsexit
1% pa shiftto gas
5%renewablesin energyprod. mix
10% biofuelin refining
mix
Impr. Inefficiency -
scope 1
Impr. Inefficiency -
scope 2
2030E
Scop
e 1/
2 G
HG e
mis
sion
s
70%
75%
80%
85%
90%
95%
100%
2017 Increase inpetchem capacity
(5%)
10% energy sold ispower (50%CCGT, 50%
renewables), incl.EVs
1% pa shift to gas CCS and naturalsinks (5% ofenergy mix)
10% biofuel inrefining mix
2030E
Scop
e 3
GH
G e
mis
sion
s
Source: Goldman Sachs Global Investment Research Source: Goldman Sachs Global Investment Research
12 October 2018 10
Goldman Sachs

While Big Oils can show emission reductions in line with the SDS, the intensity islikely to remain above societyExhibit 19 shows the companies’ scope 1+2+3 carbon intensity (calculated dividing theirtotal emissions by their scope 3 energy volumes), which is the best approximationavailable of their well-to-wheel carbon intensity, in our view. Exhibit 20 shows thecarbon intensity that the companies could achieve by 2030, including all the low-carboninitiatives that we estimate they may implement in the coming decade. We calculatethese according to the scope 3 disclosure that each company utilises, although this maychange in the future. The calculation based on product sales gives many more potentialstrategic levers to reduce carbon intensity than the disclosures based on production orrefining throughput. This is why companies like Repsol, BP, Equinor and ENI (that usethe production and refining outturn method) end up at the top of the scale in Exhibit 20.A second observation is that although Big Oils can achieve a percentage reduction inintensity in line with society’s aim to stay within 2°C of global warming, the intensity islikely to remain above the average for society, due to the different energy mix (nohydro/nuclear, business mix gearing towards oil).
Exhibit 19: Big Oils product mix implies that they have a higherwell-to-wheel carbon intensity than the broader economy...Scope 1+2+3 GHG intensity by company (2017), vs IEA scenarios (2017CPS, 2030E CPS/NPS/2DS).
Exhibit 20: ...while the bigger improvements are likely to beachieved by companies with a large marketing businessScope 1+2+3 GHG intensity by company (2030), vs IEA scenarios (2030ECPS/NPS/2DS).
0.0
0.5
1.0
1.5
2.0
2.5
3.0
3.5
OMV*** RDShell** Equinor* TOTAL*** ENI* Galp*** BP** Repsol***
2017
sco
pe 1
/2/3
GHG
inte
nsity
(MtC
o2eq
/Mto
e)
IEA - CPS (2017) IEA - CPS (2030E)
IEA - NPS (2030E) IEA - 2DS (2030E)
0.0
0.5
1.0
1.5
2.0
2.5
3.0
OMV*** RDShell** TOTAL*** Galp*** ENI* Equinor* BP** Repsol***2030
sco
pe 1
/2/3
GH
G in
tens
ity (M
tCo2
eq/M
toe)
IEA - CPS (2030E) IEA - NPS (2030E) IEA - 2DS (2030E)
Source: Company data, Goldman Sachs Global Investment Research, OECD/IEA 2017 WorldEnergy Outlook, IEA Publishing
Source: Company data, IEA, Goldman Sachs Global Investment Research, OECD/IEA 2017 WorldEnergy Outlook, IEA Publishing
12 October 2018 11
Goldman Sachs

High GHG emissions in the oil & gas industry are driven by oil exposure,especially in oil sands, mature fields and West Africa
Exhibit 22 shows the carbon emission intensity of different fuels. As Big Oils becomeBig Energy, they are likely to reduce investment in the products that fall on the right, andincrease those on the left. Coal (already fully exited by Big Oils in 2015), Canadian OilsSands (partially exited), mature fields and parts of the West African business withunreliable gas infrastructure are likely to fall under heavy scrutiny and be potentiallydivested in the coming years. On the other side, LNG, pipeline gas, petrochemicals,biofuels and renewables are likely to see an increase in the share of investments.
Exhibit 21 shows the average scope 1 carbon emissions of the key production areas:Saudi oil stands out for the lowest carbon emission of any oil production worldwide,while Canadian heavy oil and West Africa show a high level of carbon emissions. LNGand Biofuels are also quite carbon intensive on a scope 1/2 basis, but score well on awell-to-wheel basis owing to low scope 3 emissions.
In Exhibit 23 below, we show the average lifecycle GHG intensity (from extraction toconsumption) for renewables, coal and the main oil & gas development types. UpstreamGHG intensity is based on the analysis shown in Exhibit 21. For the refining GHGintensity, emissions will vary depending on various parameters including the crude APIof the specific oil development type; the heavier the crude (lower API), the higher theGHG emission intensity to refine it. Finally, consumption GHG intensity was calculatedbased on refined products produced from the crude, and the GHG emissions associatedwith their respective combustion (Exhibit 22).
Exhibit 21: Saudi Oil stands out for the lowest carbon intensity inoil ...Scope 1 GHG emissions intensity for different development types
Exhibit 22: ...while gas has the lowest intensity at consumptionScope 3 GHG emissions intensity for different product type
0
20
40
60
80
100
120
140
160
Sola
r
Win
d
Coa
l - S
urfa
cem
inin
g
Shal
e ga
s
Coa
l -Und
ergrou
nd…
Con
vent
iona
l gas
Saud
i oil
Nor
way
oil
UK
GoM
Rus
sia
Iran/
Iraq
Nor
th A
frica
LNG
Shal
e oi
l
Braz
il
Wes
t Afri
ca
Biof
uel
Can
ada
Hea
vy O
il
Scop
e 1
GH
G e
mis
sion
(kgC
o2eq
/boe
)
Average
0
100
200
300
400
500
600
700So
lar
Win
d
Petro
chem
ical
prod
ucts
Biof
uel
Nat
ural
gas
Mot
or G
asol
ine
Avia
tion
Gas
olin
e
Kero
sene
Die
sel F
uel
Res
idua
l Fue
l Oil
Coa
l (po
wer
gene
ratio
n)
Scop
e 3
GH
G e
mis
sion
(kgC
o2eq
/boe
)
Average
Source: Goldman Sachs Global Investment Research Source: IPCC, Goldman Sachs Global Investment Research
12 October 2018 12
Goldman Sachs

Exhibit 23: Coal and Heavy Oil are the most carbon-intensive products on a lifecycle basis, generating c.2xmore GHG emissions than natural gas and LNGLifecycle GHG emissions intensity by winzone/product type in kgCO2eq/boe
0
100
200
300
400
500
600
Sola
r
Win
d
Biof
uel
Nat
ural
gas
LNG
Saud
i oil
Nor
way
oil
Rus
sia
Shal
e oi
l
UK
GoM
Iran/
Iraq
Braz
il
Nor
th A
frica
Wes
t Afri
ca
Coa
l
Can
ada
Hea
vyO
ilLife
cycl
e G
HG
em
issi
ons
inte
nsity
(kgC
o2eq
/boe
)
Upstream Refining Consumption
Source: IPCC, Company data, Goldman Sachs Global Investment Research
12 October 2018 13
Goldman Sachs

The path to de-carbonization can yield higher returns
Tight financing, financially stranded assets and a more concentrated industry structureto lift Big Oils returns in the low carbon age The initial reaction of investors when they think about the low carbon transition for BigOils is that it will entail lower corporate returns and higher capex. We believe that thisconclusion ignores some key dynamics of the low carbon transition (tighter financing forhydrocarbon projects, a more concentrated group of developers for mega-projects,financially stranded assets) and we come to the opposite conclusions: Big Oils will seeimproving returns in their path to become Big Energy.
We agree that the investments in renewables will have lower unlevered returns than BigOils’ core businesses. We make the conservative assumption that Big Oils willconsolidate all the low carbon capex (unconsolidated project finance being analternative) and that the unlevered returns will be 5% (in renewables, CCS and naturalsinks). This will dilute Big Oils’ corporate returns by c.100 bp in the coming decade.However, this returns dilution is more than counterbalanced by the improvedcompetitive environment in the core businesses of oil, gas, LNG and refining. As weargue in the last section of the report, the low carbon drive of investors and financialinstitutions is drying up financing for major long-cycle oil & gas projects and is leading tothe re-emergence of the ‘Seven Sisters’ oligopoly in new hydrocarbon mega-projectdevelopments. We have looked into our Top Projects database at the returns on newprojects in the 2003-14 period (an age of expansion for the sector, characterised byfierce competition, cost inflation and project delays) vs. the returns available today onpre-sanction projects (with a more consolidated group of developers, better tax termsand strong supply chain management). On our estimates, returns available today arec.5% higher than in the past decade. As 70%+ of the capex is still invested in theseareas, this contributes a c.400 bp corporate returns accretion, which more than balancesthe lower returns in renewables and other emerging low carbon technologies.
Exhibit 24: The path to de-carbonization can yield higher returns, once we take into account the market structure changesBig Energy % energy portfolio mix and IRR in 2003-14 and in the ‘Future’
% mix IRR % mix IRROil 48% 10% 26% 16%Gas 11% 12% 19% 17%LNG 14% 7% 20% 13%Refining and Marketing 20% 10% 10% 15%Petchems 5% 10% 10% 10%Renewables, CCS and re-forestation 2% 0% 15% 5%Big Energy 9% 13%
2003-14 Future
Source: Company data, Goldman Sachs Global Investment Research
12 October 2018 14
Goldman Sachs

Big Oils rise again as the industry consolidatesCapital availability has changed materially over the past 10 years, with credit facilitiesavailable to E&Ps and NOCs substantially curtailed, as financial institutions reduce theirexposure to long lead time oil & gas projects. With shrinking funding availability, mostcompanies have stopped developing giant complex projects since 2014, allowing thenew Seven Sisters to regain industry leadership as consolidation unlocks better fiscalterms, cheaper access to undeveloped resources, a more reliable global oil servicessupply chain and higher returns, as argued in our Top Projects 2018 report.
Underinvestment in oil mega-projects is likely to be structural and will impactproduction after 2020Since 2014, NOCs have retreated to their domestic basins and are more focused on gas,while E&Ps globally are focusing on short-cycle projects or struggle to find financing forlong-cycle projects. As a result, a number of project FIDs have been delayed, translatinginto 5.6 mb/d of lost oil production by 2025 (Exhibit 28). This change in the industry’sfinancing is likely to become structural in this new Age of Restraint and lead to amaterial deceleration in non-OPEC oil production growth (Exhibit 27).
Exhibit 25: Capital availability for independent oil & gas producershas shrunk materially...EU E&Ps total amount raised through credit facilities / bank loans, $ bn
Exhibit 26: ...pushing the industry to consolidate, with FIDs takenback into the hands of the ‘Seven Sisters’FIDs taken by year (Top Projects)
0
1
2
3
4
5
6
7
0.0
2.0
4.0
6.0
8.0
10.0
12.0
14.0
16.0
2000
2001
2002
2003
2004
2005
2006
2007
2008
2009
2010
2011
2012
2013
2014
2015
2016
2017
2018
Total amount available - Credit facilities / Bank loans - US$bnAverage years to maturity (RHS)
0%
10%
20%
30%
40%
50%
60%
70%
80%
90%
100%
-
2
4
6
8
10
12
14
16
18
20
2000
2001
2002
2003
2004
2005
2006
2007
2008
2009
2010
2011
2012
2013
2014
2015
2016
2017
2018
E
% o
f FID
take
n by
Big
Oils
# of
FID
by
year
Big Oils - LHS Others - LHS % of FID taken by Big Oils - RHS
Source: Bloomberg Source: Company data, Goldman Sachs Global Investment Research
Exhibit 27: Projects sanctioned in 2011-14 currently deliver steadyproduction growth through 2020...YoY oil production growth (kboe/d) from non-OPEC, excluding shaleprojects
Exhibit 28: ...but FIDs postponements leave a 5.6 mn b/d oilproduction shortfall by 2025Top Projects 2018 lost offshore and onshore oil production fromlong-cycle developments; 2018 vs 2014 expectations in mn b/d
-200
0
200
400
600
800
1,000
1,200
1,400
1,600
2015 2016 2017 2018E 2019E 2020E 2021E 2022E
Brazil Canada Russia US Norway Kazakhstan Guyana Others
-5,000
-4,000
-3,000
-2,000
-1,000
0
1,000
2014
2015
2016
2017
2018
E
2019
E
2020
E
2021
E
2022
E
2023
E
2024
E
2025
E
Lost onshore oil production Lost offshore oil production
Source: Goldman Sachs Global Investment Research Source: Goldman Sachs Global Investment Research
12 October 2018 15
Goldman Sachs

The key levers of lower reported carbon emissions in more detail
Scope 1/2: Improvement in efficiency in operated assets will drive most of the GHGemissions reductionScope 1 GHG emissions are associated with Big Oils’ operations across divisions, fromupstream to downstream, based either on an equity or operated basis. As previouslyhighlighted, we have assessed six main initiatives that can lower carbon footprint, whichon aggregate could lead to a 24% GHG emissions reduction. Improvement inoperational efficiency on operated assets represents the largest driver (helped by thesale of higher carbon mature assets), closely followed by the potential exit fromcarbon-intensive oil sands operations, reduction in flaring and methane emissions, and abroader shift from oil towards gas production.
Exhibit 29: We believe scope 1 and 2 emissions can be lowered on aggregate by 24% by 2030GHG reduction initiatives on scope 1 and 2 by company (MtCo2eq)
Scope 1
GHG reductions (MtCo2eq) 2017 2030E % reductionRDShell 97.0 4.1 1.5 0.9 2.8 1.3 -4.0 11.1 79.3 -18%TOTAL 50.0 1.0 1.1 2.2 1.9 0.8 -2.7 5.6 40.1 -20%BP 49.4 0.3 1.9 0.7 1.9 1.3 -2.1 5.6 39.8 -19%Equinor 15.4 0.1 0.3 0.0 1.5 0.3 -0.6 1.7 12.1 -21%ENI 42.5 5.0 0.5 0.0 1.4 0.7 -0.7 4.4 31.4 -26%Galp 3.6 0.0 0.0 0.0 0.2 0.0 -0.5 0.5 3.5 -4%OMV 11.1 0.5 0.5 0.0 0.3 0.2 -0.4 1.2 8.8 -21%Repsol 22.9 0.5 2.2 0.0 0.1 0.8 -0.7 2.5 17.6 -23%Chevron 56.0 1.5 2.0 1.6 4.6 1.5 -2.0 5.7 41.0 -27%ExxonMobil 117.0 6.6 3.5 14.4 5.3 1.8 -6.6 11.3 80.7 -31%EU Big Oils 465.0 19.6 13.3 19.7 20.1 8.8 -20.4 49.5 354.4 -24%
Scope 2GHG reductions (MtCo2eq) 2017 2030ERDShell 13.0 3.0 10.0TOTAL 4.0 0.9 3.1BP 6.8 1.5 5.3Equinor 0.3 0.1 0.2ENI 0.7 0.1 0.5Galp 0.2 0.1 0.2OMV 0.3 0.1 0.2Repsol 0.4 0.1 0.3Chevron 4.0 0.9 3.1ExxonMobil 8.0 1.8 6.2EU Big Oils 25.7 5.8 19.8
Improvement in efficiency (-23%)
Zero routine flaring Methane (-50%) Oil sands exit1% pa shift to gas
(max 65% of hydrocarbon mix)
5% renewables in energy production
mix
5% biofuel in refining mix
1% pa improvement in
efficiency
Source: Company data, Goldman Sachs Global Investment Research
12 October 2018 16
Goldman Sachs

Scope 3: A broad range of initiatives available, from renewables to natural sinksScope 3 GHG emissions are predominantly related to the fuel combustion by end users,after Big Oils have sold them the products. Therefore, the main initiatives available tolower carbon intensity relate to product shifts and carbon sequestration/natural sinks. Inparticular, we have assumed that Big Oils can deliver the following:
Increase petrochemical capacity by 5% vs. refining output.1.
Build an integrated value chain in power, with power sales equivalent to 10% of2.energy sold, assuming 50% is fuelled by CCGT plants (gas-fired) and 50% byrenewables (wind, solar).
1% per annum production shift to gas from oil, with max 65% gas in the3.hydrocarbon mix.
Carbon capture & natural sinks, assuming they can offset 5% of total CO2 emitted.4.
Increase the share of biofuels in the refined products sale mix by 10%.5.
Oil and Gas Climate Initiative (OGCI): a Big Oils-led initiative leading coordinated action on CCUS
technologies, flaring and methane emission reductions
The Oil and Gas Climate Initiative (OGCI) is a voluntary Big Oils-led initiative, launched at the September2014 UN Climate Summit, committed to the direction set out by the Paris Agreement on climate change.The OGCI aims to act as a catalyst for wider investment by individual companies, by (1) collaborating andsharing knowledge on climate change, (2) investing in technologies to combat it, and (3) setting emissionstargets for members to follow. Members include BP, ENI, Equinor, Pemex, Petrobras, Repsol, SaudiAramco, RDShell and TOTAL. ExxonMobil, Chevron, Occidental Petroleum and CNPC recently joined theorganisation. All members contribute $100mn to the OGCI investment fund, and pledge to abide by alltargets set.
In 2016, a $1bn+ investment fund (OGCI Climate Investments) was initiated to invest in technologies,projects and business solutions with the ambition to deliver >1GtCO2eq avoidance per annum by the endof the fund’s 10-year life, with investments focusing on three main objectives: (1) reducing methaneleakage, (2) reducing carbon dioxide, and (3) recycling carbon dioxide (CCUS). Since it became operational,eight investments have been made including investment into three emerging CCUS technologies, in whichOGCI aspires to become a major contributor.
A recent initiative was to set its first collective methane target. Signing members have committed toreduce methane intensity (upstream methane emissions over gas sold) to below 0.25% by 2025, with anultimate ambition to reduce this intensity to 0.20%. From a baseline of 0.32% in 2017, reaching the targetwould translate into a collective methane emissions reduction of >30%, equivalent to 600mn t ofmethane annually by 2025.
12 October 2018 17
Goldman Sachs

We note that the GHG accounting benefit from the full set of initiatives could only beenjoyed by companies that follow the final product sold methodology for scope 3 GHGemissions calculation, and even then not all of them include petrochemical products inthe calculation. The companies that calculate scope 3 on refined product sales or onupstream production can only benefit from some of these initiatives, as signalled by thegrey area in the table below. For RDShell, BP, Equinor and ENI (highlighted in greybelow), we have assumed 5% of renewable built as part of the energy production mix,while for the companies that calculate scope 3 on product sales, we have given themthe benefit of selling 10% of power as a % of total final sales (of which we assume halfis sourced from third party).
The five key levers of scope 3 emission reduction1. Petrochemicals (-3% in GHG scope 3 emissions by 2030): Petrochemicals is a lowcarbon product of oil & gas and generates zero scope 3 emissions, as the carbon issequestered in the material produced and does not get released into the atmospherethrough a combustion process. It is not clear whether or not it should be considered inthe calculation of the carbon intensity for Big Oils, given that it is not an energy productused for combustion. RDShell and TOTAL, for instance, have so far decided to excludepetrochemicals from their GHG emissions and carbon intensity calculations, given itsnon-energy usage. Whether or not petrochemical output is considered in the carbonintensity calculations, we believe that it will be an important part of Big Oils’ low carbonstrategy as a low carbon output of oil & gas feedstock. In this analysis, we assume thata 5% increase in petrochemical capacity (as % of refining outturn) for the group couldlead to a c.3% reduction in scope 3 carbon intensity by 2030 (from 2017).
We list below global petrochemical players within our global coverage that couldpotentially provide a strategic fit with Big Oils, if they planned to pursue inorganicexpansion, although this hasn’t happened for the past decade, with the exception of theannounced acquisition of a control stake in Sabic by Saudi Aramco. Instead, Big Oilshave invested organically to grow their petrochemicals business, with material organicexpansion plans for Exxon, TOTAL and Shell.
Exhibit 30: Accounting for the current scope 3 methodologies adopted by EU Big Oils, we believe GHG emissions could be lowered by 17%by 2030 on aggregateGHG reduction initiatives on scope 3 by company (MtCo2eq)
Scope 3
GHG reductions (MtCo2eq)
RDShell 579.0 22.6 20.5 29.0 20.0 486.9 -16%TOTAL 400.0 32.3 14.0 20.0 15.5 318.2 -20%BP 412.0 17.3 13.8 20.6 15.4 344.9 -16%Equinor 310.0 14.2 10.8 15.5 269.5 -13%ENI 228.6 11.6 9.8 11.4 195.8 -14%Galp 36.4 1.9 1.2 1.8 3.0 28.5 -22%OMV 108.0 2.1 5.0 2.5 5.4 2.4 90.5 -16%Repsol 149.0 4.5 7.1 0.9 7.5 9.2 119.8 -20%EU Big Oils 2,223.0 6.5 112.1 73.6 111.2 65.5 1,854.1 -17%
10% biofuel in refining mix 2030E % reduction2017 Increase in petchem
capacity (5%)
10% energy sold is power (50% CCGT, 50% renewables), incl. EVs
1% pa shift to gas (max 65% of
hydrocarbon mix)
CCS and natural sinks (5% of energy
mix)
Source: Company data, Goldman Sachs Global Investment Research
12 October 2018 18
Goldman Sachs

2. Build an integrated power business (-6% in GHG scope 3 emissions by 2030)
Big Oils have always been vertically integrated in oil, from production to retail. Webelieve the coming decade will see them integrating vertically in gas and power,leveraging their brand and trading capabilities to acquire gas and power customers. Webelieve that this will entail the acquisition of low-cost utility ‘challengers’ in OECDcountries where Big Oils have a material retail presence (Exhibit 33). We assume thatpower sales will end up constituting 10% of their energy sales by 2030, sourced 50/50from gas-fired power plants and renewables. We also assume that half of the powergeneration will be in-house and half will be sourced from third parties. We estimate thatthe renewables build-up will absorb c.10% of Big Oils’ capex in the coming years,assuming a load factor of 25%/35% for solar/wind, and costs reduction of 45%/27% by2030 (from the 2017 base).
Exhibit 31: List of petrochemical companies and details on activitiesMarket cap as of 03/10/2018
Company name Country Market Cap Company Activities
LyondellBasell Industries NV US US$ 41.4bn
Company produces plastics, polymers, chemicals. High focus on olefins & polyolefins (O&P). Intermediates & derivatives division includes methanol and oxides and refining segment produces gasoline, ultra-low sulphur diesel, jet fuel, aromatics. Company also has active refining and technology divisions.
PolyOne Corp US US$ 3.5bnProduction of advanced composites, engineered polymer formulations, plasticizers and synthetic esters, polymer additives, polymer colourants, printing & marking inks, thermoplastic elastomers and vinyl formulations.
Covestro Germany EUR 15.8bn
High-tech polymer materials including polyurethanes (PUR), polycarbonates (PCS) and coatings, adhesives, specialties (CAS). With regards to sustainability solutions, Covestro developed a technology that creates raw materials for plastics from CO2, renewable hardeners for coatings and aniline production from bio-based materials.
Huntsman Corp US US$ 6.4 bn
Huntsman’s four business divisions include polyurethanes, performance products, advanced materials and textile effects (dyes, inks). Performance materials includes an energy sub-divison which focuses on material development for solar cells, chemicals (surfactants) for Enhanced Oil Recovery (EOR) and agents for more efficient wind energy.
Westlake Chemical Corp US US$ 10.9 bn Company specializes in products including olefins (ethylene, polyethylene, styrene), vinyls and polyethylene. Sustainability initiatives include the planting of 175 acres of wetlands in Louisiana.
Trinseo SA US US$ 3.4 bnGlobal material solutions provider and manufacturer of plastics, latex binders and synthetic rubber. Two main divisions include performance materials (latex binders, synthetic rubber, performance plastics) and basic plastics & feedstocks (basic plastics, feedstocks, styrenics).
DowDuPoint Material spin out "Dow" US n/a DowDuPoint materials science division focuses on producing performance materials and coatings, packaging & specialty plastics, industrial intermediates & infrastructure products.
Source: Bloomberg, Company data
Exhibit 32: We believe EU Big Oils will allocate c.10% of their capex budget to renewables by 2030Analysis on renewable capex needed for EU Big Oils
Mtoe Mtoe Mtoe % GW US$bn Mtoe % GW US$bn US$bn % US$bn
Oil production
Gas production
5% of energy produced
(renewables)
Load factor
Capacity needed
Capex needed pa (2017-30)
5% of energy produced
(renewables)
Load factor
Capacity needed
Capex needed pa (2017-30)
Avg capex needed pa (2017-
30)
% of 2019 GSe capex
Company guidance
RDShell 91 97 9 50 1.55 9 36 2.93 2.24 9% $1-2bn paTOTAL 67 61 6 34 1.05 6 24 1.99 1.52 12% $1-2bn paBP 68 59 6 34 1.04 6 24 1.96 1.50 10% $0.5bn paEquinor 50 49 5 26 0.81 5 19 1.54 1.18 11% 15-20% capexENI 42 48 5 24 0.74 5 17 1.41 1.07 12% €1.4bn (2018-21)Galp 4 0 0 1 0.04 0 1 0.07 0.05 5% 5-15% capexOMV 9 14 1 6 0.19 1 4 0.36 0.28 10% $0bnRepsol 13 23 2 9 0.29 2 7 0.55 0.42 9% €2.5bn (2018-20)
Solar Wind (onshore 80%/offshore 20%) Capex needed (50% solar/50% wind)
25% 35%
Source: Company data, Goldman Sachs Global Investment Research
12 October 2018 19
Goldman Sachs

Big Oils could opt for inorganic options to broaden their customer base, andprogressively become more vertically integrated in gas and power. As highlighted above,building an integrated power business could help Big Oils lower GHG scope 3 emissionsby 6% (from 2017). As of today, the most significant transaction was TOTAL’s acquisitionof Direct Energie (the third largest player in France after EDF and ENGIE), boosting itscustomer base from 1.5m to c.4m with the aim to reach 6-7m by 2022 (c.15% of marketshare). Below, we have compiled a list of independent electricity suppliers by country.
Exhibit 33: List of emerging ‘challenger’ electricity suppliers and market share in country, based on reported volumes of electricitysupplied*Based on 2016 data with the rest based on 2017
United States* Market share United Kingdom Market share Italy Market shareCPL Retail Energy 3.3% OVO 3.0% Axpo Group 1.4%Just Energy 1.3% First Utility 3.0% Sorgenia 1.2%Amigo Energy 1.2% Utilita* 1.8% Gala 1.2%Ambit Energy 0.7% Flow Energy 0.9% Dolomiti Energia 1.2%IGS Energy 0.7% Octopus Energy 0.3% Metaenergia 1.1%Cirro Energy 0.1% Bristol Energy 0.2% EnergeticSource 0.8%
PFP Energy* 0.1% SC Holding 0.8%Alperia 0.8%
France Duferco 0.7%Germany enercoop 0.1% Repower 0.6%eprimo 2.2% ekWateur 0.1% Egea 0.6%Lichtblick 2.2% Vert et Lille 0.1%Entega 1.1% Alterna 0.1%123 Energie 0.9% Mint Energie 0.0%
Netherlands SpainOxxio / Eneco 25.3% CHC (EDP Group) 2.5%Budget Energie/NLE 6.3% Fenie Energia 1.7%Green Choice 3.9% Clidom (Holaluz) 0.8%
*Based on 2016 data with the rest based on 2017
Source: ARERA, Selectra, Statistica, CMNC, Company data
12 October 2018 20
Goldman Sachs

Renewable energy: Wind and solar
Solar Photovoltaic (PV) uses solar panels (modules) to convert sunlight into electricity. These panels aremade up of two back-to-back oppositely charged silicon solar cells. Since 2010, levelised costs of energy(LCOE) for large-scale solar PV have fallen by c.80%, and our Utilities team believes this will continue dueto cheaper equipment costs, lower opex and better module efficiency (i.e. higher load factors). Costreductions have resulted in vast discounts between solar PV LCOE and forward power curves acrosssome regions in Europe (mainly Spain and Italy), suggesting compelling short-term economics forinvestment. Longer term, the team believes these trends in Europe are likely to continue, estimating10%-25% reduction by 2023 and 30%-50% by 2030. Cheaper economics would in turn fuel sustainedcapacity growth.
Wind energy uses turbines to convert the kinetic energy of wind into electricity. The wind turns two orthree propeller-like blades around a rotor (connected to a shaft) which spins a generator to createelectricity. As highlighted by our Utilities analysts, Europe is seeing a fundamental shift in its powergeneration mix at a much faster pace than they previously expected. Beyond wind onshore and solar PV,wind offshore is expected to play a key role in this transition. They expect the decrease in costs foroffshore (c.50% on average by 2030) to accelerate global installations to levels above previousexpectations, with installed capacity increasing nine-fold through 2017-30E. As costs of wind offshorecontinue to decline – below the wholesale power price by 2028E - annual installations are expected tocontinue accelerating as dependency on subsidies fall. This, along with political support/subsidies, will, intheir view, encourage an acceleration of offshore growth, with 2021-30E annual installations c.70% higherthan through 2017-20E, focused in Europe (55%), with Asia (33% of installations) and the US (12% ofinstallations) gaining market share.
Exhibit 34: Spain’s solar LCOE is c.45% below forwards andwill keep decliningSpain: Solar PV LCOE evolution vs 2019 power forward, €/MWh
Exhibit 35: We expect costs for offshore wind to decrease by80% by 2030E vs. 2016LCOE – wind offshore and onshore vs. wholesale power prices
0
20
40
60
80
100
120
140
2010
2011
2012
2013
2014
2015
2016
2017
2018
E
2019
E
2020
E
2021
E
2022
E
2023
E
2024
E
2025
E
2026
E
2027
E
2028
E
2029
E
2030
E
Sola
r PV
LCO
E (€
/MW
h)
2019 FW: €55/MWh
Merchant PPA opportunity
0
20
40
60
80
100
120
140
160
180
2015
2016
2017
2018
E
2019
E
2020
E
2021
E
2022
E
2023
E
2024
E
2025
E
2026
E
2027
E
2028
E
2029
E
2030
ELCO
E (€
/MW
h) v
s. W
hole
sale
pow
er p
rice
Wind offshore Wind onshore Wholeslae power price
Source: Bloomberg, IRENA, Goldman Sachs Global Investment Research Source: Bloomberg, Goldman Sachs Global Investment Research
12 October 2018 21
Goldman Sachs

3. Shift in production from oil to gas (-3% in GHG emissions by 2030)
Big Oils’ shift towards gas production started in 2000, as shown in Exhibit 36, driven bythe growing importance of gas for industrial use and power generation and by the birthof a global LNG gas market. The recent policy shift in China towards a moreenvironmentally friendly energy mix, with gas moving from c.6% to a targeted c.15% ofthe energy mix, is providing a further push to global gas, and specifically LNG demand.Big Oils have a major role to play in LNG, due to the complexity and capital intensity ofthe plants and economies of scale on both production and marketing. We expect BigOils to accelerate the pace of LNG project FIDs in the coming years, with gas and LNGprojects set to represent >70% of their Top Projects reserves sanctioned in 2018/19.
Gas projects have the advantage of being less carbon intensive than oil (c.300 vs. c.490kgCO2eq/boe) and we believe that Big Oils will facilitate the shift from coal to gasglobally, with a larger presence in LNG production, transportation and marketing. BigOils’ global scale and risk management provides them with a clear competitiveadvantage at a time when utilities customers are more reluctant to sign long-termcontracts and project financing becomes more difficult for smaller players to obtain.
There is a gap in LNG supply growth in 2020-23, signalling an incoming tight marketWe are coming towards the end of the delivery of the record number of LNG FIDs in2011-14, with the final wave of LNG projects set to come on-stream in 2018-19.Although this record wave of LNG supply was a concern, the shift in Chineseenvironmental policy from coal towards gas is having a comparable impact on globalLNG demand as the Fukushima nuclear incident had in 2011. We believe that the LNGmarket will become increasingly tight until a new wave of LNG projects start to comeonstream in 2023.
Exhibit 36: Gas has been a growing part of Big Oils’ energy mix,now at c.45% of total productionSeven Sisters gas exposure (as % of total oil and gas production)
Exhibit 37: After 4 years of under-investments, we are entering anew LNG construction phaseTop Projects reserves sanctioned by the ‘Seven Sisters’ (RDShell, BP,TOTAL, ENI, Equinor, ExxonMobil, Chevron)
25%
30%
35%
40%
45%
50%
2000
2001
2002
2003
2004
2005
2006
2007
2008
2009
2010
2011
2012
2013
2014
2015
2016
2017
2018
E
2019
E
Gas
as
% o
f pro
duct
ion
mix
0
2
4
6
8
10
12
14
16
18
20
2000
2001
2002
2003
2004
2005
2006
2007
2008
2009
2010
2011
2012
2013
2014
2015
2016
2017
2018
E
2019
E
Rese
rves
san
ctio
ned
(bn
boe)
Oil Gas LNG
Source: Company data, Goldman Sachs Global Investment Research Source: Company data, Goldman Sachs Global Investment Research
12 October 2018 22
Goldman Sachs

Within EU Big Oils, we see RDShell as best positioned to benefit from increasing LNGdemand: it has the largest share of LNG production capacity to total group production(>15% of 2017 reported figures, with twice that level of LNG marketed). Equinor andENI have the smallest exposure within the group. All the companies have a materialpipeline of new LNG projects to sanction, with the exception of Chevron and Equinor.
Exhibit 38: We are coming towards the end of this wave of LNGsupply growth...LNG volume additions in mtpa by country
Exhibit 39: ...with the second wave to add capacity from 2023,although still largely uncommittedLNG volume additions in mtpa by development status
0
10
20
30
40
50
60
70
2010
2011
2012
2013
2014
2015
2016
2017
2018
E
2019
E
2020
E
2021
E
2022
E
2023
E
2024
E
2025
E
LNG
cap
acity
add
ition
(mtp
a)
US Australia Mozambique Senegal Nigeria Qatar Papua New Guinea Canada Others
0
10
20
30
40
50
60
70
2010
2011
2012
2013
2014
2015
2016
2017
2018
E
2019
E
2020
E
2021
E
2022
E
2023
E
2024
E
2025
E
LNG
cap
acity
add
ition
(mtp
a)
Producing Under development Pre-sanction
Source: Goldman Sachs Global Investment Research Source: Company data, Goldman Sachs Global Investment Research
Exhibit 40: RDShell is the most exposed to LNG both in absolute terms and as a % of its total productionLNG production capacity (producing, under dev.) and as % of 2017 total oil & gas production by company
0%
5%
10%
15%
20%
25%
30%
0
10
20
30
40
50
60
RD
Shel
l
Che
vron
Tota
l
BP
Exxo
nMob
il
Con
ocoP
hillip
s
ENI
Equi
nor
LNG
pro
d. /
unde
r dev
as
% o
f 201
7 O
&G
pro
d.
LNG
pro
duct
ion
capa
city
(mtp
a)
Production (2017) Under Development Pre-Sanction LNG production / under dev. as % of 2017 O&G prod.(RHS)
Source: Company data, Goldman Sachs Global Investment Research
12 October 2018 23
Goldman Sachs
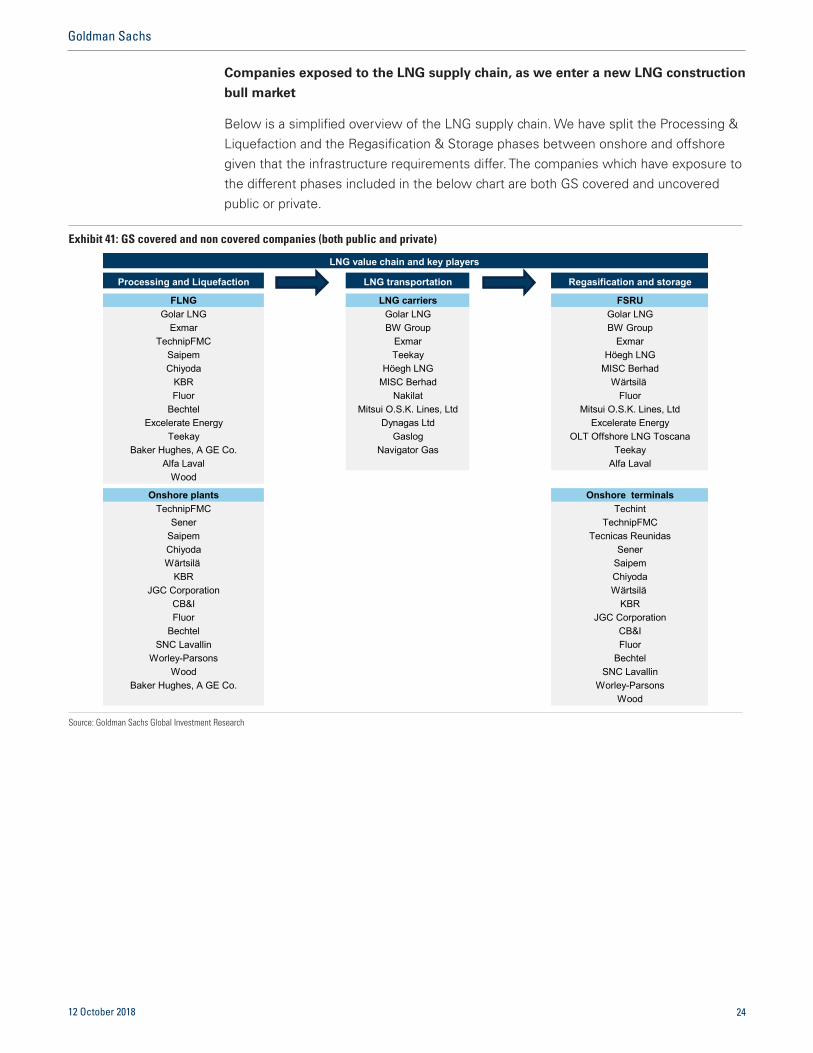
Companies exposed to the LNG supply chain, as we enter a new LNG construction
bull market
Below is a simplified overview of the LNG supply chain. We have split the Processing &Liquefaction and the Regasification & Storage phases between onshore and offshoregiven that the infrastructure requirements differ. The companies which have exposure tothe different phases included in the below chart are both GS covered and uncoveredpublic or private.
Exhibit 41: GS covered and non covered companies (both public and private)
Processing and Liquefaction LNG transportation Regasification and storage
FLNG LNG carriers FSRUGolar LNG Golar LNG Golar LNG
Exmar BW Group BW GroupTechnipFMC Exmar Exmar
Saipem Teekay Höegh LNGChiyoda Höegh LNG MISC Berhad
KBR MISC Berhad Wärtsilä Fluor Nakilat Fluor
Bechtel Mitsui O.S.K. Lines, Ltd Mitsui O.S.K. Lines, LtdExcelerate Energy Dynagas Ltd Excelerate Energy
Teekay Gaslog OLT Offshore LNG ToscanaBaker Hughes, A GE Co. Navigator Gas Teekay
Alfa Laval Alfa LavalWood
Onshore plants Onshore terminalsTechnipFMC Techint
Sener TechnipFMCSaipem Tecnicas ReunidasChiyoda SenerWärtsilä Saipem
KBR ChiyodaJGC Corporation Wärtsilä
CB&I KBRFluor JGC Corporation
Bechtel CB&ISNC Lavallin Fluor
Worley-Parsons BechtelWood SNC Lavallin
Baker Hughes, A GE Co. Worley-ParsonsWood
LNG value chain and key players
Source: Goldman Sachs Global Investment Research
12 October 2018 24
Goldman Sachs

4. Carbon capture and storage (CCS) and natural sinks (-5% in GHG emissions by
2030)
So far we have looked at initiatives to reduce gross carbon emissions, but anotherimportant element to reduce net carbon emissions will be carbon capture & storage andnatural sinks, such as reforestation. Among Big Oils, RDShell and TOTAL highlight theimportant role that natural sinks could have in reducing their long-term net carbonemissions.
RDShell has a 10% stake in the Quest CCS project in Canada, which has captured andstored >1mtCO2 in 2017. Equinor captured and stored 1.35mtCO2 in 2017 at its Sleipnerand Snøhvit fields in Norway, with c.22mtCO2 to date. TOTAL is targeting to spend up to10% of its overall R&D budget ($0.9bn in 2017) to research into the CCUS technology.ExxonMobil is conducting proprietary research and captured in 2016 around 6.3MtCO2for storage.
CCS at this point in time still appears expensive relative to other low carbontechnologies, at around $100 per ton of CO2 avoided. This compares with an estimatedcost of c.US$10-20 per ton of CO2 avoided through natural sinks (i.e. reforestation,aforestation); this is calculated using an average CO2 sequestration by tree factor (EPA),across the life of the tree life. We note that the re-forestation carbon capture impactstarts to be material as we approach the second half of a tree’s life and is minimal in thefirst years.
The estimated cost of employing CCS depends on the type of plant where thetechnology is adopted, with natural gas processing, ammonia and bio-ethanol productionplants being the lowest cost applications and iron, steel and cement the highest. Themain differentiation in costs arises from the capture of CO2 emissions, with the cost oftransport and storage costs being substantially lower and more consistent acrossapplications.
12 October 2018 25
Goldman Sachs

Carbon Capture and Storage (CCS)
Carbon dioxide capture and storage (CCS) underlines the utilization of a vast range of technologies andprocesses designed to capture the majority of CO2 emissions from large industrial point sources and storeit. CCS is commonly also referred to as CCUS (Carbon Capture, Use and Storage), indicating furtherutilization in addition to the capture of CO2. Although the technology remains as of today at apre-commercial stage, CCS technologies provide some of the most promising solutions to the globalclimate change and global warming problem.
The CCS chain constitutes processes that can be broadly categorized into three major parts:
The separation and capture of CO2, from gaseous emissions to achieve a high purity stream,1.
achievable through industrial techniques typically classified as pre-combustion, post-combustion andoxy-fuel capture.
The subsequent transport of captured CO2, from its production site to suitable geological formations2.
for storage. Typically transport occurs through pipelines.
The storage of CO2 through various forms, primarily in deep geological formations which may be3.
former oil & gas fields, saline formations or depleting oil fields. When CO2 is injected into an oil field torecover oil reserves, the method is known as Enhanced Oil Recovery (EOR). Ocean and mineralstorage options also exist.
The major concern associated with CCS is the potential leakage and its subsequent resurfacing whichwould impair the overall effectiveness of its confinement while potentially damaging aquatic ecosystems.As a result, risk assessments of potential leakage sources should be conducted for all major projects.
Currently, there are 16 large-scale CCS projects operating globally with a combined capture capacity of 36MtCO2eq per annum. Given the potential effectiveness of CCS in capturing CO2 emissions that wouldhave otherwise been added to the atmosphere, companies can utilise the technology to meet their targetsand the SDS.
12 October 2018 26
Goldman Sachs

5. Biofuels (-3% in GHG emissions by 2030)
Big Oils’ exposure to biofuels includes both production and purchase of biodiesel andbioethanol. Regulation plays an important role in the biofuel industry, with legislationsuch as the US Renewable Fuel Standard (RFS) providing a market for an otherwisecostly product - the RFS has set a target c.11% blend as % of total fuel sold (c.20bngallons of biofuels blended in products) for 2019, while the EU legislation has set a 14%target by 2030.
RDShell has the largest exposure to biofuel with 0.76mn t of biofuel produced in itsRaizen site, and additional purchases leading to a total of c.6mn t of biofuel blended infuel sold in 2017 (c.3% of refining outturn). TOTAL similarly has relatively high biofuelexposure, with c.2.3mn t incorporated into diesel and gasoline fuels sold in 2017 (c.2%of refining outturn). Galp and OMV are similarly positioned (2%), with OMV purchasingc.0.6mn t of biofuels in 2017, and Galp leveraging purchases and its palm oil project inBrazil to incorporate a total of c.0.36mn t in 2017.
Future biofuel targets involve a focus on increasing production capacity. ENI is deliveringon an ambitious expansion plan to reach 1+ mn t of biofuel production by 2021, helpedby the ramp-up of the Venice and the start-up of Gela (0.75mn t) green refineries.TOTAL’s start-up of la Mede adds 500kt of capacity in 2018. Galp, on the other hand,sets a target of incorporating 10% biofuels in gasoline and diesel by 2020. We assumethat the group can increase its share of biofuels in the oil product mix by 10% by 2030,through a mix of third-party sourcing and equity production. ‘NA’ in the table belowrefers to companies that do not disclose both volumes.
Exhibit 42: On average, Big Oils’ exposure to biofuels (2% of refining outturn) is still relatively smallGlobal Big Oils’ exposure to biofuels, and as % of refining outturn/capacity when available
2017 Biofuels - (mnboe) Refining outturn Produced / Purchased % of Refining OutturnTOTAL 667 14 2%BP 627 NA NARDShell 1,011 33 3%Equinor 136 0 0%ENI 192 1 1%Repsol 384 NA NAGalp 120 2 2%OMV 117 3 2%ExxonMobil 1,795 NA NAChevron 606 NA NAAverage 3,254 52 2%
Source: Company data, Goldman Sachs Global Investment Research
12 October 2018 27
Goldman Sachs

Biofuels
Biofuels are fuels produced from organic feedstock, in which CO2 emitted from fuel consumption is offsetby that sequestered during feedstock growth, and are as a result considered to be low carbon emitters ona lifecycle basis. The wide range of available organic feedstocks gives rise to many different biofuels, andso emissions savings are also variable - we adopt the EU legislative definition for biofuel, in which at least50% of emissions savings must be achieved when compared to conventional fuels.
Biofuels are categorised into three different classes: 1st, 2nd, and 3rd generation, with 1st generationreferring to biofuels manufactured from food feedstocks, 2nd from agricultural residues or non-foodfeedstock, and 3rd from algae. 1st generation biofuels currently represent >75% of biofuels blended intransport fuels in the EU, with the main risk related to food supply. Recent technology advancementsallowed for the development of 2nd generation biofuels, which use agricultural residues or non-foodfeedstocks. The EU legislation (RED II) has capped 1st generation fuel blend to 7% of the 2030 14% blendtarget (2017 blend at c.4.2%), leaving the bulk of demand growth for 2nd generation biofuels (2017 blendc.1.2%). 3rd generation biofuels (derived from algae) are not yet seen as a direct competitor, since theproduction methods are not yet scalable. ExxonMobil is currently working on this issue, and partneredwith Synthetic Genomics with the goal of producing 10k barrels of algae biofuels a day by 2025.
Hydrotreated Vegetable Oil (HVO)
Hydrotreated Vegetable Oil (HVO) is a form of 2nd generation renewable diesel produced from treatingvegetable oil and animal fat, and has lower emissions and better engine properties than traditionalbiodiesel. Neste is as of today the world’s largest producer of renewable diesel (HVO) with c.60% ofmarket share. HVO renewable diesel is chemically near identical to fossil diesel, and there is therefore nolimit to how much can be blended - previous biofuels had a ‘blend wall’, where additional biofuel blendwould negatively affect engine performance. One of the key differentiator is that, as opposed to previousesterification produced biofuels, HVO uses hydrogen as a catalyst in much the same way as traditional fuel- the refinery infrastructure costs are therefore highly reduced, with existing refining units being feasiblyadapted.
Exhibit 43: HVO is growing fast...EU HVO production (LHS) and as % of 1st and 2nd generationbiodiesel production
Exhibit 44: ...supported by favourable legislation in the EUEU transport biofuel target on the blending of conventionalbiofuels (RED II)
0%
5%
10%
15%
20%
25%
30%
35%
40%
45%
50%
0.0
0.5
1.0
1.5
2.0
2.5
3.0
2009 2010 2011 2012 2013 2014 2015 2016 2017 2018 As %
of E
U 1
st/2
nd g
en. b
iodi
esel
pro
d. (%
)
EU H
VO P
rodu
ctio
n (b
n lit
res)
EU HVO production - LHS As % of EU 1st/2nd generation production - RHS
0%
1%
2%
3%
4%
5%
6%
7%
8%
2021 2022 2023 2024 2025 2026 2027 2028 2029 2030
EU T
rans
port
Bio
fuel
Ble
nd T
arge
ts (%
)
Maximum First Gen. Blend Minimum Second Gen. Blend
Source: United States Department of Agriculture Source: European Commission
12 October 2018 28
Goldman Sachs

A clear de-carbonization strategy should help Big Oils address theconcerns of the fossil fuel divestment movement
Big Oils can meet the IEA 2DS, with a cleaner and more profitable portfolioThe fossil fuel divestment movement is gathering pace, with the number of institutionsdivesting coal investments up five-fold over the past four years. We believe that it is veryimportant for Big Oils to lay out a strategy towards becoming Big Energy, with a carbonintention path consistent with a 2° C scenario, in order to avoid the divestments andde-rating that the coal sector has experienced over the past five years. Launched inNovember 2017 by the Canadian and UK governments, the Powering Past Coal Allianceaims to ‘advance the transition away from unabated coal power generation’. Theorganization now counts 74 members, including 28 national governments, 18subnational governments and 28 companies. In addition to this, we’ve noticed that agrowing number of investors and financial institutions have announced bans orrestrictions on coal investments, particularly from 2013, which have in our view been adriver of the sector de-rating over the past five years.
Exhibit 45: As a growing number of institutions pledge to exit coal investments, the EV/EBITDA multiple forcoal stocks contractedNumber of divesting institutions (LHS) vs Coal stock EV/EBITDA (c.20% of global coal production)
0.0x
1.0x
2.0x
3.0x
4.0x
5.0x
6.0x
7.0x
8.0x
9.0x
10.0x
0
200
400
600
800
1,000
1,200
2014 2015 2016 2017 2018
EV/E
BIT
DA
(x)
No.
of D
ives
ting
Inst
itutio
ns
No. of Divesting Institutions (LHS) EV/EBITDA (Coal stocks - RHS)
Source: FactSet, DivestInvest, 350.org
12 October 2018 29
Goldman Sachs

The quotes that follow are taken from press releases issued by the respectiveinstitutions over the past two years.
Norges: “The Ministry of Finance introduced a product related criterion under theGuidelines for observation and exclusion from the Government Pension Fund [...] Thecriterion states that coal power companies and mining companies who themselves, orthrough other operations they control, base 30 percent or more of their activities oncoal, and/or derive 30 percent of their revenues from coal, may be excluded from theGPFG. Coal in this case refers to thermal coal.”
Zurich Insurance Group: “The company will divest from equity holdings in companiesthat derive more than half of their revenues from mining thermal coal, or utilitycompanies that generate more than half of their energy from coal. It will not invest innew debt issued by such companies and will run off existing holdings.”
AXA: “AXA decided two years ago to divest Euro 500 million from the coal industry bytargeting companies which derive over 50% of their revenues from coal. Today, theGroup decided to increase its divestment fivefold to reach Euro 2.4 billion, by divestingfrom companies which derive more than 30% of their revenues from coal, have acoal-based energy mix that exceeds 30%, actively build new coal plants, or producemore than 20 million tonnes of coal per year.”
ING: “ING has decided to accelerate the reduction of our financing to coal powergeneration, reducing our exposure to close to zero by 2025.”, “By the end of 2025, we’llno longer finance clients in the utilities sector that are over 5% reliant on coal firedpower in their energy mix. We will however continue to finance non-coal energy projectsfor these clients in support of their energy transition.”
Deutsche Bank: “The bank has revised its approach to coal financing and amended itsguidelines governing coal power and mining. Deutsche Bank and its subsidiaries will notgrant new financing for greenfield thermal coal mining and new coal-fired power plantconstruction. Moreover, the bank will gradually reduce its existing exposure to thethermal coal mining sector.”
JP Morgan: “We will not finance transactions that involve asset-specific financingwhere the proceeds will be used to develop a new greenfield coal mine or a newcoal-fired power plant in a high income OECD country.”
HSBC: “HSBC will stop providing financing for new coal-fired power plants as part of itsefforts to support a transition to a low-carbon economy.”
Standard Chartered: “The Group is today announcing that, save where there is anexisting commitment, it will cease providing financing for new coal-fired power plantsanywhere in the world, following detailed consultation with a range of stakeholders.”
12 October 2018 30
Goldman Sachs

Tight financing conditions create high barriers to entry; markets conditions favour the‘Seven Sisters’Reserve-based lending (RBL) has historically been the financing option of choice forE&Ps and NOCs looking for finance for new long-cycle mega-projects. The largestproviders of RBL in the 2004-09 period were the European banks, including Frenchbanks BNP Paribas/Credit Agricole, UK banks RBS/HSBC, and the Norwegian DNB.These banks have all substantially reduced their exposure to oil & gas over the pastyears and aim to further curtail exposure. Since 2014, Credit Agricole and RBS havereduced their lending exposure to the oil & gas industry from c.16% to c.5% and fromc.6% to c.0.5%, respectively. ING, another major provider of reserve-based lendingduring the previous oil price upcycle, has lowered its oil & gas exposure since 2014 byc.5% to c.16% of its total lending credit.
BNP Paribas: “The BNP Paribas Group will no longer do business with companieswhose principal business activity is the exploration, production, distribution, marketingor trading of oil and gas from shale and/or oil from tar sands.”; “The Group will notfinance any oil or gas exploration or production projects in the Arctic region.”
Credit Agricole: “Crédit Agricole announced a review of its oil and gas sector policy.This review aims to exclude the financing of the least energy efficient and mostenvironmentally hazardous hydrocarbons. This covers in particular all tar sands and extraheavy oil projects. The exclusion of offshore oil projects in the Arctic was also extendedto onshore projects. Infrastructure primarily relating to such projects is also covered.”
RBS: “If we’re going to support our customers in the long run, then it means addressingthe challenge of climate change and the risks and opportunities it presents.”
DNB: “There has been an intended reduction in corporate lending, particularly in“cyclical” areas such as oil and offshore.”; “The structure of the market for largecorporate lending was changing, with an “Americanized trend” toward greater use ofbond financing rather than bank loans.”
World Bank: “As a global multilateral development institution, the World Bank Group iscontinuing to transform its own operations in recognition of a rapidly changing world [...]The World Bank Group will no longer finance upstream oil and gas, after 2019.”
12 October 2018 31
Goldman Sachs

Appendix
This work is partially based on the carbon emission scenarios developed by theInternational Energy Agency, © OECD/IEA 2017 but the resulting work has beenprepared by Goldman Sachs International and does not necessarily reflect the views ofthe International Energy Agency.
Appendix AGHG emissions: direct or indirect?
GHG emissions are often categorised by companies under three main buckets:
Scope 1 (direct emissions) occurs from the companies’ owned or operated assets,n
including flaring, venting and fugitive emissions from oil & gas production facilities.
Scope 2 (indirect emissions) refers to emissions from purchased and consumedn
energy including electricity to run companies’ operations.
Scope 3 (indirect emissions), for the oil & gas industry, would refer to GHGn
emissions arising from the combustion of refined products; i.e. diesel, gasoline,kerosene among the most common fuel burned for transportation purposes.
12 October 2018 32
Goldman Sachs

Scope 3 calculation methodology:
* Based on E&P oil & gas production (Equinor, ENI)
** Based on refining outturn/capacity and gas volumes sold (RDShell, BP)
*** Based on oil & gas volumes sold to final customers (TOTAL, Galp, OMV, Repsol)
Exhibit 46: Scope 1, 2 and 3 emissions segmented by business activities
Source: World Resources Institute
Exhibit 47: Scope 3 methodology by company
Company Scope 3 Assumptions Emission Factor SourceEquinor* Total oil and gas equity production APIGalp*** Total oil and gas sales excluding exports: sales to direct clients and other operators including natural gas API
Repsol*** E&P production which is not processed in refineries, added to total product sales (LPG, Naphta, Gasoline, Kerosene, Gasoil, Fuel oil and Coke produced in Repsol refineries) Spanish NIR
OMV*** Total product sales volumes (excluding trading), as well as purchased goods and services and capital goods of OMV’s fully consolidated companies. IPCC
RDShell** Refinery outturn and natural gas available for sale. The refinery outturn data reflects Shell subsidiaries, and the Shell share of equity accounted investments IEA
TOTAL*** Third party sales volume - combustion of finished products sold APIBP** Production of natural gas, natural gas liquids, and refinery throughputs IPCC
ENI* Total equity production - using the IEA average refining conversion rate per barrel and a standard emission factor per product API
Source: Company data, Goldman Sachs Global Investment Research
12 October 2018 33
Goldman Sachs

Appendix BCarbon emission factors for Scope 3 refer to the carbon intensity of combustion for eachproduct assuming complete oxidation. These were compiled from the two main sourcesreferred to by companies when disclosing their Scope 3 emissions:
IPCC: The Intergovernmental Panel on Climate Change is a body set up under then
guidance of the United Nations with the sole purpose of providing the world with ascientific view of climate change and its potential impacts. It provides a detailedlibrary of emission factors both at an aggregate product level, and on a per activitybasis.
EPA: The US Environmental Protection Agency is a federal government agency withn
the mission to protect human and environmental health. Under the AP-42 theagency discloses a compilation of accurate, up to date emission factors.
Exhibit 48: Carbon intensity by fuel type (from combustion)
CO2 CH4 N2OEthanol - - - -Aviation Gasoline 70,000 75 179 412Motor Gasoline 69,300 75 179 408Kerosene 71,500 75 179 421Diesel Fuel 74,100 75 179 436Residual Fuel Oil 77,400 75 179 455Coal 101,000 25 447 595Natural gas 56,100 25 30 329
CO2 CH4 N2OEthanol 68.44 0.03 0.03 381Aviation Gasoline 69.25 0.08 0.18 386Motor Gasoline 70.22 0.08 0.18 391Kerosene 75.20 0.08 0.18 419Diesel Fuel 73.96 0.08 0.18 412Residual Fuel Oil 75.10 0.08 0.18 419Coal 103.69 0.28 0.48 580Natural gas 53.06 0.03 0.03 295
Fuel Type EPA Intensity (kgCO2e/mmBtu) Total Intensity (kgCO2e/boe)
Fuel Type IPCC Intensity (kgCO2e/TJ) Total Intensity (kgCO2e/boe)
Source: IPCC, EPA
12 October 2018 34
Goldman Sachs

Appendix CTo define biofuel lifecycle (LCC) emissions, we followed EU sustainability criteria inwhich GHG savings vs. conventional fuels range from 50% in 2017 to 60% in 2018 (onlyfor new production plants) – we remain conservative on our estimates, and define LCCsavings as 50%. As a result, scope 3 emissions are provided as a range, with the floorvalue set to zero as specified in the ‘International GHG inventory’ methodology (see UKDepartment for Business, Energy & Industrial Strategy). Independent analysis on LCCemissions were contrasted with specifications from biofuel producer Neste, whichconfirmed a LCC carbon intensity range of 8 to 50 gCo2eq/MJ (47 to 293 kgCo2eq/boe),depending on the feedstock. In our report, we focus on the low end of the range giventhe improving carbon emissions benefits of biofuels.
12 October 2018 35
Goldman Sachs

Disclosure Appendix
Reg ACWe, Michele Della Vigna, CFA, Neil Mehta, David Chreng and Alberto Gandolfi, hereby certify that all of the views expressed in this report accuratelyreflect our personal views about the subject company or companies and its or their securities. We also certify that no part of our compensation was, isor will be, directly or indirectly, related to the specific recommendations or views expressed in this report.
Unless otherwise stated, the individuals listed on the cover page of this report are analysts in Goldman Sachs’ Global Investment Research division.
GS Factor ProfileThe Goldman Sachs Factor Profile provides investment context for a stock by comparing key attributes to the market (i.e. our coverage universe) and itssector peers. The four key attributes depicted are: Growth, Financial Returns, Multiple (e.g. valuation) and Integrated (a composite of Growth, FinancialReturns and Multiple). Growth, Financial Returns and Multiple are calculated by using normalized ranks for specific metrics for each stock. Thenormalized ranks for the metrics are then averaged and converted into percentiles for the relevant attribute. The precise calculation of each metric mayvary depending on the fiscal year, industry and region, but the standard approach is as follows:
Growth is based on a stock’s forward-looking sales growth, EBITDA growth and EPS growth (for financial stocks, only EPS and sales growth), with ahigher percentile indicating a higher growth company. Financial Returns is based on a stock’s forward-looking ROE, ROCE and CROCI (for financialstocks, only ROE), with a higher percentile indicating a company with higher financial returns. Multiple is based on a stock’s forward-looking P/E, P/B,price/dividend (P/D), EV/EBITDA, EV/FCF and EV/Debt Adjusted Cash Flow (DACF) (for financial stocks, only P/E, P/B and P/D), with a higher percentileindicating a stock trading at a higher multiple. The Integrated percentile is calculated as the average of the Growth percentile, Financial Returnspercentile and (100% - Multiple percentile).
Financial Returns and Multiple use the Goldman Sachs analyst forecasts at the fiscal year-end at least three quarters in the future. Growth uses inputsfor the fiscal year at least seven quarters in the future compared with the year at least three quarters in the future (on a per-share basis for all metrics).
For a more detailed description of how we calculate the GS Factor Profile, please contact your GS representative.
M&A RankAcross our global coverage, we examine stocks using an M&A framework, considering both qualitative factors and quantitative factors (which may varyacross sectors and regions) to incorporate the potential that certain companies could be acquired. We then assign a M&A rank as a means of scoringcompanies under our rated coverage from 1 to 3, with 1 representing high (30%-50%) probability of the company becoming an acquisition target, 2representing medium (15%-30%) probability and 3 representing low (0%-15%) probability. For companies ranked 1 or 2, in line with our standarddepartmental guidelines we incorporate an M&A component into our target price. M&A rank of 3 is considered immaterial and therefore does notfactor into our price target, and may or may not be discussed in research.
QuantumQuantum is Goldman Sachs’ proprietary database providing access to detailed financial statement histories, forecasts and ratios. It can be used forin-depth analysis of a single company, or to make comparisons between companies in different sectors and markets.
GS SUSTAINGS SUSTAIN is a global investment strategy focused on the generation of long-term alpha through identifying high quality industry leaders. The GSSUSTAIN 50 list includes leaders we believe to be well positioned to deliver long-term outperformance through superior returns on capital, sustainablecompetitive advantage and effective management of ESG risks vs. global industry peers. Candidates are selected largely on a combination ofquantifiable analysis of these three aspects of corporate performance.
DisclosuresCoverage group(s) of stocks by primary analyst(s)Michele Della Vigna, CFA: Europe-Energy:Oil-Integrated, Europe-Energy:Oil-Services. Neil Mehta: America-Integrated Oils, America-Refining &Marketing. Alberto Gandolfi: Europe-Utilities.
America-Integrated Oils: Canadian Natural Resources Ltd., Cenovus Energy Inc., Chevron Corp., ConocoPhillips, Exxon Mobil Corp., Husky Energy Inc.,Imperial Oil Ltd., Kosmos Energy Ltd., MEG Energy, Suncor Energy Inc..
America-Refining & Marketing: Calumet Specialty Products Partners, CVR Energy Inc., CVR Refining LP, Delek US Holdings, HollyFrontier Corp.,Marathon Petroleum Corp., PBF Energy Inc., Phillips 66, Valero Energy Corp..
Europe-Energy:Oil-Integrated: BP Plc, BP Plc, ENI, Equinor, Galp, OMV, Repsol, Royal Dutch Shell Plc, Royal Dutch Shell Plc, Royal Dutch Shell Plc,Royal Dutch Shell Plc, Total SA.
Europe-Energy:Oil-Services: Aker Solutions ASA, CGGVeritas, Hunting Plc, John Wood Group, Petrofac, Petroleum Geo Services ASA, Saipem, Subsea7 SA, Tenaris SA, Tenaris SA, TGS Nopec, Vallourec.
Europe-Utilities: A2A SpA, Acciona SA, Centrica, ContourGlobal Plc, E.ON, EDF, EDP Renovaveis SA, Enagas, Endesa SA, Enel SpA, Energias dePortugal, Engie, Fortum OYJ, Iberdrola SA, innogy SE, Italgas SpA, National Grid Plc, Naturgy Energy Group, Nordex SE, Orsted A/S, Pennon Group,Red Electrica de Espana, REN, RWE, Severn Trent Plc, Siemens Gamesa Renewable Energy, Snam SpA, SSE Plc, Suez, Terna, Uniper SE, UnitedUtilities Group, Veolia Environnement, Vestas Wind Systems A/S.
Distribution of ratings/investment banking relationshipsGoldman Sachs Investment Research global Equity coverage universe
Rating Distribution Investment Banking Relationships
Buy Hold Sell Buy Hold Sell
Global 35% 54% 11% 64% 57% 55%
12 October 2018 36
Goldman Sachs

As of October 1, 2018, Goldman Sachs Global Investment Research had investment ratings on 2,814 equity securities. Goldman Sachs assigns stocksas Buys and Sells on various regional Investment Lists; stocks not so assigned are deemed Neutral. Such assignments equate to Buy, Hold and Sell forthe purposes of the above disclosure required by the FINRA Rules. See ‘Ratings, Coverage groups and views and related definitions’ below. TheInvestment Banking Relationships chart reflects the percentage of subject companies within each rating category for whom Goldman Sachs hasprovided investment banking services within the previous twelve months.
Regulatory disclosuresDisclosures required by United States laws and regulationsSee company-specific regulatory disclosures above for any of the following disclosures required as to companies referred to in this report: manager orco-manager in a pending transaction; 1% or other ownership; compensation for certain services; types of client relationships; managed/co-managedpublic offerings in prior periods; directorships; for equity securities, market making and/or specialist role. Goldman Sachs trades or may trade as aprincipal in debt securities (or in related derivatives) of issuers discussed in this report.
The following are additional required disclosures: Ownership and material conflicts of interest: Goldman Sachs policy prohibits its analysts,professionals reporting to analysts and members of their households from owning securities of any company in the analyst’s area of coverage.Analyst compensation: Analysts are paid in part based on the profitability of Goldman Sachs, which includes investment banking revenues. Analystas officer or director: Goldman Sachs policy generally prohibits its analysts, persons reporting to analysts or members of their households fromserving as an officer, director or advisor of any company in the analyst’s area of coverage. Non-U.S. Analysts: Non-U.S. analysts may not beassociated persons of Goldman Sachs & Co. LLC and therefore may not be subject to FINRA Rule 2241 or FINRA Rule 2242 restrictions oncommunications with subject company, public appearances and trading securities held by the analysts.
Distribution of ratings: See the distribution of ratings disclosure above. Price chart: See the price chart, with changes of ratings and price targets inprior periods, above, or, if electronic format or if with respect to multiple companies which are the subject of this report, on the Goldman Sachswebsite at http://www.gs.com/research/hedge.html.
Additional disclosures required under the laws and regulations of jurisdictions other than the United StatesThe following disclosures are those required by the jurisdiction indicated, except to the extent already made above pursuant to United States laws andregulations. Australia: Goldman Sachs Australia Pty Ltd and its affiliates are not authorised deposit-taking institutions (as that term is defined in theBanking Act 1959 (Cth)) in Australia and do not provide banking services, nor carry on a banking business, in Australia. This research, and any access toit, is intended only for “wholesale clients” within the meaning of the Australian Corporations Act, unless otherwise agreed by Goldman Sachs. Inproducing research reports, members of the Global Investment Research Division of Goldman Sachs Australia may attend site visits and othermeetings hosted by the companies and other entities which are the subject of its research reports. In some instances the costs of such site visits ormeetings may be met in part or in whole by the issuers concerned if Goldman Sachs Australia considers it is appropriate and reasonable in the specificcircumstances relating to the site visit or meeting. To the extent that the contents of this document contains any financial product advice, it is generaladvice only and has been prepared by Goldman Sachs without taking into account a client’s objectives, financial situation or needs. A client should,before acting on any such advice, consider the appropriateness of the advice having regard to the client’s own objectives, financial situation and needs.Brazil: Disclosure information in relation to CVM Instruction 483 is available at http://www.gs.com/worldwide/brazil/area/gir/index.html. Whereapplicable, the Brazil-registered analyst primarily responsible for the content of this research report, as defined in Article 16 of CVM Instruction 483, isthe first author named at the beginning of this report, unless indicated otherwise at the end of the text. Canada: Goldman Sachs Canada Inc. is anaffiliate of The Goldman Sachs Group Inc. and therefore is included in the company specific disclosures relating to Goldman Sachs (as defined above).Goldman Sachs Canada Inc. has approved of, and agreed to take responsibility for, this research report in Canada if and to the extent that GoldmanSachs Canada Inc. disseminates this research report to its clients. Hong Kong: Further information on the securities of covered companies referred toin this research may be obtained on request from Goldman Sachs (Asia) L.L.C. India: Further information on the subject company or companiesreferred to in this research may be obtained from Goldman Sachs (India) Securities Private Limited, Research Analyst - SEBI Registration NumberINH000001493, 951-A, Rational House, Appasaheb Marathe Marg, Prabhadevi, Mumbai 400 025, India, Corporate Identity NumberU74140MH2006FTC160634, Phone +91 22 6616 9000, Fax +91 22 6616 9001. Goldman Sachs may beneficially own 1% or more of the securities (assuch term is defined in clause 2 (h) the Indian Securities Contracts (Regulation) Act, 1956) of the subject company or companies referred to in thisresearch report. Japan: See below. Korea: Further information on the subject company or companies referred to in this research may be obtainedfrom Goldman Sachs (Asia) L.L.C., Seoul Branch. New Zealand: Goldman Sachs New Zealand Limited and its affiliates are neither “registered banks”nor “deposit takers” (as defined in the Reserve Bank of New Zealand Act 1989) in New Zealand. This research, and any access to it, is intended for“wholesale clients” (as defined in the Financial Advisers Act 2008) unless otherwise agreed by Goldman Sachs. Russia: Research reports distributedin the Russian Federation are not advertising as defined in the Russian legislation, but are information and analysis not having product promotion astheir main purpose and do not provide appraisal within the meaning of the Russian legislation on appraisal activity. Singapore: Further information onthe covered companies referred to in this research may be obtained from Goldman Sachs (Singapore) Pte. (Company Number: 198602165W). Taiwan:This material is for reference only and must not be reprinted without permission. Investors should carefully consider their own investment risk.Investment results are the responsibility of the individual investor. United Kingdom: Persons who would be categorized as retail clients in the UnitedKingdom, as such term is defined in the rules of the Financial Conduct Authority, should read this research in conjunction with prior Goldman Sachsresearch on the covered companies referred to herein and should refer to the risk warnings that have been sent to them by Goldman SachsInternational. A copy of these risks warnings, and a glossary of certain financial terms used in this report, are available from Goldman SachsInternational on request.
European Union: Disclosure information in relation to Article 4 (1) (d) and Article 6 (2) of the European Commission Directive 2003/125/EC is availableat http://www.gs.com/disclosures/europeanpolicy.html which states the European Policy for Managing Conflicts of Interest in Connection withInvestment Research.
Japan: Goldman Sachs Japan Co., Ltd. is a Financial Instrument Dealer registered with the Kanto Financial Bureau under registration number Kinsho69, and a member of Japan Securities Dealers Association, Financial Futures Association of Japan and Type II Financial Instruments Firms Association.Sales and purchase of equities are subject to commission pre-determined with clients plus consumption tax. See company-specific disclosures as toany applicable disclosures required by Japanese stock exchanges, the Japanese Securities Dealers Association or the Japanese Securities FinanceCompany.
Ratings, coverage groups and views and related definitionsBuy (B), Neutral (N), Sell (S) -Analysts recommend stocks as Buys or Sells for inclusion on various regional Investment Lists. Being assigned a Buy orSell on an Investment List is determined by a stock’s total return potential relative to its coverage. Any stock not assigned as a Buy or a Sell on anInvestment List with an active rating (i.e., a stock that is not Rating Suspended, Not Rated, Coverage Suspended or Not Covered), is deemed Neutral.Each regional Investment Review Committee manages various regional Investment Lists to a global guideline of 25%-35% of stocks as Buy and10%-15% of stocks as Sell; however, the distribution of Buys and Sells in any particular analyst’s coverage group may vary as determined by theregional Investment Review Committee. Additionally, each Investment Review Committee manages Regional Conviction lists, which representinvestment recommendations focused on the size of the total return potential and/or the likelihood of the realization of the return across their
12 October 2018 37
Goldman Sachs

respective areas of coverage. The addition or removal of stocks from such Conviction lists do not represent a change in the analysts’ investment ratingfor such stocks.
Total return potential represents the upside or downside differential between the current share price and the price target, including all paid oranticipated dividends, expected during the time horizon associated with the price target. Price targets are required for all covered stocks. The totalreturn potential, price target and associated time horizon are stated in each report adding or reiterating an Investment List membership.
Coverage groups and views: A list of all stocks in each coverage group is available by primary analyst, stock and coverage group athttp://www.gs.com/research/hedge.html. The analyst assigns one of the following coverage views which represents the analyst’s investment outlookon the coverage group relative to the group’s historical fundamentals and/or valuation. Attractive (A). The investment outlook over the following 12months is favorable relative to the coverage group’s historical fundamentals and/or valuation. Neutral (N). The investment outlook over the following12 months is neutral relative to the coverage group’s historical fundamentals and/or valuation. Cautious (C). The investment outlook over the following12 months is unfavorable relative to the coverage group’s historical fundamentals and/or valuation.
Not Rated (NR). The investment rating and target price have been removed pursuant to Goldman Sachs policy when Goldman Sachs is acting in anadvisory capacity in a merger or strategic transaction involving this company and in certain other circumstances. Rating Suspended (RS). GoldmanSachs Research has suspended the investment rating and price target for this stock, because there is not a sufficient fundamental basis fordetermining, or there are legal, regulatory or policy constraints around publishing, an investment rating or target. The previous investment rating andprice target, if any, are no longer in effect for this stock and should not be relied upon. Coverage Suspended (CS). Goldman Sachs has suspendedcoverage of this company. Not Covered (NC). Goldman Sachs does not cover this company. Not Available or Not Applicable (NA). The informationis not available for display or is not applicable. Not Meaningful (NM). The information is not meaningful and is therefore excluded.
Global product; distributing entitiesThe Global Investment Research Division of Goldman Sachs produces and distributes research products for clients of Goldman Sachs on a global basis.Analysts based in Goldman Sachs offices around the world produce equity research on industries and companies, and research on macroeconomics,currencies, commodities and portfolio strategy. This research is disseminated in Australia by Goldman Sachs Australia Pty Ltd (ABN 21 006 797 897); inBrazil by Goldman Sachs do Brasil Corretora de Títulos e Valores Mobiliários S.A.; Ombudsman Goldman Sachs Brazil: 0800 727 5764 and / [email protected]. Available Weekdays (except holidays), from 9am to 6pm. Ouvidoria Goldman Sachs Brasil: 0800 727 5764 e/[email protected]. Horário de funcionamento: segunda-feira à sexta-feira (exceto feriados), das 9h às 18h; in Canada by either GoldmanSachs Canada Inc. or Goldman Sachs & Co. LLC; in Hong Kong by Goldman Sachs (Asia) L.L.C.; in India by Goldman Sachs (India) Securities PrivateLtd.; in Japan by Goldman Sachs Japan Co., Ltd.; in the Republic of Korea by Goldman Sachs (Asia) L.L.C., Seoul Branch; in New Zealand by GoldmanSachs New Zealand Limited; in Russia by OOO Goldman Sachs; in Singapore by Goldman Sachs (Singapore) Pte. (Company Number: 198602165W);and in the United States of America by Goldman Sachs & Co. LLC. Goldman Sachs International has approved this research in connection with itsdistribution in the United Kingdom and European Union.
European Union: Goldman Sachs International authorised by the Prudential Regulation Authority and regulated by the Financial Conduct Authority andthe Prudential Regulation Authority, has approved this research in connection with its distribution in the European Union and United Kingdom; GoldmanSachs AG and Goldman Sachs International Zweigniederlassung Frankfurt, regulated by the Bundesanstalt für Finanzdienstleistungsaufsicht, may alsodistribute research in Germany.
General disclosuresThis research is for our clients only. Other than disclosures relating to Goldman Sachs, this research is based on current public information that weconsider reliable, but we do not represent it is accurate or complete, and it should not be relied on as such. The information, opinions, estimates andforecasts contained herein are as of the date hereof and are subject to change without prior notification. We seek to update our research asappropriate, but various regulations may prevent us from doing so. Other than certain industry reports published on a periodic basis, the large majorityof reports are published at irregular intervals as appropriate in the analyst’s judgment.
Goldman Sachs conducts a global full-service, integrated investment banking, investment management, and brokerage business. We have investmentbanking and other business relationships with a substantial percentage of the companies covered by our Global Investment Research Division.Goldman Sachs & Co. LLC, the United States broker dealer, is a member of SIPC (http://www.sipc.org).
Our salespeople, traders, and other professionals may provide oral or written market commentary or trading strategies to our clients and principaltrading desks that reflect opinions that are contrary to the opinions expressed in this research. Our asset management area, principal trading desks andinvesting businesses may make investment decisions that are inconsistent with the recommendations or views expressed in this research.
The analysts named in this report may have from time to time discussed with our clients, including Goldman Sachs salespersons and traders, or maydiscuss in this report, trading strategies that reference catalysts or events that may have a near-term impact on the market price of the equity securitiesdiscussed in this report, which impact may be directionally counter to the analyst’s published price target expectations for such stocks. Any suchtrading strategies are distinct from and do not affect the analyst’s fundamental equity rating for such stocks, which rating reflects a stock’s returnpotential relative to its coverage group as described herein.
We and our affiliates, officers, directors, and employees, excluding equity and credit analysts, will from time to time have long or short positions in, actas principal in, and buy or sell, the securities or derivatives, if any, referred to in this research.
The views attributed to third party presenters at Goldman Sachs arranged conferences, including individuals from other parts of Goldman Sachs, do notnecessarily reflect those of Global Investment Research and are not an official view of Goldman Sachs.
Any third party referenced herein, including any salespeople, traders and other professionals or members of their household, may have positions in theproducts mentioned that are inconsistent with the views expressed by analysts named in this report.
This research is not an offer to sell or the solicitation of an offer to buy any security in any jurisdiction where such an offer or solicitation would beillegal. It does not constitute a personal recommendation or take into account the particular investment objectives, financial situations, or needs ofindividual clients. Clients should consider whether any advice or recommendation in this research is suitable for their particular circumstances and, ifappropriate, seek professional advice, including tax advice. The price and value of investments referred to in this research and the income from themmay fluctuate. Past performance is not a guide to future performance, future returns are not guaranteed, and a loss of original capital may occur.Fluctuations in exchange rates could have adverse effects on the value or price of, or income derived from, certain investments.
Certain transactions, including those involving futures, options, and other derivatives, give rise to substantial risk and are not suitable for all investors.Investors should review current options disclosure documents which are available from Goldman Sachs sales representatives or athttp://www.theocc.com/about/publications/character-risks.jsp. Transaction costs may be significant in option strategies calling for multiple purchase andsales of options such as spreads. Supporting documentation will be supplied upon request.
12 October 2018 38
Goldman Sachs

Differing Levels of Service provided by Global Investment Research:The level and types of services provided to you by the Global InvestmentResearch division of GS may vary as compared to that provided to internal and other external clients of GS, depending on various factors including yourindividual preferences as to the frequency and manner of receiving communication, your risk profile and investment focus and perspective (e.g.,marketwide, sector specific, long term, short term), the size and scope of your overall client relationship with GS, and legal and regulatory constraints.As an example, certain clients may request to receive notifications when research on specific securities is published, and certain clients may requestthat specific data underlying analysts’ fundamental analysis available on our internal client websites be delivered to them electronically through datafeeds or otherwise. No change to an analyst’s fundamental research views (e.g., ratings, price targets, or material changes to earnings estimates forequity securities), will be communicated to any client prior to inclusion of such information in a research report broadly disseminated through electronicpublication to our internal client websites or through other means, as necessary, to all clients who are entitled to receive such reports.
All research reports are disseminated and available to all clients simultaneously through electronic publication to our internal client websites. Not allresearch content is redistributed to our clients or available to third-party aggregators, nor is Goldman Sachs responsible for the redistribution of ourresearch by third party aggregators. For research, models or other data related to one or more securities, markets or asset classes (including relatedservices) that may be available to you, please contact your GS representative or go to http://360.gs.com.
Disclosure information is also available at http://www.gs.com/research/hedge.html or from Research Compliance, 200 West Street, New York, NY10282.
© 2018 Goldman Sachs.
No part of this material may be (i) copied, photocopied or duplicated in any form by any means or (ii) redistributed without the prior writtenconsent of The Goldman Sachs Group, Inc.
12 October 2018 39
Goldman Sachs