Embed Size (px)
Citation preview

The Flow-Through Business Sector and Tax Reform The economic footprint of the flow-through sector and the potential impact of tax reform
Prepared for the S Corporation Association
Drs. Robert Carroll and Gerald Prante Ernst & Young LLP
April 2011
The Flow-Through Business Sector and Tax Reform
i
Executive Summary
This report examines the size and prominence of the flow-through business sector in the US
economy and how this sector could be affected by potential reform of the corporate income tax.
Flow-through businesses -- S corporations, partnerships, limited liability companies, and sole
proprietorships -- play an important role in the U.S. economy and comprise a substantial share
of economic activity. In 2008, flow-through businesses:
Accounted for nearly 95 percent of all business entities;
Employed 54 percent of the private sector work force; and,
Reported 36 percent of all business receipts.
Moreover, between 2004 and 2008 individual owners of flow-through business reported 54
percent of all business net income and paid 44 percent of all federal business income taxes.
Flow-through businesses are well represented in all areas of the country. They employ more
than one-half of the private sector work force in every state except for Delaware and Hawaii. In
Idaho, Maine, Montana, South Dakota, Vermont and Wyoming, flow-though employment
exceeds 60 percent of the private sector work force.
With the large size of this sector, it is important to consider how it fits into the overall structure of
the U.S. income tax. Flow-through business income is subject to the tax rates faced by their
individual owners. These are the rates that affect the decision-making and economic health of
these owners and the businesses they own.
The income of C corporations is instead subject to two levels of tax (the “double tax”), first when
income is earned at the corporate level, and again when the income is paid out to shareholders
in the form of dividends or retained and later realized by shareholders as capital gains.
The double tax affects a number of important economic decisions. In particular, the double tax:
Increases the cost of capital, which discourages investment and reduces capital
formation and economic growth.
Increases the cost of equity finance, which encourages greater leverage among C
corporations.
The flow-through form provides an important benefit to the economy by reducing the
economically harmful effects of the double tax and therefore allowing for a greater opportunity
for job creation and capital investment. Moreover, the flow-through form provides businesses
with flexibility that may better match their ownership structure requirements and capital needs.
Recent focus on the need to lower the corporate income tax rate has also drawn attention to
how flow-through businesses might be affected by tax reform.
With substantial evidence that the U.S corporate tax rate is out-of-step internationally, corporate
tax reform is an important component of an overall approach to improving the current tax
The Flow-Through Business Sector and Tax Reform
ii
system. However, corporate tax reform that lowers the corporate tax rate and pays for this
change by eliminating some or all business tax expenditures would raise the taxes paid by
businesses organized using the flow-through form.
With the flow-through sector representing 54 percent of all business activity, as measured both
by employment and net income, tax reform could have significant consequences for flow-
through businesses, jobs in the flow-through sector and therefore the broader economy.
Based on Ernst & Young LLP estimates, pursuing corporate-only reform that eliminates some or
all businesses tax expenditures would increase the income taxes paid by individual owners of
flow-through businesses, on average, by 8 percent or $27 billion annually from 2010 through
2014. Hardest hit would be flow-through businesses in agriculture and mining, followed by
construction and retail trade, and then manufacturing, finance, and insurance.

The Flow-Through Business Sector and Tax Reform
1
The Flow-Through Business Sector and Tax Reform
I. Introduction
Flow-through businesses – S corporations, partnerships, limited liability companies, and sole
proprietorships – play an important role in the U.S. economy.1 The vast majority of businesses in the
United States have chosen to organize as flow-through businesses. In 2008, flow-through businesses
comprise more than 90 percent of all business entities, employ 54 percent of the private-sector work
force and report 36 percent of all business receipts. Between 2004 and 2008, individual owners of
flow-through businesses received 54 percent of all business net income and paid 44 percent of all
federal business income taxes when these taxpayers file their individual tax returns.2
With the prominence of flow-through businesses, it is important to carefully consider how the flow-
through form fits into the U.S. tax system and how any particular tax reform might affect flow-through
businesses. President Obama recently called for tax reform that emphasizes the need to eliminate
“special interest loopholes and to lower the corporate tax rate to restore competitiveness and
encourage job creation.”3 While there is substantial evidence that the U.S. statutory corporate income
tax rate is out-of-step internationally, elimination of business tax expenditures to finance a lower
corporate rate can raise substantial issues for flow-through businesses. Flow-through businesses
could potentially lose the benefit of widely used business tax provisions such as accelerated
depreciation and others without the benefit of the lower corporate tax rate. Without corresponding
reform of the individual income tax, these changes would also be in addition to the higher individual
income tax rates scheduled to take effect in 2013.4
The Internal Revenue Code (the “Code”) provides businesses with considerable flexibility in how they
organize and structure their business operations. Depending on their ownership and capital needs,
businesses can choose between several different organizational forms. This distinguishes the United
States in comparison to its major trading partners and provides greater flexibility to the overall
economy.5 In addition, the flow-through form helps mitigate the economically harmful effects of the
double tax on corporate profits, in which the higher cost of capital from double taxation discourages
investment and thus economic growth and job creation. Moreover, double taxation of the return to
saving and investment embodied in the income tax system leads to a bias in firms‟ financing
decisions between the use of debt and equity and distorts the allocation of capital within the
economy. As tax reform progresses, it is important to understand and consider all of these issues with
an eye towards bringing about the tax reform that is most conducive to increased growth and job
creation throughout the entire economy.

The Flow-Through Business Sector and Tax Reform
2
II. Current tax treatment of flow-through businesses
Flow-through businesses are subject to a single level of tax on the income earned, whether or not it is
distributed. The income and expenses of flow-through businesses are reported by an entity‟s owners
– hence the name “flow-through” or “pass-through” entities. An individual owner‟s flow-through
income is combined with income they may receive from other sources and subject to individual
income taxes. Losses, rather than accumulating within the business entity level, are also passed
through to the owner where they may, subject to various limitations, be used to offset income from
other sources. Thus, it is the tax rates faced by individual owners of flow-through businesses that
affect decision-making and the economic health of these businesses.
In contrast, the income of C corporations is subject to two levels of tax, first when income is earned at
the corporate level, and again when the income is paid out to shareholders in the form of dividends or
retained and later realized by shareholders as capital gains. These two levels of tax are often referred
to as the double tax on corporate profits. C corporations can generally carry losses back for two years
and carry them forward indefinitely.
The flow-through form provides multiple options of entities with various ownership and capital
requirements that allow entrepreneurs the potential for limited liability with the flexibility needed to
choose the entity that best fits their particular business needs. Sole proprietorships are
unincorporated businesses owned by a single individual. Partnerships are unincorporated business
entities owned by two or more entities or individuals, without any limit on size or type of partner.
S corporations are domestic corporations that meet certain conditions that generally constrain their
ability to raise capital through expansion of ownership and stock issuances. S corporations, for
example, are limited to no more than 100 shareholders and one class of stock and are required to be
a domestic corporation. Also, generally only individuals may be shareholders of S corporations.
These restrictions can have the effect of reducing an S corporation‟s access to capital.
Limited liability corporations (LLCs) are flow-through business entities that combine the limited liability
feature of the corporate form with the flow-through of income and losses of the partnership form.

The Flow-Through Business Sector and Tax Reform
3
III. Economic footprint of flow-through businesses
The economic footprint of flow-through businesses has grown steadily by several different measures.
The percentage of businesses choosing the flow-through form rose from 83 percent in 1980 to 94
percent in 2008 (see Chart 1).6 The share of total receipts generated by flow-through businesses has
nearly tripled since the early 1980s with the flow-through share of total receipts rising from 13 percent
in 1980 to 36 percent by 2008. The flow-through share of net income also rose significantly, 25
percent in 1980 to 82 percent by 2008.7
Chart 1. Flow-through shares of all business returns, receipts, and net income, 1980-2008
Note: These data include some flow-through entities, primarily partnerships, which are owned by C corporations. Data focusing on individual owners of flow-through businesses are presented below in Chart 4. Source: Internal Revenue Service, Statistics of Income, Integrated Business Data.
Two changes contributed to this growth.8 First, the individual tax rate was lowered significantly
relative to the corporate tax rate under the Tax Reform Act of 1986, which had the effect of making
the flow-through form more attractive for many businesses. Second, in the late 1980s and 1990s
limited liability companies (LLCs) combined flow-through tax treatment with limited liability for their
owners9 and the classification of businesses as LLCs was simplified in 1997 by allowing them to
“check the box” on Form 1065-B to elect to be treated as a corporation or partnership (or sole
proprietorship) for tax purposes.10
As shown in Table 1 below, the flow-through sector now comprises a large fraction of business
activity not only based on number of firms and receipts/net income, but also based on the number of
workers it employs. In 2008, the flow-through sector employed 54 percent of the private sector work
force, with C corporations employing the remaining 46 percent.11 S corporations employed 25 percent
of the private sector work force, while partnerships employed 10 percent and sole proprietorships
accounted for 19 percent.12
0%
10%
20%
30%
40%
50%
60%
70%
80%
90%
100%
1980 1982 1984 1986 1988 1990 1992 1994 1996 1998 2000 2002 2004 2006 2008Number of business returns Total receipts Net income (less deficit)

The Flow-Through Business Sector and Tax Reform
4
Table 1. Private economic activity of flow-through businesses and C corporations, 2008
Total Private
Business Sector
Flow-Through Businesses
Total S Corporations Partnerships Sole
Proprietorships C corporations
Employment 125.6 68.2 31.0 13.1 24.1 57.4
Firms 26.9 25.1 3.6 1.7 19.8 1.7
Establishments 28.4 25.6 3.9 1.9 19.9 2.8
Receipts 28.7 10.2 5.6 3.1 1.5 18.5
Percent Distribution
Employment 100% 54% 25% 10% 19% 46%
Firms 100% 94% 13% 6% 74% 6%
Establishments 100% 90% 14% 7% 70% 10%
Receipts 100% 36% 19% 11% 5% 65%
Note: Units in millions, dollars in billions. Source: U.S. Bureau of the Census, Statistics of U.S. Businesses and Non-employer Statistics; receipts are from Statistics of Income Division, selected sources.
As shown in Chart 2, private sector employment within the flow-through sector is sizable and more
concentrated among smaller firms than C corporations. About 37 percent of workers within the flow-
through sector were with firms with four or fewer employees. About 52 percent of workers in the flow-
through sector held jobs in firms with fewer than 20 employees. In contrast, among C corporations 70
percent of workers held jobs in firms with more than 500 employees and 90 percent of workers held
jobs in firms with more than 20 employees.
Chart 2. Employment by size of firm, C corporation and flow-through sectors, 2008
Source: U.S. Bureau of the Census, Statistics of U.S. Businesses and Non-employer Statistics.
1-4, 3%5-9, 3%
10-19, 4%
20-99, 10%
100-499, 10%
500 & Over, 70%
C corporations
1-4, 37%
5-9, 7%10-19,
8%
20-99, 18%
100-499, 13%
500 & Over, 17%
Flow-throughs

The Flow-Through Business Sector and Tax Reform
5
Despite these differences in the relative size of flow-throughs versus C corporations, the number of
workers employed by larger flow-throughs is significant. Approximately 20 million workers are
employed by flow-throughs with more then 100 employees.
There are also considerable differences in the employment within various industries for these two
sectors, with significantly greater representation of flow-through employment in the services and
construction industries (see Chart 3). In contrast, C corporation employment is more dominant in the
manufacturing, wholesale and retail trade, and transportation industries.
Chart 3. Employment by industry, C corporation and flow-through sectors, 2008
Source: U.S. Bureau of the Census, Statistics of U.S. Businesses and Non-employer Statistics.
It is important to point out that these employment estimates are influenced by the presence of large
employers, particularly among C corporations. For example, while only 7 percent of flow-through
employment is within the manufacturing sector, more than 81 percent of all manufacturers are
organized as flow-through businesses.
Flow-through businesses are well represented in all areas of the country, representing more than
one-half of the private sector work force in every state except for Delaware (49 percent) and Hawaii
(48 percent) (state-by-state data is presented in Appendix B). Flow-through employment exceeds 60
percent of the private sector work force in six states: Idaho (65 percent), Maine (62 percent),
Montana (69 percent), South Dakota (63 percent), Vermont (63 percent) and Wyoming (62 percent).
While the foregoing data provides a picture of the economic footprint of flow-through business
entities, the owners of some flow-through businesses (primarily some partnerships13) are
corporations, not individuals. This distinction is important because individual owners of flow-through
businesses are taxed under the individual income tax. A significant amount of partnership income
flows through to corporate owners.14 This income is often associated with various types of joint
ventures between corporations.
Another important factor that makes comparisons of business entities and the flow-through income
received by individual owners difficult is that a considerable share of flow-through income takes forms
Agric & Mining,
2%
Manuf, 15%
Constr, 4%
Trade, 24%
Transp, 10%
Fin, Insur, &
Real Estate,
14%
Services, 32%
C corporations
Agric & Mining,
1%
Manuf, 7%
Constr, 10%
Trade, 15%
Transp, 5%Fin,
Insur, & Real Estate,
9%
Services, 53%
Flow-Throughs
The Flow-Through Business Sector and Tax Reform
6
other than allocated net income reported on an owner‟s Schedule C or Schedule E. For example,
individual owners of flow-through businesses can also receive allocated income in the form of capital
gains, rents and royalties. This income is reported separately from allocated net income reported on
the Schedule C or Schedule E in order for it to maintain its character and receive special tax
treatment under the Code (e.g., the special lower tax rate on long-term capital gains and the
limitations on passive activity losses).
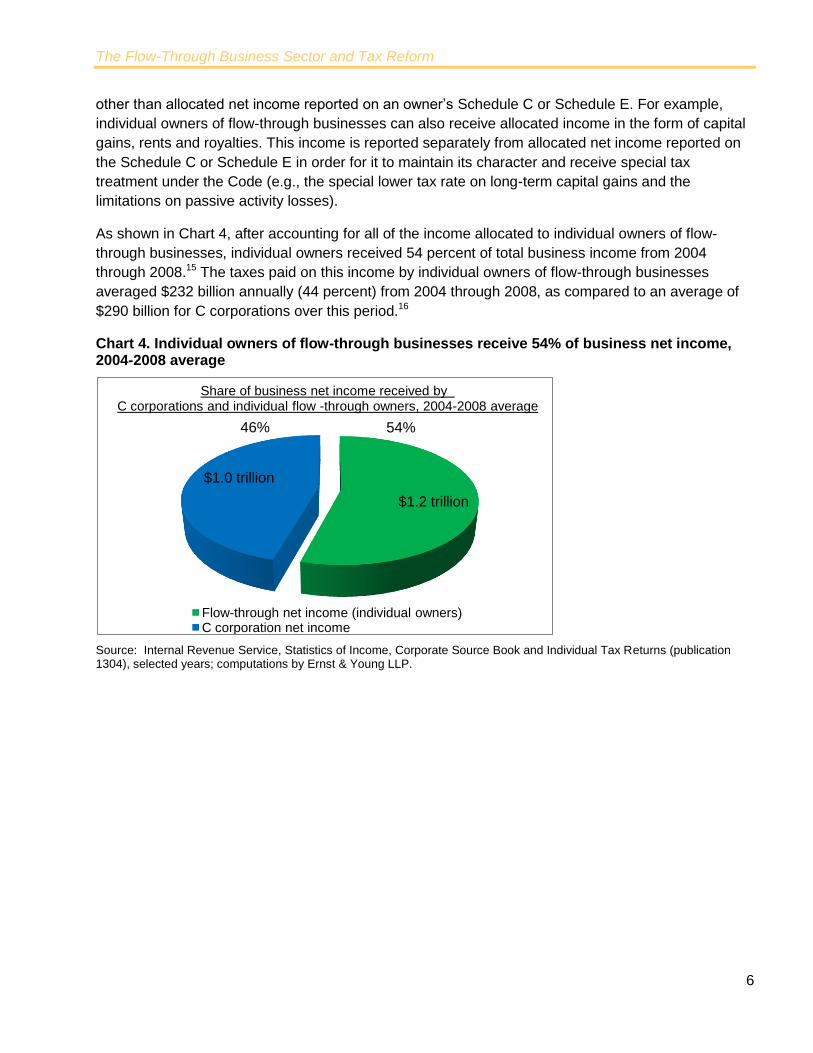
As shown in Chart 4, after accounting for all of the income allocated to individual owners of flow-
through businesses, individual owners received 54 percent of total business income from 2004
through 2008.15 The taxes paid on this income by individual owners of flow-through businesses
averaged $232 billion annually (44 percent) from 2004 through 2008, as compared to an average of
$290 billion for C corporations over this period.16
Chart 4. Individual owners of flow-through businesses receive 54% of business net income, 2004-2008 average
Source: Internal Revenue Service, Statistics of Income, Corporate Source Book and Individual Tax Returns (publication 1304), selected years; computations by Ernst & Young LLP.
$1.2 trillion
$1.0 trillion
Flow-through net income (individual owners)C corporation net income
46% 54%
Share of business net income received by C corporations and individual flow -through owners, 2004-2008 average

The Flow-Through Business Sector and Tax Reform
7
IV. Economic decisions of flow-through businesses affected by the tax
system
Research has found that individual income tax rates affect various economic decisions of flow-
through business owners. For example, tax rates have been found to affect the entry and exit from
flow-through form as individuals decide whether to open up their own business or work for another
firm.17 Tax rates have also been found to deter these businesses from hiring workers and investing
and affect the rate at which flow-through businesses grow.18 The effect of the individual tax rates on
these types of economic decisions is one reason the tax treatment of flow-through businesses has
figured prominently in recent discussions of changes to these tax rates.
Increases in the cost of capital resulting from higher individual income tax rates was found to reduce
the investment spending of entrepreneurs and the probability that they invested at all.19 A 5-
percentage point increase in the individual marginal tax rate was found to reduce the percentage of
entrepreneurs who made new capital investments by 10.4 percent and the mean amount of
investment by 9.9 percent.
Lower individual tax rates were found to increase the probability that entrepreneurs hired workers
and, for those with employees, the total amount of a firm‟s wages.20 A 10-percent increase in the net-
of-tax share (i.e., 1 minus the marginal tax rate) was found to increase the mean probability of hiring
workers by 12 percent, and for those firms with employees, increase the median wage bill by 3.7
percent. Finally, a 10-percent increase in the net-of-tax share was found to increase business
receipts by 8.4 percent.21
The concern over higher individual tax rates has, in part, been the result of the fact that the flow-
through sector plays an important role in the U.S. economy and the recognition that higher tax rates
on these firms‟ owners may result in less hiring and capital investment of businesses within the flow-
through sector. These issues will arise again in 2013 due to the scheduled increase under current law
in the top tax rate imposed on flow through businesses through the individual income tax income from
35 percent to 39.6 percent and the Medicare tax from 2.9 percent to 3.8 percent.

The Flow-Through Business Sector and Tax Reform
8
V. Tax reform and flow-through businesses
Some have suggested that tax reform focus first on reform of the corporate income tax before
focusing on reform of the individual income tax. With the flow-through sector representing more than
half of all business activity, as measured by employment (in 2008), and paying 44 percent of total
federal business income taxes (between 2004 through 2008), tax reform could have significant
consequences for flow-through businesses.
One approach to tax reform that has been suggested, for example, is lowering the corporate tax rate
and paying for this change by eliminating or limiting business tax expenditures. Many of these
expenditures are long-standing provisions that are available to and widely used by both C
corporations and flow-through businesses.
Curtailing business tax expenditures would raise the taxes paid by owners of flow-through
businesses, even though these businesses would receive no tax benefit from the lower corporate tax
rate and could even face a higher tax rate if individual income tax rates increase after 2012.22 For
example, if accelerated depreciation was eliminated to help finance a lower corporate tax rate, flow-
through businesses would lose the benefit of this tax provision without receiving the benefit of a
corresponding reduction in the corporate tax rate.
As shown in Chart 5, flow-through businesses make extensive use of a number of broadly available
business tax expenditures such as accelerated depreciation, the deduction for domestic production
activities, and the deduction for charitable giving. In total, flow-through businesses benefited from 23
percent of the approximately $116 billion in annual business tax expenditures between 2010 and
2014.23
Chart 5. Largest business tax expenditures in US, Annual average, 2010-2014*
*The value of the tax expenditure for tax-exempt bonds includes only the benefit to the corporate investors, not the benefit of lower interest rates to the issuers. Source: Joint Committee on Taxation, Estimates of Federal Tax Expenditures for Fiscal Years 2010-2014 (JCS-3-10), December 15, 2010, and Ernst & Young LLP calculations.
0 5 10 15 20
Accelerated depreciation & 179 expensing
Deferral of active foreign income
Domestic production activities deduction
Inventory property sales source rule exception
Deduction for charitable contribution
Credit for low-income housing
Expensing of R&E expenditures
Change to inventory methods (i.e., LIFO/LCM)
Interest exclusion of tax-preferred bonds
Small business health care credit
Reduced rates on first $10 million in corporate income
Deferral of gain on like-kind exchanges
Excl. of inv. income on life insurance annuity contracts
Deferral of gain on non-dealer installment sales
Special treatment of life insurance company reserves
C corporations
Flow-throughs
$ Billions
The Flow-Through Business Sector and Tax Reform
9
Repeal of these provisions could entail substantial tax increases for flow-through businesses that
could negatively impact employment and growth in the flow-through sector. To gauge the potential
impact on flow-through businesses of a “corporate only reform,” the percentage change in income tax
liability associated with elimination of all business tax expenditures was calculated for flow-through
businesses. The analysis takes into account all business tax expenditures permanently in effect from
2010 through 2014 and as estimated by the Joint Committee on Taxation.24
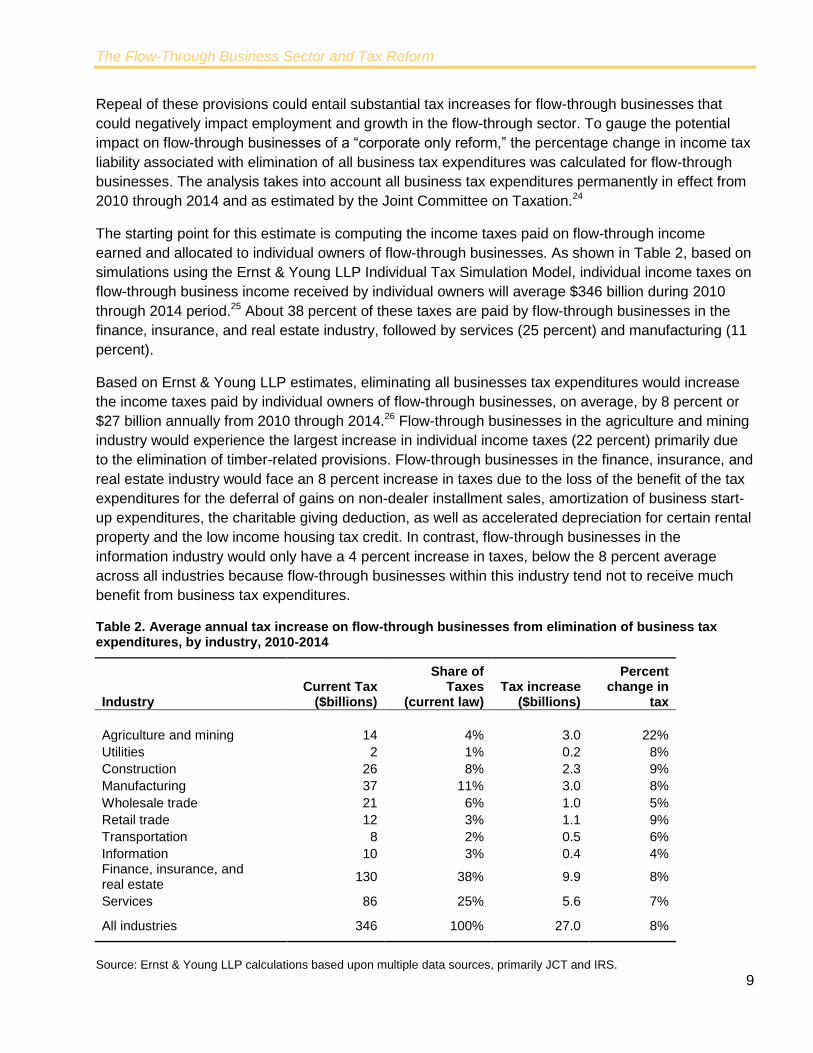
The starting point for this estimate is computing the income taxes paid on flow-through income
earned and allocated to individual owners of flow-through businesses. As shown in Table 2, based on
simulations using the Ernst & Young LLP Individual Tax Simulation Model, individual income taxes on
flow-through business income received by individual owners will average $346 billion during 2010
through 2014 period.25 About 38 percent of these taxes are paid by flow-through businesses in the
finance, insurance, and real estate industry, followed by services (25 percent) and manufacturing (11
percent).
Based on Ernst & Young LLP estimates, eliminating all businesses tax expenditures would increase
the income taxes paid by individual owners of flow-through businesses, on average, by 8 percent or
$27 billion annually from 2010 through 2014.26 Flow-through businesses in the agriculture and mining
industry would experience the largest increase in individual income taxes (22 percent) primarily due
to the elimination of timber-related provisions. Flow-through businesses in the finance, insurance, and
real estate industry would face an 8 percent increase in taxes due to the loss of the benefit of the tax
expenditures for the deferral of gains on non-dealer installment sales, amortization of business start-
up expenditures, the charitable giving deduction, as well as accelerated depreciation for certain rental
property and the low income housing tax credit. In contrast, flow-through businesses in the
information industry would only have a 4 percent increase in taxes, below the 8 percent average
across all industries because flow-through businesses within this industry tend not to receive much
benefit from business tax expenditures.
Table 2. Average annual tax increase on flow-through businesses from elimination of business tax expenditures, by industry, 2010-2014
Industry Current Tax
($billions)
Share of Taxes
(current law) Tax increase
($billions)
Percent change in
tax
Agriculture and mining 14 4% 3.0 22%
Utilities 2 1% 0.2 8%
Construction 26 8% 2.3 9%
Manufacturing 37 11% 3.0 8%
Wholesale trade 21 6% 1.0 5%
Retail trade 12 3% 1.1 9%
Transportation 8 2% 0.5 6%
Information 10 3% 0.4 4% Finance, insurance, and real estate
130 38% 9.9 8%
Services 86 25% 5.6 7%
All industries 346 100% 27.0 8%
Source: Ernst & Young LLP calculations based upon multiple data sources, primarily JCT and IRS.

The Flow-Through Business Sector and Tax Reform
10
A corporate tax reform that lowered the corporate tax rate paid for by eliminating or limiting business
tax expenditures only for C corporations would, in effect, hold flow-through businesses harmless from
the reform, but would add substantial complexity to the Code. The creation of additional differences
in the tax treatment of C corporations and flow-through businesses might also cause additional
shifting between these business forms. Differences in tax treatment have caused shifting between the
C corporation and flow-through business forms in the past,27 but in this case the shift between
organizational forms would result from the various tax expenditures being available only to
businesses in the flow-through sector.
Another aspect of tax reform is the double tax on corporate profits created by the differential taxation
of business income earned by C corporations and flow-through businesses. The double tax is
economically important and can distort a number of business decisions.28 One important such
distortion arises because the double tax mainly affects business income generated by activities
financed through equity capital within the C corporation form. Interest expenses are generally
deductible by businesses, leading to a tax bias in favor of financing with debt rather than equity. The
double tax thus raises the cost of equity financed investment by C corporations relative to debt
financed investment and provides an incentive for leverage and borrowing rather than for equity-
financed investment. Accordingly, the double tax contributes to the tax bias for higher leverage.
Greater leverage can make corporations more susceptible to financial distress during times of
economic weakness.
The double tax also increases the cost of investment in the corporate sector relative to the rest of the
economy. This tax bias against investment in the corporate sector leads to a misallocation of capital
throughout the economy whereby capital is not allocated to its best and highest use based on
economic considerations. This reduces the productive capacity of the capital stock and dampens
economic growth. As noted before, the diversity of organizational forms can be seen as a useful
choice for businesses to make in organizing themselves, but the impact of differential treatment
should be recognized. Finally, the double tax raises the overall cost of capital in the economy, which
reduces capital formation and, ultimately, living standards.29
The Flow-Through Business Sector and Tax Reform
11
VI. Summary
Flow-through businesses employed 54 percent of all private sector workers in 2008 and paid 44
percent of all federal business income taxes between 2004 and 2008. The flow-through sector
provides the important benefit of reducing the scope of the double tax on corporate profits, as well as
providing additional flexibility in the ownership structure of businesses providing a better match to
their management needs and capital requirements.
Recent focus on the need to lower the corporate income tax rate has drawn attention to how flow-
through businesses might be affected by tax reform. Corporate tax reform is an important component
of an overall approach to improving the current tax system. However, corporate tax reform that lowers
the corporate tax rate and pays for this change by eliminating all business tax expenditures would
have the impact of raising the taxes paid by owners of businesses organized in flow-through form.
Overall, the flow-through form provides an important benefit to the economy by reducing the
economically harmful effects of the double tax and therefore allowing for a greater opportunity for job
creation and capital investment.

The Flow-Through Business Sector and Tax Reform
12
Appendices
A. Data sources/simulations
The data presented in this analysis by legal form of organization uses data from primarily two main
sources: the Internal Revenue Service's Statistics of Income (SOI) division and the Census Bureau.
The IRS provides tax return data for businesses that is segregated in a number of ways including by
industry, size of a firm's assets, and legal form of organization (e.g., C corporation, S corporation,
partnership, sole proprietorship). Because this report's main focus is an assessment of the increasing
importance of flow-through businesses relative to C corporations, the primary IRS data source
chosen was SOI's Integrated Business Statistics tables, which provide data from 1980-2008 on
receipts, net income, and number of returns reported separately for C corporations, S corporations,
partnerships and sole proprietorships. The IRS, of course, assembles these data using various tax
forms filed by businesses.
This report also uses data from the Census Bureau's Statistics of US Business division (SUBS) and
Nonemployer Statistics (NS), which provides business-level data (e.g., number of firms, number of
establishments, employment, payroll and receipts) by legal form of organization, industry and
employment size (i.e., number of employees) for the nation as a whole and select geographic types.
Such data was also made available to EY on a state-by-state basis for 2007, the latest year for which
the most complete data is available.
The SUBS data excludes a large number of sole proprietorship that have only one employee (i.e.,
only the owner). Consequently, EY combined the SUBS data with nonemployer statistics (businesses
with no employees, just the owner) for 2007 to ensure proper representation of the business sector.
Specifically, nonemployers were counted as one firm, one establishment and containing one
employee for the purposes of the tabulations included in this report.
The simulations for calculating the percentage change in flow-through business tax liability use the
EY Individual Tax Simulation Model (EY ITSM) based on a publicly available sample of roughly
160,000 individual tax returns for tax year 2004 that are then projected through 2021 using the
Congressional Budget Office‟s economic projections. This model is used to estimate the tax liability
associated with flow-through business income from 2010 through 2014 as reported on individual tax
returns. Tax liability under current law is estimated as the difference between tax liability with and
without flow-through business income. This approach assumes the flow-through income is earned
last.
There are a few key details to keep in mind relating to the estimates cited above. First, the tax
expenditure estimates that underlie the simulated effects of the reform assume no behavioral
responses on the part of taxpayers. Second, the estimates assume that the tax law in effect during
the period of 2010 through 2014 corresponds to the tax law in effect on December 15, 2010. This
means that the estimates assume that most expiring tax provisions, including the research and
experimentation credit, would expire in 2010 or remain expired (after 2009) as opposed to being
extended and that the 2001 and 2003 tax cuts would expire after 2010 (in addition to no AMT
relief).That is, in order to be consistent the Joint Committee on Taxation tax expenditure estimates,
the above estimates do not incorporate the Tax Relief, Unemployment Insurance Reauthorization,
and Job Creation Act Of 2010 enacted in December 2010.

The Flow-Through Business Sector and Tax Reform
13
The estimates presented above in Table 2 also do not include the likely effect of higher state and
local taxes. Because state and local income taxes largely piggyback off of the federal definition of
income, flow-through businesses would not only see their federal income taxes rise, but also state
and local income taxes. States and local governments could, of course, decouple from the federal
change, but based on state and local governments‟ responses to Tax Reform Act of 1986, such
responses may be unlikely.30
The Flow-Through Business Sector and Tax Reform
14
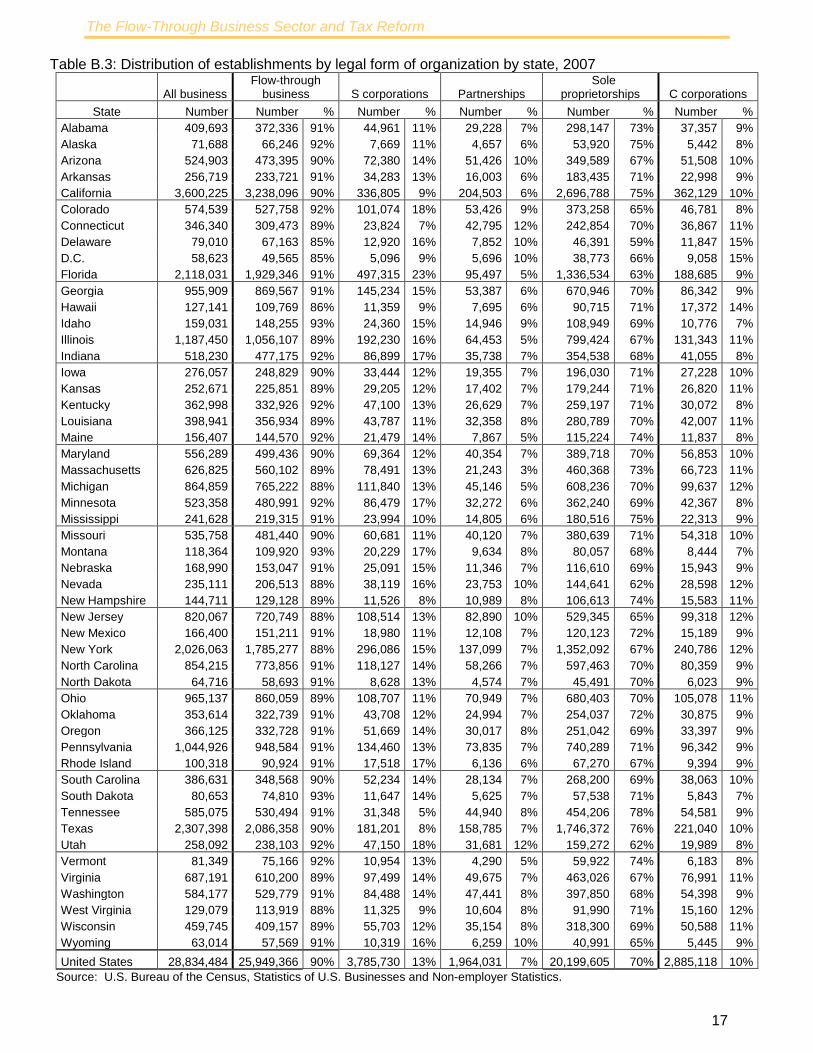
B. State level flow-through data
The tabulations below show the number of firms, establishments, employment and gross receipts
for all flow-through businesses, each flow-through organizational form (S corporations,
partnerships, and sole proprietorships), and C corporations for each state and the District of
Columbia. These data are based on tabulations from the Census Bureau‟s Statistics of U.S.
Business Division and Nonemployer Statistics. The state-by-state tabulations are presented for
2007 because this is the last year in which data is available for all of the items shown.

The Flow-Through Business Sector and Tax Reform
15
Table B.3: Distribution of employment by legal form of organization by state, 2007
All business Flow-through
business S corporations Partnerships Sole
proprietorships C corporations
State Number Number % Number % Number % Number % Number %
Alabama 1,837,895 1,003,766 55% 463,914 25% 185,245 10% 354,607 19% 834,129 45%
Alaska 261,659 157,944 60% 59,801 23% 30,600 12% 67,543 26% 103,715 40%
Arizona 2,583,078 1,413,643 55% 633,030 25% 322,116 12% 458,497 18% 1,169,435 45%
Arkansas 1,089,793 571,969 52% 256,518 24% 103,074 9% 212,377 19% 517,824 48%
California 15,037,048 8,085,938 54% 3,333,976 22% 1,374,016 9% 3,377,946 22% 6,951,110 46%
Colorado 2,279,826 1,306,092 57% 594,802 26% 288,998 13% 422,292 19% 973,734 43%
Connecticut 1,550,971 810,849 52% 281,306 18% 222,181 14% 307,362 20% 740,122 48%
Delaware 401,517 195,805 49% 90,689 23% 50,723 13% 54,393 14% 205,712 51%
D.C. 329,243 171,877 52% 55,559 17% 68,038 21% 48,280 15% 157,366 48%
Florida 8,340,214 4,690,339 56% 2,500,106 30% 674,927 8% 1,515,306 18% 3,649,875 44%
Georgia 4,009,564 2,117,574 53% 969,182 24% 382,023 10% 766,369 19% 1,891,990 47%
Hawaii 544,028 260,558 48% 89,672 16% 58,587 11% 112,299 21% 283,470 52%
Idaho 600,526 390,987 65% 174,913 29% 86,108 14% 129,966 22% 209,539 35%
Illinois 5,563,981 3,025,478 54% 1,519,567 27% 566,608 10% 939,303 17% 2,538,503 46%
Indiana 2,675,696 1,550,751 58% 807,896 30% 313,932 12% 428,923 16% 1,124,945 42%
Iowa 1,284,305 681,452 53% 338,891 26% 100,881 8% 241,680 19% 602,853 47%
Kansas 1,186,791 621,240 52% 280,241 24% 118,821 10% 222,178 19% 565,551 48%
Kentucky 1,622,070 903,968 56% 410,695 25% 185,043 11% 308,230 19% 718,102 44%
Louisiana 1,743,826 997,002 57% 405,710 23% 246,122 14% 345,170 20% 746,824 43%
Maine 521,800 323,685 62% 150,709 29% 40,471 8% 132,505 25% 198,115 38%
Maryland 2,328,191 1,264,369 54% 583,560 25% 229,374 10% 451,435 19% 1,063,822 46%
Massachusetts 2,917,260 1,464,839 50% 708,314 24% 213,737 7% 542,788 19% 1,452,421 50%
Michigan 3,810,890 1,989,754 52% 897,541 24% 380,006 10% 712,207 19% 1,821,136 48%
Minnesota 2,456,946 1,377,604 56% 741,609 30% 181,488 7% 454,507 18% 1,079,342 44%
Mississippi 996,637 559,594 56% 216,825 22% 113,576 11% 229,193 23% 437,043 44%
Missouri 2,480,322 1,291,681 52% 595,938 24% 240,171 10% 455,572 18% 1,188,641 48%
Montana 377,986 259,814 69% 123,903 33% 39,673 10% 96,238 25% 118,172 31%
Nebraska 791,687 431,407 54% 216,194 27% 76,534 10% 138,679 18% 360,280 46%
Nevada 1,319,379 716,280 54% 312,834 24% 196,486 15% 206,960 16% 603,099 46%
New Hampshire 584,966 319,854 55% 133,298 23% 56,517 10% 130,039 22% 265,112 45%
New Jersey 3,825,850 2,074,939 54% 954,370 25% 473,173 12% 647,396 17% 1,750,911 46%
New Mexico 678,680 400,985 59% 167,125 25% 82,917 12% 150,943 22% 277,695 41%
New York 7,523,850 4,299,818 57% 1,903,324 25% 845,347 11% 1,551,147 21% 3,224,032 43%
North Carolina 3,778,299 1,990,387 53% 971,603 26% 314,065 8% 704,719 19% 1,787,912 47%
North Dakota 271,207 156,593 58% 81,008 30% 20,910 8% 54,675 20% 114,614 42%
Ohio 4,799,341 2,497,306 52% 1,167,532 24% 499,954 10% 829,820 17% 2,302,035 48%
Oklahoma 1,418,444 811,643 57% 336,322 24% 167,385 12% 307,936 22% 606,801 43%
Oregon 1,510,431 876,319 58% 404,876 27% 162,479 11% 308,964 20% 634,112 42%
Pennsylvania 4,985,333 2,764,757 55% 1,332,179 27% 485,182 10% 947,396 19% 2,220,576 45%
Rhode Island 427,484 256,161 60% 144,421 34% 34,758 8% 76,982 18% 171,323 40%
South Carolina 1,756,135 953,599 54% 452,154 26% 171,718 10% 329,727 19% 802,536 46%
South Dakota 320,323 203,248 63% 103,624 32% 27,384 9% 72,240 23% 117,075 37%
Tennessee 2,619,885 1,323,024 50% 375,202 14% 384,266 15% 563,556 22% 1,296,861 50%
Texas 10,044,248 5,300,252 53% 1,727,825 17% 1,457,088 15% 2,115,339 21% 4,743,996 47%
Utah 1,171,163 678,554 58% 339,223 29% 156,124 13% 183,207 16% 492,609 42%
Vermont 271,198 170,393 63% 75,702 28% 21,384 8% 73,307 27% 100,805 37%
Virginia 3,344,719 1,679,371 50% 822,877 25% 301,813 9% 554,681 17% 1,665,348 50%
Washington 2,581,655 1,438,399 56% 675,853 26% 269,265 10% 493,281 19% 1,143,256 44%
West Virginia 575,274 303,677 53% 113,040 20% 69,890 12% 120,747 21% 271,597 47%
Wisconsin 2,416,283 1,325,162 55% 703,287 29% 215,883 9% 405,992 17% 1,091,121 45%
Wyoming 232,779 143,929 62% 66,008 28% 28,801 12% 49,120 21% 88,850 38%
United States 126,080,676 68,592,856 54% 30,852,975 24% 13,335,862 11% 24,404,019 19% 57,487,820 46%
Source: U.S. Bureau of the Census, Statistics of U.S. Businesses and Non-employer Statistics.

The Flow-Through Business Sector and Tax Reform
16
Table B.2: Distribution of firms by legal form of organization by state, 2007
All
business Flow-through
business S corporations Partnerships Sole
proprietorships C corporations
State Number Number % Number % Number % Number % Number %
Alabama 387,982 366,469 94% 41,438 11% 27,382 7% 297,649 77% 21,513 6%
Alaska 68,840 65,172 95% 7,048 10% 4,364 6% 53,760 78% 3,668 5%
Arizona 497,619 465,271 93% 68,110 14% 48,621 10% 348,540 70% 32,348 7%
Arkansas 244,400 230,488 94% 32,346 13% 14,854 6% 183,288 75% 13,912 6%
California 3,454,362 3,197,542 93% 314,014 9% 191,990 6% 2,691,538 78% 256,820 7%
Colorado 550,908 521,174 95% 97,768 18% 50,829 9% 372,577 68% 29,734 5%
Connecticut 332,067 306,125 92% 22,250 7% 41,453 12% 242,422 73% 25,942 8%
Delaware 74,779 66,216 89% 12,431 17% 7,482 10% 46,303 62% 8,563 11%
D.C. 55,250 48,885 88% 4,742 9% 5,448 10% 38,695 70% 6,365 12%
Florida 2,033,813 1,908,072 94% 485,302 24% 89,086 4% 1,333,684 66% 125,741 6%
Georgia 911,872 858,732 94% 138,895 15% 49,807 5% 670,030 73% 53,140 6%
Hawaii 121,491 108,326 89% 10,519 9% 7,216 6% 90,591 75% 13,165 11%
Idaho 153,147 146,202 95% 23,098 15% 14,314 9% 108,790 71% 6,945 5%
Illinois 1,132,893 1,042,081 92% 184,228 16% 59,679 5% 798,174 70% 90,812 8%
Indiana 487,113 465,613 96% 80,355 16% 31,376 6% 353,882 73% 21,500 4%
Iowa 261,766 244,290 93% 30,528 12% 18,053 7% 195,709 75% 17,476 7%
Kansas 239,820 222,447 93% 27,098 11% 16,332 7% 179,017 75% 17,373 7%
Kentucky 344,699 327,077 95% 43,851 13% 24,376 7% 258,850 75% 17,622 5%
Louisiana 379,400 351,869 93% 40,963 11% 30,425 8% 280,481 74% 27,531 7%
Maine 151,316 143,033 95% 20,385 13% 7,521 5% 115,127 76% 8,283 5%
Maryland 533,292 493,682 93% 66,302 12% 38,454 7% 388,926 73% 39,610 7%
Massachusetts 600,095 553,815 92% 74,619 12% 19,450 3% 459,746 77% 46,280 8%
Michigan 823,549 754,126 92% 105,485 13% 41,278 5% 607,363 74% 69,423 8%
Minnesota 499,946 473,247 95% 81,408 16% 30,341 6% 361,498 72% 26,699 5%
Mississippi 229,620 216,176 94% 22,044 10% 13,758 6% 180,374 79% 13,444 6%
Missouri 507,780 473,681 93% 55,815 11% 37,720 7% 380,146 75% 34,099 7%
Montana 114,440 108,437 95% 19,276 17% 9,236 8% 79,925 70% 6,003 5%
Nebraska 160,863 150,588 94% 23,478 15% 10,671 7% 116,439 72% 10,275 6%
Nevada 224,452 203,283 91% 36,441 16% 22,623 10% 144,219 64% 21,169 9%
New Hampshire 139,238 127,795 92% 10,736 8% 10,573 8% 106,486 76% 11,443 8%
New Jersey 788,534 713,530 90% 104,756 13% 80,317 10% 528,457 67% 75,004 10%
New Mexico 158,807 149,015 94% 17,763 11% 11,382 7% 119,870 75% 9,792 6%
New York 1,965,332 1,770,423 90% 288,437 15% 131,268 7% 1,350,718 69% 194,909 10%
North Carolina 810,411 761,251 94% 109,818 14% 54,779 7% 596,654 74% 49,160 6%
North Dakota 61,865 57,801 93% 8,014 13% 4,389 7% 45,398 73% 4,064 7%
Ohio 906,561 843,782 93% 99,285 11% 65,759 7% 678,738 75% 62,779 7%
Oklahoma 337,832 317,873 94% 41,088 12% 23,178 7% 253,607 75% 19,959 6%
Oregon 349,786 327,265 94% 48,491 14% 28,273 8% 250,501 72% 22,521 6%
Pennsylvania 990,101 933,831 94% 126,187 13% 68,986 7% 738,658 75% 56,270 6%
Rhode Island 97,124 90,013 93% 16,885 17% 5,897 6% 67,231 69% 7,111 7%
South Carolina 365,589 343,036 94% 48,671 13% 26,508 7% 267,857 73% 22,553 6%
South Dakota 77,581 73,607 95% 10,835 14% 5,370 7% 57,402 74% 3,974 5%
Tennessee 554,813 522,816 94% 27,952 5% 41,363 7% 453,501 82% 31,997 6%
Texas 2,191,724 2,051,593 94% 167,260 8% 141,075 6% 1,743,258 80% 140,131 6%
Utah 248,364 235,186 95% 45,568 18% 30,634 12% 158,984 64% 13,178 5%
Vermont 79,011 74,361 94% 10,411 13% 4,095 5% 59,855 76% 4,650 6%
Virginia 647,710 599,927 93% 91,260 14% 46,347 7% 462,320 71% 47,783 7%
Washington 556,559 521,387 94% 79,652 14% 44,739 8% 396,996 71% 35,172 6%
West Virginia 121,546 111,812 92% 10,238 8% 9,751 8% 91,823 76% 9,734 8%
Wisconsin 435,302 400,993 92% 50,211 12% 33,014 8% 317,768 73% 34,309 8%
Wyoming 60,681 56,812 94% 9,868 16% 6,006 10% 40,938 67% 3,869 6%
United States 27,342,488 25,523,840 93% 3,545,329 13% 1,817,547 7% 20,160,964 74% 1,818,648 7%
Source: U.S. Bureau of the Census, Statistics of U.S. Businesses and Non-employer Statistics.
The Flow-Through Business Sector and Tax Reform
17
Table B.3: Distribution of establishments by legal form of organization by state, 2007
All business Flow-through
business S corporations Partnerships Sole
proprietorships
C corporations
State Number Number % Number % Number % Number % Number %
Alabama 409,693 372,336 91% 44,961 11% 29,228 7% 298,147 73% 37,357 9%
Alaska 71,688 66,246 92% 7,669 11% 4,657 6% 53,920 75% 5,442 8%
Arizona 524,903 473,395 90% 72,380 14% 51,426 10% 349,589 67% 51,508 10%
Arkansas 256,719 233,721 91% 34,283 13% 16,003 6% 183,435 71% 22,998 9%
California 3,600,225 3,238,096 90% 336,805 9% 204,503 6% 2,696,788 75% 362,129 10%
Colorado 574,539 527,758 92% 101,074 18% 53,426 9% 373,258 65% 46,781 8%
Connecticut 346,340 309,473 89% 23,824 7% 42,795 12% 242,854 70% 36,867 11%
Delaware 79,010 67,163 85% 12,920 16% 7,852 10% 46,391 59% 11,847 15%
D.C. 58,623 49,565 85% 5,096 9% 5,696 10% 38,773 66% 9,058 15%
Florida 2,118,031 1,929,346 91% 497,315 23% 95,497 5% 1,336,534 63% 188,685 9%
Georgia 955,909 869,567 91% 145,234 15% 53,387 6% 670,946 70% 86,342 9%
Hawaii 127,141 109,769 86% 11,359 9% 7,695 6% 90,715 71% 17,372 14%
Idaho 159,031 148,255 93% 24,360 15% 14,946 9% 108,949 69% 10,776 7%
Illinois 1,187,450 1,056,107 89% 192,230 16% 64,453 5% 799,424 67% 131,343 11%
Indiana 518,230 477,175 92% 86,899 17% 35,738 7% 354,538 68% 41,055 8%
Iowa 276,057 248,829 90% 33,444 12% 19,355 7% 196,030 71% 27,228 10%
Kansas 252,671 225,851 89% 29,205 12% 17,402 7% 179,244 71% 26,820 11%
Kentucky 362,998 332,926 92% 47,100 13% 26,629 7% 259,197 71% 30,072 8%
Louisiana 398,941 356,934 89% 43,787 11% 32,358 8% 280,789 70% 42,007 11%
Maine 156,407 144,570 92% 21,479 14% 7,867 5% 115,224 74% 11,837 8%
Maryland 556,289 499,436 90% 69,364 12% 40,354 7% 389,718 70% 56,853 10%
Massachusetts 626,825 560,102 89% 78,491 13% 21,243 3% 460,368 73% 66,723 11%
Michigan 864,859 765,222 88% 111,840 13% 45,146 5% 608,236 70% 99,637 12%
Minnesota 523,358 480,991 92% 86,479 17% 32,272 6% 362,240 69% 42,367 8%
Mississippi 241,628 219,315 91% 23,994 10% 14,805 6% 180,516 75% 22,313 9%
Missouri 535,758 481,440 90% 60,681 11% 40,120 7% 380,639 71% 54,318 10%
Montana 118,364 109,920 93% 20,229 17% 9,634 8% 80,057 68% 8,444 7%
Nebraska 168,990 153,047 91% 25,091 15% 11,346 7% 116,610 69% 15,943 9%
Nevada 235,111 206,513 88% 38,119 16% 23,753 10% 144,641 62% 28,598 12%
New Hampshire 144,711 129,128 89% 11,526 8% 10,989 8% 106,613 74% 15,583 11%
New Jersey 820,067 720,749 88% 108,514 13% 82,890 10% 529,345 65% 99,318 12%
New Mexico 166,400 151,211 91% 18,980 11% 12,108 7% 120,123 72% 15,189 9%
New York 2,026,063 1,785,277 88% 296,086 15% 137,099 7% 1,352,092 67% 240,786 12%
North Carolina 854,215 773,856 91% 118,127 14% 58,266 7% 597,463 70% 80,359 9%
North Dakota 64,716 58,693 91% 8,628 13% 4,574 7% 45,491 70% 6,023 9%
Ohio 965,137 860,059 89% 108,707 11% 70,949 7% 680,403 70% 105,078 11%
Oklahoma 353,614 322,739 91% 43,708 12% 24,994 7% 254,037 72% 30,875 9%
Oregon 366,125 332,728 91% 51,669 14% 30,017 8% 251,042 69% 33,397 9%
Pennsylvania 1,044,926 948,584 91% 134,460 13% 73,835 7% 740,289 71% 96,342 9%
Rhode Island 100,318 90,924 91% 17,518 17% 6,136 6% 67,270 67% 9,394 9%
South Carolina 386,631 348,568 90% 52,234 14% 28,134 7% 268,200 69% 38,063 10%
South Dakota 80,653 74,810 93% 11,647 14% 5,625 7% 57,538 71% 5,843 7%
Tennessee 585,075 530,494 91% 31,348 5% 44,940 8% 454,206 78% 54,581 9%
Texas 2,307,398 2,086,358 90% 181,201 8% 158,785 7% 1,746,372 76% 221,040 10%
Utah 258,092 238,103 92% 47,150 18% 31,681 12% 159,272 62% 19,989 8%
Vermont 81,349 75,166 92% 10,954 13% 4,290 5% 59,922 74% 6,183 8%
Virginia 687,191 610,200 89% 97,499 14% 49,675 7% 463,026 67% 76,991 11%
Washington 584,177 529,779 91% 84,488 14% 47,441 8% 397,850 68% 54,398 9%
West Virginia 129,079 113,919 88% 11,325 9% 10,604 8% 91,990 71% 15,160 12%
Wisconsin 459,745 409,157 89% 55,703 12% 35,154 8% 318,300 69% 50,588 11%
Wyoming 63,014 57,569 91% 10,319 16% 6,259 10% 40,991 65% 5,445 9%
United States 28,834,484 25,949,366 90% 3,785,730 13% 1,964,031 7% 20,199,605 70% 2,885,118 10%
Source: U.S. Bureau of the Census, Statistics of U.S. Businesses and Non-employer Statistics.

The Flow-Through Business Sector and Tax Reform
18
Table B.4: Distribution of receipts ($ millions) by legal form of organization by state, 2007
All
business Flow-through
business S corporations Partnerships Sole
proprietorships C corporations
State Number Number % Number % Number % Number % Number %
Alabama 384,892 135,461 35% 78,988 21% 38,824 10% 17,649 5% 249,431 65%
Alaska 72,940 21,724 30% 12,484 17% 4,955 7% 4,285 6% 51,215 70%
Arizona 478,060 176,680 37% 95,605 20% 54,695 11% 26,380 6% 301,380 63%
Arkansas 227,684 74,916 33% 45,230 20% 19,850 9% 9,836 4% 152,768 67%
California 3,536,595 1,211,614 34% 655,872 19% 309,608 9% 246,134 7% 2,324,981 66%
Colorado 472,174 173,353 37% 100,811 21% 51,040 11% 21,502 5% 298,821 63%
Connecticut 509,444 153,176 30% 79,968 16% 50,562 10% 22,647 4% 356,268 70%
Delaware 163,835 43,478 27% 14,543 9% 26,112 16% 2,823 2% 120,358 73%
D.C. 108,809 31,399 29% 8,583 8% 19,636 18% 3,180 3% 77,410 71%
Florida 1,435,153 585,445 41% 396,746 28% 123,359 9% 65,340 5% 849,708 59%
Georgia 898,898 293,938 33% 176,184 20% 82,489 9% 35,266 4% 604,959 67%
Hawaii 93,154 28,605 31% 13,190 14% 9,463 10% 5,952 6% 64,549 69%
Idaho 101,317 49,951 49% 30,076 30% 13,843 14% 6,032 6% 51,366 51%
Illinois 1,406,004 488,319 35% 279,560 20% 157,457 11% 51,302 4% 917,685 65%
Indiana 597,163 232,583 39% 134,804 23% 71,552 12% 26,228 4% 364,579 61%
Iowa 298,505 94,711 32% 59,544 20% 21,377 7% 13,790 5% 203,793 68%
Kansas 283,279 90,615 32% 48,112 17% 26,805 9% 15,699 6% 192,663 68%
Kentucky 383,110 138,562 36% 66,630 17% 55,240 14% 16,691 4% 244,548 64%
Louisiana 517,075 184,542 36% 74,174 14% 91,590 18% 18,777 4% 332,533 64%
Maine 88,177 37,302 42% 24,443 28% 6,408 7% 6,451 7% 50,875 58%
Maryland 464,997 168,094 36% 102,395 22% 41,982 9% 23,717 5% 296,903 64%
Massachusetts 700,428 238,152 34% 141,098 20% 59,225 8% 37,829 5% 462,277 66%
Michigan 858,029 269,778 31% 151,057 18% 83,663 10% 35,057 4% 588,252 69%
Minnesota 561,669 204,868 36% 132,497 24% 43,620 8% 28,750 5% 356,802 64%
Mississippi 191,039 68,342 36% 35,519 19% 19,821 10% 13,001 7% 122,698 64%
Missouri 522,637 177,100 34% 109,866 21% 43,867 8% 23,367 4% 345,537 66%
Montana 64,898 31,087 48% 19,387 30% 6,960 11% 4,740 7% 33,811 52%
Nebraska 174,027 56,804 33% 38,898 22% 11,493 7% 6,413 4% 117,223 67%
Nevada 222,582 94,459 42% 51,415 23% 29,432 13% 13,612 6% 128,122 58%
New Hampshire 108,528 42,489 39% 24,013 22% 10,577 10% 7,899 7% 66,039 61%
New Jersey 1,069,512 359,999 34% 202,345 19% 104,311 10% 53,343 5% 709,513 66%
New Mexico 123,639 45,920 37% 24,293 20% 14,140 11% 7,487 6% 77,719 63%
New York 2,088,545 773,576 37% 402,886 19% 276,403 13% 94,288 5% 1,314,969 63%
North Carolina 796,653 264,122 33% 157,364 20% 63,590 8% 43,167 5% 532,532 67%
North Dakota 56,091 20,483 37% 14,543 26% 3,157 6% 2,783 5% 35,609 63%
Ohio 1,069,317 347,352 32% 196,748 18% 102,544 10% 48,061 4% 721,965 68%
Oklahoma 307,319 117,746 38% 70,116 23% 30,556 10% 17,074 6% 189,573 62%
Oregon 305,449 119,147 39% 70,706 23% 30,848 10% 17,592 6% 186,302 61%
Pennsylvania 1,094,942 408,343 37% 240,821 22% 96,589 9% 70,933 6% 686,599 63%
Rhode Island 77,387 33,534 43% 23,995 31% 5,659 7% 3,880 5% 43,852 57%
South Carolina 324,329 114,093 35% 64,965 20% 30,347 9% 18,781 6% 210,236 65%
South Dakota 75,523 29,143 39% 19,549 26% 5,466 7% 4,127 5% 46,380 61%
Tennessee 533,474 179,818 34% 69,705 13% 77,230 14% 32,883 6% 353,656 66%
Texas 2,571,836 936,397 36% 311,198 12% 479,065 19% 146,134 6% 1,635,439 64%
Utah 222,436 88,737 40% 53,693 24% 26,627 12% 8,418 4% 133,699 60%
Vermont 42,579 18,753 44% 12,498 29% 2,888 7% 3,367 8% 23,827 56%
Virginia 710,350 217,330 31% 132,474 19% 53,931 8% 30,925 4% 493,020 69%
Washington 591,290 221,767 38% 126,491 21% 63,791 11% 31,485 5% 369,523 62%
West Virginia 108,480 36,387 34% 17,898 16% 11,203 10% 7,285 7% 72,093 66%
Wisconsin 520,945 194,293 37% 131,361 25% 38,298 7% 24,635 5% 326,652 63%
Wyoming 64,942 27,013 42% 15,706 24% 8,734 13% 2,573 4% 37,929 58%
United States 28,680,137 10,148,255 35% 5,557,806 19% 3,110,877 11% 1,479,572 5% 18,531,882 65%
Source: U.S. Bureau of the Census, Statistics of U.S. Businesses and Non-employer Statistics.

The Flow-Through Business Sector and Tax Reform
19
1 Sole proprietorships, which are not flow-through entities per se, report their income and deductions on Form 1040,
Schedule C, and are subject to the individual income tax on such income. 2 The statistic was calculated over the five year period due to significant year-to-year fluctuations in business income
among both C corporations and flow-through businesses as the economy weakened in 2007 and 2008. Excluding 2008 from this average lowers the share of flow-through income to 52 percent. 3 President Obama‟s State of the Union address, January 25, 2011.
4 In 2013, the top individual tax rate is scheduled to rise from 35 percent to 39.6 percent and the Medicare tax rate is
schedule to rise from 2.9 percent to 3.8 percent. 5 According to the Organisation for Economic Co-operation and Development, the United States has one of the largest
non-corporate sectors. See Organisation for Economic Co-operation and Development, “Survey on the Taxation of Small and Medium-Sized Enterprises,” September 25, 2007. 6 The data presented here (Chart 1) also include RICs and REITs, which effectively are subject to a single layer of tax
because of the deductibility of dividends. Note that RICs and REITs are included among C corporations in the Census data on employment, firms and establishments presented below due to data limitations. 7 As discussed below, it is important to note that the line between activity ultimately subject to the corporate tax or
individual tax is blurred because some flow-through businesses, primarily partnerships and limited liability companies, can have corporate owners. Also note that the 82 percent of net income reported by all flow-through entities is for 2008, whereas the 54 percent of net income reported by individual owners of flow-through entities is the average from 2004 through 2008. 8 Limited partnerships, which offer limited liability to the limited partners, along with flow-through treatment, were
available. 9 In 1988 the IRS issued a revenue ruling indicating that it would treat LLCs established under Wyoming state law as
partnerships for tax purposes. Other states subsequently enacted similar LLCs statutes. 10
In 1995, there were 118,559 LLCs in the United States. By 2008 the number had grown to 1,898,178. Internal Revenue Service, Partnership Returns, 2008, Statistics of Income Bulletin, Fall 2010. 11
These tabulations exclude the non-profit and government sectors. RICs/REITs are included among C corporations due to data limitations. U.S. Bureau of the Census, Center for Economic Studies, 2008. 12
Sole proprietors are counted as one “employee.” A summary of the data and methodology used for these tabulations is provided in Appendix A. 13
Sole proprietorships are, by definition, owned by individuals and the ownership of S corporations is generally restricted to individual shareholders. 14
In 2007, about 30 percent of partnership income was allocated to corporate partners. Wheeler and Nina Shumofsky, Partnership Returns, 2008, Statistics of Income Bulletin, Fall 2010. 15
The net income and taxes paid by individual owners of flow-through businesses and C corporations are not directly comparable because the labor compensation of owners of C corporations are generally paid as wages and deductible to the business, while the labor compensation paid to owners of partnerships and sole proprietorships is generally included as part of business entities‟ allocable net income. S corporations, in contrast, are generally required to pay owners actively involved in a business a reasonable level of compensation, which, similar to C corporations, is a deductible expense by the business. Taking into account the amount of labor compensation paid to owners of partnerships and sole proprietorships as allocable net income could have a significant effect on these calculations. 16
This comparison only takes into account the taxes related to the net income of flow-through businesses and C corporations. Investor level taxes on corporate earnings are not taken into account. 17
Donald Bruce and Tami Gurley-Calvez, “Federal Tax Policy and Small Business,” In Overcoming Barriers to Entrepreneurship, Rowan and Littlefield Publishers, forthcoming; William M. Gentry and R. Glenn Hubbard, “„Success Taxes, Entrepreneurial Entry, and Innovation,” Working Paper No. 10551, National Bureau of Economic Research, June 2004. 18
Robert Carroll, Douglas Holtz-Eakin, Mark Rider and Harvey Rosen, “Income Taxes and Entrepreneurs‟ Use of Labor,” Journal of Labor Economics, April 2000, 18(2), pp. 324-351; Robert Carroll, Douglas Holtz-Eakin, Mark Rider and Harvey Rosen, “Personal Income Taxes and the Growth of Small Firms,” Tax Policy and the Economy, NBER, Vol. 15, 2001, pp.
121-147; and Robert Carroll, Douglas Holtz-Eakin, Mark Rider and Harvey Rosen, “Entrepreneurs, Income Taxes, and Investment,” In Does Atlas Shrug? The Economic Consequences of Taxing the Rich, Joel Slemrod, ed., Russell Sage Foundation and Harvard University Press, NY, 2002, pp. 427-455. 19
Robert Carroll, Douglas Holtz-Eakin, Mark Rider and Harvey Rosen, “Entrepreneurs, Income Taxes, and Investment,” In Does Atlas Shrug? The Economic Consequences of Taxing the Rich, Joel Slemrod, ed., Russell Sage Foundation and Harvard University Press, NY, 2002, pp. 427-455. 20
Robert Carroll, Douglas Holtz-Eakin, Mark Rider and Harvey Rosen, “Income Taxes and Entrepreneurs‟ Use of Labor,” Journal of Labor Economics, April 2000, 18(2), pp. 324-351. 21
Robert Carroll, Douglas Holtz-Eakin, Mark Rider and Harvey Rosen, “Personal Income Taxes and the Growth of Small Firms,” Tax Policy and the Economy, NBER, Vol. 15, 2001, pp. 121-147. 22
For a similar analysis that considers the effects of revenue neutral business tax rate reduction financed by repeal of all business tax expenditures see Gerald Prante, Robert Carroll, and Thomas Neubig, “Lowering Business Tax Rates by Repealing Tax Expenditures: An Industry Analysis,” Bureau of National Affairs Daily Tax Report, Vol. 2011, No. 34, February 18, 2011. 23
Includes only permanent, positive tax expenditures. 24
Joint Committee on Taxation, “Estimates of Federal Tax Expenditures for Fiscal Years 2010-2014,” (JCS-3-10), December 15, 2010. 25
The procedure for estimating the income tax paid on flow-through business income estimated the income tax liability of owners of flow-through businesses with and without their flow-through business income. This approach, described in

The Flow-Through Business Sector and Tax Reform
20
greater detail in Appendix A: Data sources/simulations, assumes flow-through business income is a taxpayer‟s last dollar of income earned. The income and associated taxes for RICs/REITs are excluded for purposes of this calculation. 26
This estimate includes the higher taxes on ordinary income reported by flow-through businesses, as well as taxes paid on other flow-through income reported on individual tax returns, such as capital gains, rental income, and royalty income. 27
See, for example, Robert Carroll and David Joulfaian, “Do Taxes Affect Corporate Financial Decisions? -- The Choice of Organizational Form,” U.S. Treasury Department, Office of Tax Analysis, Working Paper 73, October 1997; and Austan Goolsbee, “Taxes, Organizational Form, and the Deadweight Loss of the Corporate Income Tax,” Journal of Public Economics, 69(1), 1998, pp. 143-152. 28
For a discussion of these issues see Robert Carroll, “The Economic Effects of the Lower Tax Rate on Dividends,” Tax Foundation Special Report No. 181, June 2010. 29
For example, a dynamic analysis of the lower tax rates on dividends and capital gains enacted in 2003 found that they would increase gross domestic product in the long-run by 0.4 percent and the capital stock by 1.2 percent if made permanent. See U.S. Department of the Treasury, A Dynamic Analysis of Permanent Extension of the President’s Tax Relief, July 25, 2006. 30
See, for example, Louise Marshall, “New Evidence on Fiscal Illusion: The 1986 Tax "Windfalls," American Economic Review, Vol. 81(5), December 1991, pp. 1336-1344.