Embed Size (px)
Citation preview

1
6
The Fiscal Structure of New Mexico
Legislative Finance Committee1
INTRODUCTION AND OVERVIEW This chapter on New Mexico’s fiscal structure attempts to provide a comprehensive overview of
the state’s fiscal structure and pertinent issues and policies. It reviews recent revenue and
expenditures data in a comparative framework. Throughout the chapter references are made to
provisions of the state constitution that govern public finances. These represent key
underpinnings necessary to understanding fundamental issues including the requirement for a
balanced budget and limitations on debt.
The chapter begins with a review of state and local governments’ general revenues and direct
expenditures. These are compared with data for the rest of the country. The overview is
followed by sections on the state’s tax and revenue structure, major state government funds,
state budget process including an increasingly important focus on government performance,
state government recurring spending, state capital spending and debt policies, and local
government finance.
New Mexico state and local governments’ finances for fiscal year 2002 (July 1, 2001 to June
30, 2002) are summarized in exhibit 6.12. As reported by the United States Bureau of Census,
New Mexico state and local governments collected nearly $11 billion in general revenues. The
state collected more than three quarters of this revenue, with the remainder collected by cities,
counties, and school districts. This is significantly higher than the average 45 percent state share
for all other states. Of the $11 billion of general revenue in New Mexico, the federal
government contributed $3.1 billion or 28 percent. This is up from about 18 percent in FY
1989. The decade prior to 1989 witnessed a large decline in federal revenue funding—from 27
percent to 18 percent—because of the end of the federal revenue sharing program. Subsequent

2
growth largely reflects rapid growth in the Medicaid program, where roughly three quarters of
the program’s costs are absorbed by the federal government.
Taxes levied by state and local governments, which include property, income, and sales (gross
receipts) taxes account for 45 percent of the total revenue.2 Charges and miscellaneous
revenues account for 26 percent of general revenue and include tuition charges, hospital fees,
and significant interest income from the state’s two permanent funds.
While the state collects more than three-fourths of own source revenue in New Mexico, the
state-local expenditure division is more even, with the state accounting for 56 percent of total
expenditures. This difference is possible because there are significant transfers from the state to
local governments on both the expenditure and revenue sides. For example, nearly half the
state’s General Fund revenues are transferred to local school districts in support of public
education, while about one-fourth of the state gross receipts tax (often called the “sales” tax) is
transferred to municipalities in New Mexico as a revenue distribution for general budget
support.
Total public spending for all levels of education in FY 2002 was $4.2 billion, 36.5 percent of
total New Mexico state and local general expenditures. Sixty percent of education expenditures
go for elementary and secondary education; higher education spending accounts for most of the
remainder. The second largest spending category is public welfare, with 18.2 percent of the
total, up from about 8.6 percent in FY 1989. The significant increase in the share of spending
represented by this category is largely due to the high, sustained growth in the Medicaid
program. Transportation spending accounted for 10.7 percent of total spending. These
expenditure rankings are similar to those of other states, although New Mexico tends to spend a
higher proportion on education than the average state.

3
EXHIBIT 6.1 New Mexico State and Local Government’s General Revenues and Direct Expenditures, FY 2002 (in millions of dollars) State Local Combined GENERAL REVENUES Intergovernmental Federal $2,759.6 $364.0 $3,123.5 Taxes Property 52.8 703.2 756.0 Sales & Gross Receipts 1,822.9 496.6 2,319.5 Income 1,107.2 0.0 1,107.2 Other Taxes 645.2 49.8 695.0 Charges & Misc. 1,995.4 871.2 2,866.5 TOTAL REVENUES $8,383.0 $2,484.7 $10,867.7 GENERAL EXPENDITURES Education Public 0.0 2,506.8 2,506.8 Higher 1,260.6 201.2 1,461.8 Other 207.0 0.0 207.0 Libraries 2.4 32.5 34.8 Public Welfare 2,028.3 48.5 2,076.8 Health & Hospitals 739.1 89.9 829.1 Other Social Services 57.2 0.0 57.2 Highways 924.7 218.7 1,143.4 Other Transportation 2.7 76.2 78.9 Police Protection 88.8 320.9 409.7 Fire Protection 0.0 146.3 146.3 Correction 241.5 130.0 371.4 Protective Insp. & Reg. 59.5 3.5 63.0 Natural Resources 138.2 69.3 207.5 Parks & Recreation 48.9 156.2 205.1 Sewerage 11.4 108.0 119.4 Other Envir. & Housing 14.2 182.5 196.8 Government Administration 349.1 276.9 625.9 Interest on General Debt 192.2 185.7 377.8 Other General Expenditure 79.5 237.8 317.2 TOTAL EXPENDITURES $6.445.2 $4,990.9 $11,436.0 Source: U.S. Department of Commerce, Bureau of the Census, Government Finances: 2001–02.
THE TAX STRUCTURE
Eighty-five percent of total state and local taxes collected in FY 2002 can be attributed to three
revenue sources: Sales and gross receipts taxes (48 percent), income taxes (22 percent), and
property taxes (11 percent). Most states depend on these same revenue sources, but there are
significant differences among states as to their relative importance in producing revenues. Such
differences may be attributed to the various states’ economic circumstances, politics and
historical tax structure. Also, unlike all but a few states, New Mexico also collects a significant
share of revenues from taxes and rents and royalties on mineral production. Exhibits 6.2 and
6.3 compare New Mexico’s tax structure with the averages for all other states.

4
EXHIBIT 6.2 Comparison of State and Local General Tax Revenues All States and New Mexico, FY 2002 (in millions of dollars) Percent State Local Combined of Total ALL STATES Property $ 9,702 $269,419 $279,122 30.8 Sales & Gross Receipts 262,361 61,679 324,040 35.8 Individual Income 185,697 17,162 202,858 22.4 Corporate Income 25,123 3,029 28,152 3.1 License & Other 52,358 18,441 70,799 7.8 TOTAL $535,241 $369,730 $904,971 100.0 Per Capita Tax $3,143 (not $ millions) Percent of personal income 10.4 percent NEW MEXICO Property $ 53 $ 703 $ 756 15.5 Sales & Gross Receipts 1,823 497 2,320 47.6 Individual Income 983 0 983 20.2 Corporate Income 124 0 124 2.5 License & Other 645 50 695 14.2 TOTAL $3,628 $1,250 $4,878 100.0 Per Capita Tax $2,634 (not $ millions) Percent of personal income 11.1 percent Source: U.S. Department of Commerce, Bureau of the Census, Government Finances: 2001–02.
EXHIBIT 6.3
Comparison of State and Local Revenues Shares: NM and All Other StatesFiscal Year 2002
0%
5%
10%
15%
20%
25%
30%
35%
40%
45%
50%
Property Sales & Gross Receipts Individual Income Corporate Income License & Other
New Mexico All States

5
In FY 2002 New Mexico governments raised slightly less than half (47.6 percent) of its tax
revenues from general sales (gross receipts) and selective excise taxes (such as those on
cigarettes, gasoline, and alcohol). Compared to most other states, New Mexico relies more
heavily on sales taxes, ranking eighth highest in the country for the percent of revenues
generated by general sales taxes. Other rankings underline the importance of sales taxes in New
Mexico. State and local sales taxes accounted for 6.4 percent of personal income in the state in
FY 2000, third highest in the country. These taxes amounted to $1,338 per person, ranking the
state 7th in that category.
Although sales taxes continue to be a key part of the tax structure, the state is somewhat less
dependent on this revenue source than in the past. In 1989, sales taxes accounted for 52 percent
of own source revenue. A significant characteristic of the New Mexico gross receipts tax is the
comprehensiveness of its base. New Mexico is one of only a few states that tax services as well
as goods. This broader tax base allows a larger tax yield for a given gross receipts tax rate.
Taxing services also may tend to make this tax less regressive than many states’ sales tax
systems, since upper-income families spend relatively more on services. Furthermore, because
services are a growing sector of the general economy, the New Mexico gross receipts tax is
relatively elastic compared to many states’ sales tax systems. New Mexico gross receipts tax
revenues grow at a rate nearly proportional to overall state economic growth. Finally, gross
receipts tax receipts tend to be less sensitive to the business cycle than a tax on goods alone
would be.
One reason why the New Mexico gross receipts share of revenues has decreased in recent years
is that the state has begun to allow more exemptions from the tax, narrowing the base.
Prescription drugs were exempted in 1990s, and legislation passed in 2004 exempted food and
some medical services from the tax. Prior to these exemptions, New Mexico was one of just a
handful of states with a sales tax on these goods and services. Equity concerns regarding the
taxation of necessities like food and medicines were offset, at least partially, by a low-income
tax rebate program. The elimination of the gross receipts tax on food was accompanied by an
6
increase in the overall gross receipts tax rate to make up foregone revenue. A remaining,
unresolved gross receipts tax policy issue is the taxation of business services. Taxing inputs
results in a pyramiding effect that can put some businesses at a disadvantage with competitors
from other states where such inputs are not taxed. While this issue is of keen interest to the
business community and political leaders, an immediate fix may prove difficult because the
revenue loss implied would be large.
In FY 2002, use of the property tax accounted for only 15.5 percent of total taxes in New
Mexico, about half the 30.8 percent share in the average state. New Mexico ranks forty-ninth
among the states in the share of revenues from property taxes. In 1981, after the so-called “Big
Mac” tax cut, the property tax in New Mexico largely became a local government revenue
source, funding both general operations and capital outlay. This low utilization of the property
tax is mainly due to a constitutional provision (Article 7, Section 2) that limits the property tax
for operational purposes to 20 mills (one mill equals one one-thousandth of a dollar of assessed
property value). The 20 mills are divided between counties (11.85), municipalities (7.65) and
school districts (0.50). The constitutional provision was passed during the 1930s, at the same
time the gross receipts tax was enacted. The New Mexico Supreme Court has ruled that
assessed value should be uniform throughout the state, at one-third of market value. Thus the 20
mills represent 2 percent of one-third of market value, resulting in an effective tax rate of two-
thirds of 1 percent. Also, many local governments do not impose the maximum rate.
The personal income tax has also grown rapidly throughout the past two decades as a source of
revenue in New Mexico. In FY 2002 this tax represented 20.2 percent of total New Mexico
taxes, up from 14.7 percent in FY 1989 and just 5.0 percent in FY 1978. However, New Mexico
still relies less on the personal income tax than most other states (see exhibit 6.2). As of FY
2002, New Mexico ranked thirty-fifth among the states in the percentage revenues from state
personal-income taxes. Other comparative information showed that in FY 2000, individual
income taxes per capita were $484, for a rank of 37th among all states. The tax accounted for 2.3
percent of personal income, putting the state in the 35th highest position. While state income tax

7
revenues measured as a share of total revenues and per-capita and per-share of personal income
rankings indicate that the state’s income tax policies are competitive, some business and
political leaders contended that the state’s top marginal rate placed the state at a competitive
disadvantage in the battle for economic development. As of 2003, the state’s top personal
income tax rate was 8.1 percent, the 8th highest top rate in the country. In response to these
concerns and the urging of the governor, the legislature passed legislation significantly reducing
income tax rates over a five-year period in 2003. The phased-in rate reductions gradually
reduce the top marginal tax rate from 8.1 percent in Fiscal Year 2003 to 4.9 percent in Fiscal
Year 2008. Once the rate reductions are fully implemented, the state’s ranking can be expected
to drop below the median top rate for all states, which stood at 6 percent in 2003. Historically,
New Mexico’s personal income tax has been very progressive and responsive to increases in
income, growing faster than personal income. The newly enacted tax rate reductions will make
the tax both less progressive and less elastic. Never the less, the income tax can be expected to
continue grow at a little faster rate than personal income.
Another major revenue source for the state is taxes and rents and royalties on natural resources,
primarily crude oil, natural gas and coal. These revenues constitute a significant share of state
General Fund revenues, and are a major source for the state’s capital investment program.
Energy related revenues constitute a challenge for state fiscal policy because they are volatile
and difficult to forecast. The base for these revenues is the value of production less deductions
for royalties and transportation costs. Sharp swings in prices affect values and thus revenues.
The graph of natural gas prices shown in exhibit 6.4 illustrates historical volatility.

8
EXHIBIT 6.4
New Mexico Average Natural Gas Prices
$0
$1
$2
$3
$4
$5
$6
$7
$8
$9
$10Ja
n-90
Jul-9
0
Jan-
91
Jul-9
1
Jan-
92
Jul-9
2
Jan-
93
Jul-9
3
Jan-
94
Jul-9
4
Jan-
95
Jul-9
5
Jan-
96
Jul-9
6
Jan-
97
Jul-9
7
Jan-
98
Jul-9
8
Jan-
99
Jul-9
9
Jan-
00
Jul-0
0
Jan-
01
Jul-0
1
Jan-
02
Jul-0
2
Jan-
03
Jul-0
3
Jan-
04
Jul-0
4
Dol
llars
per
MC
F
Source: New Mexico Taxation and Revenue Department
In FY 1982 energy related revenues brought $993 million to New Mexico, by 1990 these had
declined to $424 million. In recent years, energy prices have increased sharply, leading to large
revenue increases in some years. In FY 2004 revenues to state and local governments totaled
$1,286 million. The varying shares of state general fund revenues from these revenues again
illustrate their volatile nature. In FY 1999 energy related revenues distributed to the general
fund totaled $280 million or 8.8 percent of total revenues. Two years later, these revenues
contributed $769 million to the General Fund, or 19.1 percent total revenue. Exhibit 6.5 and
6.6 summarize the State’s general fund revenue sources.

9
EXHIBIT 6.5
EXHIBIT 6.6
FUND STRUCTURE OF STATE GOVERNMENT
Article IV, Section 30 of the New Mexico Constitution provides that “money shall be paid out
of the treasury only upon appropriations made by the legislature.” Appropriations are made and
accounted by fund. There are approximately one thousand funds in the state treasury, many
authorized by state statute, others established by the Department of Finance and Administration.
Exhibit 6.7 presents the most important state funds.
State General Fund Revenues by Major Source
-
500
1,000
1,500
2,000
2,500
3,000
3,500
4,000
4,500
FY89 FY90 FY91 FY92 FY93 FY94 FY95 FY96 FY97 FY98 FY99 FY00 FY01 FY02 FY03
Millions of Dollars
Sales Taxes Income Taxes Investment Income Energy Revenues Other
Shares of General Fund Revenues
0.0%
5.0%
10.0%
15.0%
20.0%
25.0%
30.0%
35.0%
40.0%
45.0%
50.0%
FY89 FY90 FY91 FY92 FY93 FY94 FY95 FY96 FY97 FY98 FY99 FY00 FY01 FY02 FY03 FY04
Sales Taxes Income Taxes Investment Income Energy Revenues Other

10
EXHIBIT 6.7 OVERVIEW OF NEW MEXICO FINANCES: FY 04
(Millions of dollars)
OPERATING FUNDS1 INVESTMENTS BONDED DEBT3
Severance Taxes $286
Land Grant Permanent
Fund 2
$7,279
Severance Tax
Permanent Fund 2 $3,686
State Treasurer
Investments $2,181
Taxes & Fees 72.6% Interest 11.4% Energy 16%
ROAD FUND $635
State 52% Funds Federal 48% Funds
45.9% Public Schools 15.4% Higher Education 22.1% Health and Human Services 10.1%
Courts/ Public Safety
6.5% General Govt.
Property Net Taxable Value: $ 32,210 4
Roads
$172 General Fund
$25 General Fund
$14 Agency & LGIP
Senior Debt
Service$54
1 Recurring appropriations 2 Five-Year average value 1999-2003 3 State debt as of 12-31-2003 4 For Tax Year 2003; Fiscal Year 2004 5. Employer and employee contributions
General Obligation
Bonds: $289
Severance Tax Bonds:
Senior: $298 Supplemental:
$119
GENERAL FUND 4,127
SupplementalDebt
Service $25
STPF $16.7
PERA $9,288 ERB
$6,910
PERA Contributions5 $379 ERB Contributions5 $351
Distributions: $292 to General Fund $61 to others
PERA Retirees $384 ERB Retirees: $422
Debt Service $53
The General Fund is the state’s principal operating fund. It receives most state tax revenue,
investment income from the two permanent and shared federal mineral royalties and provides
funding for most state agencies and universities and public schools. For FY 2004 General Fund
appropriations for recurring operations were $4.127 billion. The second biggest operating fund
is the Road Fund with FY 2004 appropriations of $635 million which receives gasoline and
diesel taxes, weight distance taxes and vehicle registration fees. Road fund revenues are
dedicated to maintenance and construction of roads. Other state funds accounted for
approximately $1.5 billion of FY 2004 appropriations for such purposes as game protection,
risk management, boards and commissions, and water resources management. In addition in
FY 2004, the state received approximately $4 billion of Federal funds for operations.

11
Pursuant to the Ferguson Act enacted by Congress in 1898 and the State Constitution of 1912,
federal land was conveyed to the state of New Mexico to benefit twenty public institutions (see
Article XIV, Sections 1 and 2). A significant share of the state’s oil and gas resources occur on
these state lands and royalties from production are deposited in the Land Grant Permanent
Fund. As shown in exhibit 6.7 average assets of the Land Grant Permanent Fund have grown to
more than $7 billion. Eighty-three percent of the Land Grant Permanent Fund investment
income benefits public schools by a distribution to the General Fund, $292 million in FY 2004.
(An important 1996 constitutional amendment eased restrictions on investment in stocks and
modernized the distribution method for beneficiaries.)
Article VIII, Section 10 of the Constitution, adopted in 1976, provides for some severance
taxes, again mostly on oil and gas production. These revenues are dedicated to pay debt service
on severance tax bonds, with revenue in excess of that needed to pay debt service transferred to
the Severance Tax Permanent Fund (STPF). The State Investment Council invests STPF funds,
with a share of the fund (4.7 percent of the average five-year value) transferred to the general
fund. Severance Tax Permanent Fund average balances reached $3.6 billion, generating $172
million in revenue for the General Fund in FY 2004.
Other major state investment funds include the Public Employees and Educational Retirement
Funds with FY 2004 assets of approximately $16 billion and State Treasurer’s investments of
approximately $2 billion.
Finally, Exhibit 6.7 portrays the state’s two major capital outlay/bonding programs. Article IX,
Section 8 of the New Mexico Constitution authorizes issuance of General Obligation (GO)
bonds backed by property taxes up to 1 percent of the state’s net assessed valuation (at one-third
of market value.) On December 31, 2003, $288.5 million GO Bonds were outstanding. Also,
severance taxes discussed above are deposited in the Severance Tax Bonding Fund for debt
service on Severance Tax Bonds; $416 million were outstanding on December 31, 2003. Over
the last decade legislation gradually expanded the use of severance tax revenue for debt service

12
from 50 percent of total severance tax revenue to 95 percent. Surplus severance tax revenues
not needed for debt payments are transferred to the Severance Tax Permanent Fund.
THE NEW MEXICO APPROPRIATION PROCESS AND ACCOUNTABILITY IN
GOVERNMENT ACT
In New Mexico, the appropriation process officially begins in mid-June when the Department
of Finance and Administration, State Budget Division is statutorily required to send each state
agency budget request instructions. As part of their request, agencies are required to provide
information such as revenue or anticipated revenue and expenditures or anticipated expenditures
from all sources for the fiscal year completed, the current fiscal year and for the succeeding
fiscal year. Agencies are statutorily required to submit this information and other information
such as an organizational chart, strategic plan and information technology plan no later than
September 1 to both Department of Finance and Administration and Legislative Finance
Committee.
The Legislative Finance Committee is an interim committee of the legislature charged with
examining the laws governing the finances and operations of departments, agencies and
institutions of New Mexico and with reviewing the policies, costs and effect of laws on the
functioning of governmental units.
New Mexico is fairly unique in that both the governor and a legislative agency, the Legislative
Finance Committee, propose a comprehensive state budget to the full legislature. The primary
motivation behind the dual executive and legislative recommendations is to help ensure a
system of checks and balances and to incorporate the different perspectives of the two branches
into the budget process.
During the months of September through December both State Budget Division and Legislative
Finance Committee staffs analyze agency budget requests and hold meetings and hearings to
pursue issues pertinent to the requests. Also during this time, economists from the Legislative

13
Finance Committee, Department of Finance and Administration, the Taxation and Revenue
Department, and the Department of Transportation develop a consensus General Fund revenue
estimate. Like most states, New Mexico must balance its budget each year without incurring a
deficit (see Article IX, Section 7 of New Mexico Constitution). Both the governor and
members of the Legislative Finance Committee face a difficult task of balancing agency
requests with available revenues. In order to deal with the fact that both revenues and spending
for entitlement programs are estimated, the state maintains an account for reserves that can be
tapped in the event of a revenue shortfall. The reserve target traditionally has been 5 percent.
However, in years where the revenue estimate seems particularly prone to risk, reserve balance
targets have been increased to as high as 9 percent.
State law requires the governor to prepare a budget and submit it to the Legislative Finance
Committee and each member of the legislature no later than January 5 in even-numbered years
and no later than January 10 in odd-numbered years. The Legislative Finance Committee
finalizes its budget recommendations in December and prepares a full report of its findings to
the full legislature on the first day of the legislative session in January.
On the first day of the legislative session which begins on the third Tuesday in January and lasts
60 days in odd numbered years and 30 days in even numbered years, the executive Budget in
Brief and the Legislative Finance Committee Budget Recommendations are released to
legislators, agencies, press and the general public. Simultaneously the General Appropriation
Act also known as the “state budget” is introduced in the House of Representatives. Typically,
the introduced version of the General Appropriation Act represents the governor’s budget
recommendations in summary by agency.
Close to the start of the legislative session, Legislative Finance Committee and State Budget
Division prepare difference sheets – reports by agency and program that shows the major
differences in revenues, expenditures and total budget between the executive and Legislative
Finance Committee recommendations. The House Appropriations and Finance Committee

14
holds budget hearings for each agency during which executive and Legislative Finance
Committee staff present the difference sheet report to the committee. The committee will either
adopt the executive recommendation, the Legislative Finance Committee recommendation,
parts of both recommendations, or its own recommendation. Once House Appropriations and
Finance Committee complete its work, the product becomes the House Appropriations and
Finance Committee substitute version of the budget and is voted on by the members. The bill
then moves to the House floor for third reading and final passage and the bill is debated.
Typical floor action is to amend or to pass the bill on to the Senate with no changes.
Once the General Appropriation Act is passed by the House, the Senate begins deliberations.
The Senate Finance Committee conducts its own hearings and analysis. Typically over several
days, Senators propose amendments to the General Appropriation Act. Amendments are
reviewed and considered by the Senate Finance Committee and are either adopted, modified
then adopted or not. The amendments are compiled and a committee report is prepared and
voted on by Senate Finance Committee which then becomes the Senate Finance Committee
version of the General Appropriation Act. The amended General Appropriation Act then moves
to the Senate floor for third reading and final passage where the bill is debated. Typical floor
action is to further amend or to pass the bill to the House of Representative for concurrence. If
the House fails to concur, they will ask the Senate to recede from its amendments. If the Senate
refuses to recede, a conference committee consisting of three members from each house is
appointed to reconcile and negotiate the differences.
The Conference Committee meets privately to negotiate the differences. A Conference
Committee report is prepared and adopted by both houses. The bill is enrolled and engrossed
and delivered to the Governor for signature.
The governor may sign the General Appropriation Act, veto or partially veto the bill. The time
the governor has is dependent on when it reaches his desk. If the legislature is still in session
and the General Appropriation Act is delivered, he has three days to sign or veto the bill. If it is

15
not signed, the bill automatically becomes law. If however, the General Appropriation Act
reaches the governor with less than three days remaining in the legislative session, the governor
has twenty days to sign or veto the bill. If the governor vetoes a bill while the legislature is still
in session, it can be overridden with a two-thirds majority vote in both the House and Senate.
Following a veto of the General Appropriations Act in 2002, in unprecedented action, the
legislature convened itself and overrode a governor’s budget veto for the first time in state
history.
It should be noted that not all appropriations are made through a single bill. Article IV, Section
16 of the New Mexico Constitution limits the appropriations in the General Appropriation Act
to those expenses “required under existing law.” For example, various one-time capital outlay
projects or tax bills that might generate additional revenue will not be included in the General
Appropriation Act.
Following passage of the General Appropriation Act, agencies are required to submit their plan
(or operating budget) on how they will spend funds appropriated on or before May 1 to State
Budget Division. The Legislative Finance Committee also receives a copy of the agency
operating budget.
Accountability in Government Act. With the state’s adoption of the Accountability in
Government Act in 1999, New Mexico began in earnest to focus its attention on results. The
primary feature of the Accountability in Government Act is the implementation of performance-
based budgeting. Performance-based budgeting requires that agencies identify programs and
performance measures and submit performance-based budget requests with targeted levels of
performance. Select performance measures and corresponding targets are included in the
General Appropriation Act immediately following program appropriations. The result has been
that a few agencies have been able to improve the link from their budget to performance. For
example, Children, Youth and Families Department used data to show the benefits of the
department’s efforts on rehabilitation as opposed to incarceration. Higher education institutions
16
used “gap analysis,” the difference between their current performance and comparative group
performance, to develop action plans to address improvements and to develop realistic
performance targets.
Recent efforts have sought to focus on key measures for large agencies, improve the quality of
measures and implement quarterly reporting. In the near future, agency quarterly performance
reports will be available to all stakeholders on state web sites.
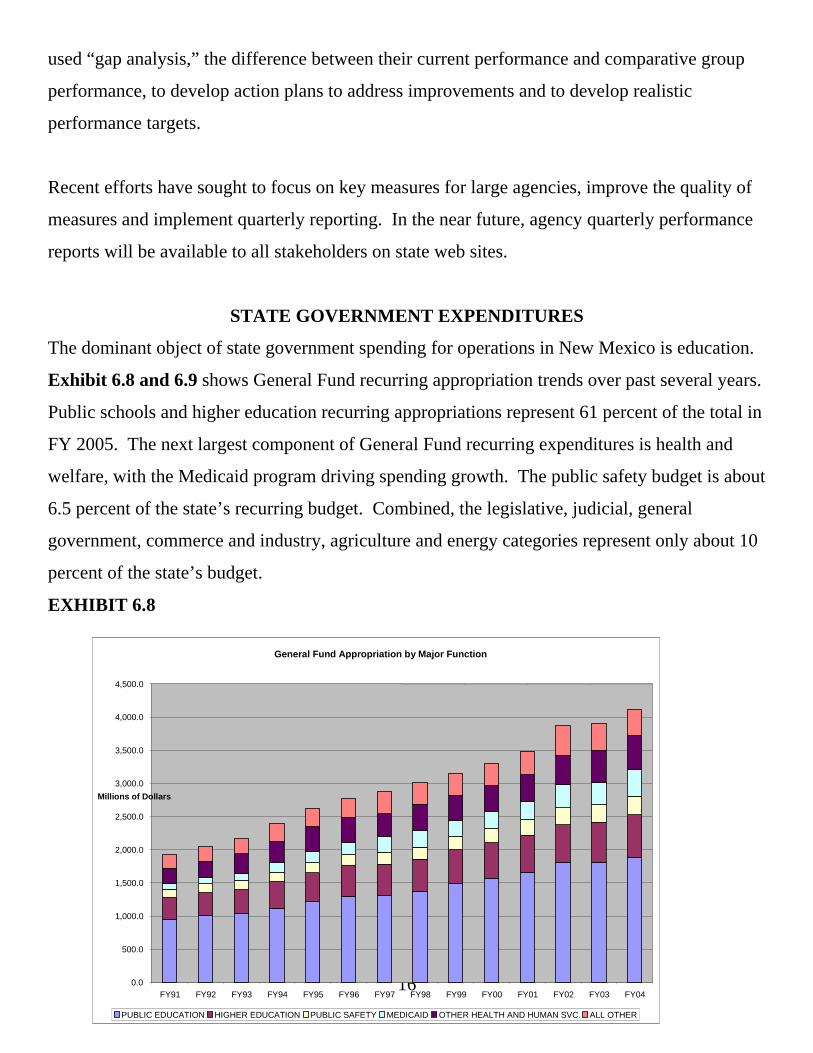
STATE GOVERNMENT EXPENDITURES
The dominant object of state government spending for operations in New Mexico is education.
Exhibit 6.8 and 6.9 shows General Fund recurring appropriation trends over past several years.
Public schools and higher education recurring appropriations represent 61 percent of the total in
FY 2005. The next largest component of General Fund recurring expenditures is health and
welfare, with the Medicaid program driving spending growth. The public safety budget is about
6.5 percent of the state’s recurring budget. Combined, the legislative, judicial, general
government, commerce and industry, agriculture and energy categories represent only about 10
percent of the state’s budget.
EXHIBIT 6.8
General Fund Appropriation by Major Function
0.0
500.0
1,000.0
1,500.0
2,000.0
2,500.0
3,000.0
3,500.0
4,000.0
4,500.0
FY91 FY92 FY93 FY94 FY95 FY96 FY97 FY98 FY99 FY00 FY01 FY02 FY03 FY04
Millions of Dollars
PUBLIC EDUCATION HIGHER EDUCATION PUBLIC SAFETY MEDICAID OTHER HEALTH AND HUMAN SVC. ALL OTHER

17
EXHIBIT 6.9
General Fund: Shares for Major Spending Sectors
0.0%
5.0%
10.0%
15.0%
20.0%
25.0%
30.0%
35.0%
40.0%
45.0%
50.0%
FY91 FY92 FY93 FY94 FY95 FY96 FY97 FY98 FY99 FY00 FY01 FY02 FY03 FY04
PUBLIC ED HIGHER ED. PUBLIC SAFETY MEDICAID ALL OTHER OTHER HEALTH AND HUMAN SVC. Public Schools. There are eighty-nine school districts in New Mexico, ranging in size from
Mosquero, with an average daily membership (ADM) of less than 50 to Albuquerque, with an
ADM of 6,875 in New Mexico. Statewide public school enrollment in the 2003-2004 school
year was 314,926.
The state provides nearly all funding for school operations, with funding levels determined by
the public school funding formula as specified in state statute. The present state education
distribution formula for public schools was enacted in 1974, with several significant
modifications made since that time. The state’s public school funding formula emphasizes a
policy that all students are entitled to an “equal educational opportunity”. The formula focuses
on funding enrollment plus fixed costs. This approach is commonly referred to as the “cost of
opening the doors”. Approximately 90 percent of school districts’ operational revenue is

18
derived from the state equalization guarantee (SEG) appropriation; New Mexico typically ranks
among the lowest in the nation for its percentage of school funds from local sources. A school
districts’ SEG is the amount of money the state guarantees each public school district to provide
equal access to programs and services appropriate to their educational needs regardless of
geographic location or local economic conditions. School districts have the discretion to spend
their formula dollars according to local priorities. However, they must comply with statutory
requirements and relevant directives from the Public Education Department. In the calculation
of State Equalization Guarantee, the state takes credit for 75 percent of property tax revenues,
federal forest reserve revenues and certain operational federal impact aid fund revenues
received by the school district.
The formula begins with a basic unit of education equal to 1.0. However, due to adjustments
made over the years, all but one student category has a different weighting factor. For instance,
pupils in kindergarten have a factor of 1.44, and grades 7 through 12 are given a weight of 1.25,
respectively implying costs of education equal to 44 and 25 percent higher than for a basic unit.
Additional weights are added for special education classes, bilingual education, fine arts
education, at-risk students and special factors for school and district size and rural isolation.
Finally additional weight is given to both the experience and formal education of the faculty.
The weighted ADMs of various schools in a district are then added together, to obtain a total for
the school district. Currently the formula results in an average of about 1.9 units per member.
Each year, the state legislature sets a dollar value per weighted ADM, and depending on
available General Fund revenues and other budget priorities, appropriates funding for public
school support. The Secretary of the Public Education Department sets the unit value based on
appropriations and estimated program units. A final unit value is determined in January each
year based on program units reported by school districts.
As shown in exhibit 6.8, state spending on public schools rose from just over $800 million to
under $2 billion from FY 1989 to FY 2005. Maintaining the share of General Fund spending

19
for public schools at 50 percent has been a point of the fiscal policy debate of the state. In
recent years, although public schools have received significant, real (inflation adjusted) funding
increases, the share has drifted down to about 45 percent.
A 2003 amendment to Article 12, Section 7 increased distributions from the land grant
permanent fund to designated beneficiaries, with public schools receiving 83% of the increased
distributions. The annual distribution increased from 4.7 percent to 5 percent of the five-year
average of year-end market values of the fund. For FY 2005 through FY 2012, an additional
distribution of eight-tenths of one percent (a total of 5.8 percent) and from FY 2013 through FY
2016, the additional distribution reduces to five-tenths (a total of 5.5 percent). After FY 2017,
the distribution remains at 5 percent. This provided an additional distribution to public schools
of $67 million in FY 2005.
The major emphasis of the incremental funding and school reform is an initiative to improve
teacher quality with implementation of a three-tiered licensure program, a progressive career
system for teachers and school administrators in which teachers are required to demonstrate
increased competencies and undertake increased duties as they progress through three licensure
levels. In the first phase, all teachers were provided with a minimum salary of $30 thousand.
In the next phase, qualifying teachers reach the level 2 and 3 levels with associated salaries of
$35 thousand. Latest analysis indicates the three-tiered licensure ladder could cost over $100
million when fully implemented with additional costs for retirement contributions.
Also, in part due to the federal No Child Left Behind (NCLB) Act of 2001, there has been
increased focus on student progress and on successful schools. For FY 2005, the Public
Education Department released the final assessments of public schools under the federal NCLB
Act and the New Mexico School Reform Act. For the 2003-04 school year, 521 schools made
adequate yearly progress, while 244 did not. Particularly worrisome, only 45 percent of the
state’s high schools made adequate yearly progress.

20
Higher Education. Public, post-secondary education in New Mexico consists of three research
universities, three comprehensive universities, nine branch community colleges and eight
independent community colleges. There are also three public special schools. Total Fall 2002
enrollment was 113,650 students, of which 55 percent attended community colleges and 45
percent attended universities. Of full-time students, approximately 56 percent were at
universities. Of total degrees awarded in 2001-2002 academic year, just under 64 percent of
associate’s degrees were awarded to women, while nearly 60 percent of bachelor’s and graduate
degrees were awarded to women.
Like most states, higher education has become the swing factor in balancing the budget;
however, New Mexico spending on higher education has remained strong compared to national
trends. As shown in exhibit 6.8, over the last fifteen years, state General Fund recurring
spending for higher education has increased from the high $200 million to the high $600
million level. Over the same time period, the share of General Fund recurring expenditures on
higher education has drifted slightly downward from about 17 percent to about 15 percent. The
state typically ranks in the top nationally for state and local spending for higher education on a
per capita basis as well as on a percentage of general spending basis.
In contrast to public schools, the funding formula for higher education is not contained in
statute. Rather, various state statutes direct the Commission on Higher Education to develop a
funding formula and provide general guidance on the state’s priorities. In 2002, a blue ribbon
task force modified the state’s higher education funding formula by developing a simple “base-
plus-incentive” funding model to determine an institution’s base expenditure level. The model
begins with the current appropriation, recognizes increases or decreases in workload driven by
enrollment changes and the mix of courses offered. Formula-generated transfers, such as
building renewal and replacement, equipment renewal and replacement and three percent
scholarships, are added, then revenue credits, such as land and permanent fund, mill levy, and
tuition revenue credit, are subtracted. The formula adjusts for compensation increases and
recognizes changes in fixed costs such as utilities, library acquisitions, health insurance and risk

21
management premiums. This model is similar to the public school funding formula that is
based on the basic costs to “open the doors.” The model is largely input driven, although the
task force recommended five incentive funds to address other components of institutional
missions. One of these funds, the Performance Fund, is intended to offer performance awards
to institutions based on achieving targeted outcomes.
Health and Welfare. As shown in exhibit 6.8, health and human services programs have
grown significantly in the last fifteen years. Within the health and welfare category, the
Medicaid program represents a significant driver of General Fund spending growth.
As is the case in many other states, eligibility demands and changes in federal Medicaid policy
put strong pressures on state spending. Total General Fund recurring spending for health and
welfare has risen from over $200 million to about $1 billion over the last fifteen years. This
component of the state budget has mushroomed from about 15 percent of recurring spending to
about 23 percent.
The Medicaid program has shown dramatic growth in recent years as reflected in Figure 6.8; on
a total expenditure basis, the size of the program has increased by $1.2 billion in six years, from
$1.5 billion in FY 2001 to $2.7 billion in FY 2006. Principal drivers of the cost of Medicaid are
large increases in medical costs, increased utilization of services, prescription drugs, new
technologies, and growing enrollments, particularly in the state’s implementation of home-
based personal care services. Further, changes in the share of cost borne by the federal
government (the federal medical assistance percentage rate) tend to create a degree of
uncertainty in state funding requirements for the program from year to year.
Within the other health and human services category, an important program is the Temporary
Assistance for Needy Families (TANF) program, which replaced the federal Aid to Families
with Dependent Children program with the enactment of welfare reform. The new program is
financed largely with a federal block grant. However, states must demonstrate that they have

22
maintained state funding at a level at least equal to that prior to welfare reform. This so-called
maintenance of effort is presently about $32 million for New Mexico. Other programs in this
category include services to the developmentally disabled, behavioral health services, juvenile
justice, child care, foster care and adoption responsibilities.
Public Safety. The public safety component of General Fund appropriations mostly goes to the
Department of Corrections and the Department of Public Safety. The Corrections budget is
driven by inmate population growth which had surged due to annual increases above 5 percent.
More recently, inmate population growth has slowed, due to alternative sentencing
considerations.
Other. Nominal appropriations to other categories of General Fund recurring spending have
increased over time, these components have remained relatively stable as a percentage share of
total recurring spending. In effect, the other components of state government spending are quite
small in relation to the total operating budget. Efforts to constrain spending within these
components result in only marginal savings.
CAPITAL OUTLAY AND DEBT
Funding sources. Exhibit 6.10 shows capital outlay appropriations and funding sources for
the last five-years. Funding ranged from $250 million to $628 million. The principal sources
of funding are severance tax bonds, general obligation bonds and General Fund cash.
Severance tax bonds are revenue bonds, where revenue from taxes on the value of natural
resource extraction, primarily oil and gas, is dedicated to repay bonds. General obligation
bonds are backed by the full-faith and credit of the state and paid for by a statewide property tax
levy. Total general obligation debt may not exceed one percent of the assessed value of
property in the state (assessed value equals one-third of market value). Projects financed by
General obligation bonds must be approved by the voters. The General Fund and other state
funds also are used to pay for capital projects on a cash basis. Revenue from these sources,

23
however, can be uneven. Roads and other transportation projects are financed from the
transportation projects and revenue enhancement fund.
In addition to annual appropriations, a continuing appropriation of supplemental severance tax
bonds is authorized for public school construction. This program was initiated in the late 1990s
due to equity concerns raised in litigation by predominantly Native American school districts.
FY 2004 supplemental severance tax bonds were $152 million, and 2004 awards to districts
were $85 million.
EXHIBIT 6.10
Capital Outlay Funding Sources
0
50,000
100,000
150,000
200,000
250,000
2000 2001 2002 2003 2004
Fiscal Year
Thou
sand
s of
Dol
lars
Severance Tax Bonds Supplemental Severance Tax Bonds General Fund Cash General Obligation Bonds Other State Debt. Outstanding state debt for New Mexico has increased significantly over the past
decade, reaching $2.7 billion in 2004, with annual growth averaging about 16 percent (see
exhibit 6.11). This compares to the national average growth rate of 7 percent. Historically low

24
interest rates, state fiscal downturns, and several large jumbo deals (i.e. pension obligation
bonds) have prompted states’ and local government’s debt issuance to rise rapidly in recent
years. Two common ways of measuring debt levels include debt per capita and debt as a
percentage of personal income. According to a report by a major bond rating agency, New
Mexico’s net tax-supported per capita debt in 2003 was $962 compared to the national median
of $701. New Mexico’s net tax-supported debt as a percentage of 2002 personal income was
4.1 percent compared to the national median of 2.4 percent.
New Mexico’s general obligation bonds have grown modestly over the past decade compared to
revenue bonds. State transportation bonds account for most revenue bond growth. Starting in
1996, the state’s issuance of transportation bonds increased dramatically to build badly needed
infrastructure improvements. Secondarily, policymakers saw the increased infrastructure
expenditures, accommodated by debt issuance, as a way to further economic development.
Innovative financing techniques introduced by the Federal Highway Administration, which
included a direct pledge of federal funds for bond repayments, also encouraged the issuance of
transportation bonds.
In addition, the Legislature has established several revolving loan funds and grant programs to
assist local government with their capital needs by providing zero to low-interest loans or
grants. For example, the New Mexico Finance Authority administers an annual distribution of
75 percent of the state's governmental gross receipts tax deposited into the public project
revolving loan fund to make low-cost, low-interest loans for infrastructure, equipment
emergency projects to state and other governmental entities or grants to disadvantaged entities.

25
EXHIBIT 6.11
State of New Mexico Debt Outstanding(Fiscal Years)
0
500
1,000
1,500
2,000
2,500
3,000
1994 1995 1996 1997 1998 1999 2000 2001 2002 2003 2004
Mill
ions
($)
General Obligation Bonds Severance Tax Bonds Highway Bonds Educational Institutions Miscellaneous
Source: Board of Finance, Transportation Department
LOCAL GOVERNMENT FINANCES
Municipalities. There are currently one hundred and one incorporated municipalities in New
Mexico, with the distribution by population indicated in exhibit 6.12.5 New Mexico
municipalities are very different with respect to size and economic base. Few of the thirty-five
towns with a population of less than 1,000 can be considered to have a strong economic base.
Small city fiscal problems are quite distinct from those faced by large cities such as the city of
Albuquerque, with almost 450,000 people in 2000.

26
EXHIBIT 6.12 New Mexico Incorporated Municipalities by Population, 2000 Population Size Number Under 1,000 35 1,000–5,000 33 5,000–10,000 15 10,000–25,000 8 Over 25,000 10 TOTAL 101 Source: U.S. Bureau of the Census, 2000 Census of Population and Housing.
Despite the obvious scale differences, New Mexico law offers very similar financial options to
all municipalities.6 Major sources of revenue for all New Mexico cities are shown in exhibit
6.13. The gross-receipts tax, including both the state-shared distribution to cities of 1.225
percent of the state gross-receipts tax and the local-option gross-receipts taxes, account for a
vast share of total General Fund revenues. Indeed, gross receipts taxes amounted to over 70
percent of total General Fund revenues in fiscal year 2003. The statewide gross-receipts tax
rate is 5.0 percent; this includes a 1.225 percent distribution to municipal governments. Prior to
January 1, 2005, the state rate was 5.0 percent, but a 0.5 percent credit was provided on goods
and services purchased in municipalities, implying an effective rate of 4.5 percent within
municipal boundaries. As noted earlier, the credit was ended to offset the revenue loss
associated with the elimination of the gross receipts tax on food and certain medical services in
2005.
The state distribution of the 1.225 percent of the statewide gross-receipts tax to municipalities is
based on transactions in each municipality.7 The first local-option municipal gross-receipts tax
was authorized in 1955, repealed in 1969, and again authorized in 1975. Currently
municipalities may impose at their option a rate of up to 1.25 percent in 0.25 percent increments
on top of the effective statewide rate.8 Over the years, the state also has authorized various
special purpose gross receipts taxes, such as the “quality-of-life” fund in Albuquerque. Special
purpose gross receipt taxes often require that municipal governments put the proposed tax
increase and use of the proceeds to a vote. The second largest revenue raiser for municipal

27
governments’ is property taxes, but the property tax accounts for less than 6 percent of
Municipal General Fund revenues. In short, New Mexico municipalities’ have an unbalanced
revenue structure, and are extremely dependent on a single tax—the gross receipts tax.
EXHIBIT 6.13 Revenues of New Mexico Municipalities FY 1990 (in millions of dollars) General Fund Property (current) 40.5 Franchise 30.5 Gross Receipts-State Shared 283.5 Gross Receipts-Local Options 199.5 License and Permits 14.9 Gasoline Taxes 3.0 Motor Vehicle 2.2 Small Cities Assistance 2.9 Other 108.1 Subtotal 685.1 Correction 41.7 Environmental Gross Receipts 4.4 Fire Protection 7.5 Law Enforcement 8.4 Lodgers’ Tax Act 23.6 Municipal Street 31.2 Recreation 6.2 Intergovernmental Grants 153.1 Capital Project Funds 813.6 General Obligation 71.5 Revenue Bonds 7.9 Debt Service Other 19.2 Enterprise Funds 1,433.0 Other Funds 310.7 TOTAL REVENUES $3,617.1 Source: New Mexico Department of Finance and Administration, Financial and Property Tax Data, Fiscal Year 2003 Annual Report.
Expenditures by New Mexico cities follow the national pattern Major expenditures support
police protection, fire protection, streets, and sanitation. Other services, most importantly water
and sewer often are provided by cities and financed as government enterprises.
County Governments. There are thirty-three counties in New Mexico, including the Los
Alamos city/county. Fiscal Year 2003 revenues are summarized in exhibit 6.14. The property
tax is the major source of tax revenue for county governments, accounting for about two-thirds
of total General Fund revenues. In 1983 the county gross-receipts tax was enacted, authorizing

28
counties to impose a gross-receipts tax by ordinance of a maximum of 0.375 percent (in three
increments of 0.125 percent). Gross receipts taxes raise about 15 percent of General Fund
revenues. Proceeds from the first increment can be used for general county purposes. The
additional two increments replaced the prior county sales tax, and a portion of the proceeds
must be dedicated to indigent health care.9 There are also a number of limited county local
option taxes available for earmarked purposes such as county hospitals and jails. These are
often limited to specific counties under special circumstances, however. Counties also received
a distribution of the state gasoline tax, which goes to a county road fund. Major expenditures by
the counties are for hospitals, streets and roads, and law enforcement.
EXHIBIT 6.14 New Mexico County Revenues FY 1990 (in millions of dollars) General Fund Property Tax--Current 193.4 Property Tax-Other 48.5 Gross Receipts Taxes 57.2 Other 68.6 Subtotal 367.7 Correction 15.9 Environmental Gross Receipts 11.6 Road Fund 38.5 Fire Protection 14.0 Intergovernmental Grants 9.6 Indigent 37.2 County Fire Protection 10.6 Community DWI Program 6.1 Jail-Detention 6.3 Capital Project Funds 105.0 General Obligation 14.6 Revenue Bonds 9.8 Debt Service-Other 11.8 Enterprise Funds 44.3 Other Funds 125.0 TOTAL 828.0 Source: New Mexico Department of Finance and Administration, Financial and Property Tax Data, Fiscal Year 2003 Annual Report.
Notes
1. This chapter was written by staff from the New Mexico Legislative Finance Committee.
Participants included David Abbey, Director, Cathy Fernandez, Deputy Director, Bill Taylor,
Assistant Director, Arley Williams, Linda Kehoe, Gary Chabot and Mark Weber, Principal

29
Analysts, and Olivia Padilla-Jackson, Economist. It represents an update of the 1989 version
authored by Brian McDonald and Juliana Boyle of the University of New Mexico Bureau of
Business and Economic Research and the 1981 chapter authored by professor Gerald J. Boyle,
who passed away in July 1991.
LFC staff would like to acknowledge a debt of gratitude on behalf of the entire state to
professor Gerald Boyle, the initial author of this article, and for many years a guiding force in
New Mexico public finance. Professor Boyle left a lasting imprint by training and helping to
place numerous distinguished fiscal professionals with the state, including John Gasparich, John
Kormanik, James O’Neil, Aug Narbutus, Charles Turpen, Janet Peacock and others.
2. U.S. Department of Commerce, Governmental Finances: FY 2001–02, Table 1. State and
Local Government Finances.
3. Comparative 2004 tax data extracted from CQ’s State Fact Funds