Embed Size (px)
Citation preview

THE FISCAL POLICY RESPONSE TO INFLATION
The Congress of the United StatesCongressional Budget Office
For sale by the Superintendent of Documents, U.S. Government Printing OfficeWashington, D.C. 20402

PREFACE
The Congressional Budget Office is required by Section 202(f)of the Congressional Budget Act of 1974 (Public Law 93-344) tosubmit an annual report on budgetary options. This year, thereport is in two parts: The Fiscal Policy Response to Inflationand Five-Year Budget Projections and Alternative Budgetary Strate-gies for Fiscal Years 1980-1984.
Part I, The Fiscal Policy Response to Inflation, is one ofa series of reports on the state of the economy issued periodicallyby the Congressional Budget Office. In accordance with CBO'smandate to provide objective analysis, the report contains norecommendations. The report was prepared by George Iden, CorneliaMotheral, Steve Zeller, Lawrence DeMilner, Nariman Behravesh, JoanSchneider, Marvin Phaup, Yolanda Kodrzycki, Rebecca Summerville,Toni Gibbons, John Jacobson, and Asa Strong, under the direction ofWilliam J. Beeman and James E. Annable. Marion F. Houstoun andRobert L. Faherty edited the manuscript; Dorothy J. Kornegay, JudyDeason and Marsha Mottesheard patiently typed the many drafts.
Alice M. RivlinDirector
January 1979
111


CONTENTS
Page
PREFACE Ill
SUMMARY xl
CHAPTER I. INTRODUCTION 1
CHAPTER II. RECENT ECONOMIC TRENDS 5
Trends in Final Sales . . . . 5Output and Inventory Investment ...... 19Trends in Employment:, Wages, and Prices . . 19
CHAPTER III. POLICY DEVELOPMENTS AND THE ECONOMIC OUTLOOK . 25
Recent Policy Developments 25Impact of Fiscal Policy 26The Administration's $30 BillionDeficit Goal . 29Monetary Policy 29Wage/Price Standards 34The CBO Forecast 35
CHAPTER IV. SHORT-TERM FISCAL POLICY 41
Fiscal Policy Alternatives for 1980 .... 42Maintaining Short-Run Budget Flexibility . . 48Especially Severe Unemployment Problems . . 50Conclusion 53
CHAPTER V. LONGER-RUN ECONOMIC GOALS 55
The Humphrey-Hawkins Goals 55The Trade-Off Between Inflation andUnemployment 61Reducing Both Unemployment and Inflation . . 65
APPENDIX A.
APPENDIX B.
THE ADMINISTRATION'S WAGE /PRICE PROGRAM . .
EFFECTS OF CHANGES IN THE CORPORATE INCOMETAX RATE AND IN ACCELERATED DEPRECIATION:SIMULATIONS WITH THREE MACROECONOMIC MODELS
71
79


TABLES
Page
TABLE 1. CHANGES IN FINAL SALES AND ITS MAJOR COMPONENTS:PERCENT CHANGE, IN CONSTANT DOLLARS 6
TABLE 2. AVERAGE MATURITY OF NEW CM INSTALLMENT LOANSAT FINANCE COMPANIES 9
TABLE 3. THREE-MONTH ABSORPTION RATE FOR UNFURNISHEDAPARTMENTS AND RENTAL VACANCY RATE 12
TABLE 4. BUSINESS FIXED INVESTMENT AND CAPACITYUTILIZATION 14
TABLE 5. MEASURES OF LABOR MARKET SLACK 21
TABLE 6. RATES OF CHANGE IN PRICES; PERCENT CHANGES,ANNUAL RATE 23
TABLE 7. FEDERAL BUDGET UNDER CURRENT POLICY, FISCALYEARS 1977-1980: IN BILLIONS OF DOLLARS ..... 28
TABLE 8. INTEREST RATES AND ANNUAL GROWTH RATES OFSELECTED MONETARY AGGREGATES, CALENDAR YEARS1976-1978 31
TABLE 9. ECONOMIC PROJECTIONS BASED ON CURRENT POLICY,CALENDAR YEARS 1979 AND 1980 . . . . 36
TABLE 10. ESTIMATED ECONOMIC EFFECTS OF $15 BILLION AND$25 BILLION REDUCTIONS IN FEDERAL EXPENDITURESFROM CURRENT POLICY, FISCAL YEAR 1980 BUDGET . . 43
TABLE 11. ESTIMATED ECONOMIC EFFECTS OF $15 BILLIONREDUCTION IN FEDERAL INDIVIDUAL INCOME TAXES,EFFECTIVE JULY 1, 1979 OR JANUARY 1, 1980 .... 51
TABLE 12. UNEMPLOYMENT RATES AND SHARES OF LABOR FORCEBY AGE-SEX GROUP 58
vii

APPENDIX TABLE
TABLE B-l. EFECTS OF CHANGES IN BUSINESS TAXES: A COMPARISONOF RESULTS BASED ON THREE MACROECONOMIC MODELS . . 81
viii

FIGURES
Page
FIGURE 1. PERSONAL INCOME AND RETAIL SALES .
FIGURE 2. INDEX OF CONSUMER SENTIMENT
FIGURE 3. CONSUMER INSTALLMENT CREDIT OUTSTANDING ASA PERCENT OF DISPOSABLE PERSONAL INCOME(ANNUAL RATE)
FIGURE 4. CONSUMER INSTALLMENT CREDIT REPAYMENTS AS APERCENT OF DISPOSABLE PERSONAL INCOME . . .
FIGURE 5. INTEREST RATES AND SAVINGS FLOWS
FIGURE 6. STATE AND LOCAL GOVERNMENT RECEIPTS,EXPENDITURES, AND SURPLUSES
FIGURE 7. FEDERAL GRANTS-IN-AID TO STATE ANDLOCAL GOVERNMENTS
FIGURE 8. IMPORTS AND EXPORTS OF GOODS AND SERVICES,NIA BASIS
FIGURE 9. FEDERAL FUNDS RATE AND THREE-MONTH TREASURYBILL RATE
FIGURE 10. UNEMPLOYMENT AND INFLATION
FIGURE 11. ALTERNATIVE FIVE-YEAR PATHS
7
8
10
10
13
16
17
18
30
57
63
IX


SUMMARY
In 1978, unemployment declined appreciably, but inflationaccelerated to near record levels for the postwar period. Today,there is widespread agreement that inflation is the major problemfacing policymakers. As a result, the Administration has proposedspending cuts and introduced a new wage/price guidelines program,and the Federal Reserve has adopted tighter monetary policies.
A major question before the Congress is what can, or should,fiscal policy do to mitigate inflation? The most discussed optionsare:
o Holding the fiscal year 1980 budget at current policylevels, as set forth in the second budget resolution for1979;
o Reducing spending moderately below current policy levels(similar to the Administration's proposal); or
o Cutting spending substantially below current policylevels.
The adoption of a restrictive fiscal policy would complementthe anti-inflation program of the Administration and the FederalReserve. The available evidence, however, indicates that theresulting reduction in inflation would be small, unless restrictiveeconomic policies were maintained for a prolonged period. Mean-while, unemployment would increase and remain relatively high.
Even if the current policy budget were enacted, unemploymentis expected to rise in 1979. The Congressional Budget Office(CBO), like the majority of forecasters, now predicts a downturn ineconomic activity sometime during 1979, with jobless rates through1980 well above current levels. In addition to rising unemploy-ment, a significant weakening of the economy is expected to bringlarger budget deficits, as a result of reduced revenue growth andincreased spending for unemployment 'Compensation and other socialprograms.
XI

THE CBO CURRENT POLICY FORECAST
Forecasts of economic activity and inflation depend criticallyon assumptions about fiscal and monetary policy. The CBO economicprojection is based upon the following policy assumptions:
o Federal tax and spending policies in fiscal year 1979are as given in the budget resolution enacted last fall;the same policies are also assumed to continue in fiscalyear 1980. Current policy outlays are estimated to totalabout $494 billion in fiscal year 1979 and $551 billion infiscal year 1980.
o Neither the real wage insurance proposed by the Administra-tion as part of its wage/price guidelines program nor anytax changes, other than those already enacted, are includedin the forecast. Expenditure cuts proposed by the Admin-istration are also not included. _!/
o Monetary authorities sire assumed to continue in the recent-ly announced program to reduce inflation and preventfurther depreciation of the dollar. This policy is assumedto prevent the growth in the broadly defined money stock(M2) from exceeding Federal Reserve targets and to resultin a further rise in short-term interest rates through thesecond quarter of 1979.
Given those assumptions, the CBO forecast, shown in SummaryTable 1, is as follows:
o Growth in constant dollar gross national product (GNP)will slow from over 4 percent last year to a 0 to 2 percentrange from the fourth quarter of 1978 to the fourth quarterof 1979. During 1980, real economic growth will recovermoderately, rising to a 3 to 5 percent range.
JL/ A CBO forecast based upon the Administration's fiscal assump-tions will appear in the CBO document, An Analysis of thePresident's Budgetary Proposals for Fiscal Year 1980 (January1979).
XII

o Unemployment is expected to rise from current levelsto a range of 6.2 to 7.2 percent by the last quarter of1979, with little change in 1980.
o Prices are expected to rise by 7.0 to 9.0 percent during1979, moderating somewhat, to 6.5 to 8.5 percent, in1980.
SUMMARY TABLE 1. SUMMARY OF CBO ECONOMIC PROJECTIONS UNDER CURRENTPOLICY, CALENDAR YEARS 1979 AND 1980
1976:4 1977:4:to 1977:4 to 1978:4 1978:4 1979:4
Economic Variable (actual) (actual) to 1979:4 to 1980:4
GNP (current dollars,percent change) 11.9 12.9 7.0 to 11.1 9.7 to 13.9
GNP (1972 dollars,percent change) 5.5 4.3 0.0 to 2.0 3.0 to 5.0
Consumer Price Index(percent change) 6.6 8.9 7.0 to 9.0 6.5 to 8.5
Unemployment Rate, Endof Period (percent) 6.6 5.8 6.2 to 7.2 6.2 to 7.2
The economy is not projected to weaken immediately. Availabledata on real activity do not yet show the widespread imbalancesthat typically precede a downturn. But CBO does foresee a modestdecline in real GNP beginning in the second half of 1979. 2_l
_2/ The CBO forecast satisfies the popular definition of a reces-sion—two consecutive quarters of decline in real GNP—butit may not conform to the National Bureau of Economic Researchdefinition of recession, which takes many other factors intoaccount.
xixa

Sources of Uncertainty
The Major Uncertainty. The outlook for the economy in1979 is unusually uncertain. The critical factors in this uncer-tainty are the future course of inflation and the response ofmonetary policy. Restrictive monetary policies already in placehave increased the probability of a downturn in economic activityin the year ahead, and most forecasters, including CBO, expectcredit conditions to tighten further in response to continued rapidinflation. But that outcome is by no means assured. Forecastsof inflation are subject to substantial error, and the FederalReserve's policy response to inflation and other developments inthe coming months is also uncertain. If inflation slows signifi-cantly in the months ahead, the Federal Reserve may be able toavoid a prolonged period of credit restraint, which would consider-ably improve the prospects of avoiding a recession this year.
Other Sources of Uncertainty. Other events that could signi-ficantly affect the outlook include: the possibility of majorstrikes, in response to business firms' efforts to comply with theAdministration's Vage/price guidelines; prolongation of thecurrent "buy-in-advance" psychology, born of a general expec-tation of rising prices; fuel shortages, arising from the politi-cal disturbances in Iran or other causes; a sharp shift in thevalue of the dollar in foreign exchange markets, despite stabili-zation efforts; and exceptionally large or small harvests, causinglarge unexpected movements in food prices.
Reasons for a Downturn in 1979
Although the economy does not yet show significant signs ofweakening, continued high rates of inflation appear to be sowingthe seeds of a downturn. The momentum of inflation is very strongand CBO expects that the Administration's wage/price guidelineprogram will not quickly slow that momentum. Thus, the FederalReserve, which has responded to accelerating prices by tighteningcredit, is expected to continue to pursue a tight monetary policy.The prospect of continued high and rising interest rates for manymonths makes a subsequent downturn in economic activity the mostlikely outcome.
Tight credit conditions are expected to slow housing activityand business investment. But the predicted decline in housingstarts has been delayed longer than in earlier periods of high
xiv

interest rates. The availability of funds for mortgage lendinghas not been reduced to the usual extent because deposit flows havebeen boosted by the six-month money market savings certificateintroduced by savings institutions last spring. Virtually allanalysts, however, expect a decline in housing activity during1979, both because of declining demand and reduced availability ofmortgages. Recent surveys of business investment plans alsoindicate a slowdown in 1979. Moreover, retail sales appear vulner-able. Indications of slower future growth in consumer spendinginclude:
o High rates of inflation, which have eroded real incomegrowth and contributed to a buy-in-advance psychologythat may have improved recent sales at the expense ofsales later in the year;
o A decline in consumer confidence; and
o Historically high consumer debt burdens.
Reasons for a Mild Downturn and Recovery
Although some forecasters now expect a deep recession begin-ning late this year, CBO concludes that the projected late 1979downturn will be neither deep nor prolonged because:
o Businesses appear to have maintained relatively leaninventories; hence, any inventory adjustment should bemild;
o Net exports are projected to be a source of considerablestrength, as a result of an expected improvement in theeconomic growth of U.S. trading partners and because of thedepreciation of the dollar last year;
o The cut in income taxes early in 1979 is expected toprovide stimulus to business and consumer spending through-out the year;
xv
o Large backlogs in orders in capital goods industries willprovide support to total spending during the slowdown;and
o The state and local sector is expected to continue towork down operating surpluses.
CBO predicts a less robust recovery in 1980 than the typicalpostwar upswing because the downturn is expected to be mild andinflation is forecast to remain high. As a result, monetarypolicy is not projected to respond as much as usual to the elevatedunemployment rates. Furthermore, federal fiscal policy (withcurrent policy) will exert a drag on economic activity in 1980, asthe interaction of inflation and the progressive tax structurecauses effective personal income tax rates to rise.
BUDGET OPTIONS
Economic assumptions are a critical aspect of budget esti-mates. When there is a slowdown in real economic activity, thebudget responds automatically to increase the deficit, therebycushioning the downturn. That is, outlays for unemployment in-surance, social security, and other social programs increasewithout Congressional action, and federal receipts grow more slowlyas a result of reduced growth in income, especially in corporateprofits.
The slowdown in economic activity that CBO projects undercurrent policy to occur late in 1979 results in a projected rise inthe federal deficit in fiscal year 1980. CBO's estimate of thedeficit that year (under current policy) is about $49 billion, $20billion above the Administration's estimate (see Summary Table 2).
Economic assumptions account for a significant part ofthat discrepancy. The differences between the Administration'sproposed budget and CBO's current policy budget estimate arelargely on the spending side. ̂ / The President has proposed cuts
_3/ Administration and CBO revenue estimates are more similarbecause the weaker economy in the CBO forecast is largelyoffset by the projected higher rate of inflation. Real wageinsurance is the major policy difference affecting revenues.
xvi

SUMMARY TABLE 2. THE FEDERAL BUDGET OUTLOOK UNDER CURRENT POLICY,FISCAL YEARS 1977-1980: IN BILLIONS OF DOLLARS
Actual Projected
1977 1978 1979 1980
Receipts
Outlays
Deficits
356.9
401.9
45.0
402.0
450.8
48.8
453.3
493.8
40.5
502
551
49
amounting to about $11.5 billion relative to current policy. Inaddition, differences in estimating procedures and the Administra-tion's more optimistic forecast for inflation and unemploymentreduce outlays by about $8.5 billion relative to CBO's currentpolicy estimate. Thus, if CBO's economic forecast is correct,reaching the Administration's goal of a $30 billion deficit infiscal year 1980 would require a larger cut in spending than thatproposed by the Administration, kj
Because of the uncertainty in the economic outlook and theautomatic response of the budget to economic conditions, thefederal deficit cannot be controlled with precision. Furthermore,because the deficit reflects the level of economic activity as wellas changes in budget policy, it is a misleading indicator of theimpact of fiscal policy on the economy. Discretionary policychanges in the budget are a more useful measure of the economiceffects of fiscal policy.
kj The Administration's budget was not available in time to beanalyzed in detail in this report.
xvii
8-418 0-19-2

Given the objective of reducing inflation, the discretionarybudget choices for fiscal year 1980 appear to be:
o Enact the current policy budget;
o Cut spending moderately as in the Administration's pro-posal, or more sharply,, as proposed by others; or
o Combine a spending cut with a cut in taxes.
As usual, CBO's forecast is based upon the first option. Toassist Congress in its budget decisions, CBO has also examined theimpact of a $15 billion and a $25 billion cut in spending belowcurrent policy levels. The composition of the spending cuts andrough estimates of their economic impact are shown in Summary Table3. Those estimates reveal that spending cuts would rapidly resultin employment losses, but their impact on inflation would berelatively small during the first two years. If these more re-strictive policies were maintained, however, the eventual responseof inflation would be significantly larger.
A third option, also shown in Table 3, is a $25 billionspending cut combined with a $15 billion payroll tax cut. Thisoption would reduce the size of the government sector while limit-ing its restrictive effect on the economy. A cut in payroll taxeswould reduce inflation more than other types of tax cuts. Thedisadvantage of this option, however, is that it would requirefinancing social security from a source other than the payroll tax.
In choosing among such options, maintaining a considerabledegree of flexibility seems desirable because of the uncertainty inthe economic outlook. If, for example, the downturn is sharperthan expected, the Congress might want to cut income taxes—usuallythe easiest and quickest stimulative budget change to enact andimplement. On the other hand, if a slowdown does not develop, morerestrictive measures may be desired, in order to prevent inflationfrom accelerating as a result of excess demand.
xviii

SUMMARY TABLE 3. ESTIMATED EFFECTS OF THREE FISCAL POLICY OPTIONSFOR FISCAL YEAR 1980 AFTER EIGHT QUARTERS
Economic Variable$15 BillionSpending Cut
$25 BillionSpending Cut
$25 BillionSpending Cut
and $15 BillionPayroll Tax Cut
GNP (billions ofcurrent dollars)
GNP (billions of1972 dollars)
Unemployment Rate(percent points)
-28
-13
0.3
Employment (thousands) -500
Consumer Price Index(percent change frombase) -0.2
-46
-20
0.6
-900
-0.4
-32
-6
0.3
-500
-0.8
NOTE: The composition of the expenditures reductions are asfollows:
$15 Billion $25 Billion
TransfersPurchasesGrantsPSE
$7.05.03.00.2
TransfersPurchasesGrantsPSE
$11.06.08.05.3
The disproportionately large impact of the $25 billionspending cut on employment and unemployment is due to theheavy reduction in public service employment (PSE).
xix

LONG-TERM ECONOMIC GOALS
The Congress recently enacted legislation setting forthlong-run goals for reducing unemployment, inflation, and thefederal budget deficit. The 1978 Humphrey-Hawkins Act establisheda goal of not more than 4.0 percent unemployment and 3.0 percentinflation by 1983. 5/
These goals may not be achievable with traditional fiscal andmonetary policies, because such policies reduce inflation bycreating slack in the economy. Postwar experience indicates that,given the current momentum of inflation, a reduction in inflationto 3.0 percent by 1983 could be achieved only by maintaining highrates of unemployment for a prolonged period. Even if inflationand unemployment could be reduced to Humphrey-Hawkins levels in thetime period mandated, it may be impossible to maintain these rateswith traditional policies. Four percent employment implies tightlabor and product markets, which would likely lead to acceleratinginflation.
Thus, in addition to budget questions, the Congress will beasked to consider whether inflation should be fought with monetaryand fiscal policies alone or whether other tools, such as theAdministration's real wage insurance, should be introduced. Al-though there is little experience by which to judge that proposal,it is not likely that the Administration's wage/price program couldreduce inflation enough to achieve the Humphrey-Hawkins goals by1983. To do so would require a degree of voluntary cooperationunprecedented in peacetime.
_5/ This act gives primacy to the unemployment rate goal,
xx

CHAPTER I. INTRODUCTION
Prices increased rapidly in 1978. The Consumer Price Index(CPI) rose about 9 percent—the highest rate of inflation in 30years, except for 1974. Inflation is thus a key factor in theshort-term and longer-term prospects for the economy and stronglyinfluences the fiscal policy choices now facing the Congress.
The Short-Term Outlook. The current rapid rate of inflationis planting the seeds for a slowdown in economic growth:
o In response to the acceleration in inflation and theassociated decline in the international exchange valueof the dollar, the Federal Reserve has significantlytightened credit conditions since mid-1978; the resultinghigher cost of borrowed funds is expected to slow economicactivity later this year, especially in housing andbusiness investment;
o Consumer surveys suggest that rapid inflation has led toa buy-in-advance psychology, boosting current sales at theexpense of consumption later;
o In part because sharp increases in prices tend to befollowed by downturns in economic activity, consumerand business confidence in future economic conditions hasdropped substantially, and apparently has contributed tothe adoption of cautious spending plans for 1979.
Although inflation has resulted in conditions that may lead toa slowdown in the economy later this year, the current momentumof growth in economic activity is strong. Year-end gains in retailsales, production, employment, and new orders were substantial,portending continued growth into the beginning of 1979. These twocrosscurrents—pressures for a slowdown, resulting from rapidinflation, and the current strength of overall activity—make thedetails of the short-term outlook very uncertain. There is,however, widespread consensus that overall growth will slow as 1979progresses, causing the unemployment rate to rise. Indeed, manyforecasters believe that this slowing of growth will turn into arecession late in the year, with the economy rebounding somewhat in1980.

This short-term outlook and the fiscal policy choices associ-ated with it occupy the bulk of this report. Chapter II reviewscurrent economic trends, with special emphasis on the cross-currents caused by the current momentum in both real activity andinflation. Chapter III presents the CBO forecast, which assumescontinuation of current fiscal policy; Chapter IV analyzesalternative fiscal policies with particular emphasis on spendingcuts.
The Longer-Term Outlook. The current momentum of inflationwill also make it very difficult for the Congress to achieve itslonger-term goals for unemployment and inflation. As stated in the1978 Humphrey-Hawkins Act, by 1983, unemployment should not exceed4 percent and inflation should not be above 3 percent. But, giventhe current rate of inflation, the Humphrey-Hawkins goals may notbe achievable by monetary and fiscal policies alone. This isbecause fiscal and monetary policies slow inflation by creatingslack product and labor markets, and the evidence is that inflationresponds relatively slowly to slack markets. Moreover, even ifthese goals were achieved, they probably could not be sustainedafter 1983. (See Chapter V for analysis of the consistency of theHumphrey-Hawkins employment and price targets.)
Anti-Inflation Policy. The two principal questions to bedecided about the appropriate role of the budget in combatinginflation are:
o How restrictive should the initial budget be?
o If the unemployment rate does rise later this year ornext, what budgetary action—if any—should be taken?
A major message of the report is that the two questions arenot independent of each other. Restrictive fiscal and monetarypolicies can slow inflation, but past performance shows that theresulting improvement in prices comes slowly and only at theexpense of depressed growth and higher unemployment. The choicesare difficult, but there is no simple and cost-free way to reduceinflation quickly.
A related message is that the federal deficit can be amisleading indicator of the impact of fiscal policy on inflation.Adopting the Administration's proposed spending cuts, or enact-ing even larger reductions, does not ensure a deficit of $30billion or less in fiscal year 1980. If the unemployment rate doesrise significantly, the growth in federal revenues will slow

and spending will increase, resulting in a greater deficit. Evenwith a higher deficit, however, the additional slack in labor andproduct markets would help constrain wage and price inflation.


CHAPTER II. RECENT ECONOMIC TRENDS
As the Congress begins considering the first concurrentbudget resolution, the outlook for the economy is very uncertain.Much of the uncertainty results from conflicting current economictrends:
o Growth in economic activity was strong at the end of1978, as reflected in the sizable fourth-quarter gainsin retail sales, production, employment, and orders;
o But inflation accelerated from an already high rate,leading to tighter credit conditions and falteringconsumer and business confidence. JY
This chapter reviews current economic trends by sector and em-phasizes the crosscurrents set in motion by the momentum ofgrowth and continued inflation.
TRENDS IN FINAL SALES
In 1978, growth in constant dollar final sales slowed some-what from the 1977 pace; nevertheless, it was still high forthe fourth year of an expansion (see Table 1). In the finalquarter of the year, final sales grew at a particularly rapid 6.6percent pace.
Consumer spending in 1978 rose more slowly than during 1977,while housing expenditures were at about the same high level as theprevious year. After a rapid rise in 1977, real federal outlayswere also about unchanged during 1978. State and local spendinggrew a little more slowly. Fixed nonresidential investment con-tinued to rise at a relatively rapid rate. In addition, there washelp from the international sector, as constant dollar exports rosesharply while import growth remained near the 1977 rate.
I/ For an analysis of inflation momentum, see CongressionalBudget Office, Inflation and Growth; The Economic PolicyDilemma (July 1978), Chapter III.

TABLE 1. CHANGES IN FINAL SALES AND ITS MAJOR COMPONENTS: PER-CENT CHANGE, IN CONSTANT DOLLARS
1976:4 to 1977:4 1977:4 to 1978:4
Total Final Sales 4.9 4.3
Personal ConsumptionExpenditures 4.8 3.8
Fixed InvestmentResidentialNonresidential
Government PurchasesFederalState and local
Exports
Imports
11.115.39.1
5.16.34.3
-1.3
10.3
5.5-0.88.3
2.0-0.33.5
17.3
9.4
1
SOURCE: U.S. Department of Commerce, Bureau of Economic Analysis.
Consumer Spending
Growth in real personal disposable income slowed last yearfrom the 1977 rate, partly because inflation and real growth raisedeffective personal tax rates, but mainly because inflation out-stripped income growth. Nevertheless, consumer spending expandedsignificantly more than income. Late in 1978, as sales gainsoutstripped income gains (see Figure 1), saving as a percent ofdisposable personal income fell to below the 1977 average.
Consumer spending will be a f f ec ted by conflicting trendsin 1979 and 1980. On the plus side, the late 1978 employment andincome gains are expected to spur retail sales into 1979. Incontrast to the continued momentum resulting from the brisk paceof economic activity at year-end, however, other factors appear tobe slowing expansion of consumer spending:
° Consumer confidence appears to have dropped significantlyin recent months;
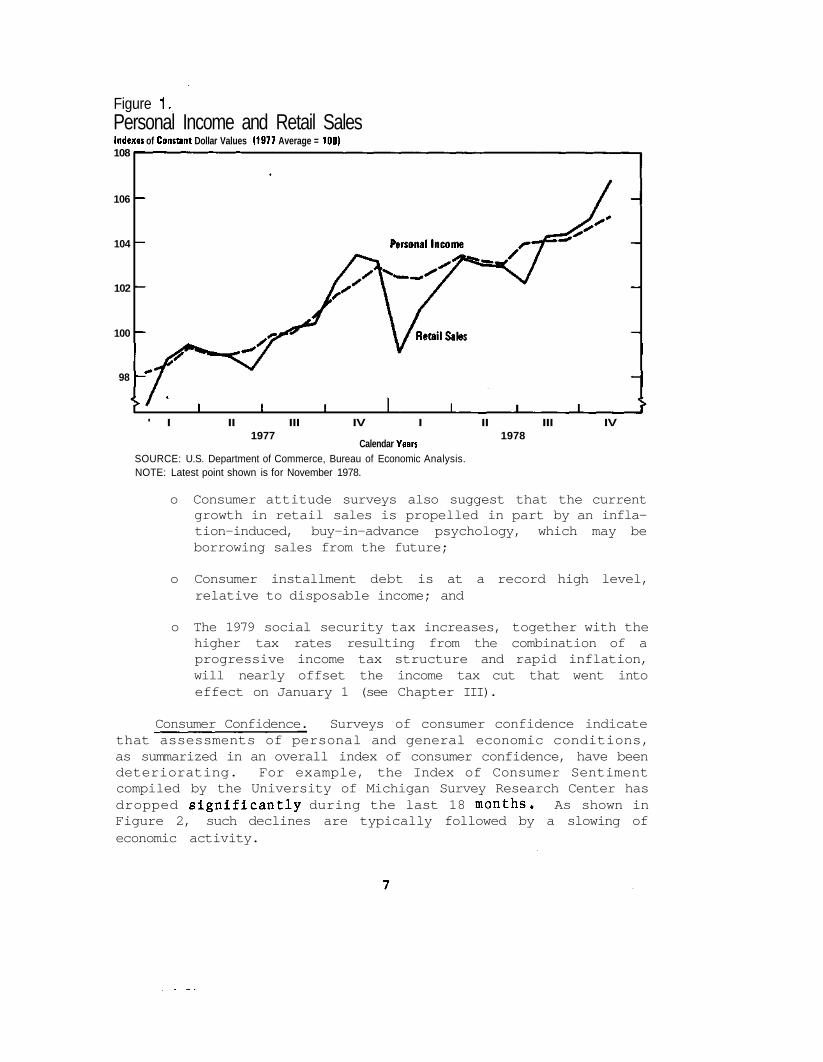
Figure 1.Personal Income and Retail SalesIndexes of Constant Dollar Values (1977 Average = 100)108
106
104
102
100
98
I' I II III IV I II III IV
1977 1978Calendar Years
SOURCE: U.S. Department of Commerce, Bureau of Economic Analysis.NOTE: Latest point shown is for November 1978.
o Consumer attitude surveys also suggest that the currentgrowth in retail sales is propelled in part by an infla-tion-induced, buy-in-advance psychology, which may beborrowing sales from the future;
o Consumer installment debt is at a record high level,relative to disposable income; and
o The 1979 social security tax increases, together with thehigher tax rates resulting from the combination of aprogressive income tax structure and rapid inflation,will nearly offset the income tax cut that went intoeffect on January 1 (see Chapter III).
Consumer Confidence. Surveys of consumer confidence indicatethat assessments of personal and general economic conditions,as summarized in an overall index of consumer confidence, have beendeteriorating. For example, the Index of Consumer Sentimentcompiled by the University of Michigan Survey Research Center hasdropped significantly during the last 18 months. As shown inFigure 2, such declines are typically followed by a slowing ofeconomic activity.

Figure 2.Index of Consumer Sentiment
(1966=100)
'60-'61 '62-'63 '64-'65 '66-'67 '68-'69 70-71
Calendar Years
72-73 74-75 76-77 78-79
SOURCE: University of Michigan, Survey Research Center.
NOTES: P = business cycle peakT = business cycle trough
As designated by the NationalBureau of Economic Research.
Shaded area indicates January to May 1967 "Mini-Recession."
The reported decline in consumer confidence resulted primarilyfrom greater pessimism about business conditions in the future; inparticular, the higher inflation and interest rates have ledconsumers to expect a weakening of economic activity.
Buy-in-Advance Pyschology. In the 1972-1974 period, accele-rating inflation and deteriorating confidence were accompanied by arising saving rate. The current low saving rates point to adifferent response to the recent inflation; consumers have evi-dently decided that buying now, before prices rise further, is theappropriate response to inflation. This inference is supportedby evidence from the Michigan survey. In November 1978, 34 percentof all families indicated that now is a good time to buy largehousehold goods, because prices are going up and will not comedown. That response is now occurring much more frequently than itdid in 1972-1974. Buy-in-advance sentiment about automobiles isalso relatively high.
To the extent that consumers have acted on buy-in-advancesentiment and purchased durable goods sooner than they would haveotherwise, current sales have been borrowed from the future. Someanalysts believe, for example, that auto sales have been above thefundamental trend rate for some time now.
8

(kmsumer Debt Burdens. The ratio of consumer installmentdebt to disposable income reached record highs in 1978 (seeFigure 3), suggesting that credit expansion is unlikely to fuelconsumer spending in 1979 to the same degree. 2j Reduced monetarygrowth will also compel cutbacks in some form of borrowing, withconsumer credit a possible candidate,.
The ratio of installment debt repayments to disposable incomealso reached new highs in 1978, as shown in Figure 4. An unusuallyhigh level of debt is now being supported with these payments, inpart because of the movement to longer-term auto loans. As carprices have risen, loans have been made for four and even fiveyears rather than for the traditional three years (see Table 2).Although longer-term auto loans enable a relatively greater levelof borrowing at a given level of income, they are likely to reduceauto spending eventually, as consumers postpone purchase of theirnext car because of the longer debt payoff period.
TABLE 2. AVERAGE MATURITY OF NEW CAR INSTALLMENT LOANS AT FINANCECOMPANIES
Average Maturity(in months)
Calendar Years
1972 34.8
1975 37.6
1976 38.8
1977 40.7
September1978 43.4
SOURCE: Board of Governors of the Federal Reserve System.
_2/ Consumer debt excludes home mortgages.

Figure 3.Consumer Installment Credit Outstanding as a Percent ofDisposable Personal Income (Annual Rate)
18.0
17.0
16.0
15.0
1967 1968 1969 1970 1971 1972 1973 1974 1975 1976 1977 1978Calendar Years
, SOURCES: Board of Governors of the Federal Reserve System; U.S. Department of Commerce,Bureau of Economic Analysis.
NOTE: Installment Credit data for 1967-69 linked to revised 1970 data by CBO; beginning in 1971, thedata include gasoline credit cards used by individuals.
Figure 4.Consumer Installment Credit Repayments as a Percent ofDisposable Personal Income
18.0
17.0
s£
16.0
1967 1968 1969 1970 1971 1972 1973 1974 1975 1976 1977 1978Calendar Years
SOURCES: Board of Governors of the Federal Reserve System; U.S. Department of Commerce,Bureau of Economic Analysis.
NOTE: Installment Credit data for 1967-69 linked to revised 1970 data by CBO; beginning in 1971, thedata include gasoline credit cards used by individuals.
10

Housing
Construction of new housing remained at a relatively high 2.0million units started in 1978—the same as in 1977. Althoughhousing starts remained high in the face of rapidly rising interestrates, they did not increase and therefore exerted a dampeninginfluence on overall economic activity.
The housing sector did not, however, develop many of theimbalances that typically occur toward the end of a buildingcycle. Vacancy rates for rental units remained low, and the"absorption rate" of apartments—that is, the percent rented withinthree months of going on the market—was about unchanged from thehigh level of the previous two years (see Table 3). Both factssuggest that overbuilding of multifamily units has not occurred.Nor is overbuilding generally evident in the market for single-family housing; however, the inventory of new houses for sale inNovember 1978 was somewhat higher, both absolutely and relative tosales, than it was a year earlier. Overall, the basic demographicstructure of the population suggests a fundamental need for justover 2 million new housing units a year—about equal to the pro-duction rate for the past year and a half.
A major imbalance in past building cycles—a widespreadshortage of mortgage funds—did not occur in 1978. In the past,funds available for housing finance declined when short-terminterest rates moved above the maximum rates permissible on sav-ings accounts in banks and savings-and-loan associations (seeFigure 5). Many depositors withdrew their funds from savingsaccounts and purchased higher-yielding assets (Treasury bills, forexample), thereby reducing the amount of funds available for homemortgages. To prevent such an outflow of funds when interest ratesrose last year, regulations were changed, effective June 1, 1978,to allow banks and savings-and-loan associations to issue two newtypes of certificates:
o Six-month $10,000 certificates with maximum yields aboutequal to those available on 26-week Treasury bills,and
o Eight-year $1,000 savings certificates with yields of7-3/4 to 8 percent per annum.
The availability of these new certificates—especially the onelinked to rates paid on Treasury bills—caused savings flows
11

TABLE 3. THREE-MONTH ABSORPTION RATE FOR UNFURNISHED APARTMENTSAND RENTAL VA CANCY RATE
Calendar Year
1972
1973
1974
1975
1976
1977
1978
Number ofUnits
Absorbed
497,900
531,700
405,500
223,100
157,000
195,600
201,000 a/
3-MonthAbsorptionRate
(in percents)
67.5
69.3
68.3
71.0
81.3
80.0
80.5 aj
RentalVacancyRate
(in percents)
5.5
5.8
6.2
6.0
5.6
5.2
5.0 b_/
SOURCES: U.S. Department of Commerce, Census Bureau; U.S. Depart-ment of Housing and Urban Development.
a/ Based on first two quarters of 1978.b/ Based on first three quarters of 1978.
to recover and prevented the outflows of funds from savings-and-loan associations that would ordinarily have been caused by rapidlyincreasing interest rates.
Despite these new certificates, tighter credit conditions areexpected to reduce the numbers of housing starts in 1979, for twoprincipal reasons:
o At year-end, in nearly half the country (by population)there were usury ceilings of 10 percent or lower onmortgage interest rates; although many of these ceilingsare likely to be raised this year, they will stilldisrupt the flow of funds to mortgage finance early inthe year;
12

The higher costs of mortgages will limit the effectivedemand for housing. This will result from an increasingunwillingness as well as greater inability to pay excep-tionally high mortgage costs. According to the Michigansurvey, consumers still regard houses as a good buybecause of expected price rises; however, late in 1978,there was a sharp increase—from 10 to 20 percent—in theproportion of families who responded that now is a badtime to buy houses because of high interest rates.
Figure 5.Interest Rates and Savings Flows
10Yield on U.S. GovernmentSix-Month Bills (Auction Average)
(left scale)
Maximum Effective Interest Rateon Savings & Loan Association Deposits
(left scale)
v\~-.y \
Net Savings Inflow, InsuredSavings and Loan Associations(right scale)
10
sI•<"
II
1972 1973 1974 1975Calendar Years
1976 1977 1978-2
SOURCES: Federal Home Loan Bank Board, seasonally adjusted by CBO; Board of Governorsof the Federal Reserve System.
NOTE: Latest point shown for Net Savings Inflow is for October-November 1978.
13
38-418 O - 79 - 3

Business Fixed Investment
Business spending on plant and equipment was strong last year,rising more than 8 percent in real terms. Although this rate ofgrowth was only slightly lower than the 1977 rate, the compositionof expenditures changed significantly, as Table 4 demonstrates. In1977, the increase was concentrated in light equipment, particu-larly autos and trucks. In 1978, there was a sharp rise in spendingfor structures, which had been lagging since the 1974-1975 reces-sion.
TABLE 4. BUSINESS FIXED INVESTMENT AND CAPACITY UTILIZATION
1975:4 to 1976:4 to 1977:4 to1976:4 1977:4 1978:4
Percent Change in Constant Dollars
Nonresidential FixedInvestment, Total 8.6 9.1 8.3
Structures 3.0 7.0 12.6
Producers' DurableEquipment, Total 11.4 10.1 4.8
Autos, trucks and buses 21.5 27.0 8.7Other machinery andequipment 8.3 4.2 3.2
Output as a Percent of Capacity
Manufacturing CapacityUtilization
Calendar Year 80.2 82.4 84.2
December 81.2 83.0 85.9
SOURCES: U.S. Department of Commerce, Bureau of Economic Analysis;Board of Governors of the Federal Reserve System.
14

Clearly, the rise in capacity utilization has contributed torecent strength in structures, and continuation of the utilizationrate registered in December 1978 would encourage further rises inspending to expand capacity.
The outlook for business fixed investment, like that forconsumption and housing, is clouded by crosscurrents: the momen-tum of growth versus signs of weakening, which are ultimatelyassociated with the current rapid rate of inflation. The momentumfor continued expansion of spending on plant and equipment isevident in contracts and orders for plant and equipment, whichin October and November were running 9 percent above the thirdquarter in real terms. This series tends to lead actual spendingby one or two quarters.
Despite its current momentum, there are indications thatspending on plant and equipment may slow significantly. Manufac-turers' capital appropriations have been trending down sinceearly 1978. The fall McGraw-Hill survey suggested a spending riseof only 2 percent in real terms in 1979, and the Department ofCommerce (BEA) survey taken in late November and early Decemberindicates an increase in 1979 of 11.2 percent in dollar value—perhaps 3 percent in real terms. This is an important signal.Many forecasters have found that the Commerce survey of spendingintentions is the best available single predictor of actualspending behavior.
Two factors would help cause such a slowdown in business fixedinvestment:
o The higher cost of borrowed funds, at a time when businessliquidity has declined and the stock market is relativelylow; and
o The general expectation of a slowdown in overall economicactivity next year.
Higher interest rates may not greatly affect many largecapital spending projects, like those associated with the expectedmove to a new generation of aircraft or those necessitated bymandated efficiency standards for automobiles. Tightened creditconditions may, however, slow commercial construction and expendi-tures on more discretionary additions to equipment.
15

Widespread pessimism about future economic activity is indi-cated by the Conference Board survey of business confidence. Thecomposite measure of business executives' assessment of futureeconomic conditions fell from 49 in August to 40 in November 1978;for comparison, the measure was 75 when this survey was inauguratedin March 1976.
State and Local Government Spending
One measure of the impact of the state and local governmentsector on the overall economy is the size of its surplus or defi-cit. State and local receipts have exceeded spending by substan-tial amounts for the last six years, as shown in Figure 6. Alarge part of this surplus represents the excess of receipts overexpenditures needed to fund future pension requirements, whichis expected to continue. But in 1976-1978, the total of "operat-ing" state and local budgets (which exclude social insurancefunds) was also in surplus. The availability of existing surplusbalances should help many state and local governments comply withmeasures they enacted last year to limit taxes without an immediateproportionate limitation on spending.
Figure 6.
State and Local Government Receipts, Expenditures,and SurplusesBillions of Dollars, Seasonally Adjusted Annual Rates350
300
250HCbclUU _^-w^
Expenditures200
150
100
50
Total Surplus .̂ .'••.
i i i-50
""" — Operating Surplus
I I I I I I I I I I
1967 1968 1969 1970 1971 1972 1973 1974 1975 1976 1977 1978Calendar Years
SOURCE: U.S. Department of Commerce, Bureau of Economic Analysis.
16
As a result of the passage of Proposition 13 in California,the total operating surplus was reduced substantially, as Cali-fornia property tax liabilities were cut sharply while spendingcontinued little changed. This development in California and taxand spending measures passed by other state and local governmentssuggest a continued reduction in the operating surplus of thissector in the coming year.
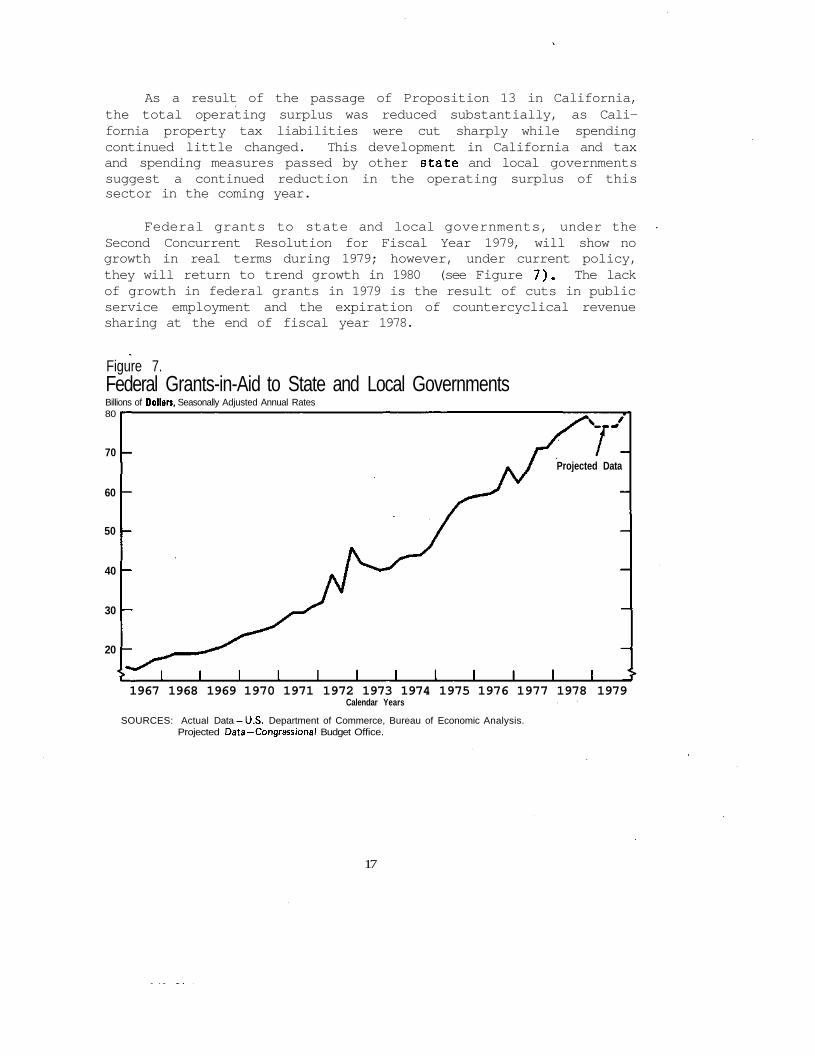
Federal grants to state and local governments, under theSecond Concurrent Resolution for Fiscal Year 1979, will show nogrowth in real terms during 1979; however, under current policy,they will return to trend growth in 1980 (see Figure 7). The lackof growth in federal grants in 1979 is the result of cuts in publicservice employment and the expiration of countercyclical revenuesharing at the end of fiscal year 1978.
Figure 7.Federal Grants-in-Aid to State and Local GovernmentsBillions of Dollars, Seasonally Adjusted Annual Rates80
70
60
50
40
30
20
Projected Data
1967 1968 1969 1970 1971 1972 1973 1974 1975 1976 1977 1978 1979Calendar Years
SOURCES: Actual Data —U.S. Department of Commerce, Bureau of Economic Analysis.Projected Data—Congressional Budget Office.
17

International Sector
The net export balance of the United States stopped deterior-ating in the second quarter of 1978. Current dollar goods-and-services imports averaged only about $8 billion (annual rate) morethan exports in the second through fourth quarters, far less thanthe $23.7 billion rate of net imports in the previous two quarters(see Figure 8).
Advance indicators of export demand for durable goodsstrengthened recently, and the gap between imports and exports ofgoods and services is expected to continue shrinking in 1979.Delayed effects of the 14 percent depreciation in the dollar'sweighted exchange rate since 1977, more than enough to offset therise in U.S. prices relative to foreign prices, are working toraise exports and slow future import growth and will result in netstimulus to total domestic demand. Faster economic growth in someU.S. major trading partners—which is forecast by many analysts—would reinforce this. The trade balance would improve even furtherif reduced U.S. growth also lowers import demand.
Figure 8.
Imports and Exports of Goods and Services, NIA BasisBillions of Dollars, Seasonally Adjusted Annual Rates240
200
160
120
80
40
Imports
I I I I I I I I I I I1967 1968 1969 1970 1971 1972 1973 1974 1975 1976 1977 1978
Calendar Years
SOURCE: U.S. Department of Commerce, Bureau of Economic Analysis.
18

The improvement in the trade balance resulting from the recentdepreciation of the dollar is probably just beginning to be signi-ficant. The amount of time between depreciation of a currency'sexchange value and improvement in that country's trade balance isoften estimated to be a year or more. This is because the initialimpact of depreciation is to increase import prices and worsen thetrade balance for a period before real import and export flowsreact to the changed competitive position. A gradual improvementin the balance of trade for manufactured goods and a decline in theU.S. trade deficit with Japan are seen as indicators that tradeflows are being influenced by the lower exchange value of thedollar. Imports are also being limited by various "orderlymarketing agreements" and the steel price-referencing system,which slow import growth without imposing formal quotas or tariffs.
OUPTUT AND INVENTORY INVESTMENT
The growth rate of aggregate output during 1978 was 4.3perce,nt, the same as the growth of final sales. Inventory-salesratio changed little over the year and are at relatively lowlevels. Thus, analysts generally have concluded that inventoriesare currently in good balance with sales and there is little dangerof large unintended accumulations of the kind that have aggravatedrecessions in the past.
This judgment needs some qualification. Inventory-salesratios seldom rise while final sales growth is strong, but aslowdown or decline in real final demand for goods is usuallyaccompanied by a rise in these ratios. Producers typically maintainoutput levels for a period following a decline in demand, whichleads to unintended inventory accumulation. Recent low ratios aretherefore no guarantee against future unintended accumulations.Furthermore, inventory-sales ratios are high for some categories ofconsumer spending, notably general merchandise and related retailstores. Although business inventory positions must be consideredvulnerable to a slowdown in sales, current indicators do not pointto anything like the over-ordering that led to a pronounced inven-tory cycle in 1973-1975.
TRENDS IN EMPLOYMENT, WAGES, AND PRICES
The increase in total output last year was accompanied bylarge increases in employment and capacity utilization. In addi-tion, both inflation and the growth of labor costs accelerated.
19

Employment
By the fourth quarter of 1978, total household employment wasestimated to be more than 3.5 percent (or some 3.3 million jobs)above its level a year earlier. Labor force growth was alsostrong at about 2.8 percent, but the more rapid employment growthreduced the employment rate from 6.6 percent in the fourth quarterof 1977 to 5.8 percent in the fourth quarter of 1978.
Black/white discrepancies in employment narrowed in 1978,though differences in unemployment rates did not. Black employ-ment rose 7 percent, well above the employment growth rate forwhites, but black labor force growth was also more rapid. Theratio of black to white unemployment rates was little changed, withthe black rate 2.3 times the white rate in the fourth quarter of1978. Black labor force participation rates remain well belowrates for whites, so there remains room for further relativeincreases in black employment and labor force participation.
Associated with the large increase in employment was a slow-down in the measured growth of labor productivity. For the nonfarmbusiness sector, output per hour was about unchanged in 1978,as compared with gains of 1.3 percent in 1977 and 2.8 percent in1976. The reasons for this slowdown are not clear; therefore, itis not known whether the recent slowdown is permanent or temporary.
Labor Costs
The growth in hourly labor compensation accelerated lastyear, rising by more than 9 percent in the private nonfarm businesssector, as compared with a 7.6 percent gain in 1977. Since pro-ductivity was virtually unchanged, unit labor costs also increasedat nearly a double-digit pace, placing sharp upward pressure onprices.
There are a number of reasons why labor compensation accele-rated in 1978:
o Large government-mandated increases occurred in theminimum wage and in payroll taxes. The statutory minimumwage increased from $2.30 to $2.65 per hour, up about 15percent. Payroll taxes for social security and unemploy-ment insurance funds were also increased. Taken together,the mandated increases added about 1 percentage point tothe increase in labor compensation;
20

o The acceleration in inflation has increased, and willcontinue to increase, labor compensation. This occursbecause the incomes received by many groups are linked,formally or informally, to the movement of consumerprices; and
o Although apparently not yet widespread, some labor short-ages have occurred in selected geographical areas—forexample, in parts of the sun belt—and in selected occupa-tions—such as some nonunionized building trades. Table 5shows that one measure of labor-market slack—the joblessrate for married men—has dropped below its 1972 levels andis nearing its rate in 1973, a year of general scarcity andexcess demand inflation.
TABLE 5. MEASURES OF LABOR MARKET SLACK
Unemployment Rates for Selected FourthGroups (as Percent of Civilian QuarterLabor Force) 1972 1973 1978
All Workers
Married Men, Wife Present
5.6
2.8
4.8
2.3
5.8
2.5
Professional and TechnicalWorkers 2.4 2.2 2.7
Craft and Kindred Workers 4.3 3.7 4.5
SOURCE: U.S. Department of Labor, Bureau of Labor Statistics.
These factors will continue to place upward pressure on laborcosts in 1979. A 9.4 percent increase in the minimum wage tookeffect on January 1; another round of social security tax increasesalso occurred. If past relationships hold, the major impact onwages of the recent acceleration of inflation will be felt in1979, especially since it is a heavy bargaining year. In addition,where labor shortages do exist, firms will be bidding up wages inorder to fill vacancies, at least until the anticipated rise injoblessness later in this year.
21

Prices
Consumer prices rose 9.0 percent in 1978, as compared with 6.8percent during 1977. In order to highlight the anatomy of inflationin 1978, recent rates of change in the CPI, some of its components,and other price measures are displayed in Table 6.
Food prices were a major contributor to inflation in 1978.Consumer food prices accelerated more in the first half of 1978than they had in the first half of 1977, and they failed to returnto the low rate of increase registered in the second half of1977.
Food prices are not the whole story, however. Measures ofinflation that exclude food and other volatile components also showacceleration. A "stripped" consumer price index (which excludesfood, energy, used cars, and mortgage interest rates) increased by7.0 percent during 1978—up from the 6.4 percent rate in 1977.Producer prices for crude and intermediate nonfarm products alsoappear to be accelerating, as do producer prices for consumer goodsother than food. The overall price acceleration last year maymainly reflect the rise in unit labor costs.
The downtrend in the foreign currency price of the dollar,which began late in 1977 and accelerated from May through earlyNovember of 1978, was another potential contributor to inflation.In the most recent period, the value of the dollar relative tothe currencies of major trading partners was 14 percent below its1977 average. Yet the GNP price index for imports increased onlyslightly more during 1978 than it had in 1977. In part, thisis because the OPEC price freeze offset price rises for otherimports; in part, it may be because foreign sellers are acceptingreduced profit margins in order to maintain their market shares.
In addition to pushing up the prices of imports, dollardepreciation can contribute to inflation in other ways. It canpermit the widening of profit margins for domestically producedgoods that compete with imports. Dollar depreciation can alsoincrease aggregate demand, by raising the demand for exports inreal terms as well as by decreasing the price advantage of imports.In fact, as discussed earlier in this chapter, the U.S. export-import balance has indeed improved recently in real terms, becauseof an improving balance for manufactured goods as well as largefarm-product exports.
22

TABLE 6. RATES OF CHANGE IN PRICES: PERCENT CHANGES, ANNUALRATE
1977
Selected PriceMeasures
GNP Fixed-WeightedIndex, Total
ExportsImports
Consumer Price Index,
Total
Food and BeveragesEnergy a/
FirstHalf
7.2
6.910.6
8.9
12.511.4
SecondHalf
5.7
-0.34.4
4.7
3.13.1
1978
FirstHalf
8.9
10.47.5
10.4
17.89.1
SecondHalf
8.1
9.78.6
7.8
5.47.0
"Stripped" (excludingfood, energy, usedcars, and mortgageinterest payments)
Producer Price Indexes
6.7 6.1 6.9 7.1
Farm ProductsCrude Nonfarm ProductsIntermediate NonfarmProductsFinished Goods, TotalConsumer foodsAll other consumerCapital equipment
0.11.
7.8.10.8.5.
45
22949
-3.11.
5.5.2.4.8.
79
60434
33.13.
7.10.17.8.7.
79
95929
4.15.
8.7.6.8.8.
78
56141
SOURCES: U.S. Department of Commerce, Bureau of Economic Analysis;U.S. Department of Labor, Bureau of Labor Statistics.
NOTE: Changes are calculated from the month or quarter at the endof the preceding time period to the month or quarter at theend of the reference period.
a/ Not seasonally adjusted.
23

The rise in manufacturing capacity utilization has also beendramatic enough to raise concern about the amount of room forfurther expansion without accelerating inflation. According toFederal Reserve Board estimates, manufacturing utilization inDecember 1978 was only 2.4 percent below its 1973 high. In 1973,however, the principal capacity problem was bottlenecks in mate-rials-producing industries, which helped drive up prices. At 88percent, the December 1978 capacity utilization at materialsindustries was still 6 percentage points below the very high 1973level. In addition, reports of materials delivery delays increasedin 1978, though they remained still well below the extreme shortagerates of 1973.
In sum, the upward pressures on prices are strong. Laborattempts to restore traditional real wage growth, if not matched byfaster productivity growth, will increase unit costs. When beefproducers start to rebuild herds, beef prices will rise further.The OPEC price increase for crude oil is larger than was expectedand will add to inflation. Another social security tax increasewent into effect January 1, as did a 9.4 percent rise in theminimum wage—not as large as the 1978 increase, but in excessof the recent growth in wage rates. A significant portion of theeffects of dollar depreciation has yet to be felt. And the effectsof tightening in labor and capital utilization during 1978 and thebeginning of this year may place additional upward pressure onwages and prices. These upward pressures, of course, might beoffset by unforeseen supply increases (an exceptionally goodharvest, for example) or an effective wage/price guideline program.
24

CHAPTER III. POLICY DEVELOPMENTS AND THE ECONOMIC OUTLOOK
RECENT POLICY DEVELOPMENTS
Economic growth was strong at the end of 1978; neverthe-less, most economic forecasts show a downturn in activity in 1979.The critical element in these forecasts is the outlook for infla-tion and the assumed response of economic policies. Although someshift away from expansive economic policies was evident earlier,policy announcements made by the Administration and the FederalReserve in late October and early November, as well as subsequentpolicy actions, have been widely interpreted as indicating that theprimary policy goal for the next few years will be to reduceinflation and prevent further depreciation of the dollar. Thequestion of whether this restrictive policy shift will trigger are'cession remains clouded by:
o Uncertainty in the outlook for inflation, including theeffects of the Administration's wage/price standards;
o Uncertainty as to whether planned policies will actuallybe implemented, particularly if the economy shows signs ofweakening; and
o Recognition that the economic consequences of any particu-lar economic policy path cannot be forecast with precision.
If current fiscal policies are continued, the shift towardrestraint will not have a major effect on economic activity untilfiscal year 1980. But the anti-inflationary monetary policies areexpected to have important consequences for real activity beforethe end of 1979. If the wage/price guidelines fail to reduce therate of inflation significantly, restrictive macroeconomic policiesare more likely to produce a recession. But if the guidelinessucceed in reducing inflation, or if inflation should slow for someother unforeseen reason, credit conditions may ease enough to avoida downturn in activity.
25

IMPACT OF FISCAL POLICY
CBO projects that, under current policy, the federal deficitwill decline slightly to about: $40 billion in fiscal year 1979 andrise to nearly $50 billion in fiscal year 1980. The deficit couldbe much larger, if the economy turns out to be substantially weakerthan forecast by CBO, or it could be much smaller, if CBO hasunderestimated inflation or economic growth. A rule of thumb isthat a 1 percentage point rise in unemployment increases thedeficit by roughly $20 billion, while a 1 percentage point increasein inflation reduces the deficit by roughly $3 billion.
CBO's estimate of the current policy deficit in fiscal year1980 is about $49 billion, $20 billion above the deficit projectedin the President's budget. Nearly half of the difference betweenthe Administration and CBO budget estimates reflect CBO's morepessimistic assumptions about inflation and unemployment as well asdifferent estimating methodology; the remaining discrepancy re-flects different policy assumptions, primarily concerning proposedcuts in spending below current policy and real wage insurance.The differences in overall budget figures are mainly on the spend-ing side, where the Administration has proposed cutting spendingbelow current policy by about $11.5 billion. Differences inthe Administration's estimating procedures and their more opti-mistic economic forecast reduce the Administration estimates ofoutlays by about $8.5 billion relative to CBO's current policyestimate. _!_/
The rise in the 1980 current policy deficit projected byCBO reflects its projected downturn in economic activity. Thispoints out one of the shortcomings of the budget deficit as ameasure of fiscal policy: the deficit reflects both the impact ofthe budget on the economy and the impact of the economy on thebudget. The deficit is neither an easily controlled magnitude nora good measure of fiscal policy. Thus, in order to assess theeconomic significance of budget deficits, it is useful to isolatethe force of (discretionary) budgetary policy changes scheduled totake effect in the forecast period.
_!/ Administration and CBO revenue estimates are quite similarbecause the effect of the weaker economy in the CBO forecast islargely offset by higher inflation. The Administration'sbudget was not available in time to be analyzed in detail inthis report.
26
Under current policy assumptions, the growth in federal budgetoutlays will slow markedly in fiscal year 1979, with a substantialrecovery in 1980 (see Table 7). A major part of the weakness inunified budget spending growth in 1979, however, reflects year-to-year variations in loan activity, a component of budget outlaysthat is thought to have a relatively small impact on the economy.When these loan transactions are removed, spending growth, on acurrent policy basis, is somewhat stronger in 1979 and in 1980.2j The strength in federal spending in 1980, however, results inpart from the rise in unemployment projected in the CBO forecast.Thus, with current policies, discretionary changes in spending willnot add significantly to economic growth in 1980. At the sametime, it also appears that projected federal spending under currentpolicies will not be significantly restrictive.
In terms of short-run economic impact, the most significanttax policy changes included in the current policy budget in fiscalyears 1979 and 1980 are:
o Increases in social security tax rates, in January 1979,and in the tax base, in both 1979 and 1980;
o Income tax reductions made by the Revenue Act of 1978,effective January 1979.
The revenue effects of the personal income tax cuts in 1979 areexpected to exceed the 1979 and 1980 social security tax increaseby about $5 billion each fiscal year. But, in an inflationaryeconomy, the expansive thrust of tax rate cuts can be offset overtime by the automatic tax rate increases that arise from inflatedincomes and the progressive tax system.
This point is demonstrated by the full-employment surplus, anestimate of what the federal budget position would be if theeconomy were operating at full potential ̂ /; it reflects the
2J The growth in federal spending accelerates in 1979 and 1980 on~~ a national income accounts basis (NIA), a budget concept which
excludes asset transactions.
3/ Potential GNP assumes approximately 4.9 percent unemployment.
27

TABLE 7. FEDERAL BUDGET UNDER CURRENT POLICY, FISCAL YEARS1977-1980: IN BILLIONS OF DOLLARS
1977 1978 1979 1980
Unified Budget
Receipts
Outlays(Percent change)
356.9
401.9(7.7) b/
402.0
450.8(12.2)
453.3 £/
493.8 a/(9.5)
•-;• „ ,y .
502 a./
551 a/(11.6)
Deficit 45.0 48.8 40.5 49
Measures of Economic Impact
Federal Spending, NIABasis (percent change) 8.4 b/ 8.9 10.9 11.1
Full-Employment Surplusor Deficit, NIA Basis -10.3 -11.2 1.5 18.9
SOURCES: U.S. Treasury; Congressional Budget Office; Office ofManagement and Budget.
a/ Current policy budget (based on second budget resolution for1979).
b/ Adjusted for transition quarter between fiscal years 1976 and1977.
effect of discretionary spending and tax policy changes as well asthe inflation-tax interaction. As may be seen in Table 7, thefull-employment budget position would shift toward restraint infiscal year 1979 and would become even more restrictive in 1980, ifcurrent policy were maintained.
This shift is one basis for the view that fiscal policy mayhave a restraining influence on the economy during the forecastperiod, even without the cuts in spending that the Administrationhas proposed.
28

Fiscal Uncertainties. These budgetary projections—andparticularly, the measures of fiscal stimulus—must be regarded asextremely tentative. The Congress may change current policies, andbudgetary projections are significantly affected by their economicassumptions. Higher inflation and higher economic growth wouldboth tend to lower the budget deficit. In addition, aggregatemeasures of fiscal policy do not reflect changes in the compositionof the budget, which can have important implications for judgingthe economic impact of budget changes.
Conclusion. On balance, taking into account some of the manydifficulties inherent in an attempt to translate federal budgetarydata into an estimate of fiscal impact, CBO's judgment is that, ifcurrent policies are continued, the federal government's projectedtaxing and spending activities would exert a moderate but increas-ingly restrictive influence on the pace of economic activity in thenext two years. If the cuts in outlays proposed by the Administra-tion were enacted, the budget would be more restrictive in fiscalyear 1980.
THE ADMINISTRATION'S $30 BILLION DEFICIT GOAL
The Administration has proposed a budget deficit f of $29billion for fiscal year 1980. The. CBO current policy deficit,shown in Table 7, is $20 billion above that target. Given CBO'seconomic and budget estimates, achieving the Administration's goalwould require reducing outlay growth substantially below the levelneeded to maintain current programs with full adjustment forinflation. Such a shift would represent a very restrictive policy.
Should economic growth or inflation during the next twoyears significantly exceed CBO's estimates, the spending cutsneeded to achieve the Administration's deficit goal would, however,be smaller.
MONETARY POLICY
During the two-year period ending in December 1978, thefederal funds rate, which is under the direct control of theFederal Reserve, increased from a cyclical low of about 4.6 percent
29
38-418 O - 79 - 4

Figure 9.Federal Funds Rate and Three-Month Treasury Bill RatePercent
1965 1966 1967 1968 1969 1970 1971 1972 1973 1974 1975 1976 1977 1978, Calendar Years
SOURCE: Board of Governors of the Federal Reserve System.
NOTES: P = business cycle peak 1 As designated by the NationalT = business cycle trough J Bureau of Economic Research.
Shaded area indicates January to May 1967 "Mini-Recession."
percent to about 10.0 percent at the end of December (see Fig-ure 9). kj Because of the fast growth in incomes, boosted by rapidinflation, the continued ratcheting up of the funds rate wasnot sufficient to slow the growing demand for money balances.There appeared to be little slowing in the growth of Ml, at leastthrough the third quarter of 1978 (see Table 8), and Ml growthexceeded the upper end of the Federal Reserve target range for mostof that period.
kj The federal funds rate is the interest rate charged on veryshort-term (immediately available) interbank loans. It is theshort-term operating target used by the Federal Reserve toachieve its monetary policy objectives.
30
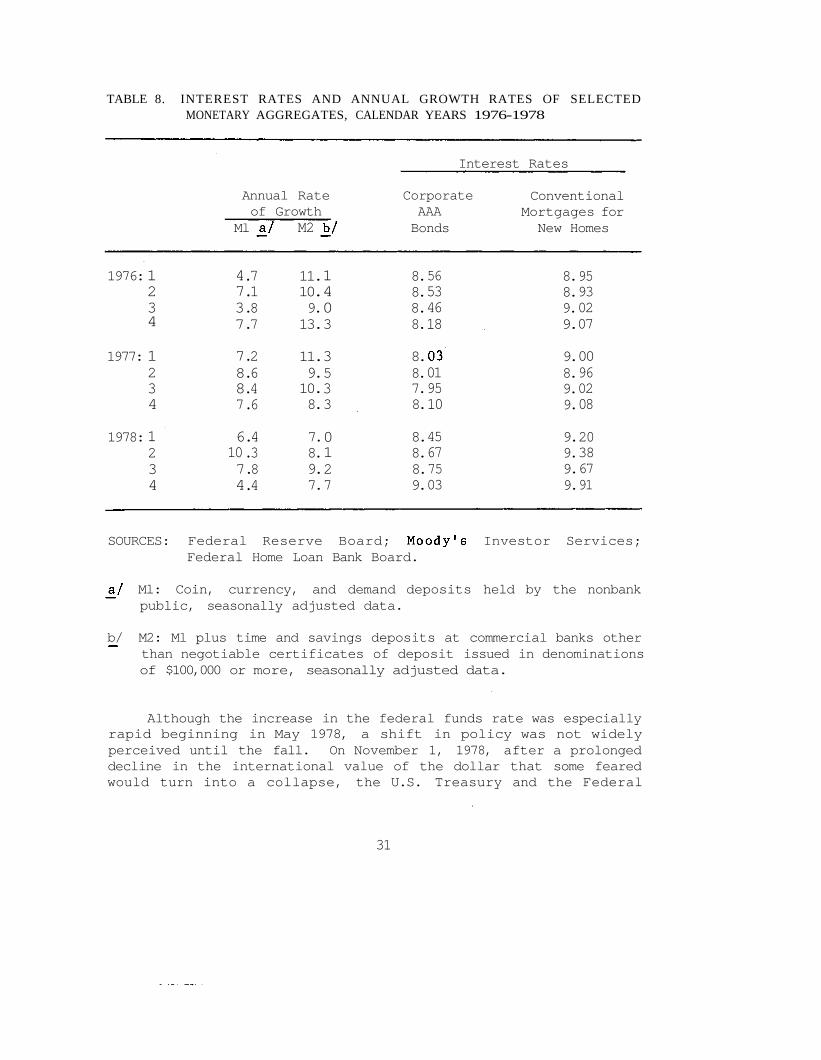
TABLE 8. INTEREST RATES AND ANNUAL GROWTH RATES OF SELECTEDMONETARY AGGREGATES, CALENDAR YEARS 1976-1978
Interest Rates
Annual Rateof Growth
Ml a/
1976:
1977:
1978:
1234
1234
1234
4737
7887
61074
.7
.1
.8
.7
.2
.6
.4
.6
.4
.3
.8
.4
M2
11.10.9.13.
11.9.10.8.
7.8.9.7.
b/
1403
3533
0127
CorporateAAABonds
8.8.8.8.
8.8.7.8.
8.8.8.9.
56534618
03019510
45677503
ConventionalMortgages forNew Homes
8.8.9.9.
9.8.9.9.
9.9.9.9.
95930207
00960208
20386791
SOURCES: Federal Reserve Board; Moody's Investor Services;Federal Home Loan Bank Board.
a/ Ml: Coin, currency, and demand deposits held by the nonbankpublic, seasonally adjusted data.
b/ M2: Ml plus time and savings deposits at commercial banks other~ than negotiable certificates of deposit issued in denominations
of $100,000 or more, seasonally adjusted data.
Although the increase in the federal funds rate was especiallyrapid beginning in May 1978, a shift in policy was not widelyperceived until the fall. On November 1, 1978, after a prolongeddecline in the international value of the dollar that some fearedwould turn into a collapse, the U.S. Treasury and the Federal
31

Reserve jointly announced a more restrictive monetary policy, aswell as other measures to support the dollar:
o Federal Reserve banks raised the interest rate at whichthey lend to member commercial banks from 8.5 percent to9.5 percent, an unusually large increase. The federalfunds rate quickly rose thereafter, from about 9.25 percentto 9.75 percent;
o Reserve requirements on large denomination time depositswere raised 2 percent, or about $3 billion, given theoutstanding volume of such deposits; and
o The Treasury announced a number of steps to increase U.S.holdings of foreign currencies, to be used to defendthe foreign exchange value of the dollar.
These measures were widely interpreted as signaling a determinationon the part of the Administration and the Federal Reserve tosupport the dollar and persist in an anti-inflationary monetarypolicy.
The intent of the more restrictive monetary policy is toreduce the growth of credit, thereby slowing sales and employmentgrowth and reducing inflationary pressures; it seeks to reduceinflationary momentum without: creating too much slack. Policy-makers have found, however, that aggregate demand cannot easily berestrained precisely enough to slow inflation without at the sametime creating a recession and rising unemployment. Following theNovember 1 announcement, many forecasters concluded that a mildrecession with little impact on inflation was the most likelyoutcome.
Nevertheless, it was not evident by the end of that year that1978's high and rising short- and long-term interest rates and theslowdown in money growth had significantly affected real activity.Three factors appear to account for their ineffectiveness:
o When inflation rates are high, high interest rates costless in real terms;
o Mortgage funds remained unusually plentiful at savingsinstitutions because of the new six-month money marketsavings certificates introduced in the spring of 1978;and
32

o The rapid rise in interest rates during the second half of1978 had not been in effect long enough to have had wide-spread effects on demand.
Although rising mortgage rates have undoubtedly had some effect onhousing starts, the introduction of the new savings certificateswas particularly significant in maintaining residential construc-tion at high levels. Without this instrument, an increase inTreasury bill rates well above the savings and loan passbooksavings rate would be expected to trigger an outflow of funds fromsavings deposits to higher-yielding market instruments. In thepast, such deposit outflows have greatly reduced the availabilityof mortgages and housing construction. Because of this new instru-ment, many analysts now believe that the impact of rising interestrates on the economy is likely to be more diffuse and more delayedthan in the past. The new savings instrument therefore introducesmore uncertainty with regard to the timing and size of monetarypolicy impact.
In the last two months of 1978, there was a significantslowdown in the growth of demand deposits. Unfortunately, becauseof recent institutional changes, it is impossible to determinewhether the increase in short-term rates accounted for this slow-down. 5/ The growth of the broader money aggregate, M2 (currency,checking accounts, and commercial bank savings deposits other thanlarge certificates of deposit), slowed somewhat in the yearbefore the November 1978 announcement; since that time, there hasbeen a substantial further reduction in growth, though a trend hasnot clearly been established.
The Near-Term Outlook for Monetary Policy
Assumptions about the future course of monetary policy areimportant for any forecast of economic activity. Many economistsbelieve that continued growth in M2 at the reduced pace of recentmonths (about 3 percent at annual rates) will ensure an economicdownturn. Yet the degree of uncertainty about monetary policy andits impact on the economy is very great. To a large extent, theeffect of monetary policy will depend on how long high interest
_5/ In November 1978, the Federal Reserve permitted automatictransfer of funds from savings deposits to checking accounts.
33

rates persist, how much further (if any) rates move up, and howmuch lagged effect on economic activity will occur because of theprevious increase in rates.
There is a considerable delay in the impact of monetary policychanges on economic activity. If, as many believe, monetary policywill gradually tighten until there is a clear signal that economicactivity is weakening—such as a rise in unemployment rates—arecession may be unavoidable because it will be too late to offsetlagged effects. Even if policymakers follow such a path, however,the timing of such a downturn could not be known in advance. If,on the other hand, inflation and money demand should slow signifi-cantly in the months ahead, credit conditions could ease beforesevere effects on real activity occur.
Unless inflation begins to subside, it may be very difficultfor the Federal Reserve to reverse its present more restrictivepolicy. The behavior of the dollar in foreign exchange marketsgreatly complicates the current outlook. Market participantsappear to believe that an easing of policy by the Federal Reservewould increase pressures for further depreciation of the dollar, adevelopment the Administration and the Federal Reserve clearly wantto avoid. (The monetary policy assumptions in CBO's current policyforecast are described in the section on the CBO forecast.)
WAGE/PRICE STANDARDS
The task of estimating the effects of current macroeconomicpolicy is further complicated by the uncertainty created by thePresident's new wage/price standards. This program is designed toreduce the rate of inflation to between 6 and 7 percent in 1979.But the outcome of this program is very uncertain. One source ofuncertainty stems from the fact that real wage insurance, animportant component of the program, requires Congressional action,which may not be forthcoming. There is also considerable uncertain-ty regarding the degree of compliance by those covered by theprogram as well as the size of wage and price increases by thosewho are exempt. A large portion of the labor force is explicitlyor tacitly exempt from the wage standard, and about 60 percent ofthe goods and services that comprise the Consumer Price Index arealso formally or tacitly exempt from the price standard. Fullcompliance by nonexempt groups may be difficult to obtain. Laborunions in particular may find it difficult to comply, because
34

it would require giving up accustomed gains in real income. (SeeAppendix A for a discussion of the Administration's wage/priceguidelines program.)
THE CBO FORECAST
Policy Assumptions. Any forecast of economic activity dependscritically on its policy assumptions. The CBO forecast of theeconomy through 1980 is based on the following current policybudget assumptions:
o Federal outlays (unified budget) of $494 billion in fiscalyear 1979 and $551 billion in fiscal year 1980; and
o Current tax laws, including reductions in personal andcorporate taxes in January 1979 and scheduled increases insocial security taxes in both 1979 and 1980.
Thus, the CBO forecast assumes neither the cut in spending belowcurrent policy levels proposed in the Administration's budget forfiscal year 1980, nor the real wage insurance proposed by theAdministration as part of its new wage/price program.
With regard to monetary policy, CBO's forecast assumes thatM2 will increase to near the upper end of the Federal Reservetarget range during the first half of 1979. With demands expectedto remain strong, short-term interest rates are projected tocontinue to rise in the first and second quarters of 1979, reachinga peak when real activity begins to weaken in the second half ofthe year.
The Forecast. The forecast of the economy through 1980, basedon the key assumptions outlined above, as well as the recent econo-mic developments discussed in Chapter II, ±s summarized in Table9. Growth in real gross national product is expected to slowsignificantly in 1979, to the 0 to 2.0 percent range on a fourth-quarter-to-fourth-quarter basis, and then to rise at a 3.0 to5.0 percent pace in 1980. The unemployment rate is expected torise to a 6.2 to 7.2 percent range by the fourth quarter of 1979,with little change by the fourth quarter of 1980. Throughoutthe period, the rate of inflation, as measured by the consumerprice index, is projected to remain high. The increase in thisindex is projected to range between 7.0 and 9.0 percent in 1979 andfrom 6.5 to 8.5 percent in 1980.
35

TABLE 9. ECONOMIC PROJECTIONS BASED ON CURRENT POLICY, CALENDAR YEARS 1979 AND 1980
Economic Variable 1978:4(actual)
Levels
1979:4 1980:4
Rates of Change (Percent)
1977:4to 1978:4(actual)
1978:4to 1979:4
1979:4to 1980:4
GNP (billions ofcurrent dollars) 2211
Real GNP (billions of1972 dollars) 1412
General Price Index(GNP deflator,1972=100)
Consumer Price Index(1967=100)
Unemployment Rate(percent)
157
202
5.8
2365 to 2457 2595 to 2800
1412 to 1440 1455 to 1512
168 to 171 178 to 185
216 to 220 230 to 239
6.2 to 7.2 6.2 to 7.2
12.9 7.0 to 11.1 9.7 to 13.9
4.3 0.0 to 2.0 3.0 to 5.0
8.3 7.0 to 9.0 6.5 to 8.5
8.9 7.0 to 9.0 6.5 to 8.5

The Persistence of Inflation. The continuing of highrates of inflation in the forecast is predicated on business andlabor both striving to maintain their accustomed growth in realincome. _5/ Higher Vages reflecting inflation "catch up" will thenfeed into higher prices, as firms seek to pass on their increasedcosts. Increases in social security taxes and in the minimum wagewill also provide upward pressure on compensation and prices.Adding more upward thrust to the projected advance of prices in1979 and 1980 are assumed 10 percent increases in farm prices andproducer fuel prices in both years. No significant further devalu-ation in the dollar is assumed, although import prices may continueto rise during the forecast period as a result of the lagged effectof earlier dollar depreciation.
The Downturn. The projected low growth in real GNP betweenthe fourth quarter of 1978 and the fourth quarter of 1979 reflectsexpected weakness in three sectors of the economy:
- o Residential construction is projected to turn down in1979. Although housing starts have not yet declined signi-ficantly, the supply of mortgage funds is already being cutback in the 18 states where market-determined levels ofmortgage rates are above usury ceilings. The demand forhousing is also expected to taper off as the combinedimpact of high housing prices and interest rates removesmany would-be home buyers from the market;
o Business fixed investment is expected to be weak in 1979.The recent surveys of business spending intentions des-cribed in Chapter II point to relatively weak growth.Because utilization rates fall off as the economy weakens,this sector is also not anticipated to be a source ofstrength in 1980;
5/ In an earlier report, CBO analyzed the persistence of inflationand its recent acceleration. See Congressional Budget Office,Inflation and Growth; The Economic Policy Dilemma (July 1978),Chapter III.
37
38-418 O - 79 - 5

o Finally, consumer spending is expected to weaken in 1979.Consumer sentiment has been declining. With a rising debtburden and a below-average saving rate, consumers areprojected to cut back on consumption, particularly forautos and other durable goods in the months to come.Inventories should begin to pile up around midyear, andthis will quickly be followed by reductions in orders byfirms.
According to the CBO forecast, economic growth will not weakenimmediately. But the forecast does include a modest decline inreal GNP during the second half of 1979, resulting mainly frompersistent inflation and tightening credit conditions. The downturnis not expected to be deep or prolonged because:
o Businesses appear to have maintained relatively leaninventories; thus, any inventory adjustment should bemild;
o Net exports are projected to be a source of considerablestrength as a result of an expected improvement in theeconomic growth of U.S. trading partners and because ofthe depreciation of the dollar last year;
o The cut in personal income taxes provides stimulus earlyin 1979 and overall federal fiscal policy does not appearto be a significant drag on the economy until 1980;
o There are large order backlogs at capital goods indus-tries, which will provide support to total spendingduring the slowdown.
The Recovery. The recovery in the 1980 CBO forecast is lessrobust than the typical postwar upswing because the downturn is notdeep and inflation is projected to remain high. As a result,monetary policy will not respond as much as usual to the elevatedunemployment rates, and short-term interest rates will rise fromalready high levels during the recovery. Furthermore, federalfiscal policy (even with current policy) will exert a drag oneconomic activity in fiscal year 1980, as the interaction ofinflation and the progressive tax structure causes personal incometax rates to rise.
38

Uncertainties in the Forecast. Several major uncertaintiesare associated with this forecast:
o As explained in the introduction to this chapter, themajor uncertainty in the forecast is the behavior ofprices and the monetary policy response to continuedinflation. The degree of compliance with the Administra-tion's proposed wage/price standards cannot be known withcertainty. If inflation abated unexpectedly, for example,credit conditions might ease somewhat, and the real economywould respond favorably;
o There is no assurance that the dollar has stabilized inworld markets. If it should begin to slide once again,significant further tightening by the Federal ReserveBoard is quite possible. Reduced money growth and higherinterest rates could lead to a recession of much greaterproportions than the minor slowdown envisioned in theforecast described above; and
o Prolonged strikes are possible as a result of attempts bybusiness firms to abide by the Administration's wagestandards. A major strike could affect the timing anddepth of a economic downturn.
39


CHAPTER IV. SHORT-TERM FISCAL POLICY
This chapter focuses on the role of fiscal policy in combatinginflation. In recent months, monetary policy has become increas-ingly tight. With current policies, the fiscal year 1980 budgetwould also be a restraining force on the economy. The Administra-tion proposes adding to budgetary restraint by reducing expendi-tures below current policy. The Congress will have the opportunityto weigh the benefits and costs of such an anti-inflationary policyshift.
In addition to determining the role of fiscal policy incontrolling inflation, policymakers must also decide about theappropriate size of the government sector. Those who favorspending cuts generally do so as much out of a belief that thegovernment is too costly to taxpayers, does too much, and issometimes wasteful, as out of a belief that fiscal policy requiresa smaller deficit. These two issues can be considered separa-tely, however, because fiscal policy can involve about the samedegree of restraint with substantial differences in the size of thefederal sector.
In formulating fiscal policy in the current situation, itseems particularly important to maintain flexibility, because theoutlook is so uncertain—especially regarding the severity ofthe expected slowdown in 1979, and the effectiveness of the Admi-nistration's wage/price standards in slowing inflation.
Due to uncertainty in economic conditions, policymakerscannot control the level of the deficit in the short run with anydegree of precision. Moreover, it may not be desirable to try toprevent automatic shifts in the deficit, because such shiftsin the budget tend to cushion the economy in a period of severerecession or excess demand.
Policy changes adopted for short-run economic objectives tendto have implications for longer-run objectives as well. Decisionsconcerning the mix of fiscal policies are thus important, sincesome fiscal instruments are more effective in attaining specificlong-run goals than others. For example, tax incentives to investmight contribute to longer-term growth; lowering payroll taxes
41

could stimulate the economy while reducing inflationary pressures.Similarly, employment policies and programs might be used asa means of implementing the recently enacted Full Employment andBalanced Growth Act.
FISCAL POLICY ALTERNATIVES FOR 1980
Anti-Inflation Fiscal Strategies
As indicated in Chapter III, the federal budget in 1980,under current policy assumptions, will be moderately restrictive.The Administration has emphasized that its proposal for tighteningfiscal policy is an important component of its overall anti-in-flation strategy. To this end, the President has proposed cuttingfederal spending for fiscal year 1980 below current policy levels.Stringent fiscal and monetary policies might also improve thechances of success for the wage and price standards: with lowerdemand pressures, businesses and unions would be more apt to goalong with the wage/price standards.
The effects on the economy of cutting federal outlays dependin part on the composition of the reductions. In general, areduction in transfers is thought to have a smaller impact on realGNP and prices than a similar size cut in government spending forgoods and services. Reductions in spending for public serviceemployment are thought to have a comparatively large impact inraising unemployment. JV
For illustrative purposes, CBO compared the economic effectsof two kinds of reductions in federal outlays for fiscal year 1980with the effects of current policy: a $15 billion cut involvingacross-the-board reductions in all of the major categories of thebudget, and a $25 billion reduction cutting much deeper into someprograms. The $15 billion option appears to be a bigger discre-tionary spending cut from current policy than the Administra-tion proposed. The larger $25 billion reduction assumes, forexample, that the countercyclical public service employmentprogram is almost completely eliminated. In each case, the re-ductions are assumed to involve a step change effective October 1,1979.
For a more detailed discussion, see Congressional BudgetOffice, Understanding Fiscal Policy (April 1978) .
42
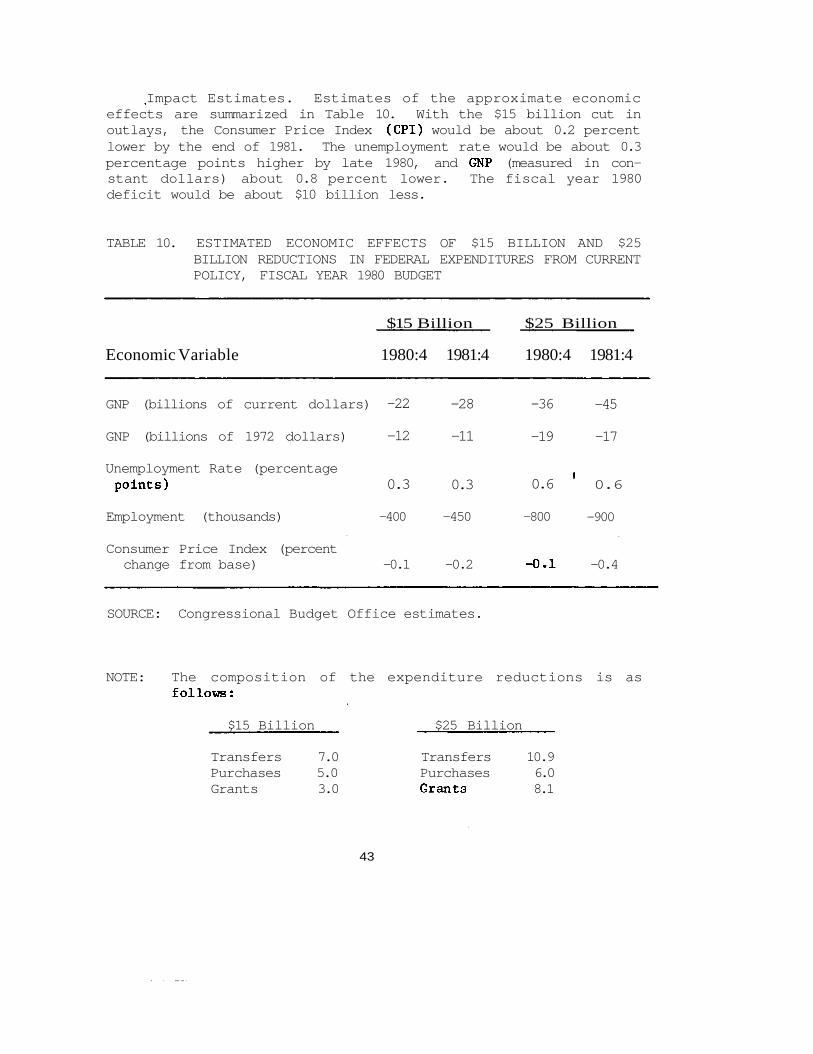
Impact Estimates. Estimates of the approximate economiceffects are summarized in Table 10. With the $15 billion cut inoutlays, the Consumer Price Index (CPI) would be about 0.2 percentlower by the end of 1981. The unemployment rate would be about 0.3percentage points higher by late 1980, and GNP (measured in con-stant dollars) about 0.8 percent lower. The fiscal year 1980deficit would be about $10 billion less.
TABLE 10. ESTIMATED ECONOMIC EFFECTS OF $15 BILLION AND $25BILLION REDUCTIONS IN FEDERAL EXPENDITURES FROM CURRENTPOLICY, FISCAL YEAR 1980 BUDGET
$15 Billion $25 Billion
Economic Variable 1980:4 1981:4 1980:4 1981:4
GNP (billions of current dollars)
GNP (billions of 1972 dollars)
Unemployment Rate (percentagepoints)
Employment (thousands)
-22
-12
0.3
-400
-28
-11
0.3
-450
-36
-19
0.6
-800
-45
-17
' 0.6
-900
Consumer Price Index (percentchange from base) -0.1 -0.2 -0.1 -0.4
SOURCE: Congressional Budget Office estimates.
NOTE: The composition of the expenditure reductions is asfollows:
$15 Billion $25 Billion
Transfers 7.0 Transfers 10.9Purchases 5.0 Purchases 6.0Grants 3.0 Grants 8.1
43

The $25 billion reduction would produce substantially largereffects, especially in unemployment, due to the assumed sharpreduction in the countercyclical public service employment pro-gram. By late 1980, the unemployment rate would be 0.6 percentagepoint higher. By late the following year, the CPI would be anestimated 0.4 percent lower. The fiscal year 1980 deficit would beabout $16 billion less.
Estimates of the effects of changes in fiscal policy, likethose presented in Table 10, are subject to a great deal of uncer-tainty. Economics and economic models have not progressed to thepoint at which very accurate estimates are possible. In addition,the estimated impact of the cuts in outlays would be affected byalternative assumptions about monetary policy.
Achieving Spending Cuts. Several factors would make itdifficult to cut outlays by as much as $15 billion to $25 billion
• in fiscal year 1980. A significant proportion of federal outlays(about 57 percent) is for interest and entitlement programs—suchas social security, unemployment insurance payments, and agri-cultural price supports. To some extent, these programs are viewedas relatively fixed commitments. A reduction in outlays in theseareas would require specific legislation to change existinglegal commitments; one possible way of reducing spending on en-titlements (which would also require legislation) might be to capautomatic increases resulting from inflation. In the area ofpurchases, lead times are sometimes quite long, with a substantialpart of outlays in any one year resulting from budget authority inprior years. This makes it difficult to cut outlays quickly. Evenin the case of relatively "discretionary" areas of the budget,policymakers might wish to phase in budget cuts gradually, to allowtime for adjustment by individuals and state and local governments.
The Size of the Federal Sector
The size of the federal sector could be determined inde-pendently of decisions concerning the appropriate posture forfiscal policy. A smaller government and a reduced role for govern-ment could be achieved with minimum cost and disruption if under-taken systematically over a period of several years. The aggregate
44

effects on the economy of lower federal spending could be approxi-mately offset by carefully structuring reductions in taxes. 2^1
In the short run, however, to the extent that the reductionsin outlays involved cuts in structural employment programs, thisstrategy could result in somewhat higher unemployment—therebymoving further away from the employment objectives of the FullEmployment and Balanced Growth Act. Nevertheless, the objective ofreducing the size of government could be achieved without signifi-cantly affecting overall economic growth.
The $25 billion cut in federal spending, without any offset-ting tax cuts, would reduce federal spending to about 21.3 percentof GNP, as compared with 21.9 percent under current policies. Twofactors keep this reduction from being larger: first, the cutin spending also lowers GNP, which is the denominator, and, second,the resulting increase in unemployment causes some offsettingincreases in expenditures, particularly for unemployment in-surance. Policymakers may want to consider reducing the relativesize of the federal sector while offsetting some or all of therestraining effect of the cut in outlays itself.
Payroll Tax Cuts. If the objective of policy were to reducethe size of the federal sector and to reduce inflation, one possi-ble strategy would be to combine a cut in payroll taxes witha cut in federal outlays. Like other tax reductions, a payroll taxcut would offset some of the effect of reducing outlays on realactivity. But unlike most other tax cuts, which increase prices,payroll tax cuts would be expected to have a beneficial effect oninflation, at least in the short run. The two major federalpayroll taxes—the social security tax and the federal portion ofthe unemployment insurance tax—are part of employers' costs andtherefore provide a direct instrument for affecting inflationarypressures.
Most economists believe that reductions in federal purchaseshave a somewhat larger impact on real GNP than a reduction intaxes of a similar amount, at least in the short run. SeeCongressional Budget Office, Understanding Fiscal Policy (April1978).
45
The 1977 amendments to the Social Security Act raised currentpolicy tax receipts considerably: by an estimated $6.6 billion forcalendar year 1979, $9.8 billion by 1980, and $19.8 billion by1981. These measures were taken to improve the condition of thetrust funds and to meet future expansion in program outlays.Unless program benefits were also reduced, the payroll tax reduc-tion described above would be contrary to the goal of making theprogram self-financing.
CBO recently analyzed the impact of a $10 billion change inthe social security tax _3/—a reduction of that magnitude wouldapproximately offset the impact of the increases for 1979 and1980 resulting from the 1977 amendments, as compared with priorlaw. A cut of that size was estimated to reduce the Consumer PriceIndex by about 0.3 percent after eight quarters and to increasereal GNP by 0.6 percent.
A $10 billion cut in social security taxes, effective onJanuary 1, 1980, would offset roughly one-half of the effect onreal GNP and employment that would result by late 1980 from the $15billion cut in outlays analyzed earlier. The positive impact oninflation from the spending cut would be augmented by the cut inpayroll taxes, causing about a 0.4 percent reduction in pricesby late 1981, as compared with the baseline. A cut in socialsecurity taxes of this magnitude would offset a smaller proportionof the impact on real activity of the $25 billion cut in spendingon real GNP. The combined policy changes, however, would reducethe price level by about 0.6 percent by 1981.
Determining the Mix of Fiscal Policy
In addition to determining the extent of overall stimulus orrestraint exerted by the federal budget and the size of the federalsector, policymakers may also affect economic goals by choosing theparticular mix of taxes and spending programs. For example, thecomposition of tax policy can influence the goals of price stabi-lity and longer-term economic growth. Similarly, the composi-tion of tax and spending policies affects the degree and types ofstructural unemployment.
/̂ Congressional Budget Office, Aggregate Economic Effects ofChanges in Social Security Taxes, Technical Analysis Paper(August 1978).
46

Investment Incentives. If the fiscal package involvesbusiness tax reduction, policymakers may want to consider sub-stituting a targeted fiscal incentive to invest for a reductionin the corporate income tax rate, or vice versa.
In an earlier report (The Economic Outlook. February 1978) ,CBO compared the effects of three different types of business taxchanges: accelerating depreciation, increasing the investment taxcredit, and reducing the maximum corporate income tax rate. Theresults of that analysis (updated in Appendix B for changes in thecorporate income tax rate and in accelerated depreciation) suggestthat the accelerated depreciation and investment tax credit strate-gies have a substantially larger impact on investment per dollar oftax reduction than the cut in the corporate tax rate. Neverthe-less, there is a great deal of uncertainty about the quantitativeeffects of these three kinds of changes in business taxes, in partbecause their effects on investment occur with relatively longlags.
Tax-Based Incomes Policies. Tax-based incomes policies(TIP) provide another approach to combating inflation. The basicidea behind TIP is to use the tax system to encourage noninfla-tionary behavior and to discourage inflationary behavior, kj Thisstrategy is related to the broader notion of the "social compact";that is, it is an agreement (sometimes informal) among labor,management, and government to act in certain ways to moderateinflation.
The Administration's proposal for real wage insurance is aform of TIP, and constitutes an important part of the Administra-tion's wage-price program because it serves as an incentive toencourage compliance with the 7 percent standard for pay in-creases. The probable degree of success of this proposal andother forms of TIP is diff icul t to evaluate, in part becausethey have not been tried in the past. J>/
4/ Arthur M. Okun and George L. Perry (eds.) , "Innovative Policiesto Slow Inflation," Brookings Papers on Economic ActivityVol. 2 (1978).
5/ For a more detailed analysis of the Administration's proposal,see Appendix A.
47
MAINTAINING SHORT-RUN BUDGET FLEXIBILITY
It would be very difficult to control short-run movements inthe federal deficit, and it is questionable whether this would bedesirable, even if feasible* The principal reason it is difficultto control is that economic forecasts are quite uncertain.Moreover, a flexible budget can make a contribution toward stabili-zing the economy. If the economy turns out to be weaker thanexpected toward the end of 1979 and in 1980, the deficit willprobably be higher, without any policy changes. This "automatic"response of the budget could cushion the downturn.
Over a longer period of time, however, the size of the federaldeficit may have an important bearing on saving and capital accumu-lation. j>y Hence, it may be desirable to maintain short-runflexibility of fiscal policy, but in the context of long-runobjectives concerning the relative size of government and the needto encourage saving and investment.
Automatic Budget Response To Recession
To some extent, the federal budget "automatically" cushionsa slowdown in economic activity. During a downturn in activ-ity, personal and corporate income taxes tend to decrease morethan GNP, thereby reducing the burden of taxes and increasingthe deficit. On the spending side, the unemployment insurancesystem is one of the most important automatic stabilizers. Otherspending areas that respond automatically include welfare programsand the social security system. CBO estimates that transferprogram outlays automatically increase by about $7 billion for each
6_/ Under some circumstances, particularly when the economy isoperating at high rates of resource utilization, large deficitsmay crowd out investment.
48

1 percentage point increase in the unemployment rate. 7/
Rising inflation during a downturn in economic activity canreduce the automatic cushioning effect of the budget on real GNP.The progressive income tax system can operate as an automaticstabilizer if the slowdown in real growth is associated with aslowing in the growth of money incomes. But if the slowdown isassociated with high inflation, tax revenues may decrease verylittle or even increase, thus adding to restraint of both outputand inflation. Inflation will also increase spending, thoughgenerally less than the increase in revenues. 8/
Discretionary Budget Responses
Recent experience indicates that stimulative policies can beput in place rather quickly if there is a consensus for doing so.For example, legislation was passed in May 1975 to pay rebates on1974 taxes, and most rebates had been paid by July 1. In early1977, in response to a slowdown in the economy, the Congress passeda Third Concurrent Resolution on the Fiscal Year 1977 Budget toprovide for the economic stimulus package enacted in the summerof that year.
T_l Some spending categories which are not entitlement programsmay also respond to increased unemployment rates. In therecently enacted reauthorization of the Comprehensive Employ-ment and Training Act (CETA), the recommended number of jobslots for the countercyclical public service employment programis tied to projections of the unemployment rate by the Adminis-tration. The CETA countercyclical jobs program, however, is notan entitlement program, and it is unclear whether budget autho-rity would be adjusted according to levels recommended in theAct. According to the formula in CETA, an increase of 1 per-centage point in the projected unemployment rate (from thecurrent level of slightly less than 6 percent) would call for anincrease in funding of approximately $2 billion and an ad-ditional 200,000 job slots.
J3/ CBO estimated that approximately 60 percent of federal outlaysin 1975 were adjusted automatically for increases in the pricelevel, although not all of the adjustment takes place in thesame fiscal year. See Congressional Budget Office, The Effectsof Inflation on Federal Expenditures (1976).
49

If the 1980 outlook for the economy appears significantlyweaker by this summer, a number of budget measures might be con-sidered . One approach would be simply to defer or omit plannedreductions in outlays, particularly in the areas of countercyclicalprograms and policies.
A second approach would be to reduce either payroll taxesor individual income taxes, because their effects would be feltrelatively quickly. The effects of a reduction in payroll taxeshave already been discussed, but as a short-run stimulus to theeconomy, timing would be an important consideration.
CBO also analyzed the effects of a $15 billion cut in indi-vidual income taxes that might be used to stimulate the economy.Two alternative effective dates were considered: July 1, 1979 andJanuary 1, 1980. The results, summarized in Table 11, are roughestimates, considerably influenced by assumed initial economicconditions as well as by the assumed response of monetary policy.
Finally, the Congress might want to consider strengthening theautomatic response of the federal budget to changes in the economicsituation. Two ways in which this might be done would be to:
o Provide budget authority for spending programs (such asthe CETA countercyclical jobs program) that respond byformula to the unemployment rate; and
o Adjust income tax rates automatically by formula.
ESPECIALLY SEVERE UNEMPLOYMENT PROBLEMS
Great disparities in unemployment—by race, income level, andgeographic area—still remain, and decisions regarding bothoverall fiscal policy and the composition of fiscal policy couldsignificantly affect these disparities in future years.
Under current policy, the emphasis in employment programshas become focused on disadvantaged groups—in both countercyclicaland structural policies and programs. The principal instrumentsfor targeting on the employment problems of the disadvantaged
50

TABLE 11. ESTIMATED ECONOMIC EFFECTS OF $15 BILLION REDUCTION IN FEDERAL INDIVIDUAL INCOMETAXES, EFFECTIVE JULY 1, 1979 OR JANUARY 1, 1980
Effective July 1, 1979
Economic Variable
GNP (billions of current dollars)
GNP (billions of 1972 dollars)
Unemployment Rate (percent)
Employment (thousands)
Consumer Price Index (percentchange from base)
Net Budget Cost, Fiscal Year(billions of current dollars)
1979:4
9
6
-0.1
100
0.0
3
1980:4 1981:4
20 22
10 8
-0.3 -0.2
400 400
0.1 0.2
10 7
Effective
1980:4
15
8
-0.2
300
0.0
9
January 1.1980
1981:4
24
11
-0.3
400
0.1
9
SOURCE: Congressional Budget Office estimates.
Include the recently modified CETA program _9_/ and a relativelyuntested, targeted jobs tax credit, which is focused on particulargroups of workers. 10/ Available enrollment data collected by theDepartment of Labor suggests that a relatively high proportion ofthose enrolled in the CETA programs are economically disadvantaged.For example, data for fiscal year 1978 (before the eligibilitycriteria were tightened further) suggest that approximately 80percent of participants in the countercyclical program were eco-nomically disadvantaged—that is, they either had incomes below theCensus Bureau's poverty standard or below 70 percent of the Bureauof Labor Statistics "lower living standard."
More restrictive fiscal and monetary policies run a substan-tial risk of increasing disparities in unemployment rates. Tobegin with, cuts in spending below current policy in the employ-ment area would have important implications for the level andcomposition of unemployment in both fiscal year 1980 and there-after. In the short run, reductions in employment programs appearto have greater effects on employment and unemployment than dosimilar size cuts in the federal budget in general, ll/ Thus,groups that traditionally have had especially high unemploymentcould be faced with a dual problem in 1979: when the economysoftens, the unemployment rates for such groups as blacks and
_9_/ For a recent review of the results of employment and trainingprograms and related issues, see Congressional Budget Office,CETA Reauthorization Issues (August 1978) .
10/ The targeted jobs credit—part of the Revenue Act of 1978—provides a tax credit of 50 percent of qualified wages thefirst year of employment and 16 2/3 percent the second year ofemployment. Seven groups of workers were designated aseligible, including economically disadvantaged youths.Eligibility is to be certified by the Labor Department, withthe credit applying to the first $6,000 of an eligible worker'swages. See "The Revenue Act of 1978" (P.L. 95-600).
ll/ For a comparison of the impact of changes in the publicservice employment progam with that of other fiscal instru-ments, see Understanding Fiscal Policy.
52

youths would increase more (in percentage points) than for thelabor force in general. 12/ In addition, if part of the anti-in-flation strategy involves large cuts in employment programs, thiswould have a disproportionate effect on the groups and geographicareas most affected by softness in the economy. 13/
For the intermediate term, targeted training and employmentprograms and policies may be an essential component of any compre-hensive strategy for achieving the reduction in unemployment andinflation called for in the Full Employment and Balanced GrowthAct. Since it takes time to build up such programs (or to phasethem down), major cuts in existing programs could postpone theimplementation of the Full Employment and Balanced Growth Act byseveral years.
CONCLUSION
One of the most difficult issues for fiscal policy is how torespond to an acceleration in inflation. Spending cuts canmake a limited—but significant—contribution to lowering infla-tion, but the effect is neither sudden nor dramatic. The principaldisadvantage of spending cuts, however, is that they lower realgrowth and increase unemployment, when unemployment is alreadyexpected to increase. Restrictive policies may also increasedisparities in unemployment rates for different groups in the laborforce. One way to achieve a considerable reduction in spending andinflation without greatly increasing unemployment is to combinespending cuts with a reduction in payroll taxes.
12/ See Congressional Budget Office, Youth Unemployment; TheOutlook and Some Policy Strategies (April 1978) , and TheUnemployment of Nonwhite Americans; The Effects of AlternativePolicies (July 1976) .
13/ The withdrawal of stimulus funds could also cause adjustmentproblems for some local governments, particuarly in areassuffering from longer-term economic adjustments. See HouseBudget Committee. Phasing Down Antirecession Programs; FiscalYear 1979 Budget Issues (November 1978) .
53
38-418 O - 79 - 6

Uncertainty In the economic outlook implies uncertaintyis the size of the federal deficit, because the budget responds tochanges in the economy; to some extent, the budget automaticallycushions the impact of a slowdown in the private economy. More-over, in the event of a more severe slowdown than expected, policy-makers might want to take additional discretionary measures, whichwould also affect the size of the federal deficit.
54

CHAPTER V. LONGER-RUN ECONOMIC GOALS
Decisions on the fiscal year 1980 budget will not justaffect the economy in 1980; they will also affect economic per-formance in later years and have a bearing on the extent to whichlonger-term national goals are achieved. Last year, the FullEmployment and Balanced Growth Act (the Humphrey-Hawkins Act) waspassed, establishing unemployment and inflation goals to be reachedby 1983. I/
This chapter analyzes these goals, especially the question ofwhether they are achievable and consistent with each other in thetime period mandated.
THE HUMPHREY-HAWKINS GOALS
The Humphrey-Hawkins Act sets specific unemployment goals of 3percent unemployment in the adult civilian labor force (20 andolder) and a corresponding 4 percent unemployment in the aggregatecivilian labor force (16 and older) by 1983. The act also setsgoals for inflation—the rate of change in the Consumer PriceIndex—of 3 percent by 1983, and zero percent by 1988; but itspecifically states that anti-inflation policies shall not impedeachievement of the unemployment goals. Other goals, including abalanced federal budget, were also adopted. 2j
Other longer-term goals that affect budget planning were alsoenacted in 1978. An amendment to a bill dealing with theInternational Monetary Fund declares that by fiscal year 1981,"total budget outlays of the Federal Government shall notexceed its receipts," and Section 3 of the Revenue Act linksfuture tax cuts to slower growth in federal spending and overallbudget balance.
The full list of general goals is as follows: "full employmentand production, increased real income, balanced growth, abalanced federal budget, adequate productivity growth, properattention to national priorities, achievement of an improvedtrade balance through increased exports and improvement in theinternational competitiveness of agriculture, business, andindustry, and reasonable price stability."
55

These unemployment and inflation goals are not outside therange of past experience. Unemployment was 4 percent or lowerin 1947-1948, 1951-1953, and 1966-1969. Inflation was 3 percent orlower in most years between 1948 and 1968 (see Figure 10). In theearly 1980s, however, it will be difficult to reach either goal—let alone reach both simultaneously—using only aggregate monetaryand fiscal policies. The first section of this chapter willdiscuss the unemployment goal; the second section, the infla-tion goal; and the third section will review evidence indicatingthat even if one or the other goal is achieved, it is unlikely thatboth can be reached simultaneously, using aggregate policies alone.The Humphrey-Hawkins Act recognizes the limitation of standardmonetary and fiscal policies. It states that, in recent experi-ence, "aggregate monetary and fiscal policies alone have beenunable to achieve" concurrently low rates of unemployment andinflation. The final section of this chapter will thus discussmeasures which might further both goals simultaneously.
Unemployment Targets
Although 4 percent unemployment has been achieved in the past,most analysts believe that it is now more difficult to reach thatmeasured rate of joblessness. Two reasons are generally cited forthis increased difficulty:
o Shifts in the demographic structure of the labor force,and
o Institutional changes that raise the measured unemploy-ment rate associated with a given level of labor marketslack.
Shifts in Composition of the Labor Force. One of the mostgenerally accepted factors contributing to the upward drift ofthe unemployment rate during the past two decades is the risingproportion of women and young people in the labor force. In thecase of women, this has resulted from the dramatic rise in theirlabor £orce participation. In the case of young persons, there hasbeen a rise in both their share of the working-age population andtheir labor force participation rates. The rise in their share ofthe working-age population results from the movement of the largepostwar baby-boom generation into the working years.
56

Figure 10.Unemployment and InflationPercent
9
Unemployment Rate(As a Percent of the Civilian Labor Force)
I I I I J I
'48-'49'BO-'B1'B2-'B3'B4-'S5'BB-'B7'B8-'59'60-'61'62-'63'64-'65'66-'67'68-'69'70-'71'72-'73'74-'7B'76-'77'78-79Calendar Years
Percent
14
Rate of Inflation(Percent Change in Consumer Price Index from a Year Earlier)
'48-'49'50-'B1'B2-'B3'S4-'BB'S6-IS7'S8-'S9'60-'6r62-'63'64-'65'6B-'67'68-'69'70-71'72-'7374-'7B'76-'7778-'79Calendar Years
SOURCE: U.S. Department of Labor, Bureau of Labor Statistics.NOTE: Latest point shown for CPI is based on average for October and November.
57

The changing structure of unemployment and the labor force bymajor age-sex group during the past two decades is shown in Table12. At high employment in 1956, unemployment rates for groups ofworkers under 25 were 1.5 to 4 times as high as for the corres-ponding "prime-age" (25 to 54 years old) workers of the same sex,and the rate for prime-age women was higher than that for prime-agemen. If that higher unemployment for women and young peoplereflects the job search and information gathering necessary toobtain satisfactory employment for recent labor-force entrants andre-entrants—rather than a general scarcity of jobs—then itfollows that the rising proportion of women and young people in thelabor force should be accompanied by a rising unemployment rate.
TABLE 12. UNEMPLOYMENT RATES AND SHARES OF LABOR FORCE BY AGE-SEXGROUP
Unemployment Rate
1956 1967 1973 1977
Percent of TotalCivilian Labor Force
1956 1967 1973 1977
All Workers 4.1 3.8 4.9 7.0 100.0 100.0 100.0 100.0
Males, Total16 to20 to25 to55 and
Females ,16 to20 to25 to55 and
192454older
Total192454older
3.811.06.93.03.5
4.811.06.34.13.3
3.112.34.71.92.5
5.213.57.04.12.5
4.113.97.32.52.5
6.015.38.44.42.8
6.17.10.4.3.
8.18.11.6.4.
23739
23245
67.3.5.45.13.
32.2.3.20.5.
87263
38762
63.34.76.540.411.7
36.73.75.121.66.2
61.15.38.037.810.0
38.94.36.322.45.9
59.05.18.136.79.1
41.04.46.724.35.6
SOURCE: U.S. Department of Labor, Bureau of Labor Statistics.
Estimates of the increase in the high-employment unemploymentrate resulting strictly from changes in labor-force compositionrange from 0.4 to 0.9 percentage points. Some reversal of thisshift can be expected in future years, as the baby-boom generationmoves into the prime-age, low-unemployment years; but by 1983, itappears that no more than two-fifths of the upward shift will havebeen reversed.
58

Institutional Changes. It also has been argued that therate of unemployment has increased because changes in institu-tions—especially in federal government policies—have raised themeasured unemployment rate associated with any given level oflabor market slack. There have been several policy changes whichmany believe to have had such effects:
o Increases in the level of unemployment insurance (UI)benefits relative to the after-tax wage, and increases inthe coverage of the UI system;
o Increases in the level and coverage of the minimum wage,which—according to most available evidence—limit jobopportunities, especially for young workers; _3/ and
o Work registration requirements for food stamp and welfarerecipients, instituted in 1972, which can be expected toraise reported labor force participation and unemploymentwithout much, if any, increase in labor availability.
Estimating the amount by which these policy changes haveraised the rate of unemployment, other things being equal, is adifficult problem. The simplest to evaluate, because it operatesonly through labor force participation, is the work registrationrequirement. The most reliable evidence indicates that thisrequirement raised the reported unemployment rate by 0.2 to 0.4percentage points in 1977. _4/ Estimates as high as 2.0 percentagepoints have been made; 5/ however, these high estimates have
3/ See, for example, Jacob Mincer, "Unemployment Effects ofMinimum Wages," Journal of Political Economy (August 1976).
kj Philip Cagan, "The Reduction of Inflation and the Magnitude ofUnemployment," in Fellner, (ed.), Contemporary Economic Prob-lems 1977 (American Enterprise Institute); Cornelia Motheraland Rebecca Summerville, "The Impact of Federal Policies onLabor Force Participation and Unemployment," presented at theSouthern Economic Association Meeting, November 1978 (pro-cessed).
_5/ Kenneth Clarksqn and Roger Meiners, "Government Statistics as a~~ Guide to Economic Policy: Food Stamps and the Spurious Increase
in the Unemployment Rates," Policy Review (Summer 1977).
59

significant methodological problems. Philip Cagan has estimatedthat changes in UI raised the high-employment unemployment rate by0.34 percentage points between 1956 and 1977, and estimates thatminimum wage increases and their interaction with labor forcecomposition may have raised it by as much as 0.63 percentage pointsover the same period. 6/ It should be noted, however, that to theextent that these programs raise unemployment by raising laborforce participation of groups other than prime-age males, at leastpart of these effects may already be accounted for by the estimatedeffect of changing labor force shares.
The Inflation Target
A combination of two factors makes reducing the rate ofinflation to 3 percent by 1983 difficult: the current rapid rate ofinflation, and the widespread practice of linking income adjust-ments to past inflation. The Consumer Price Index increased by9 percent in 1978; to the extent that wages and other productioncosts are subsequently escalated in response to such price in-creases, great momentum is built into inflation. 7J Consequently,it is difficult to slow the pace of inflation quickly.
The indexing of current income adjustments to past consumerprice change occurs in a variety of ways, including:
o Many union members receive periodic wage increases based onthe movement of the CPI; about 60 percent of all workerscovered by major collective bargaining agreements—and amuch higher share of those covered by multiyear contracts—benefit from cost-of-living escalator clauses. Thisperiodic escalation in combination with first-year wagecatch-up and annual improvement adjustments are designed tomaintain the traditional growth of workers' real wages;
6/ Cagan, "The Reduction of Inflation and the Magnitude of Un-employment ."
TJ For a more detailed analysis of the nature of inflationarymomentum, see CBO, Inflation and Growth; The Economic PolicyDilemma (July 1978), Chapter III.
60

o The wages paid to a large number of nonunionized workersare informally indexed to the past rate of inflation;employers provide informal escalation for a variety ofreasons, including the threat of unionization and themaintenance of employee morale and productivity;
o Professional organizations often use their economic andpolitical power to maintain the traditional growth inmembers' real income; and
o A variety of government actions explicitly or implicitlyattempts to reduce the impact of inflation on livingstandards: indexation of social security benefits as wellas other income transfer programs, periodic adjustments ofthe minimum wage, increased farm price supports, andrestrictions on competition from imports.
The momentum imparted to inflation by this widespread in-dexation of income claims to past price movements makes it dif-ficult—but not impossible—to slow inflation quickly by standardmonetary and fiscal policies alone. According to mainstreameconomic analysis, restrictive policies slow inflation by creatingexcess capacity—high unemployment and idle plant and equipment—which puts downward pressure on wage and price adjustments. Thedegree of economic slack necessary to lower the rate of inflationsignificantly by 1983 through the use of standard macroeconomictools and the related question of the consistency of the Humphrey-Hawkins unemployment and inflation goals are analyzed in the nextsection.
THE TRADE-OFF BETWEEN INFLATION AND UNEMPLOYMENT
The extent of the trade-off between unemployment and inflationcan be measured by comparing alternative five-year projections,using a wage-price framework that is typical of most large econo-metric models of the economy. In this framework, nominal wagesare assumed to depend on slack in labor markets (measured by theunemployment rate) and inflation catch-up and expectations.Prices are assumed to be a markup over costs.
Although there has been a great deal of debate about how muchof an unemployment-inflation trade-off exists in the long run,there is a considerable amount of empirical evidence that thetrade-off in a four- to five-year period exists, and that this
61

trade-off is costly in the sense that lower unemployment meanshigher inflation and vice versa. To demonstrate this, a basefive-year projection path is compared with two paths that al-ternately show the effects of lowering unemployment and the effectsof lowering inflation, using standard fiscal and monetary policies(see Figure 11).
Base Five-Year Projections Path
The base path begins with the CBO forecast for 1980. Theunemployment rate is assumed to drop gradually from 6.8 percent in1980 to 5.5 percent in 1984. The 5.5 percent unemployment targetwas chosen as a rough estimate of the unemployment rate below whichinflation accelerates; the results would not be much different ifsomewhat higher or somewhat lower rates were chosen. The growthin real GNP required to reach this target is estimated to be about4.5 percent annually from 1981 to 1984. The inflation pattern thatis consistent with these growth rates shows a gradual decline to 6percent in 1984. This path is not meant to be a forecast; instead,it describes a possible five-year scenario in the absence of majorshocks to the economy.
Lower Unemployment
In the high-growth path, the unemployment rate is assumed todrop to 4 percent by 1983 and to hold there. This requires realGNP growth rates between 5.5 percent and 7 percent from 1981through 1983. As a consequence, the inflation rate bottoms out at7 percent in 1981 and rises to 9 percent by the end of 1984. Sincemost estimates associate 4 percent unemployment with acceleratingwage and price increases, in the absence of additional inflation-reducing policies (or additional structural employment policies),holding the unemployment rate at 4 percent would continue to raisethe inflation rate. 8/
_8_/ The magnitude of the changes needed to achieve the Humphrey-Hawkins goals and the goals discussed in the lower inflationscenario would require fairly large changes in fiscal andmonetary policy. However, it is difficult to estimate with anydegree of certainty exactly how much policy would need to bechanged. For a further discussion of this problem, see theCBO background paper entitled, An Analysis of the Roth-Kemp TaxCut Proposal (October 1978).
62

Figure 11.
Alternative Five-Year Paths
9.0
7.0
5.0
3.0
Unemployment Rates with Three Output Paths
Low-Growth Path
High-Growth Path
I f1978 1979
10.0
8.0
1980 1981
Calendar Years
1982 1983 1984
Inflation Rates with Three Output Paths
I6.0
4.0
High-Growth Path
'art.
Low-Growth Path
1978 1979 1980 1981
Calendar Years
1982 1983 1984
63

Lower Inflation
The efficacy of reducing inflation by inducing protractedslack in the economy has recently received a lot of attention. Therationale behind this type of fiscal policy is that keeping theunemployment rate high will, over a sufficiently long period oftime, lower the inflation rate.
In this five-year low-growth scenario, the unemployment rateis assumed to remain near the 7 percent range from the end of 1979to 1984. This implies 3.5 percent growth in real GNP from 1981 tothe end of the period. As a result of the prolonged economicslack, the inflation rate drops to the neighborhood of 4 percent in1984.
The direct costs of such a policy are quite high. Comparedwith the base path, GNP in 1984 would be about $100 billion (1972dollars) lower and about 1.5 million jobs would be lost. It isrelatively easy to estimate the cost of rising unemployment interms of the value of lost output. But other costs of high unem-ployment are not included in the above estimate—permanent loss ofskills and work habits, family disruption, crime, and alienationhave all been attributed to high unemployment by some analysts.Higher inflation also has substantial costs that are difficult toestimate.
Can The Trade-off Be Improved?
The results given above demonstrate the costly trade-offbetween unemployment and inflation and suggest that the 1983inflation and unemployment goals specified in the Humphrey-HawkinsAct are not simultaneously achievable using monetary and fiscalpolicies alone. There is currently a great deal of inflationarymomentum in the U.S. economy; lowering the inflation rate byreducing aggregate demand would require that high unemploymentrates be sustained for many years. On the other hand, aiming fora 4 percent unemployment rate in 1983 would be highly inflationarybecause the unemployment rate at which the rate of inflationneither accelerates nor decelerates may be in the neighborhood of5.5 to 6 percent now and will decline only modestly by 1983 ifthere are no changes in supply and labor market policies. The highcosts of reaching the Humphrey-Hawkins unemployment goals (in termsof inflation) and its inflation goals (in terms of lost output andjobs) underline the inefficiency of using fiscal and monetarypolicies alone. The simultaneous achievement of the two goals may
64

only be feasible if supply-enhancing and income policies are usedin conjunction with demand management policies. These types ofpolicies are described in the next section.
REDUCING BOTH UNEMPLOYMENT AND INFLATION
The Humphrey-Hawkins Act states that, "...sole dependenceupon fiscal or monetary policies or both to combat inflation canexacerbate both inflation and unemployment....the coordinated useof fiscal and monetary policies in conjunction with specifictargeted policies are necessary to combat inflation." Anotherpassage reads, "In choosing means to achieve the goal for thereduction of unemployment and choosing means to achieve thegoal of reasonable price stability, those means which are mutuallyreinforcing shall be used to the extent practicable." Thisconcluding section will discuss policies suggested in the Hum-phrey-Hawkins Act to improve the chances of achieving the targetrates of unemployment and inflation simultaneously.
Supply-Enhancing Programs. In recent years, significantincreases in inflation have been caused by what are generallycalled supply shocks; the two most familiar examples are badweather, which reduces the supply of farm products and raises theirprices, and the large energy price increase initiated by OPEC'sexercise of market power. Another supply change that continuesto contribute to inflation is the slowdown in the growth of pro-ductivity (output per hour worked). Unfavorable supply shockscan increase both unemployment and inflation. Policies that in-crease supply, on the other hand, can lower both unemployment andinflation. Most supply-enhancing policies are not likely to becost-free; they may require federal budget resources, eitherthrough spending or through tax incentives.
The list of supply policies that might reduce both unemploy-ment and inflation is substantial—though some of the policiesconflict with other provisions of Humphrey-Hawkins or with otherCongressional goals expressed in past legislation. For example:
o Reduction or postponement of increases in the minimum wagewould likely reduce both unemployment and inflation;
65

o Reducing the benefits or coverage of the unemploymentinsurance system during high employment (while retainingthe countercyclical features specified in Humphrey-Hawkins)could reduce inflation and unemployment; taxing UI benefitscould have a similar outcome;
o Increased federal research and development or research andinvestment tax incentives may improve productivity; themost effective tax incentives for investment, per dollar ofrevenue loss, are thought to be the investment tax creditand accelerated depreciation;
o Monitoring bottlenecks. Bottleneck problems arise whenshortages of capital or skilled labor limit output ofcommodities which cannot be easily substituted for inthe short run, thus limiting the expansion of aggregateoutput in response to rising demand and causing inflation.Bottlenecks appear to have been an important factor in the1973-1974 inflation, but avoiding future bottlenecks isdifficult and not a cure-all: inflation can accelerate asutilization rises,even without specific bottlenecks. Evenif materials or labor shortages can be accurately antici-pated, means of alleviating them—given that Humphrey-Hawkins prohibits production controls—are not easilyformulated, and the essence of a "bottleneck" factor ofproduction is that it takes time to produce and put inplace;
o Energy policy. Keeping energy prices from rising canconflict with the goals of encouraging domestic energyproduction and conservation;
o Competition policy. Among the suggestions in Humphrey-Hawkins for increasing competition are strengtheningantitrust laws and changing regulation. The recent deregu-lation of airline passenger fares provides an exampleof what can be accomplished through changing federalregulatory policy. Humphrey-Hawkins emphasizes competitionin product markets but does little to encourage greatercompetition in labor markets; for example, there is nosuggestion of modifying the Davis-Bacon Act, which tendsto require high wages for government construction projects;
66

o Reduction of trade barriers; and
o Regulation for environmental and related goals has loweredmeasured productivity and raised measured inflation.Humphrey-Hawkins leaves it to the Congress to decide whatregulation of this type is "necessary:" Another suggestedapproach is to achieve environmental goals by more cost-effective means than direct regulation, such as effluenttaxes.
Targeted Employment Policies. To reduce unemployment,Humphrey-Hawkins specifically mentions targeted employment taxcredits, wage vouchers, and other employment incentives to privatesector businesses. The 1978 tax law provides for a targetedemployment tax credit. Targeting can be effective in reducingunemployment without raising inflation, if labor markets aresegmented by skill or location. In that respect, targeting can beregarded as a substitute for reducing the minimum wage or otherwisereducing barriers to the employment of certain groups. Similarly,targeted public employment can reduce unemployment with lessinflationary pressure than a comparable employment expansionstimulated by a tax cut.
Farm Policy. Federal policies to raise or maintain marketprices of farm products can be of two types: production restrictionor stockpiling. Production restriction raises average farm pricesand farm income, accelerates inflation, and increases instabilityin prices. Some economists believe that stockpiling raises farmprices, farm incomes, and inflation less than production restric-tions, and results in more stable prices and production.
Incomes Policies. Three of the four postwar periods of lowunemployment and low inflation were characterized by some formof incomes policy—either price and wage guidelines or controls.Incomes policies are not mentioned in Humphrey-Hawkins, and wageand price controls are specifically disavowed.
It is not likely that any incomes policy—voluntary or compul-sory—can effectively control inflation arising either from supplyshocks or from overstimulating the economy. What a well-designedincomes policy may be able to do is slow the wage-price spiral—themomentum of inflation—with less cost in terms of lost productionand employment than can fiscal and monetary policies alone.
67
In conclusion, achieving both the unemployment and inflationgoals of Humphrey-Hawkins is highly unlikely if only monetary andfiscal policies are used. Adopting any or all of the structuralpolicies outlined above could increase the chances of achievinginflation and unemployment goals simultaneously; but the structuralpolicies require difficult choices and the magnitude of theireffects is not easily predicted.
68

APPENDIXES
8-418 O - 79 - 7


APPENDIX A. THE ADMINISTRATION'S WAGE/PRICE PROGRAM
In October 1978, President Carter announced a new anti-inflation program:
o The 1980 budget submitted to Congress would give toppriority to moderating inflation; the federal spendingshare of GNP would be reduced to 20 percent in fiscalyear 1980, and the deficit would be less than $33billion; _!/
o Government regulations that increase costs and priceswould be reviewed;
o Numerical standards for price and wage changes in the yearahead were established along with proposed incentives forcompliance and penalties for nonobservance.
Many analysts have concluded that the wage/price program must besuccessful if a recession is to be avoided in 1979 or 1980. Thisappendix describes the program and assesses its chances of success.
Description of the Wage/Price Program
The program can be divided into three parts: standards,enforcement, and exemptions.
Standards. The price standard is that the average priceincrease by a firm during the year should be 0.5 percentage pointbelow its average annual rate of increase in 1976-1977, with amaximum of 9.5 percent. The wage standard is that the averageannual increase in wages and new privately financed benefits forany given employee group of a firm cannot exceed 7 percent. (Afirm's workforce is divided into four employee groups: managementemployees, employees covered by collective bargaining agreements,employees earning $4 per hour or less, and all other employees.)
I/ The fiscal year 1980 budget just released has an even smaller~~ deficit of $29 billion.
71

Enforcement. The proposed enforcement mechanism has bothsanctions and rewards. The potential sanctions for not complyingwith the standards include:
o Firms with government contracts in excess of $5 millionmust be certified as complying with the wage-price stan-dards or possibly lose the contracts;
o Limitations on imports competitive with products ofnoncomplying firms could be loosened;
o Rate and entry regulations governing noncomplying firmscould be reviewed;
o Noncompliance by certain industries—for example, con-struction—could result in modifications of industry-specific minimum wage and price legislation; and
o Compliance may be required in order to receive assistancefrom the U.S. Import-Export Bank.
The principal carrot for compliance is on the wage side—real wageinsurance. Groups of employees who comply with the wage standardbecome eligible for a tax refund equal to the excess of the CPIincrease over 7 percent applied to the employee's wages. TheAdministration proposes two caps on its real wage insurance,limiting its coverage to the first $20,000 in earnings and limitingthe range of compensated inflation to 10 percent.
Effective monitoring is limited to the wage and price actionsof the largest firms—primarily those with sales in excess of$250 million per year. In addition, the Council on Wage and PriceStability will follow developments in collective bargainingagreements where 1,000 or more workers are covered.
Exemptions. There are a number of explicit and tacit exemp-tions to the wage/price standards. These will be reviewed in somedetail below.
Problems with Achieving Reduced Inflation
There are three types of problems that reduce the chances thatthe voluntary wage/price program will result in a quick reductionin the rate of inflation:
72

o A large portion of prices included in the CPI are official-ly or tacitly exempt from the program—including food atthe farm, interest rates, energjr, products produced byfirms with low profit margins relative to recent experi-ence, imports, and products produced by relativelysmall firms;
o A large portion of wage earners are officially or tacitlyexempt from the wage standard—including those paid lessthan $4.00 per hour, those whose wages have been previous-ly contracted (plus those in close tandem), and thoseemployed by small firms; and
o Voluntary compliance may be difficult to obtain, espe-cially from unions being asked to accept reductionsreal wages.
Price Standard Exemption. There are three major areas ofexemption to the price standard. First, some goods and servicesare explicitly excluded:
o food at the farm,o government goods and services (taxes),o interest rates,o imports, and ,o regulated energy products, such as natural gas.
Second, some goods and services are affected by the rule thatessentially permits firms to maintain their before-tax profitmargins on sales to the average margin in their best two out of thepast three fiscal years. This exemption could affect:
o retail food (if raw food prices rise significantly),o gasoline and other petroleum products (as a result of
OPEC price increases and domestic decontrol), ando public utilities and other regulated areas of the economy,
where prices are already typically set to ensure a fairrate of return.
73

Finally, a large number of goods and services are tacitly exemptbecause enforcement is directed only at large corporations:
o new and existing homes sales,o used car sales,o automobile maintenance and repair,o household services,o apparel services,o medical care services,o restaurants and lodging,o entertainment services,o personal care services, ando educational services.
The exemptions account for roughly 60 percent of the ConsumerPrice Index, and the exempted goods and services accounted for muchof the acceleration in inflation in 1978. They rose at an 11percent annual rate during the first 10 months of the year, ascompared with a 7 percent rate for the nonexempt products. Theprices of the nonexempt products rose at about a 5.5 percentaverage annual rate in 1976-77; therefore, a .5 percent pricedeceleration implies that these prices would increase in theneighborhood of 5 percent in 1979. If the officially and tacitlyexempt product prices continue to rise as rapidly as they didbefore the program in 1978, then consumer price inflation would beabout 8.7 percent in 1979—even with a full .5 percent decelera-tion by the nonexempt group. 2/
Wage Standard Exemptions. There are two, nonmutually exclu-sive, types of exemptions from the wage standard. First, someworkers are officially exempt:
o Workers earning $4.00 per hour or less;
o Workers who have previously contracted wage adjustmentsfor next year;
o Workers who have recorded exceptionally large productivitygains resulting from work rule changes; and
"if It is, of course, not known to what extent the tacitly exemptgroup will change their behavior in response to the wage-pricestandards.
74

o Workers whose wages have historically maintained a closetandem relationship to another employee group whose wageadjustment occurred prior to the announcement of theprogram.
Second, there are the employees of relatively small firms who aretacitly exempt because enforcement is directed only at largefirms.
Extrapolating trends from the Current Population Survey'sweekly and hourly earnings data, about 40 percent of workers paidat hourly rates will receive less than $4.00 an hour next year. Ifthese workers were to receive the overall average hourly compensa-tion gain recorded from the third quarter of 1977 to the thirdquarter of 1978, average hourly compensation per worker would riseabove the 7 percent standard. In addition, if the 6 millionworkers who will be covered by continuing major collective bar-gaining agreements next year also receive increases greater than 7percent, the hourly payment per worker would increase still fur-ther. It is unknown how many employees of small firms will comply.
Voluntary Compliance. Obtaining voluntary compliance with theprogram's standards from the nonexempt groups is not assured; laborunions will find compliance especially difficult. This conclusionfollows from two characteristics of wage determination undercollective bargaining:
o Unions attempt to maintain the loyalty of their members,and an important aspect of this maintenance of loyalty issatisfying their members' wage aspirations;
o Workers tend to evaluate whether wages are satisfactorymore on ethical than economic criteria; the old laborslogan of "a fair day's work for a fair day's pay" pro-vides an important insight into workers' wage aspirations.
In general, equity in wage determination has two dimensions.First, there are interpersonal or intergroup comparisons. Orbitsof comparison or wage patterns tend to become established over timeand through the process of repetition come to be accepted asfair by wage earners. For example, steelworkers' wage settlementstend to pattern after autoworkers' settlements, and to break thisorbit would result in workers feeling that they were treatedunfairly. Second, there are comparisons over time. Workers becomeaccustomed to a standard rate of increase in their real wage
75

over time; to receive less would be perceived as inequitable.Thus, multi-year collective bargaining contracts are typicallycharacterized by three types of wage adjustments: a first-yearcatch-up to compensate for past inflation, an annual improvementfactor, and a cost-of-living escalator.
A problem with the wage standard is that it requires unions toviolate both dimensions of equity and to do this, from theirmembers' perspective, voluntarily:
o Intergroup equity. The unions that bargain in 1979are being asked to settle for a 7 percent annual increasein wages and new benefits when other unions have recentlynegotiated and received much more (for example, mineworkers received 13 percent and railroad workers receivedmore than 10 percent); and
o Equity over time. In order to comply with the wagestandard, the unions bargaining in 1979 must in generalsettle for reductions in real wage trends for theirmembers, rather than maintain traditional real wageincreases. This is true even if the real wage insuranceproposal is enacted, because the standards permit nofirst-year catch-up to past inflation and permit at best a1 percent real wage rise over the life of the contract—well below trend rates for the teamsters, auto workers,electrical workers, rubber workers, and meatpackers. Itis noteworthy that the Kennedy guidelines and the Nixonstandards permitted real wages to rise more than 1 percentannually.
Given the pressures from their membership, it will be diffi-cult for unions to comply with the wage standard voluntarily.Reasons that may be used to justify noncompliance include:
o A delay in the passage of real wage insurance (or therejection of the program by the Congress), which wouldsupport the rationale that the program is not operative;
o A continued rapid pace of inflation, which would providethe rationale that the price standards are not working and,therefore^ the program is not operative; and
o Any examples of wage increases greater than 7 percent,which would support the contention that the wage standardsare being ignored.
76

If management attempts to comply with the published standards(and the penalties facing large corporations for not complying arepotentially severe), the outcome could be a sharp increase inindustrial conflict. A long and bitter strike in a critical areawould place pressure on the Administration to modify its wage/priceprogram.
Summary
By itself, the Administration's wage/price program announcedOctober 24 appears to have little chance of achieving its announcedgoal of a 6 to 6.5 percent rate of inflation in 1979. The currentmomentum of inflation appears to be too great to achieve such arapid reduction without widespread slack in the economy. Inaddition, most of the goods and services that have exerted thegreatest upward pressure on the price level are officially ortacitly exempt from the price standards, and a large portion ofthe labor force is officially or tacitly exempt from the wagestandard. Finally, given the nature of the American labor move-ment, unions will find it difficult to comply voluntarily with thewage standards.
77

APPENDIX B. EFFECTS OF CHANGES IN THE CORPORATE INCOME TAX RATEAND IN ACCELERATED DEPRECIATION: SIMULATIONS WITHTHREE MACROECONOMIC MODELS
In last year's report on The Economic Outlook, CBO comparedthe effects of three business tax changes: increases in the invest-ment tax credit, accelerated depreciation, and reductions in thecorporate income tax rate. _!/ The analysis was based on simula-tions using three different macroeconomic models. The reportemphasized that there was not much consensus among the models overthe quantitative effects of particular changes in business taxes.Nevertheless, the simulations indicated that, as a method ofstimulating business fixed investment, the investment tax creditand accelerated depreciation methods were more effective per dollarof direct tax reduction than reductions in the corporate income taxrate. 2/
CBO recently updated this analysis for two of these threetypes of changes in business taxes: corporate rate reductions andaccelerated depreciation. Two types of simulations were performedusing three econometric models:
o Reduction in the maximum corporate income tax rate, lower-ing receipts by about $4 billion; and
o Increase in the asset depreciation range (ADR) for equip-ment by 20 percentage points, and introduction of a 20percent ADR for structures.
As discussed in last year's report, the revenue effects ofaccelerated depreciation tend to be small at first and to grow asan increasing proportion of the capital stock becomes eligible
I/ Congressional Budget Office, The Economic Outlook (February~ 1978), Appendix A, pp. 47-49.
2/ In the interim, the investment tax credit was liberalized and"~ made permanent, and there were corporate income tax rate
reductions, including a reduction in the maximum from 48percent to 46 percent. The capital gains tax was also reduced.
79

for the faster tax write-offs. For this particular change, thedirect budget cost was estimated to average about $3 billion forthe first three years.
The results of these simulation, which are summarized in TableB-l, are similar to those described in last year's annual report.Compared with the effects of lowering the corporate tax rate, theaccelerated depreciation allowances have a larger impact on invest-ment and real GNP during the simulation period. The effects ofboth types of reductions occur with considerable lags.
80

TABLE B-l. EFFECTS OF CHANGES IN BUSINESS TAXES: A COMPARISON OFRESULTS BASED ON THREE MACROECONOMIC MODELS
First Second ThirdEconomic Variable Year Year Year a/
Corporate Income Tax Rate Cut of $4 Billion
Change in Real GNP(billions of 1972 dollars) 0.2 to 1.1 1.3 to 2.3 1.5 to 2.5
Change in Real BusinessFixed Investment (billionsof 1972 dollars) 0.1 to 0.5 0.5 to 1.0 0.8 to 1.3
Percent Change in Price Level(GNP deflator) 0.0 -0.1 to 0.0 -0.1 to 0.1
Accelerated Depreciation of Plant and Equipment _b /
Change in Real GNP(billions of 1972 dollars) 0.3 to 1.0 1.7 to 3.2 2.7 to 5.0
Change in Real BusinessFixed Investment (billionsof 1972 dollars) 0.1 to 0.5 0.7 to 2.2 1.1 to 3.5
Percent Change in Price Level(GNP deflator) 0.0 -0.1 to 0.0 -0.2 to 0.1
a/ In some cases, these represent estimates based on incompletedata.
b/ Assumes a 20 percent increase in the asset depreciation range~~ in the tax life of plant and equipment. See text for discus-
sion of revenue loss.
81
o


