Embed Size (px)
Citation preview

Copyright © 2014 by Thomas Hellmann and Noam Wasserman.
Working papers are in draft form. This working paper is distributed for purposes of comment and discussion only. It may not be reproduced without permission of the copyright holder. Copies of working papers are available from the author.
The First Deal: The Division of Founder Equity in New Ventures Thomas Hellmann Noam Wasserman
Working Paper
14-085 December 2012 Management Science – Revise and Resubmit Revision due back to the journal by Sept. 2014
The First Deal:
The Division of Founder Equity in New Ventures
Management Science – Revise and Resubmit
Revision due back to journal by September 2014
Thomas Hellmann1
Sauder School of Business, University of British Columbia
Noam Wasserman2
Harvard Business School
December 20123
Abstract: The first real deal in an entrepreneurial venture typically consists of founders agreeing to a division of founder equity. We use hand-collected survey data on the process by which founders reach an agreement, as well as their decisions on how to split the equity. We consider the relationship between founder agreements and venture performance, as measured by employment growth and the receipt of venture capital. Teams that settle the equity division at the outset, teams that negotiate the agreement quickly, and teams that divide the equity equally, all experience lower performance. Teams that combine these three practices have the lowest performance. The results suggest that the division of founder equity, and the process by which the founders reach the agreement, provide a first signal about the likely future path of the entrepreneurial venture.
1 2053 Main Mall, Vancouver, BC, Canada V6T 1Z2, [email protected]
2 Rock Center 219, Boston, MA 02163, USA, [email protected]
3 We would like to thank David Hsu, Bill Kerr, Josh Lerner, Jason Snyder and seminar participants at Arizona State University (W.P. Carey), Harvard University (HBS), Massachusetts Institute of Technology (Sloan), National Bureau of Economic Research, New York University (Stern), Stanford University, University of Arizona (Eller), University of British Columbia (Sauder), University of California Los Angeles (Anderson), University of Cape Town (GSB), University of Illinois at Urbana‐Champaign, and the University of Toronto (Rotman) for their helpful comments. We thank Xiang Ao, Andrew Hobbs, Bill Holodnak, Aaron Lapat, Furqan Nazeeri, and Mike DiPierro for their valuable research support. Financial support from the Harvard Business School and SSHRC is gratefully acknowledged. Author names are in alphabetic order; both authors contributed equally to this paper. Updated versions are available at http://strategy.sauder.ubc.ca/hellmann/. All errors are ours.
[2]
Section1:Introduction
Events in the early formative stages can have a long-lasting impact. Similar to Konrad Lorenz’s concept
of imprinting in the animal world, companies are shaped by choices made around the time of founding
(e.g., Baron, Hannan, & Burton, 2001; Boeker, 1989). Initially the main assets of a startup are its
founders, so some of the important early choices concern the agreements amongst founders. This doesn’t
matter for companies started by a single entrepreneur, but a large fraction of startups are founded by
teams. Typically the “first deal” that a team of founders has to negotiate is how to allocate ownership
within the team – i.e., the division of founder equity.
Field research suggests that teams differ regarding at least three important dimensions when splitting the
equity: the timing of the equity split (early vs. late in the evolution of the startup), the amount of time
spent negotiating the split, and the degree of equaling vs. inequality in the founders’ equity stakes. For
instance, at Smartix, Inc., which created a smart-ticketing system for sports venues, the four-founder team
believed that “it’s best to delay [the equity split] because things are still unknown and changing”
(Wasserman, 2008:10). When they finally split the equity, they took a very deliberate approach, fearing
the effects that might emerge if any founder felt that the equity-split process was unfair. In their dialogue,
the team delved into each founder’s past contributions, opportunity costs, preferences, and anticipated
future contributions. They decided to split the equity unequally, with stakes ranging from 17% to 35%.
The founders of Zipcar adopted a very different model for splitting the equity. Cofounder Robin Chase
had heard a horror story from a friend about how the equity-split negotiation had derailed the friend’s
startup. Eager to avoid that outcome, Robin proposed to her cofounder a 50/50 split right after they had
founded the company (Hart, Roberts, & Stevens, 2003). The cofounders quickly shook hands and
accepted the equal split. Robin breathed a sigh of relief that they had avoided the high tensions that often
accompany an equity-split negotiation. Only later did she realize that the rushed negotiation had
compromised the team’s longer-term effectiveness.
Beyond field research there is surprisingly little systematic evidence about the structure of founder
agreements, let alone the process by which founding teams reach such agreements. In this paper we set
out to answer two fundamental questions. First we ask: What factors determine the processes and
outcomes of founder negotiations? Second: What is the relationship between founder agreements and
subsequent performance of entrepreneurial ventures?

[3]
To address these research questions we first develop hypotheses that draw on a variety of economics,
sociology and management literatures. While economic interests and social norms are likely to affect
founder negotiation, we emphasize that there are no clear formulae that founders can rely on. For
example, the timing of the equity decision involves a trade-off between commitment and flexibility.
Speedy negotiations could be viewed as a sign of efficient team decisions, but they could also hide
conflict avoidance within the team. One should expect a wide range of negotiation processes and
outcomes across different founding teams. We argue that team size, prior founder experiences, and the
heterogeneity within the team are all likely to affect this process.
We are particularly interested in the relationship between founder agreements and subsequent venture
performance. Neither our theoretical hypotheses nor the ensuing empirical analysis relies on a causal
logic where the choice of founder agreements produces different performance outcomes. Instead we
explain how unobserved heterogeneity across founding teams can first lead to certain decisions about the
division of founder equity (e.g., teams with conflict avoidance are more likely to agree to an equal split),
and then also lead to certain performance outcomes (e.g., teams with conflict avoidance are less likely to
perform well).
Data on founding teams are hard to find. We leverage an annual survey of startups that collects data from
North American technology and life-sciences startups. It includes targeted questions about the founders’
equity-split decision, as well as the process of how that decision was reached. The following statistics
reveal some stark patterns: 35% of all teams split the equity equally among all founders; 67% of all teams
make that decision at the outset of the venture, and 42% of all teams decide on their equity split within a
day or less. The raw data hints at interesting variation, where some teams deliberate more carefully over
the decision about how to split founder equity (similar to Smartix), whereas others seem to rush the
decision and settle on the easiest short-term solution, simply dividing the equity equally among all
founders (similar to Zipcar).
Our empirical analysis first considers the determinants of equal splitting, as well the timing and duration
of these negotiations. Among other things we find that equal splitting is associated with smaller and less
heterogeneous teams. Interestingly we find few significant determinants for the timing and duration of the
founder negotiations, suggesting that these decisions are largely driven by unobservable team
characteristics.
More centrally, we consider the linkages between the equity split and two measures of performance:
growth in terms of the number of employees and external validation in terms of obtaining venture capital
funding. We find that equal splitting is associated with lower performance. The effect is more pronounced
[4]
when the equal split emerges from early and/or quick negotiations. The results suggest that founder
agreements provide an early signal of the likely challenges that a startup might face down the road.
A prior literature examines the role of founder experience on the evolution of founding teams (Beckman
& Burton, 2008; Beckman, Burton, & O'Reilly, 2007; Wasserman & Marx, 2008) and on firm
performance (Delmar & Shane, 2006; Shane & Stuart, 2002). The work closest to ours is probably the
analysis by Ruef and colleagues of team formation in small businesses. First, Ruef, Carter and Aldrich
(2003) focus on homophily as the main explanatory variable. The subsequent book by Ruef (2010) further
deepens this line of research, adding insights about determinants of team formation and production, and
providing descriptive data on the equity arrangements within those small businesses. However, this work
does not focus on the role of founder agreements and the associated performance implications.
The recent finance literature recognizes the importance of going back to the very beginnings of the firm
(Kaplan & Stromberg, 2004; Lemmon, Roberts, & Zender, 2010). Furthermore, the work of Robb and
Robinson (2009) identifies insiders (i.e., founders) as an important part of the capital structure of
entrepreneurial firms. Our research also shares some similarities with the literature on joint ventures.
Hauswald and Hege (2006) examine ownership and control rights for joint ventures between established
firms, and find a high incidence of equal share divisions. For related work on joint ventures, see also
Robinson and Stuart (2007), Dyer et al. (2008), and Gulati and Wang (2003). Closer to our work, Åstebro
and Serrano (2011) examine the benefits of starting a company in partnerships rather than as a solo
venture. Furthermore, Tamvada and Shrivastava (2011) examine the relationship between team size and
team performance.
A small economics literature discusses the rationales for equal compensation among unequal agents
(Bose, Pal, & Sappington, 2010; Encinosa, Gaynor, & Rebitzer, 2007). Moreover, our paper touches upon
issues of fairness (see Fehr & Schmidt (1999)) and inequality aversion (Dawes, Fowler, Johnson,
McElreath, & Smirnov, 2007). The problem of dividing shares is closely related to the “division of a pie”
problem that has been studied extensively in game-theoretic literature (e.g., Binmore, Rubinstein, &
Wolinsky, 1986; Rubinstein, 1982). Interestingly, some of the recent game-theoretic literature examines
why identical parties may still not always agree on an equal division (Ashlagiy, Karagözoglu, & Klaus,
2008), whereas we are concerned with the question of why non-identical founders agree on an equal
division.
Section 2 discusses theoretical foundations and derives hypotheses that will guide our empirical analysis.
Section 3 describes the data. Section 4 discusses the empirical results. Section 5 discusses the main results
and offers some concluding thoughts on future research.

[5]
Section2:TheoryandHypotheses
2.1:TheoreticalFoundations
The negotiation of a founder agreement can be a highly sensitive process, with its outcome affecting
several dimensions of the startup. What is the significance of a founder agreement? First, a founder
agreement formalizes team membership, clarifying who is in and who is out. Second, the agreement
determines the ownership structure. The typical agreement allocates common shares to founders, so that
the relative number of shares determines relative ownership stakes. Third, the most common arrangement
is that each common share has one vote, so that the allocation of shares also determines the allocation of
formal control rights. Fourth, implicit in the allocation of ownership and control rights is an evaluation of
the relative expected contributions of the founders.
What determines the structure of founder agreements? Bargaining theorists argue that the division of
economic rents is driven by the relative outside options of the parties (Binmore, 1987). Economic theory
emphasizes the importance of incentives and the moral hazard problem in teams (Franco, Mitchell, &
Vereshchagina, 2011; Holmstrom, 1982). More shares should be awarded to those team members whose
productivity responds more to incentives – what we will call “incentive effectiveness.”
Sociologists emphasize the importance of group norms and social relationships over economic
considerations. Ruef (2010:130) summarizes this perspective: “In conventional models of self-interested
behavior, lead entrepreneurs who come up with the idea for a business reserve large ownership shares
for themselves and offer only scraps to other co-owners or institutional investors.” In his sample of 874
small businesses based on the PSED II dataset, he finds that in 2-person teams, 92%-93% of teams split
the equity equally, “a far more egalitarian model than that theorized for homo economicus.” He finds that
even in his 4-person teams, 87%-90% of teams split equally.
While each of these factors provides guidance as to what may matter for the division of shares, there are
no clear economic formulae or social norms for how to weigh the dimensions in which founders differ
from each other. Founder negotiations occur at a time when there is extreme uncertainty; in the early life
of a startup, technology, products and markets are often ill-defined. As a result, founders have a highly
incomplete understanding of the skills and tasks that the venture will need. In addition, founders don’t
know each other’s true skills and commitment, nor their compatibility as a team. As a consequence, there
is considerable uncertainty, and ample room for disagreement about what the true differences among
founders will turn out to be. Self-serving biases can also affect the assessment of how different skills and
activities may impact the value of the venture.

[6]
One of the starkest choices faced by founding teams is between an equal division of shares (i.e., allocating
1/n shares to each of the n founders) versus some unequal division of shares. An equal division of shares
avoids any formalized hierarchy or implied relative rankings. It is an easy focal point that does not require
resolving potentially difficult points of disagreement. Founders may also have an intrinsic preference for
an equal distribution of rewards, or believe that reward equality helps promote team cohesion.
The downsides of an equal split, though initially less visible, are likely to manifest over time. Some
founders will turn out to be less productive than others, because their skills turn out to be less relevant to
the eventual strategy, because they don’t scale with the venture’s growth, or because they lose
commitment to the venture. In the worst case, some founders become entirely unproductive (and possibly
counterproductive) because of free-riding or incompetence.4 In such cases the equal division of equity
creates inefficient incentives and may lower team cohesion. What may have seemed “fair” at the outset
may later be viewed as “unfair.” Equal splitting could also create a lack of hierarchy, a leadership
vacuum, and possibly a voting deadlock.
The decision about whether to split the equity equally emerges from a negotiation process that involves
multiple trade-offs. We focus on two aspects of the process that lend themselves to cross-team
comparisons: the timing of negotiations and the time taken to get to an agreement.
Founding teams can choose the timing of negotiations, the earliest date being at the beginning of the joint
work and the latest date being when outsiders buy or receive ownership in the venture. Hellmann and
Thiele (2012) develop a formal economic theory concerning the trade-off between early and late
contracting. The main benefit of late contracting is resolution of uncertainty. As time develops, founders
learn about their relative skills and are thus better able to assess their relative contributions. Late
contracting may also allow founding teams to exclude incompetent or irresponsible partners.5
The main benefit of early contracting is that the founder agreement protects against opportunism.
Hellmann and Thiele focus on the most egregious opportunism, where some founders exclude others
purely on the basis of rent-extraction. One can think of this as idea stealing, or more generally as
opportunity stealing. They show that such opportunism creates inefficiencies under late contracting,
4 This is essentially what happened at Zipcar (Hart et al., 2003) and GovWorks.com, as documented in the documentary “Startup.com” (Hegedus & Noujaim, 2001).
5 Hellmann and Thiele also show that late contracting provides better incentives for specific investment. Once an individual receives his/her shares, there is a free‐rider problem of underinvesting in company‐specific skills, but as long as individuals have to prove themselves to be worthy of the team, they have stronger incentives to invest in company‐specific skills.
[7]
regardless of whether exclusion occurs in equilibrium or is merely used as a threat for obtaining a more
favorable deal. Early contracting therefore acts as a safeguard against such opportunism.
In addition to the rational factors developed in the Hellmann and Thiele (2012) model, behavioral factors
can also affect the trade-off between early and late contracting. Ambiguity-averse founders will have a
preference for early contracting. There may be related benefits for confirming team membership early,
especially if a founder is unsure about joining the team. In contrast, if founders are overconfident about
their relative value contribution, they might delay contracting. This is because they might worry about
being undervalued at present, and believe that over time they can prove themselves and get a better deal.
Separate from the timing of the founder negotiations (earlier versus later) is the time allocated to
negotiating the agreement. The negotiation process typically involves the exchange of information about
relevant skills and outside options, as well as a large amount of subjective opinions about the relative
importance of different skills and tasks. Such an exchange may well take some time, and there can be a
certain amount of brinksmanship that further adds to the time it takes to reach an agreement.
We distinguish between a “quick handshake” agreement in which the parties spend minimal time
negotiating, versus a slower negotiation process where the parties spend more time communicating before
reaching an agreement. The benefit of a slow negotiation process is that information and opinions are
allowed to surface. This may help build a joint understanding of the relative roles within the founding
teams. A quick handshake, on the other hand, may economize on brinksmanship, and may allow the team
to get back to the core task of building the venture. A slower negotiation process may also be emotionally
unsettling to some founders. Some founders may want to get it done quickly, especially if they do not
want to be viewed as overly greedy. A quick handshake agreement may thus be a symptom for a lack of
professional maturity or an indicator of a deeper problem of conflict avoidance.6
For founder agreements to matter there must be some irreversibility to them. In principle, relative
ownership stakes can change over time as founders receive additional shares or reallocate existing shares.
However, there are factors constraining these adjustments. The granting of new options is costly to the
venture, especially to outside investors. Share reallocation is typically hampered by the fact that founders
are not independently wealthy and therefore typically unable to fully buy-out their co-founders’ shares.7
Relative ownership changes typically require the legal consent of all parties. This is prone to hold-up
problems, especially in the midst of heightened tensions within the founding team (Wasserman, 2012).
6 Eisenhardt, Kahwajy and Bourgeois (1997) explain the importance of conflict within management teams.
7 Hellmann and Thiele (2012) provide an extensive discussion of this.
[8]
There may also be high stakes and self-serving biases about the relative values of contributions, further
complicating an amicable settlement.
2.2:DerivationofHypotheses
Given these foundations, we will now delve into our main hypotheses, which focus on the influences of
experience, heterogeneity, and team size, and on the effects of the equity split on venture performance.
Consider first the role of founder experience. More experience allows individuals to better anticipate the
consequences of early actions on subsequent outcomes. Experienced founders should also be better at
knowing what they don’t know, and therefore better appreciate the benefits of gathering information
before making decisions. More experienced teams should therefore have a preference for late over early
contracting. In addition, experienced founders should be more likely to appreciate the importance of
communicating with each other, and they may be less concerned about being perceived as too greedy.
They should therefore prefer slow over fast negotiations. Finally, experienced founding teams may be
more willing to address conflict upfront, leading to a greater likelihood of adopting an unequal division of
equity. Thus we state our first hypothesis.
Hypothesis 1: More experienced founding teams are less likely to negotiate early, less likely to negotiate
quickly, and less likely to agree on an equal split.
Hypothesis 1 is concerned with the average experience within the team, but there may also be
considerable heterogeneity within the team, in terms of experience and other dimensions. More
heterogeneous teams should benefit more from learning about their relative skills and fit. Hence more-
heterogeneous teams should have a preference for late contracting. The initial information and opinion
gaps are also likely to be larger in heterogeneous teams, making it more important to allow proper time
for negotiation. Finally, greater founder heterogeneity suggests that different founders are more likely to
have differential incentive effectiveness and different outside options, also leading to a greater likelihood
of ending up with an unequal split. We therefore state our next hypothesis about the role of team
heterogeneity as follows.
Hypothesis 2: More heterogeneous founding teams are less likely to negotiate early, less likely to
negotiate quickly, and less likely to agree on an equal split.
We expect that larger teams need more time to come to an agreement because there is more information
to communicate and because one individual holding out means that everyone else has to continue
negotiating. We expect larger teams to be less likely to agree to an equal split for a similar reason: It only
[9]
takes one person to object to an equal split, and the entire team has to work out an alternative deal that
involves unequal splitting. Larger teams are also more likely to have founders with significant differences
in their incentive effectiveness and outside options. Note, however, that the relationship between larger
teams and the timing of negotiations is more ambiguous. On the one hand, more founders means greater
ex-ante uncertainty about who is contributing what, suggesting more late negotiations. On the other hand,
in a larger team there is probably more skill overlap, so that no individual is essential. It might therefore
be easier to exclude any one individual in a larger team, suggesting a greater need for early negotiations.
We therefore state the following hypothesis about the role of team size.
Hypothesis 3: Larger founding teams are less likely to negotiate quickly, and less likely to agree on an
equal split.
Hypotheses 1 - 3 examine the determinants of three key aspects of founder negotiations. We now turn our
attention to the relationship between those founder negotiation variables and the overall performance of
the venture. We will focus on two main performance measures. First we consider the size of the firm as
measured by its number of employees. For instance, Haltiwanger (2012) demonstrates the link between
employment growth and productivity gains for startup companies. Second, obtaining venture capital is
widely considered as certification of quality and progress for entrepreneurial ventures. For a recent
example, Puri and Zarutskie (2011) provide detailed evidence that venture capital-backed companies
stand out from other entrepreneurial companies.
A fundamental challenge concerns the direction of causality. In principle there can be (i) direct causality
(founder negotiation variables affect performance), (ii) reverse causality (expectations about future
performance affect founder negotiation), and (iii) unobserved heterogeneity (unobserved fundamentals
affect both founder negotiation and performance). In the absence of instrumental variables, we remain
careful not to imply causality for our empirical results. In fact, the more fundamental point we want to
emphasize here is that our hypotheses do not even rely on causality. From a theory perspective, we see no
valid reason to exclude any of the three mechanism described above. If anything, the most natural
theoretical argument concerns unobserved heterogeneity, especially the notion that equal splits, early
contracting and quick contracting are merely symptoms of fundamentals that remain unobservable to the
empirical researcher. Our aim is therefore to establish robust predictions about the relationship between
founder agreements and venture performance. This is an important first step toward an analytical
understanding of the significance of the “first deal” in entrepreneurial ventures.
To examine the relationship between founder agreements and venture performance we note that the
benefits of early contracting accrue mainly to the individual founders, in terms of better protection from
[10]
opportunism or resolution of ambiguity. However, the benefits of late contracting pertain to building a
more productive team, especially in terms of retaining and rewarding more-productive team members. As
a consequence, we hypothesize that even if early contracting sometimes increases founders’ utilities, it
should be associated with lower venture performance. Thus we state the following hypothesis:
Hypothesis 4: Early contracting is associated with lower venture performance.
Following the logic to Hypothesis 4, we similarly note that quick contracting may suit founders’
(perceived) short-term wants, but it should be negatively related to venture performance. This is because
quick contracting may stem from conflict avoidance, which does not bode well for the future of the team.
At the same time, conflict avoidance may also result in poor negotiation outcomes with suppliers and
buyers, ultimately hampering the success of the venture. A quickly negotiated deal is also less likely to be
well structured, further impeding venture performance. We submit the following hypothesis.
Hypothesis 5: Quick contracting is associated with lower venture performance.
There are several aspects that affect the relationship between equal splitting and venture performance.
Similar to Hypotheses 4 and 5, equal splitting can be a symptom of unobservable fundamentals, such as
conflict avoidance or insufficient negotiation skills. Founders who are confident are also less likely to
agree to an equal split. Observing an equal split may indicate a lack of founder confidence, which may be
associated with less entrepreneurial persistence and lower venture performance. Equal splitting can also
hamper venture performance because of inefficient incentives, where more and less productive team
member are compensated in the same manner. There may also be some reverse causality, where founders
may be less agreeable to settling for an equal split if they expect the venture to perform well. We
therefore submit the following hypothesis.
Hypothesis 6: Equal splitting is associated with lower venture performance.
Hypothesis 6 focuses on the many arguments that suggest a negative relationship between equal splitting
and performance. There are also some arguments that may suggest a positive relationship. Teams may
believe that equal splitting will boost team cohesion. Also, a lack of hierarchy may suit early stage
startups where strong leadership can hinder creativity and experimentation. Thus, we now set out to
examine the circumstances under which the negative or positive aspects may matter more.
Equal splits can mean different things depending on the timing of the split and the amount of
communication that led to the split. If an equal split was agreed upon in an early contract, it should be
more likely to be associated with poor venture performance. This is because in the early stages, founders
[11]
still face considerable uncertainty about their respective strengths, so there is a high likelihood that equal
splitting provides inefficient incentives. By contrast, an equal split in a late-contracting environment is
more likely to reflect true team symmetry. Along similar lines, an equal split that emerges from a quick
negotiation strongly suggests that there is a problem of conflict avoidance. By contrast, an equal split that
emerges from slower negotiation may be indicative of a more deliberate decision by the founders to
reward everyone equally.
Hypothesis 7: Equal splitting is more strongly associated with lower performance if it emerges from early
negotiation or from quick negotiation.
Section3:Dataandvariables
3.1:DataSources
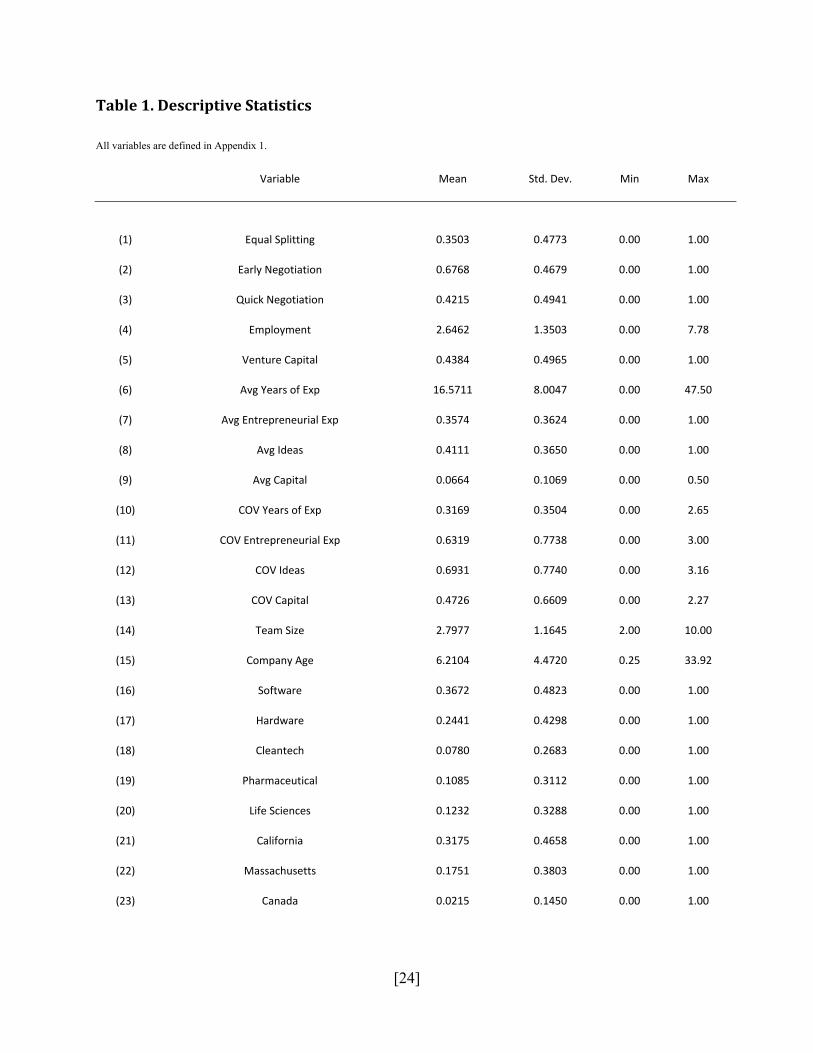
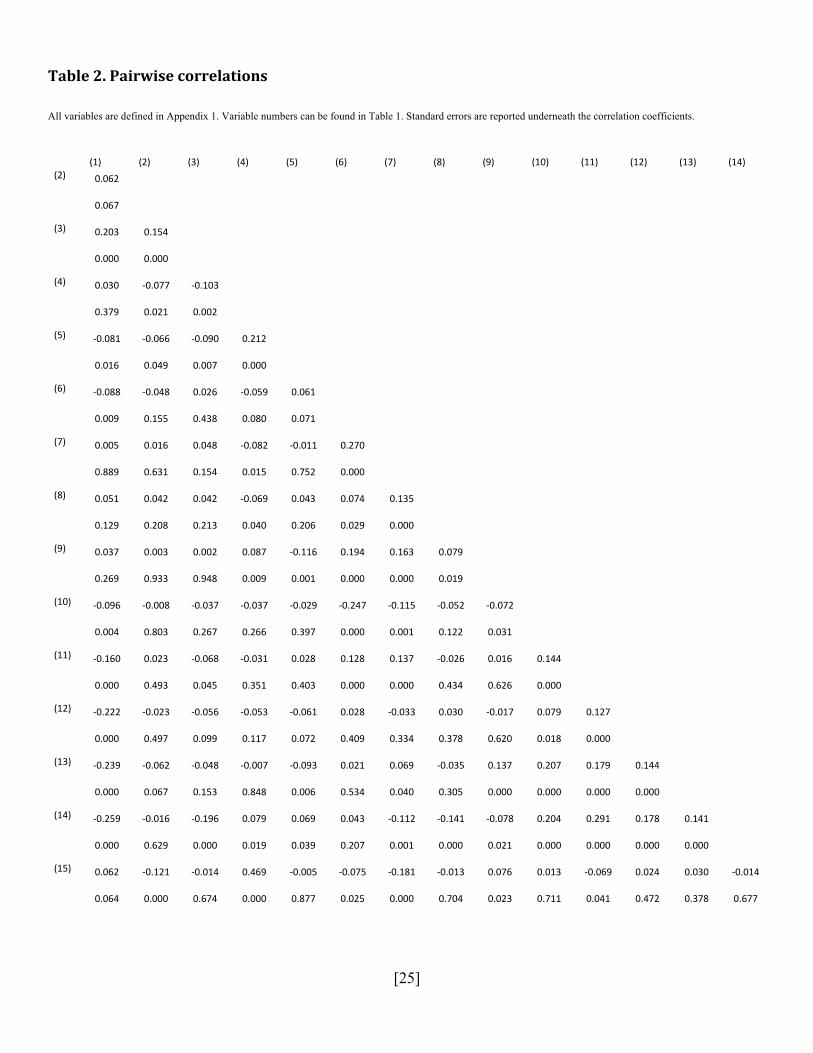
Appendix 1 summarizes our empirical variables, their definitions, and their associated survey questions.
Table 1 shows the descriptive statistics. Table 2 reports the pair-wise correlations between the main
variables of interest.
The data come from the annual CompStudy survey of private North American ventures, for which one
author is the lead investigator (see Wasserman, 2003, 2006; 2012 for more details). The first CompStudy
survey was conducted in 2000 with 211 private information-technology ventures (broadly defined,
including telecommunications). Two years later a parallel survey of life-sciences ventures was added, and
since then, annual surveys of both industries have been conducted.8 The list of target companies is
generated by combining the list of private companies included in the VentureXpert database with the
membership lists of local technology associations (e.g., the Massachusetts High-Technology Council).
Invitations are sent to the CEOs and CFOs of those companies.9 To encourage participation in the survey,
participants are offered a free copy of a detailed “CompStudy Compensation Report” that is based on the
survey results and made available only to participants. The report includes position-by-position
breakdowns of salaries, bonuses, and equity holdings for the eleven most common C-level and VP-level
positions in private ventures. The breakdowns provide compensation benchmarks by industry segment,
geographic location, company size and age, financing rounds, founder versus non-founder status, and
other metrics collected in the survey. Over the last decade, CompStudy’s annual compensation reports
8 Details are reported in the appendix of Wasserman (2012).
9 The CEOs and CFOs of the ventures were targeted due to the sensitivity of the questions and the breadth of corporate knowledge required to completing the survey.
[12]
have become a standard reference within the top management teams of private American ventures, and
for the board members and investors who are involved with those ventures.
The dataset used in this paper combines the Technology and Life Sciences surveys from 2008-2011,
while controlling for the industry of each participant. A major benefit of conducting annual surveys, and
of collecting one’s own data, is that each year the researcher can add new questions to tackle emerging
research questions that aren’t addressed by existing datasets (e.g., about the equity-split negotiation
process) or are highly confidential (e.g., about the percentage of equity received by each founder). For the
2008 CompStudy survey, we added detailed questions about each founding team, its prior work
experience, and the equity split within the team. These questions were repeated in the 2009, 2010 and
2011 surveys. For repeat respondent we only use the most recent responses.10
Each year, survey response rates vary between 10%-20%, higher than the typical response rates for
surveys of similar companies and targeting similar levels of executives (e.g., Graham & Harvey, 2001).
The surveys are conducted online so that fields can be validated as they are being entered. When possible,
data are cross-checked with publicly-available information sources to validate the accuracy of the
submissions. Each year, the survey data are checked for representativeness against the VentureXpert
population. Regarding geographic distributions and industry segments, the dataset is a representative
sample of private high-potential ventures in the technology and life sciences industries within the United
States. Regarding age of venture, the dataset contains slightly younger companies given that
VentureXpert only includes ventures that have raised institutional capital while our dataset also includes
pre-funding ventures (9% of our sample).
Our initial sample consists of 4715 respondent companies; 2826 of those respondents provide information
about founders. Of those, 1664 provide incomplete information and therefore have to be dropped for the
regression analysis. Of the remaining 1162 companies with complete information, 277 have a single
founder, and 885 have founding teams.
We may ask whether any biases are introduced by dropping companies with incomplete information. We
consider company age at the time of the survey. The average age is 8.48 year for the companies without
founder information, 8.16 years for those with incomplete information and 6.51 for those with complete
information. This suggests that, if anything, response biases force us to look at a sample of younger
companies. Such companies are more likely to be representative of the true startup population, and less
10 This gives us the most complete outcome data possible. We also compared the most recent submissions to the earliest ones to double‐check the accuracy of the submissions.
[13]
likely to suffer from recollection biases. We also compare team sizes across samples. The average team
size of companies with incomplete information is 2.39, compared to 2.37 for companies with complete
information. The difference between the two averages is statistically insignificant. This suggests that
response biases are unlikely to affect the observed team composition.
Our hypotheses focus specifically on founding teams, so our analysis naturally focuses on the 885
companies with founding teams. However, it is interesting to compare the sample of solo founders with
the sample of founding teams. Using t-tests for the difference of means we find no significant differences
in the industries or locations of solo-founder companies. These companies also have no significant
differences in employment. They are somewhat less likely to obtain venture capital (38.3% for solo
founders versus 43.8% for founding teams, P-value = 0.102). The biggest differences concern prior
experiences. Relative to the average founder in a team, solo founders have more years of experience (17.7
year for solo founders versus 16.6 years for founding teams, P-value = 0.053), and they are more likely to
be serial entrepreneurs (50.2% for solo founders versus 35.7% for founding teams, P-value = 0.000).
Our survey data seems consistent with comparable studies about startups. For example, Hsu et al. (2007)
gathered data on MIT startups and reported an average of 2.86 founders per team. We find 2.80 founders
per team. At first glance it appears that our percentage of serial entrepreneurs is relatively high at 36%;
Gompers et al. (2010) reported that approximately 10% of their entrepreneurs were serial entrepreneurs.
However, their sample consists of venture capital-backed companies, and their definition of serial
entrepreneur only counts experiences with previously venture capital-backed companies. Hsu et al. (2007)
report that 46% of their entrepreneurial teams had no prior startup experience. In our sample 40% of all
teams have no founder with startup experience.
The design of our survey allows us to capture companies at a very early stage. We cannot fully exclude
the presence of some survivor bias, but the data should be less susceptible to such bias than samples of
public companies, or even than samples of venture capital-backed companies. Note also that our analysis
starts at a point in time where teams have been formed, so that we cannot analyze the process of how
teams are formed. Clearly the team-formation process is not random, and deserves its own research focus.
However, our research question does not call for random assignment of founders to teams. That is, we are
not interested in how random teams would negotiate hypothetical founder agreements, we are interested
in how actual teams negotiate real agreements.
[14]
3.2:EmpiricalVariables
We use five dependent variables: one that measures equal splitting in the founder agreement, two that
measure the process by which the agreement was reached, and two that measure the performance of the
venture.
For founder agreements, we measure whether founding teams split the equity equally or unequally. Our
raw data include for each co-founder the specific percentage of equity received. We use a binary variable
called “equals” that takes the value 1 when there are no differences in the equity stakes of the founders, 0
otherwise. 35% of all ventures chose an equal split.
For the timing of founder negotiations, we make use of two dates that are reported in the survey: the
founding date and the agreement date (i.e., the month in which the founders report to have reached an
agreement on the division of founder equity). Our analysis uses a dummy variable called “early” that
takes the value 1 if the agreement date is at (or before) the founding date, 0 otherwise. 68% of all ventures
negotiated early.
For the duration of founder negotiations, the survey asks about the amount of time over which the
founders negotiated the equity split, categorized by: 1 day or less, 2 days to 2 weeks, 2 weeks to 2
months, 2 months to 6 months, and More than 6 months. Our analysis uses a dummy variable called
“quick” that takes the value 1 if the negotiations were concluded in 1 day or less, 0 otherwise. 42% of all
ventures negotiated quickly.
To measure venture performance we make use of two simple survey-based outcomes measures. Our first
measure pertains to the venture’s internal growth, focusing on employment. We measure the number of
full-time-equivalent employees (excluding founders) at the time of the survey. The median number of
employees is 14. Since this metric is log-normally distributed but we do not want to lose those companies
that have no employees, our main employment measure is the natural logarithm of 1+number of
employees.11
Our second performance measure focuses on signs of external validation. Our survey provides
information on the sources of funding from founding through the time of the survey. Our analysis uses a
dummy variable called “Venture Capital” that takes the value 1 if the venture had obtained some venture
capital at the time of the survey, 0 otherwise. 44% of all ventures received some venture capital.
11 As a robustness check we also reran our analysis using the natural logarithm of number of employees. We lose 65 observations but all the results remain qualitatively the same. We also estimated Poisson models for the number of employees itself, and found again that it made no difference to our results.
[15]
Several of our independent variables are constructed from data captured at the individual founder level.
Our 885 ventures comprise a total of 2476 founders (an average of 2.8 founders per venture). To
aggregate founder variables to the venture level, we calculate two measures, consistent with
organizational-demography studies that focus on both the average characteristics of a team as well as the
differences across team members (Beckman et al., 2007). First, to consider average team characteristics,
we calculate the average of the founder-level variables within the teams. Second, to measure team
heterogeneity, we calculate the coefficient of variation of the founder variables within their ventures.
The prior experiences of founders are likely to affect founder agreements. (Beckman, 2006) argues that
founders’ early decisions, such as whether to adopt exploratory processes or exploitative processes, are
shaped by their past work experiences. Regarding relevant outcomes, greater heterogeneity regarding the
founders’ prior work experience is associated with a greater likelihood of raising venture capital
(Beckman et al., 2007). Our individual-founder variables include two measures of human capital: the
founder’s years of work experience prior to founding the current venture, and whether the founder had
prior founding experience (“serial entrepreneur”).
A third individual-founder variable captures whether a founder generated ideas on which the venture was
founded (“idea person”).12 There are several reasons why generating ideas commands a premium stake.
For instance, idea generation matters whenever teams want to reward founders for any prior contributions.
Prior idea creation may also be a sign of creativity. The founders who came up with the original idea
might be expected to also generate more future ideas.13
The fourth variable at the individual founder level captures the founders’ financial contributions. For each
founder, the survey asks whether the amount of capital contributed falls into one of five categories: $0k,
$1k-$25k, $26k-$100k, $101k-$500k, and More than $500k.14 Ceteris paribus, we would expect founders
who contribute more capital to also receive larger equity stakes.
All remaining independent variables occur at the venture level. We always control for the size of the
founding team. We also include controls for industry, geography and agreement date. Industry dummies
12 The information‐technology survey asked about idea generation in general. The life‐sciences survey asked about intellectual property, reflecting the importance of intellectual property in those industries.
13 Wasserman (2012) provides a more detailed discussion of the role of idea founders.
14 There is no perfect way of converting this ordinal measure into a numerical measure of capital. To be pragmatic, we use the midpoints when available, otherwise the lowest point, resulting in the following categories (in $ million): 0, 0.012, 0.063, 0.3 and 0.5. We tried several variations, such as varying the amount for the top‐coded category, or using natural logarithms, and found that the results were very similar across all these permutations.

[16]
allocate each venture to one of the following industry categories: software, hardware, cleantech,
pharmaceuticals, life sciences (excl. pharma) and other. The venture’s location was categorized as
follows: California, Massachusetts, Rest of US, and Canada. Finally, we include year dummies based on
the founding date, and year dummies based on the agreement date.
One fundamental issue is who gets counted as a founder. For our main analysis we use the self-reported
data. As a robustness check we also examined whether our main results could be affected by some
unusual founding-team definitions. There are two types of gray areas in the data. First, some “founders”
joined a long time after the founding date, making them look more like non-founding executives. Second,
some founders received very low equity stakes, making them look more like employees. As a robustness
check we removed from the sample all teams that had (i) any reported founders who joined more than two
years after the first founder, or (ii) any reported founders with an equity stake that was less than one tenth
of an equal stake. We found that omitting those ventures did not change the main insights of the analysis.
Section4:EmpiricalResults
4.1.DeterminantsofFounderAgreements
The first step in the empirical analysis is to investigate determinants of founder agreements, both in terms
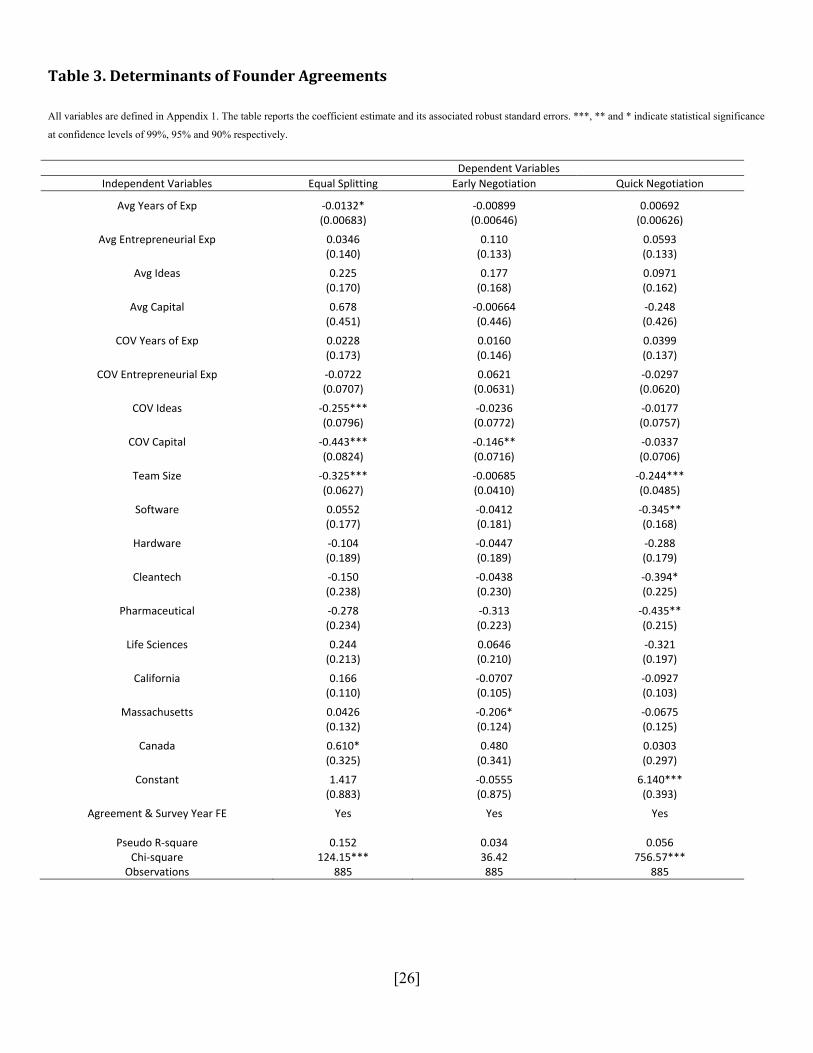
of process and outcomes. Table 3 reports the results from three Probit regressions where the dependent
variables are equal splitting, early negotiation, and quick negotiation. The independent variables closely
follow Hypotheses 1 – 3. For Hypothesis 1 we control for average founder experience, looking both at
general experience and entrepreneurial experience. For Hypothesis 2 we consider team heterogeneity,
measured not only in terms of the two experience variables, but also in terms of founders contributing to
the founding idea and in terms of their financial investments in the venture. For Hypothesis 3 we look at
team size. All regressions also include fixed effects for industry, geography, agreement year, and survey
year.
The first column of Table 3 examines the determinants of equal splitting. Consistent with Hypothesis 1,
we find that more-experienced teams are less likely to split the equity equally. On average, ten more years
of experience reduced the likelihood of an equal split by 4.1%. However, the coefficient for average
serial-entrepreneur experience remains insignificant. Consistent with Hypothesis 2, we find that greater
team heterogeneity reduces the likelihood of an equal split. The effect is statistically significant for
heterogeneous contributions of ideas and capital, but not for heterogeneous founder experiences.
Consistent with Hypothesis 3 we find that larger teams are much less likely to agree to an equal split. This
[17]
effect is strongly significant at the 1% level, and economically large: on average the addition of one team
member reduces the probability of equal splitting by 10.2%.
When we look at the timing of negotiations, we do not find strong support for this part of Hypothesis 1.
Neither years of experience nor prior entrepreneurial experience are statistically significant. Hypothesis 2
is also not strongly supported here, except that heterogeneity in capital contributions is statistically
significant. The coefficient for team size is insignificant, consistent with our theoretical discussion of
Hypothesis 3.
For the speed of negotiation, we also do not find much support for Hypotheses 1 and 2. However,
Hypothesis 3 is clearly supported by this data, since the coefficient of team size is negative and highly
significant. The addition of one team member on average reduces the probability of quick negotiation by
9.0%.
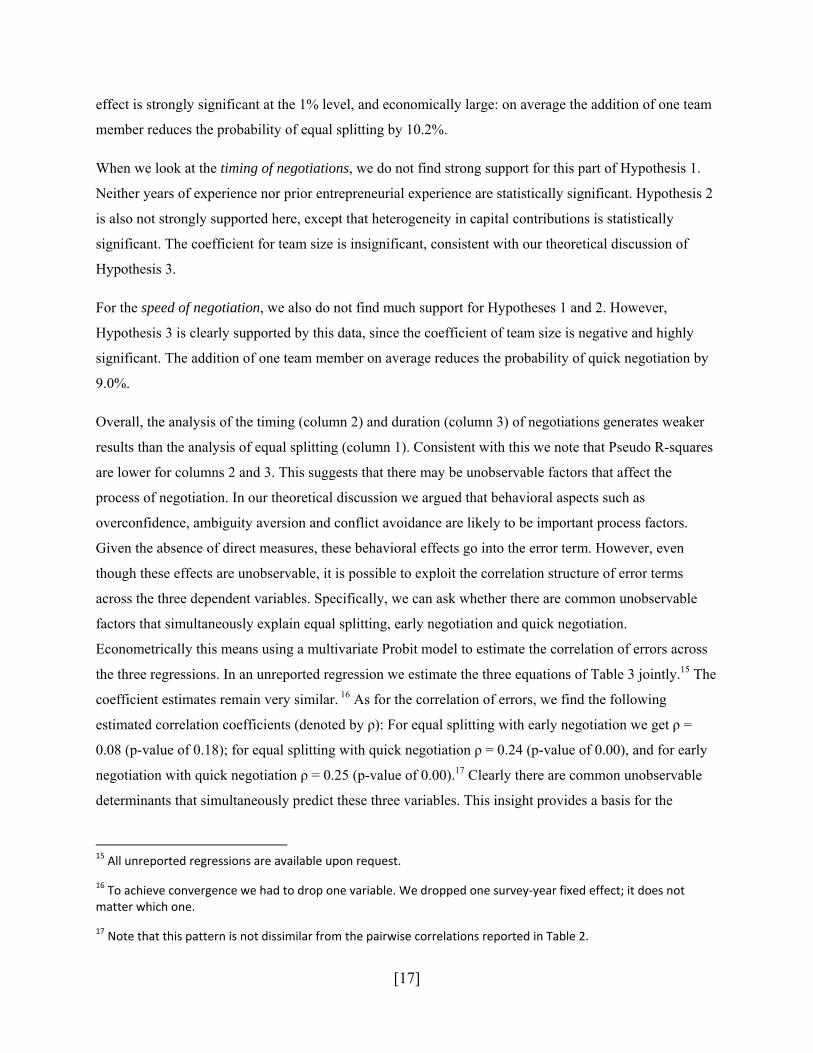
Overall, the analysis of the timing (column 2) and duration (column 3) of negotiations generates weaker
results than the analysis of equal splitting (column 1). Consistent with this we note that Pseudo R-squares
are lower for columns 2 and 3. This suggests that there may be unobservable factors that affect the
process of negotiation. In our theoretical discussion we argued that behavioral aspects such as
overconfidence, ambiguity aversion and conflict avoidance are likely to be important process factors.
Given the absence of direct measures, these behavioral effects go into the error term. However, even
though these effects are unobservable, it is possible to exploit the correlation structure of error terms
across the three dependent variables. Specifically, we can ask whether there are common unobservable
factors that simultaneously explain equal splitting, early negotiation and quick negotiation.
Econometrically this means using a multivariate Probit model to estimate the correlation of errors across
the three regressions. In an unreported regression we estimate the three equations of Table 3 jointly.15 The
coefficient estimates remain very similar. 16 As for the correlation of errors, we find the following
estimated correlation coefficients (denoted by ρ): For equal splitting with early negotiation we get ρ =
0.08 (p-value of 0.18); for equal splitting with quick negotiation ρ = 0.24 (p-value of 0.00), and for early
negotiation with quick negotiation ρ = 0.25 (p-value of 0.00).17 Clearly there are common unobservable
determinants that simultaneously predict these three variables. This insight provides a basis for the
15 All unreported regressions are available upon request.
16 To achieve convergence we had to drop one variable. We dropped one survey‐year fixed effect; it does not matter which one.
17 Note that this pattern is not dissimilar from the pairwise correlations reported in Table 2.

[18]
analysis of section 4.3, where we examine interaction effects between equal splitting and the negotiation
process.
4.2.FounderAgreementsandVenturePerformance
We now examine the relationship between founder agreements and venture performance. We consider
two standard performance measures, namely employment as a gauge for internal growth, and venture
capital as a sign of external validation. As controls we use the same variables as in Table 3, but we add
controls for the age of the venture at the time of the survey, which is when our performance measures are
measured. To account for possible non-linearity we include both linear and quadratic age terms.
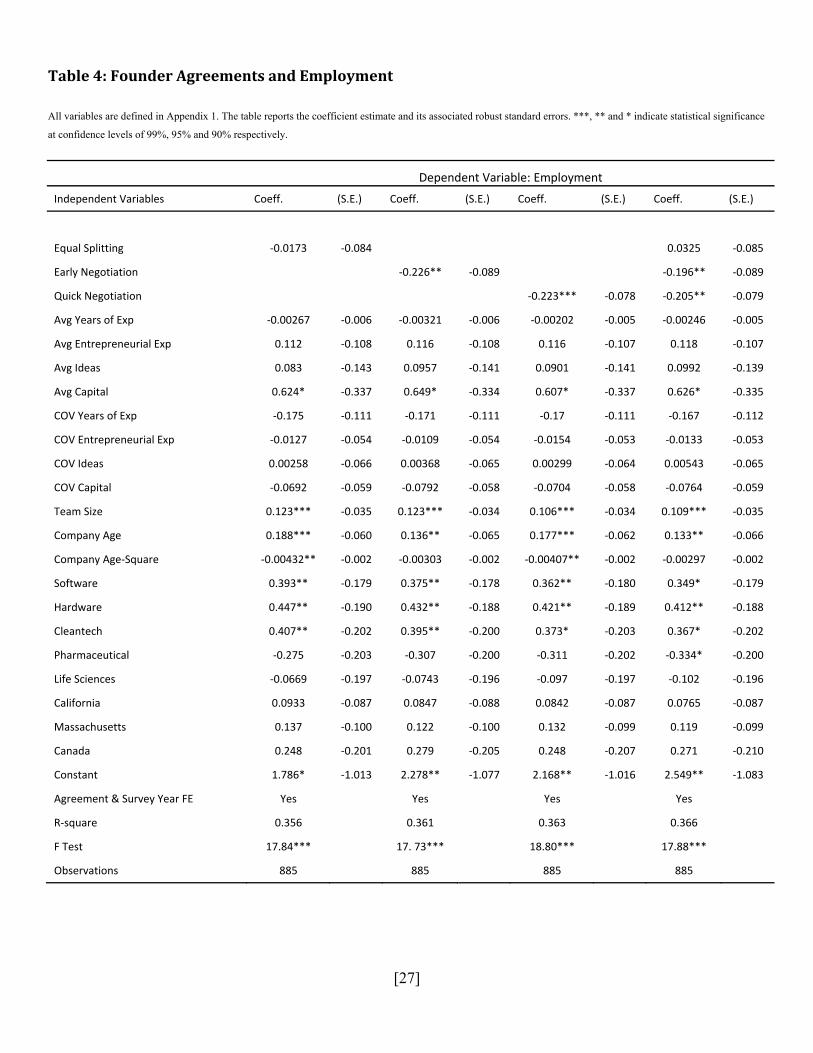
Table 4 reports the results from linear regressions with employment as the dependent variable. The main
variables of interest are the founder negotiation variables. We find that the coefficient for equal splitting
is negative but statistically insignificant. The coefficients for early negotiation and quick negotiation are
negative and significant. The effect is large: evaluated at the mean level of employment, ventures in
which the founders negotiate early have 21.8% fewer employees; ventures in which the founders
negotiate quickly have 21.5% fewer employees. Column 4 confirms that jointly including all three
founder negotiation variables does not change the results.18
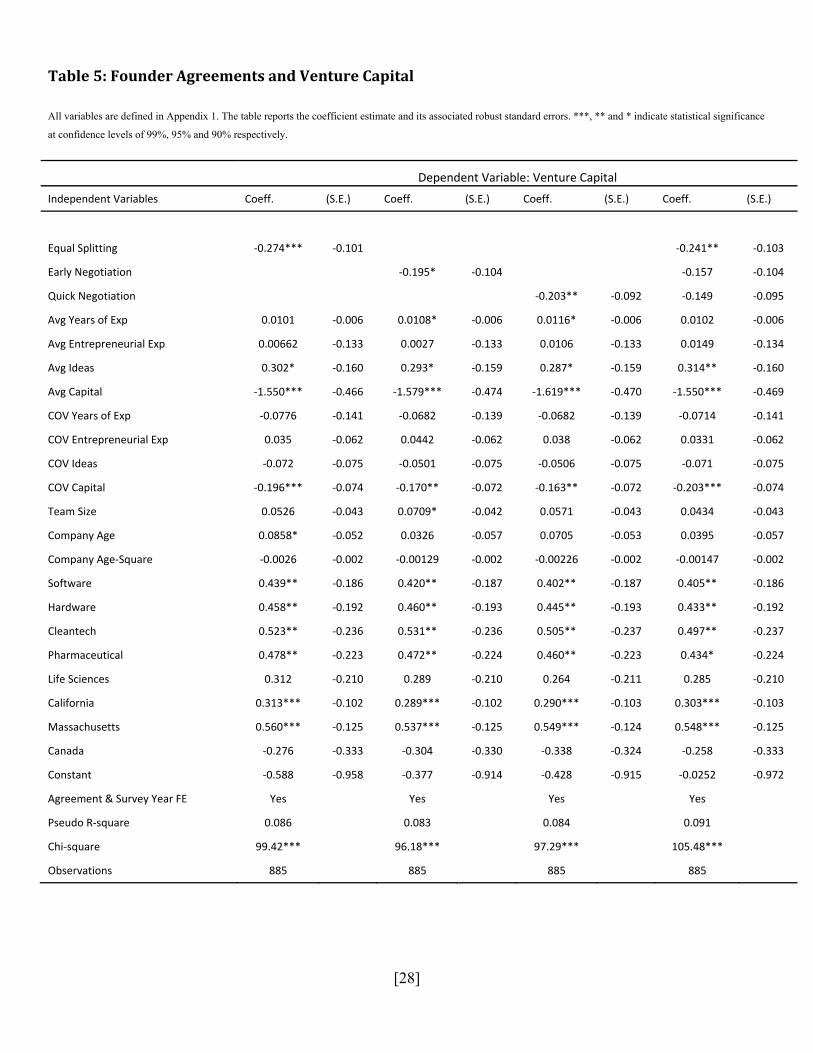
Table 5 reports the results from Probit regressions with venture capital as the dependent variables. We
find that the coefficients for equal splitting, early negotiation and quick negotiation are all negative and
significant. The effects are again not small: on average, teams who adopt an equal split are 9.8% less
likely to obtain venture capital. Compared to a baseline probability of 43.9%, this implies a 22.3% lower
probability of obtaining venture capital. Teams that negotiate early have a 7.0% lower chance of
obtaining venture capital, and teams that negotiate quickly have a 7.3% lower chance. Column 4 includes
all three founder negotiation variables. The point coefficients have the same sign but are slightly lower.
While the equal splitting variable retains statistical significance, the early negotiation and quick
negotiation variables become marginally insignificant (with P-values of 13.4% and 11.4%).19
18 For the control variables we note that larger teams also generate more employment; the same holds for teams where founders contribute more capital. We also find that employment is increasing with age, but that the square term of age is negative.
19 The effects of the control variables in Table 5 are slightly different than in Table 4. Not surprisingly we find that more founder capital actually reduces the chances of seeking outside funding from venture capitalists. Teams with more idea founders are more likely to raise venture capital. The age effects and team‐size effect have the expected sign, but are only borderline significant at best. As expected, there are also strong geographic effects: ventures in California and Massachusetts are much more likely to obtain venture capital.
[19]
Overall the results of Table 4 and 5 support Hypotheses 4 – 6. There is a negative correlation between our
three founder-negotiation variables and venture performance. The results are statistically significant in 5
out of 6 specifications, and the magnitudes are not small. We stress that Hypotheses 4 – 6 do not rely on a
causal effect. Our dataset does not contain any natural experiments or instrumental variables. As a
consequence we emphasize that our results should not be given a causal interpretation.
In Tables 4 and 5 we measure the three aspects of founder negotiation using binary variables. However,
our data also allow us to make more fine-grained distinctions: at what point negotiations are held, how
long they take, and how much inequality there is between founder shares. We ask whether there is any
non-monotonicity in the relationship between the founder negotiation variables and the performance
measures. For example, one might conjecture that just as very quick negotiations might indicate team
problems, very slow negotiations may also do so. Or one might argue that there is a difference between
mildly versus highly unequal equity splits. In unreported regressions we divided the founder negotiation
variables into the following finer-grained categories: timing of negotiation can be early, medium, or late;
negotiation speed can be quick, medium, or slow; the equity split can be equal, medium-unequal or very-
unequal. These three-way divisions allow us to compare the coefficients of the categories to detect any
evidence of non-monotonicity. We find some indications of non-monotonicity. In particular, even though
venture performance improves between early and medium timing, it deteriorates again with late timing.
The difference between medium and late is significant for employment, but insignificant for venture
capital. Regarding negotiation speed, the differences between medium and slow are never significant.
This is also true for medium-unequal and very-unequal equity splits.
4.3.InteractionEffectsforFounderAgreements
To understand the drivers of our performance results more deeply, we now consider interaction effects.
We ask under what circumstances the correlation between founder negotiations and outcome variables is
strongest. This analysis is partly motivated by the findings in section 4.1 about a positive correlation of
the error terms across the three founder negotiation variables. If unobservable characteristics, such as
conflict avoidance or lack of founder overconfidence, generate a correlation between quick (early)
negotiation and equal splitting, then we would expect the lowest performance among those equal splitters
who also reached an agreement quickly (early).
For the analysis of interaction effects we use the same basic regression framework as in Tables 4 and 5.
Our first set of interactions is based on the categorical variables of equal splitting and early negotiations.
We split the data into four mutually-exclusive groups: early-equal splitting, late-equal splitting, early-
[20]
unequal splitting, and the omitted category of late-unequal splitting. Table 6 reports the results for
employment and venture capital.
The first column of Table 6 considers the effect on employment. The coefficient for early-equal splitting
is statistically significant, and it is the most negative of the three coefficients. We can also compare early-
equal splitters against the two other categories. The coefficient for late-equal splitting is actually positive,
and the F-test for the difference between early-equal versus late-equal splitting is significant at the 5%
level. The coefficient for early-unequal splitting is negative and significant, and the F-test for the
difference between early-equal versus early-unequal splitting is insignificant. This says that early-equal
splitting is associated with the lowest employment level, that early-unequal splitting is also associated
with relatively low employment, but that late-equal and late-unequal teams enjoy higher levels of
employment. The results suggest that there are interactions between the timing of negotiations and the
outcome of the negotiations, and that the combination of early negotiation and equal splitting is associated
with the lowest employment levels.
Similar results obtain in column 2, which examines the effect on venture capital. We find that early equal
splitting is statistically highly significant, and it has the lowest of the three coefficients. We also find that
early-unequal splitting and late-equal splitting have negative but insignificant coefficients. The F-test for
the differences between early-equal and late-equal is insignificant; the F-test for the differences between
early-equal and early-unequal is significant at the 5% level.
The interaction results for quick negotiation in columns 3 and 4 follow a broadly similar pattern than
those for early negotiation. The category of quick-equal splitting is always negative and significant. In the
Employment regression the coefficient for quick-unequal is slightly lower, although the difference is
clearly insignificant. The coefficient for slow-equal is actually positive, and the difference between quick-
equals versus slow-equals is significant at the 10% level. In the venture capital regression, the coefficient
for quick-equal splitting is negative, it is highly significant, and it is the most negative of the three
coefficients. The difference to slow-equal splitting is insignificant, and the difference to quick-unequal
splitting is only marginally insignificant with a P-value of 10.2%.
The evidence of Table 6 clearly supports Hypothesis 7. Equal splitting is more strongly associated with
lower venture performance whenever the decision to split equally emerges from an early or quick
negotiation process. These results are hard to reconcile with a pure causal interpretation: if an equal split
were to cause lower performance, it is unclear why the effect should depend on the timing or speed of the
founder negotiation. However, the results naturally fit an unobserved heterogeneity interpretation. For
example, if some teams have an unobservable conflict avoidance problem, we would expect those teams

[21]
to negotiate early and quickly, we would expect them to be more likely to agree to an equal split, and we
would also expect them to underperform over time. The early-equal (or quick-equal) split appears to be
mainly a symptom of unobservable team problems.
In unreported regressions we also estimated a model where we interacted early negotiations with quick
negotiations. In both the employment and venture capital model we found that the early-quick negotiation
variable was negative and significant at the 1% level, and that it was the lowest of all the coefficients.
Finally we estimated the model with the full set of three-way interactions. We found that early-quick-
equal-splitting was always negative and significant at the 1% level. In the employment regression, it was
the second-lowest coefficient (behind early-quick-unequal-splitting). In the venture capital regression it
was by far the lowest coefficient.
Section5:DiscussionandConclusion
Building a high-potential venture requires founders to strike a wide variety of deals with the people they
attract to help them, including employees, investors, corporate partners, and others. However, the first
deal in a startup – one which could affect all of the subsequent deals – is usually between the cofounders
themselves. In this study, we examine that first deal, focusing on how founders split equity ownership
among themselves. Using a unique dataset of 885 private startups from the technology and life-sciences
industries in North America, our analyses show how the initial deal is related to both internal growth and
external validation. Our most important findings are that equal splits, early negotiations and quick
decision making are correlated with slower internal growth and reduced external validation. The
combinations of early-and-equal equity splits, and similarly quick-and-equal equity splits, are associated
with lowest performance. Ruef (2010:130) already pointed out that it is surprising to see such a high
percentage of (his small-business) teams splitting the equity equally. Our analysis raises the important
concern that these teams also experience lower growth prospects of their startups. This heightens the need
for founding teams to understand what is at stake in crafting their equity agreement, and how to avoiding
agreements that could cause problems down the road.
Despite the richness of our dataset regarding the negotiation process, antecedents, and outcomes, further
research could delve into several other important pieces of the puzzle that we could not tackle in this first
foray into founder agreements. For instance, because our data come from founding teams that had already
formed, we cannot observe the prior decisions about which founders were included or excluded from the
team, nor can we assess whether the core founder tried to attract cofounders but failed. The possibility
remains that team composition is related to the equity-split negotiation process.
[22]
Likewise, we measure several important elements of the founders’ prior work experiences, such as the
years of overall experience and whether they had any prior founding experiences (“serial entrepreneur”).
However, future research should delve into other founder measures that might affect the equity
negotiation, including the attractiveness of each founder’s outside option (e.g., the job s/he would be
leaving to join the startup) and whether any serial entrepreneurs on the team had solo founded before (and
therefore did not have prior experience with equity-split negotiations). In addition, future research could
also try to measure more precisely the contributions that different founders make towards the new venture
prior to the onset of negotiations.
Future research may also broaden the set of outcome measures. We focus on two core measures to capture
internal growth and external validation. Wasserman and Marx (2008) examine how the equity split affects
the stability of the founding team. Further measures could capture other outcomes, such as the startup’s
eventual success or failure, the financial returns generated by the venture overall, and the financial returns
to each of the individual founders.20
In this paper we focus on the correlations between the factors, and we are careful not to infer causality. In
fact, our analyses of interaction effects suggest that unobserved heterogeneity may impact both the
equity-split outcome and the growth and success of the startup. In order to disentangle unobserved
heterogeneity from causality, future research could look for some quasi-natural experiments that generate
instrumental variables for equal splits, and possibly for the process variables, too. However, we do not
expect this to be an easy task, given that there are relatively few exogenous constraints on founding-team
negotiations that could generate such a quasi-natural experiment. Short of an instrumental variable
approach, more fine-grained measurement of founder team characteristics would help to address some of
the endogeneity questions.
As described above, equity ownership not only has economic implications for equity holders, but can also
affect control and decision making within the startup. Although the economic implications and control
implications are closely linked – for instance, those owning the larger percentage of equity may be more
likely to serve on the board of directors and may have additional say over operational decisions – they are
separate elements of the arrangements struck within the founding team. Ownership and control are not
necessarily correlated, and they can also diverge. For example, a financially-motivated founder may be
willing to give up being CEO or sitting on the board if it means that s/he will get a larger equity stake.
20 Hall and Woodward (2010) estimate the returns to entrepreneurship. They make a simplifying assumption about team composition and do not tackle the question of how different founders obtain different returns.
[23]
Future research could examine the contexts in which ownership and control diverge, and the implications
of such divergences.
Once struck, it is often difficult to change an ill-conceived founder agreement. One way to introduce more
flexibility into equity splits is to adopt contingent agreements, such as vesting terms based on continued
involvement and/or success in the startup. Future research should examine the various structures of such
contingent agreements, which types of contingencies are best for which types of teams, and their overall
effect on team stability. In principle founders can always renegotiate their agreement, although in practice
there are multiple obstacles to such renegotiation. Future research might also look into these constraints,
and examine under what circumstances early mistakes are fixed more easily.
Social and cultural norms are likely to affect the process and outcome of founder negotiations. Our
analysis focuses on startups in North America. One avenue for future research would be to add
information about the social relations among founders, their prior interactions, and possibly their own
cultural backgrounds. Yet another avenue for future research would be to go beyond technology and life-
sciences startups in North America, and examine how the process differs across different industries and
countries.
Our analysis has important managerial implications. Many founding teams lack prior experience with
negotiating founder agreements. Each team reinvents its own process, and there is little external guidance
about how to effectively manage the process. Our research suggests that paying attention to the timing of
the negotiation is important, and that there may be benefits to waiting before reaching an agreement. Our
analysis cautions against rushing the negotiation process. To the contrary, it suggests that a more carefully
negotiated founder agreement provides a more solid basis for the team to go forward. Along similar lines,
our analysis invites founders to pause before agreeing to an equal split. While there are situations in
which an equal split is perfectly appropriate, in other circumstances such an agreement is less suitable,
especially if the equal split emerges from an early and/or quick negotiation process.
Relatively little is known about the arrangements among founders within entrepreneurial firms and how
these early structures can influence the firm’s evolution. This paper provides initial insights into the
importance of the first deal. It shows that the nature of the agreement, as well as the process by which the
agreement was reached, may foreshadow some of the challenges that lay ahead for the entrepreneurial
venture. Understanding more broadly the role of founder agreements seems an important direction for
future research.
[24]
Table1.DescriptiveStatistics
All variables are defined in Appendix 1.
Variable Mean Std. Dev. Min Max
(1) Equal Splitting 0.3503 0.4773 0.00 1.00
(2) Early Negotiation 0.6768 0.4679 0.00 1.00
(3) Quick Negotiation 0.4215 0.4941 0.00 1.00
(4) Employment 2.6462 1.3503 0.00 7.78
(5) Venture Capital 0.4384 0.4965 0.00 1.00
(6) Avg Years of Exp 16.5711 8.0047 0.00 47.50
(7) Avg Entrepreneurial Exp 0.3574 0.3624 0.00 1.00
(8) Avg Ideas 0.4111 0.3650 0.00 1.00
(9) Avg Capital 0.0664 0.1069 0.00 0.50
(10) COV Years of Exp 0.3169 0.3504 0.00 2.65
(11) COV Entrepreneurial Exp 0.6319 0.7738 0.00 3.00
(12) COV Ideas 0.6931 0.7740 0.00 3.16
(13) COV Capital 0.4726 0.6609 0.00 2.27
(14) Team Size 2.7977 1.1645 2.00 10.00
(15) Company Age 6.2104 4.4720 0.25 33.92
(16) Software 0.3672 0.4823 0.00 1.00
(17) Hardware 0.2441 0.4298 0.00 1.00
(18) Cleantech 0.0780 0.2683 0.00 1.00
(19) Pharmaceutical 0.1085 0.3112 0.00 1.00
(20) Life Sciences 0.1232 0.3288 0.00 1.00
(21) California 0.3175 0.4658 0.00 1.00
(22) Massachusetts 0.1751 0.3803 0.00 1.00
(23) Canada 0.0215 0.1450 0.00 1.00
[25]
Table2.Pairwisecorrelations
All variables are defined in Appendix 1. Variable numbers can be found in Table 1. Standard errors are reported underneath the correlation coefficients.
(1) (2) (3) (4) (5) (6) (7) (8) (9) (10) (11) (12) (13) (14) (2) 0.062
0.067
(3) 0.203 0.154
0.000 0.000
(4) 0.030 ‐0.077 ‐0.103
0.379 0.021 0.002
(5) ‐0.081 ‐0.066 ‐0.090 0.212
0.016 0.049 0.007 0.000
(6) ‐0.088 ‐0.048 0.026 ‐0.059 0.061
0.009 0.155 0.438 0.080 0.071
(7) 0.005 0.016 0.048 ‐0.082 ‐0.011 0.270
0.889 0.631 0.154 0.015 0.752 0.000
(8) 0.051 0.042 0.042 ‐0.069 0.043 0.074 0.135
0.129 0.208 0.213 0.040 0.206 0.029 0.000
(9) 0.037 0.003 0.002 0.087 ‐0.116 0.194 0.163 0.079
0.269 0.933 0.948 0.009 0.001 0.000 0.000 0.019
(10) ‐0.096 ‐0.008 ‐0.037 ‐0.037 ‐0.029 ‐0.247 ‐0.115 ‐0.052 ‐0.072
0.004 0.803 0.267 0.266 0.397 0.000 0.001 0.122 0.031
(11) ‐0.160 0.023 ‐0.068 ‐0.031 0.028 0.128 0.137 ‐0.026 0.016 0.144
0.000 0.493 0.045 0.351 0.403 0.000 0.000 0.434 0.626 0.000
(12) ‐0.222 ‐0.023 ‐0.056 ‐0.053 ‐0.061 0.028 ‐0.033 0.030 ‐0.017 0.079 0.127
0.000 0.497 0.099 0.117 0.072 0.409 0.334 0.378 0.620 0.018 0.000
(13) ‐0.239 ‐0.062 ‐0.048 ‐0.007 ‐0.093 0.021 0.069 ‐0.035 0.137 0.207 0.179 0.144
0.000 0.067 0.153 0.848 0.006 0.534 0.040 0.305 0.000 0.000 0.000 0.000
(14) ‐0.259 ‐0.016 ‐0.196 0.079 0.069 0.043 ‐0.112 ‐0.141 ‐0.078 0.204 0.291 0.178 0.141
0.000 0.629 0.000 0.019 0.039 0.207 0.001 0.000 0.021 0.000 0.000 0.000 0.000
(15) 0.062 ‐0.121 ‐0.014 0.469 ‐0.005 ‐0.075 ‐0.181 ‐0.013 0.076 0.013 ‐0.069 0.024 0.030 ‐0.014
0.064 0.000 0.674 0.000 0.877 0.025 0.000 0.704 0.023 0.711 0.041 0.472 0.378 0.677
[26]
Table3.DeterminantsofFounderAgreements
All variables are defined in Appendix 1. The table reports the coefficient estimate and its associated robust standard errors. ***, ** and * indicate statistical significance
at confidence levels of 99%, 95% and 90% respectively.
Dependent Variables
Independent Variables Equal Splitting Early Negotiation Quick Negotiation
Avg Years of Exp ‐0.0132* ‐0.00899 0.00692 (0.00683) (0.00646) (0.00626)
Avg Entrepreneurial Exp 0.0346 0.110 0.0593 (0.140) (0.133) (0.133)
Avg Ideas 0.225 0.177 0.0971 (0.170) (0.168) (0.162)
Avg Capital 0.678 ‐0.00664 ‐0.248 (0.451) (0.446) (0.426)
COV Years of Exp 0.0228 0.0160 0.0399 (0.173) (0.146) (0.137)
COV Entrepreneurial Exp ‐0.0722 0.0621 ‐0.0297 (0.0707) (0.0631) (0.0620)
COV Ideas ‐0.255*** ‐0.0236 ‐0.0177 (0.0796) (0.0772) (0.0757)
COV Capital ‐0.443*** ‐0.146** ‐0.0337 (0.0824) (0.0716) (0.0706)
Team Size ‐0.325*** ‐0.00685 ‐0.244*** (0.0627) (0.0410) (0.0485)
Software 0.0552 ‐0.0412 ‐0.345** (0.177) (0.181) (0.168)
Hardware ‐0.104 ‐0.0447 ‐0.288 (0.189) (0.189) (0.179)
Cleantech ‐0.150 ‐0.0438 ‐0.394* (0.238) (0.230) (0.225)
Pharmaceutical ‐0.278 ‐0.313 ‐0.435** (0.234) (0.223) (0.215)
Life Sciences 0.244 0.0646 ‐0.321 (0.213) (0.210) (0.197)
California 0.166 ‐0.0707 ‐0.0927 (0.110) (0.105) (0.103)
Massachusetts 0.0426 ‐0.206* ‐0.0675 (0.132) (0.124) (0.125)
Canada 0.610* 0.480 0.0303 (0.325) (0.341) (0.297)
Constant 1.417 ‐0.0555 6.140*** (0.883) (0.875) (0.393)
Agreement & Survey Year FE Yes Yes Yes
Pseudo R‐square 0.152 0.034 0.056 Chi‐square 124.15*** 36.42 756.57*** Observations 885 885 885
[27]
Table4:FounderAgreementsandEmployment
All variables are defined in Appendix 1. The table reports the coefficient estimate and its associated robust standard errors. ***, ** and * indicate statistical significance
at confidence levels of 99%, 95% and 90% respectively.
Dependent Variable: Employment
Independent Variables Coeff. (S.E.) Coeff. (S.E.) Coeff. (S.E.) Coeff. (S.E.)
Equal Splitting ‐0.0173 ‐0.084 0.0325 ‐0.085
Early Negotiation ‐0.226** ‐0.089 ‐0.196** ‐0.089
Quick Negotiation ‐0.223*** ‐0.078 ‐0.205** ‐0.079
Avg Years of Exp ‐0.00267 ‐0.006 ‐0.00321 ‐0.006 ‐0.00202 ‐0.005 ‐0.00246 ‐0.005
Avg Entrepreneurial Exp 0.112 ‐0.108 0.116 ‐0.108 0.116 ‐0.107 0.118 ‐0.107
Avg Ideas 0.083 ‐0.143 0.0957 ‐0.141 0.0901 ‐0.141 0.0992 ‐0.139
Avg Capital 0.624* ‐0.337 0.649* ‐0.334 0.607* ‐0.337 0.626* ‐0.335
COV Years of Exp ‐0.175 ‐0.111 ‐0.171 ‐0.111 ‐0.17 ‐0.111 ‐0.167 ‐0.112
COV Entrepreneurial Exp ‐0.0127 ‐0.054 ‐0.0109 ‐0.054 ‐0.0154 ‐0.053 ‐0.0133 ‐0.053
COV Ideas 0.00258 ‐0.066 0.00368 ‐0.065 0.00299 ‐0.064 0.00543 ‐0.065
COV Capital ‐0.0692 ‐0.059 ‐0.0792 ‐0.058 ‐0.0704 ‐0.058 ‐0.0764 ‐0.059
Team Size 0.123*** ‐0.035 0.123*** ‐0.034 0.106*** ‐0.034 0.109*** ‐0.035
Company Age 0.188*** ‐0.060 0.136** ‐0.065 0.177*** ‐0.062 0.133** ‐0.066
Company Age‐Square ‐0.00432** ‐0.002 ‐0.00303 ‐0.002 ‐0.00407** ‐0.002 ‐0.00297 ‐0.002
Software 0.393** ‐0.179 0.375** ‐0.178 0.362** ‐0.180 0.349* ‐0.179
Hardware 0.447** ‐0.190 0.432** ‐0.188 0.421** ‐0.189 0.412** ‐0.188
Cleantech 0.407** ‐0.202 0.395** ‐0.200 0.373* ‐0.203 0.367* ‐0.202
Pharmaceutical ‐0.275 ‐0.203 ‐0.307 ‐0.200 ‐0.311 ‐0.202 ‐0.334* ‐0.200
Life Sciences ‐0.0669 ‐0.197 ‐0.0743 ‐0.196 ‐0.097 ‐0.197 ‐0.102 ‐0.196
California 0.0933 ‐0.087 0.0847 ‐0.088 0.0842 ‐0.087 0.0765 ‐0.087
Massachusetts 0.137 ‐0.100 0.122 ‐0.100 0.132 ‐0.099 0.119 ‐0.099
Canada 0.248 ‐0.201 0.279 ‐0.205 0.248 ‐0.207 0.271 ‐0.210
Constant 1.786* ‐1.013 2.278** ‐1.077 2.168** ‐1.016 2.549** ‐1.083
Agreement & Survey Year FE Yes Yes Yes
Yes
R‐square 0.356 0.361 0.363
0.366
F Test 17.84*** 17. 73*** 18.80***
17.88***
Observations 885 885 885 885
[28]
Table5:FounderAgreementsandVentureCapital
All variables are defined in Appendix 1. The table reports the coefficient estimate and its associated robust standard errors. ***, ** and * indicate statistical significance
at confidence levels of 99%, 95% and 90% respectively.
Dependent Variable: Venture Capital
Independent Variables Coeff. (S.E.) Coeff. (S.E.) Coeff. (S.E.) Coeff. (S.E.)
Equal Splitting ‐0.274*** ‐0.101 ‐0.241** ‐0.103
Early Negotiation ‐0.195* ‐0.104 ‐0.157 ‐0.104
Quick Negotiation
‐0.203** ‐0.092 ‐0.149 ‐0.095
Avg Years of Exp 0.0101 ‐0.006 0.0108* ‐0.006 0.0116* ‐0.006 0.0102 ‐0.006
Avg Entrepreneurial Exp 0.00662 ‐0.133 0.0027 ‐0.133 0.0106 ‐0.133 0.0149 ‐0.134
Avg Ideas 0.302* ‐0.160 0.293* ‐0.159 0.287* ‐0.159 0.314** ‐0.160
Avg Capital ‐1.550*** ‐0.466 ‐1.579*** ‐0.474 ‐1.619*** ‐0.470 ‐1.550*** ‐0.469
COV Years of Exp ‐0.0776 ‐0.141 ‐0.0682 ‐0.139 ‐0.0682 ‐0.139 ‐0.0714 ‐0.141
COV Entrepreneurial Exp 0.035 ‐0.062 0.0442 ‐0.062 0.038 ‐0.062 0.0331 ‐0.062
COV Ideas ‐0.072 ‐0.075 ‐0.0501 ‐0.075 ‐0.0506 ‐0.075 ‐0.071 ‐0.075
COV Capital ‐0.196*** ‐0.074 ‐0.170** ‐0.072 ‐0.163** ‐0.072 ‐0.203*** ‐0.074
Team Size 0.0526 ‐0.043 0.0709* ‐0.042 0.0571 ‐0.043 0.0434 ‐0.043
Company Age 0.0858* ‐0.052 0.0326 ‐0.057 0.0705 ‐0.053 0.0395 ‐0.057
Company Age‐Square ‐0.0026 ‐0.002 ‐0.00129 ‐0.002 ‐0.00226 ‐0.002 ‐0.00147 ‐0.002
Software 0.439** ‐0.186 0.420** ‐0.187 0.402** ‐0.187 0.405** ‐0.186
Hardware 0.458** ‐0.192 0.460** ‐0.193 0.445** ‐0.193 0.433** ‐0.192
Cleantech 0.523** ‐0.236 0.531** ‐0.236 0.505** ‐0.237 0.497** ‐0.237
Pharmaceutical 0.478** ‐0.223 0.472** ‐0.224 0.460** ‐0.223 0.434* ‐0.224
Life Sciences 0.312 ‐0.210 0.289 ‐0.210 0.264 ‐0.211 0.285 ‐0.210
California 0.313*** ‐0.102 0.289*** ‐0.102 0.290*** ‐0.103 0.303*** ‐0.103
Massachusetts 0.560*** ‐0.125 0.537*** ‐0.125 0.549*** ‐0.124 0.548*** ‐0.125
Canada ‐0.276 ‐0.333 ‐0.304 ‐0.330 ‐0.338 ‐0.324 ‐0.258 ‐0.333
Constant ‐0.588 ‐0.958 ‐0.377 ‐0.914 ‐0.428 ‐0.915 ‐0.0252 ‐0.972
Agreement & Survey Year FE Yes Yes Yes
Yes
Pseudo R‐square 0.086 0.083 0.084
0.091
Chi‐square 99.42*** 96.18*** 97.29***
105.48***
Observations 885 885 885 885
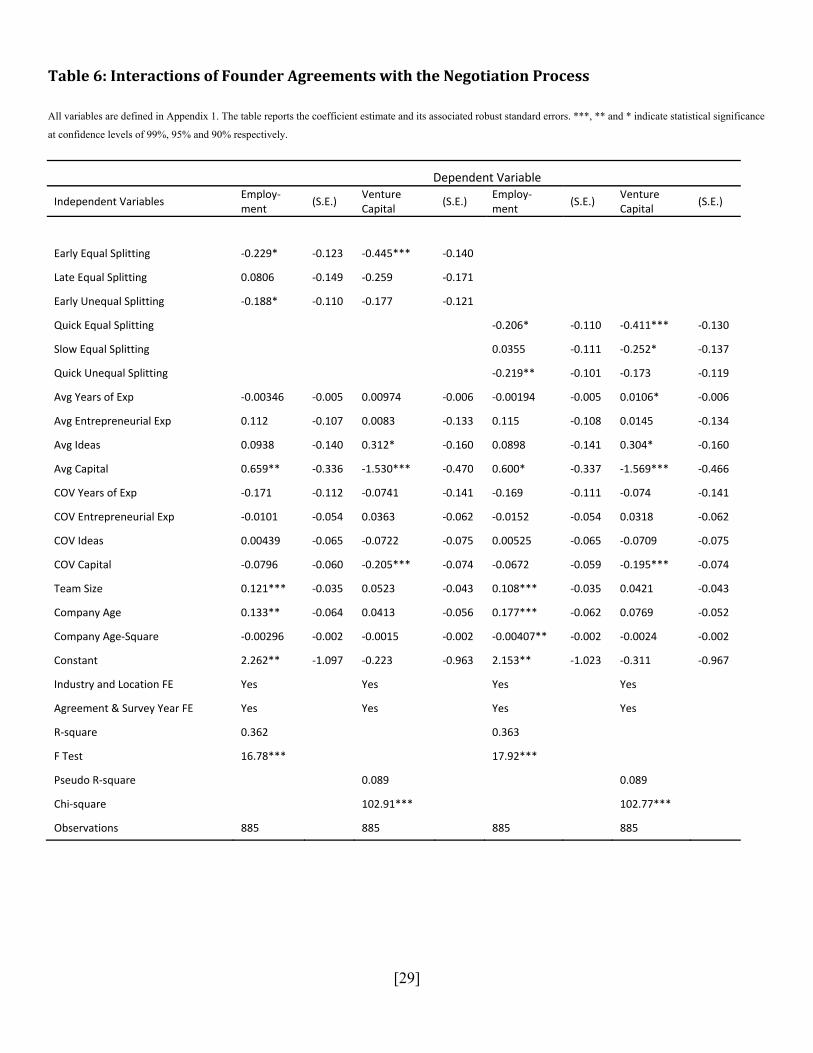
[29]
Table6:InteractionsofFounderAgreementswiththeNegotiationProcess
All variables are defined in Appendix 1. The table reports the coefficient estimate and its associated robust standard errors. ***, ** and * indicate statistical significance
at confidence levels of 99%, 95% and 90% respectively.
Dependent Variable
Independent Variables Employ‐ment
(S.E.) Venture Capital
(S.E.) Employ‐ment
(S.E.) Venture Capital
(S.E.)
Early Equal Splitting ‐0.229* ‐0.123 ‐0.445*** ‐0.140
Late Equal Splitting 0.0806 ‐0.149 ‐0.259 ‐0.171
Early Unequal Splitting ‐0.188* ‐0.110 ‐0.177 ‐0.121
Quick Equal Splitting ‐0.206* ‐0.110 ‐0.411*** ‐0.130
Slow Equal Splitting 0.0355 ‐0.111 ‐0.252* ‐0.137
Quick Unequal Splitting ‐0.219** ‐0.101 ‐0.173 ‐0.119
Avg Years of Exp ‐0.00346 ‐0.005 0.00974 ‐0.006 ‐0.00194 ‐0.005 0.0106* ‐0.006
Avg Entrepreneurial Exp 0.112 ‐0.107 0.0083 ‐0.133 0.115 ‐0.108 0.0145 ‐0.134
Avg Ideas 0.0938 ‐0.140 0.312* ‐0.160 0.0898 ‐0.141 0.304* ‐0.160
Avg Capital 0.659** ‐0.336 ‐1.530*** ‐0.470 0.600* ‐0.337 ‐1.569*** ‐0.466
COV Years of Exp ‐0.171 ‐0.112 ‐0.0741 ‐0.141 ‐0.169 ‐0.111 ‐0.074 ‐0.141
COV Entrepreneurial Exp ‐0.0101 ‐0.054 0.0363 ‐0.062 ‐0.0152 ‐0.054 0.0318 ‐0.062
COV Ideas 0.00439 ‐0.065 ‐0.0722 ‐0.075 0.00525 ‐0.065 ‐0.0709 ‐0.075
COV Capital ‐0.0796 ‐0.060 ‐0.205*** ‐0.074 ‐0.0672 ‐0.059 ‐0.195*** ‐0.074
Team Size 0.121*** ‐0.035 0.0523 ‐0.043 0.108*** ‐0.035 0.0421 ‐0.043
Company Age 0.133** ‐0.064 0.0413 ‐0.056 0.177*** ‐0.062 0.0769 ‐0.052
Company Age‐Square ‐0.00296 ‐0.002 ‐0.0015 ‐0.002 ‐0.00407** ‐0.002 ‐0.0024 ‐0.002
Constant 2.262** ‐1.097 ‐0.223 ‐0.963 2.153** ‐1.023 ‐0.311 ‐0.967
Industry and Location FE Yes
Yes Yes Yes
Agreement & Survey Year FE Yes
Yes Yes Yes
R‐square 0.362
0.363
F Test 16.78***
17.92***
Pseudo R‐square 0.089 0.089
Chi‐square 102.91*** 102.77***
Observations 885 885 885 885
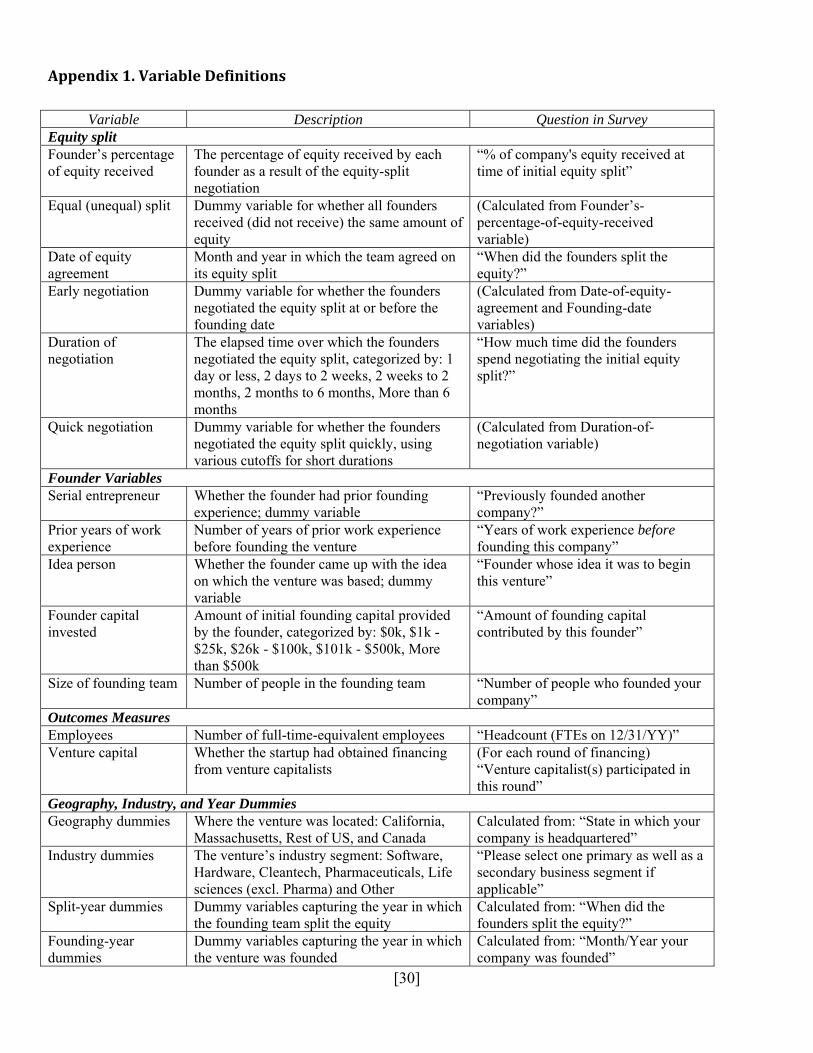
[30]
Appendix1.VariableDefinitions
Variable Description Question in Survey Equity split Founder’s percentage of equity received
The percentage of equity received by each founder as a result of the equity-split negotiation
“% of company's equity received at time of initial equity split”
Equal (unequal) split Dummy variable for whether all founders received (did not receive) the same amount of equity
(Calculated from Founder’s-percentage-of-equity-received variable)
Date of equity agreement
Month and year in which the team agreed on its equity split
“When did the founders split the equity?”
Early negotiation Dummy variable for whether the founders negotiated the equity split at or before the founding date
(Calculated from Date-of-equity-agreement and Founding-date variables)
Duration of negotiation
The elapsed time over which the founders negotiated the equity split, categorized by: 1 day or less, 2 days to 2 weeks, 2 weeks to 2 months, 2 months to 6 months, More than 6 months
“How much time did the founders spend negotiating the initial equity split?”
Quick negotiation Dummy variable for whether the founders negotiated the equity split quickly, using various cutoffs for short durations
(Calculated from Duration-of-negotiation variable)
Founder Variables Serial entrepreneur Whether the founder had prior founding
experience; dummy variable “Previously founded another company?”
Prior years of work experience
Number of years of prior work experience before founding the venture
“Years of work experience before founding this company”
Idea person Whether the founder came up with the idea on which the venture was based; dummy variable
“Founder whose idea it was to begin this venture”
Founder capital invested
Amount of initial founding capital provided by the founder, categorized by: $0k, $1k - $25k, $26k - $100k, $101k - $500k, More than $500k
“Amount of founding capital contributed by this founder”
Size of founding team Number of people in the founding team “Number of people who founded your company”
Outcomes Measures Employees Number of full-time-equivalent employees “Headcount (FTEs on 12/31/YY)” Venture capital Whether the startup had obtained financing
from venture capitalists (For each round of financing) “Venture capitalist(s) participated in this round”
Geography, Industry, and Year Dummies Geography dummies Where the venture was located: California,
Massachusetts, Rest of US, and Canada Calculated from: “State in which your company is headquartered”
Industry dummies The venture’s industry segment: Software, Hardware, Cleantech, Pharmaceuticals, Life sciences (excl. Pharma) and Other
“Please select one primary as well as a secondary business segment if applicable”
Split-year dummies Dummy variables capturing the year in which the founding team split the equity
Calculated from: “When did the founders split the equity?”
Founding-year dummies
Dummy variables capturing the year in which the venture was founded
Calculated from: “Month/Year your company was founded”

[31]
References
Ashlagiy, I., Karagözoglu, E., & Klaus, B. 2008. A noncooperative support for equal division in estate division problems. Harvard Business School Working Paper 09-069.
Åstebro, T., & Serrano, C. 2011. Business partners, financing, and the commercialization of inventions. NBER Working Paper No. 17181.
Baron, J. N., Hannan, M. T., & Burton, M. D. 2001. Labor pains: Change in organizational models and employee turnover in young, high-tech firms. American Journal of Sociology, 106(4): 960-1012.
Beckman, C. 2006. The influence of founding team company affiliations on firm behavior. Academy of Management Journal, 49(4).
Beckman, C., & Burton, M. D. 2008. Founding the future: Path dependence in the evolution of top management teams from founding to IPO. Organization Science, 19(1): 3-24.
Beckman, C., Burton, M. D., & O'Reilly, C. A. 2007. Early teams: The impact of team demography on VC financing and going public. Journal of Business Venturing, 22: 147-173.
Binmore, K. 1987. Perfect equilibria in bargaining models. In K. Binmore, & P. Dasgupta (Eds.), The Economics of Bargaining. Oxford: Basil Blackwell.
Binmore, K., Rubinstein, A., & Wolinsky, A. 1986. The Nash bargaining solution in economic modelling. Rand Journal of Economics, 17(2): 176-188.
Boeker, W. 1989. Strategic change: The effects of founding and history. Academy of Management Journal, 32: 489-515.
Bose, A., Pal, D., & Sappington, D. 2010. Equal pay for unequal work: Limiting sabotage in teams. Journal of Economics & Managerial Strategy, 19(1): 25-53.
Dawes, C., Fowler, J., Johnson, T., McElreath, R., & Smirnov, O. 2007. Egalitarian motives in humans. Nature, 446: 794-796.
Delmar, F., & Shane, S. 2006. Does experience matter? The effect of founding team experience on the survival and sales of newly founded ventures. Strategic Organization, 4(August): 215-247.
Dyer, J. H., Singh, H., & Kale, P. 2008. Splitting the pie: Rent distribution in alliances and networks. Managerial and Decision Economics, 29: 137–148.
Eisenhardt, K. M., Kahwajy, J. L., & III, L. J. B. 1997. Conflict and strategic choice: How top management teams disagree. California Management Review, 39(2 (Winter)): 42-62.
Encinosa, W. E., Gaynor, M., & Rebitzer, J. B. 2007. The sociology of groups and the economics of incentives: Theory and evidence on compensation systems. Journal of Economic Behavior and Organization, 62(2): 187-214.
Fehr, E., & Schmidt, K. M. 1999. A theory of fairness, competition, and cooperation. Quarterly Journal of Economics, 114(3): 817-868.
Franco, A., Mitchell, M., & Vereshchagina, G. 2011. Incentives and the structure of teams. Working Paper, University of Toronto.
Gompers, P., Lerner, J., Scharfstein, D., & Kovner, A. R. 2010. Performance persistence in entrepreneurship and venture capital. Journal of Financial Economics 96(1).
Graham, J., & Harvey, C. 2001. The theory and practice of corporate finance: Evidence from the field. Journal of Financial Economics, 60: 187-243.
Gulati, R., & Wang, L. 2003. Size of the pie and share of the pie: Implications of structural embeddedness for value creation and value appropriation in joint ventures. Research in the Sociology of Organizations, 20: 209-242.
Hall, R. E., & Woodward, S. E. 2010. The burden of the nondiversifiable risk of entrepreneurship. American Economic Review, 100(June): 1163-1194.
Haltiwanger, J. 2012. Job creation and firm dynamics in the U.S. Innovation Policy and the Economy.
[32]
Hart, M. M., Roberts, M. J., & Stevens, J. D. 2003. Zipcar: Refining the business model. Harvard Business School Case, #803-096.
Hauswald, R. B. H., & Hege, U. 2006. Ownership and control in joint ventures: Theory and evidence. Mimeo, HEC Paris.
Hegedus, C., & Noujaim, J. 2001. Startup.com: Live / Artisan. Hellmann, T., & Thiele, V. 2012. Contracting among founders. Working Paper. Holmstrom, B. 1982. Moral hazard in teams. Bell Journal of Economics, 13: 324-340. Hsu, D., Roberts, D. R., & Eesley, D. 2007. Entrepreneurs from technology-based universities: Evidence from
MIT. Organization Science, 6(3). Kaplan, S. N., & Stromberg, P. 2004. Characteristics, contracts, and actions: Evidence from venture capitalist
analyses. Journal of Finance, 59: 2173-2206. Lemmon, M., Roberts, M., & Zender, J. 2010. Back to the beginning: Persistence and the cross-sectional
distribution of capital structure. Journal of Finance, Forthcoming. Puri, M., & Zarutskie, R. 2011. On the lifecycle dynamics of venture-capital and non-venture-capital-financed firms.
Journal of Finance. Robb, A., & Robinson, D. T. 2009. The capital structure decisions of new firms. Available at SSRN:
http://ssrn.com/abstract=1345895. Robinson, D., & Stuart, T. 2007. Financial contracting in biotech strategic alliances. Journal of Law and
Economics, 50(3). Rubinstein, A. 1982. Perfect equilibrium in a bargaining model. Econometrica, 50: 97-110. Ruef, M. 2010. The Entrepreneurial Group: Social Identities, Relations, and Collective Action. Princeton, NJ:
Princeton University Press. Ruef, M., Aldrich, H. E., & Carter, N. 2003. The structure of founding teams: Homophily, strong ties, and
isolation among U.S. entrepreneurs. American Sociological Review, 68: 195-222. Shane, S., & Stuart, T. 2002. Organizational endowments and the performance of university start-ups.
Management Science, 48(1): 154-170. Tamvada, J. P., & Shrivastava, M. 2011. Entrepreneurial teams, optimal team size, and founder exits. Mimeo. Wasserman, N. 2003. Founder-CEO succession and the paradox of entrepreneurial success. Organization
Science, 14(2): 149-172. Wasserman, N. 2006. Stewards, agents, and the founder discount: Executive compensation in new ventures.
Academy of Management Journal, 49: 960-976. Wasserman, N. 2008. Smartix: Swinging for the Fences. HBS case No. 808-116. Wasserman, N. 2012. The Founder's Dilemmas: Anticipating and Avoiding the Pitfalls That Can Sink a
Startup. Princeton, NJ: Princeton University Press. Wasserman, N., & Marx, M. 2008. Split decisions: How social and economic choices affect the stability of
founding. Academy of Management Annual Meeting.


![[The Sun] Deal or No Deal](https://img.dokumen.tips/doc/110x75/563db788550346aa9a8bf672/the-sun-deal-or-no-deal.jpg)
