Embed Size (px)
Citation preview
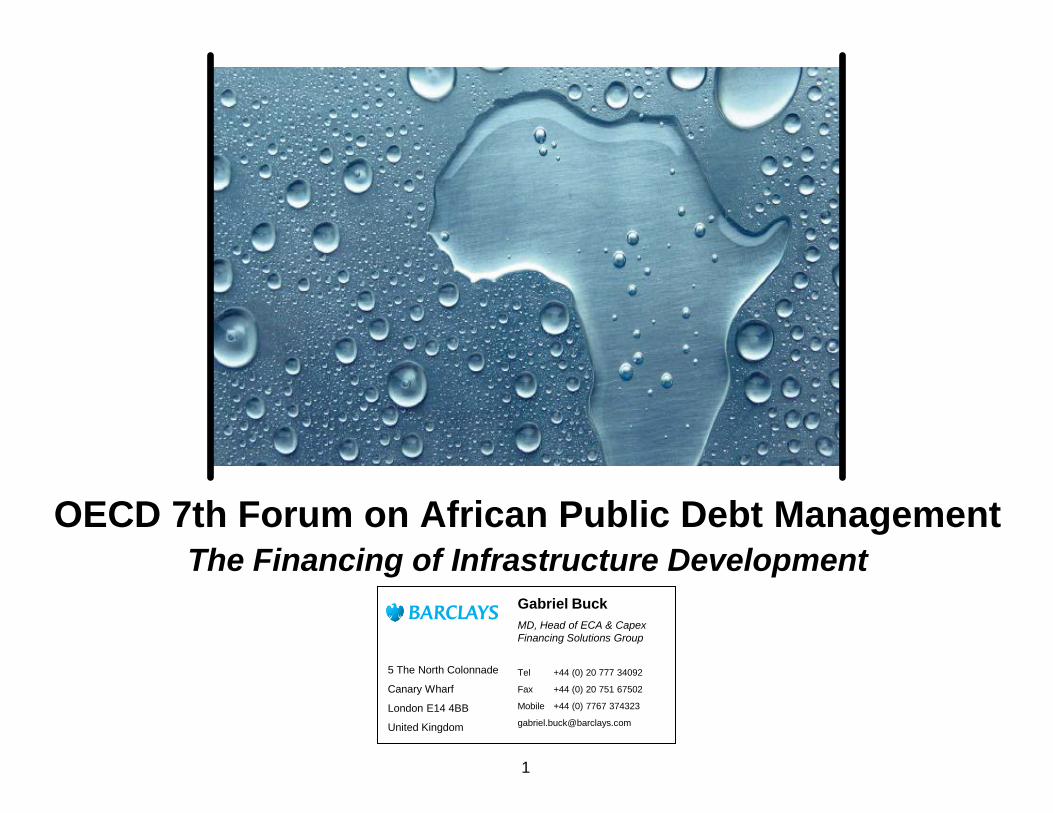
Gabriel Buck
MD, Head of ECA & Capex
Financing Solutions Group
5 The North Colonnade
Canary Wharf
London E14 4BB
United Kingdom
Tel +44 (0) 20 777 34092
Fax +44 (0) 20 751 67502
Mobile +44 (0) 7767 374323
OECD 7th Forum on African Public Debt Management
The Financing of Infrastructure Development
1

USD 45bn spent in Africa on infrastructure every year
USD 75bn required to be spent every year to redress Africa‟s infrastructure deficit
Bank funding alone will not suffice
Financing will remain a major challenge
USD 93bn p.a. needed until 2020 for Africa to break even their infrastructure deficit
Even scaling up of infrastructure financing from the traditional sources, including taxes,
government borrowing and aid, will not suffice
World Bank Reports:
African Development Bank Reports:
2
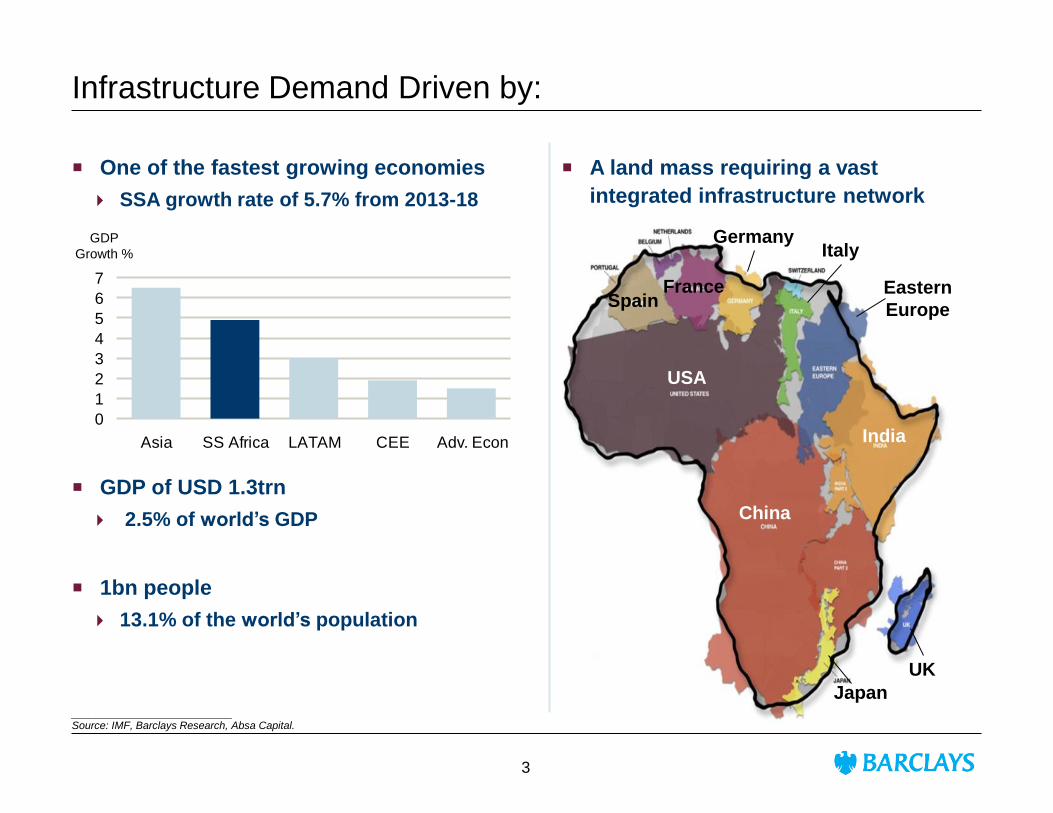
Infrastructure Demand Driven by:
One of the fastest growing economies
SSA growth rate of 5.7% from 2013-18
GDP of USD 1.3trn
2.5% of world‟s GDP
1bn people
13.1% of the world‟s population
GDP
Growth %
USA
China
India
UK
Eastern
Europe Spain
France
Germany Italy
Japan
A land mass requiring a vast
integrated infrastructure network
___________________________ Source: IMF, Barclays Research, Absa Capital.
0
1
2
3
4
5
6
7
Asia SS Africa LATAM CEE Adv. Econ
3

0.0 0.2 0.4 0.6 0.8
Paved roads
Total roads
Fixed lines
Mobile
Internet
Electricity capacity
Electricity coverage
Africa infrastructure shortfall is glaring, even
when comparing to other low-income
countries
Africa Infrastructure
___________________________ Sources: AICD, NASA, Absa.
4

Sources: Africa Project Access, Business Monitor International, Ernst & Young, Absa
Understanding where the money is going
0 10 20 30 40
Power
Roads/bridges
Rail
Water
Airports
Ports
Comm constr
Ind constr
Oil/gas pipe
Housing
Healthcare
Resid constr
Education
% capital
% projects
0 50 100
South Africa
Nigeria
Egypt
Uganda
Kenya
Algeria
Mozambique
Libya
Tanzania
Cameroon
$bn
# Projects
Africa Infrastructure
Active projects, by sector Active projects, by country
___________________________ Sources: Africa Project Access, Business Monitor International, Ernst & Young, Absa.
5

Govt of Ghana
USD 175m
ECGD-backed facility
7 district hospitals
October 2012
Despite the enormity of the scale, major CapEx programmes are getting done
Transnet
ZAR 78bn
Umbrella Structured
ECA Facility
Sole Advisor/Arranger
2007-2012
TAAG
USD 580m
Financing of
7 Boeing
Arranger & Agent
2006-2007
South African Airways
USD 345m
Financing of
3 Airbus
Arranger & Agent
2003
SANRAL
USD 1.0bn
Umbrella Structured
ECA Facility
Sole Advisor/Arranger
2009-2014
Govt of South Africa
NT1,2,3
USD 2.6bn
Re-Structured
Multicurrency
ECGD Facility
Sole Advisor & MLA
2000-2020
Xstrata South Africa
USD 1.0bn
ECA Backed Facility
2x150MW Power Plant
UNDER MANDATE
Govt of Ghana
USD 101m
ECIC-backed facility
SHEP4 Programme
Arranger and Lender
2012
Ghana Cocoa Board
USD 200m
Medium Term
Trade Finance Facility
Initial MLA/Bookrunner
2012
Ghana Cocoa Board
USD 1.5bn
Short Term
Trade Finance Facility
Initial Lead Arranger
2012
PROJECT
SEAGOLD
USD 100m
Financing of 13 fixed
& rotary wing aircraft
Arranger & Agent
2005-2006
Sonangol
USD 2.5bn
Syndicated Loan
Joint MLA
2008
Telkom
USD 1.6bn
Umbrella Structured
ECA Facitliy
Sole Advisor /Arranger
2010-2015
Mainstream
USD 1.0bn
ECA Backed Facility
7 Renewables Projects
UNDER MANDATE
Ghana
South Africa Govt of Zambia
Up to USD 2.8bn
Umbrella Structured
ECA Facility
UNDER MANDATE
PROJECT
MAAMBA
USD 540m
ECA-backed facility
2x150MW Power Plant
UNDER MANDATE
Zambia
Angola
Natura Energy
USD 150m
ECA Backed Facility
HFO Power Plant
UNDER MANDATE
Namibia
Shaft Sinkers
USD 260m ECIC
Backed Facility
Sole Adviser
&Bookrunner
2010
Govt of Tanzania
USD 1.0bn
Umbrella Structured
ECA Facility
UNDER MANDATE
Govt of Tanzania
USD 40m
Structured L/C and
Loan facility
Lead Arranger / Agent
2000
Tanzania
Sasol New Energy
Advisory for
Financing of
Gas power plant
UNDER MANDATE
Mozambique
Royal Air Maroc
USD 470m
Financing of
5 Boeing & 2 Airbus
Arranger & Agent
2007-2008
Morocco
EgyptAir
USD 430m
Financing of
5 Boeing
Arranger & Agent
2002 - 2008
Egypt
Ethiopian Airlines
USD 300m
Financing of
3 Boeing
Arranger & Agent
2003
Ethiopia
Kenya Airways
USD 430m
Financing of
5 Boeing
Arranger & Agent
2002 - 2008
Kenya
Kenya Electricity
Generating Company
USD 5bn
Financial Advisor and
Arranger Services
UNDER MANDATE
Liqhobong
Diamond Project
USD 75m
ECIC-Backed
Project Finance
UNDER MANDATE
Lesotho
C&I Leasing
USD 4.4m
ECIC Facility
Crew transport vessels
Arranger & Agent
2013
Nigeria
Makomo Resources
USD 10m
SMT ECIC backed
financing
Arranger & Agent
2012
Zimbabwe
6
Funding Essentially comes from 3 sources:
1. Loan Market Funding
2. Bond Market Funding
3. ECA Market Funding
Borrowers, whether Governments, SOE‟s or Project Sponsors, need to address how
best to fund from these 3 pools of liquidity
Due consideration will be given on factors such as:
Depth of liquidity
Maximum tenor
All in pricing – including negative cost of carry
FX / Interest Rate risk
Suitability/Flexibility especially when dealing with project risk, delays, cost
overruns, etc
Documentation and the need for a credit rating from either Fitch, S&P or Moody‟s
7

Loan Markets: International Project Finance: Volumes are down
The global project finance loan market fell back 7%
last year to $198.7bn in 2012
Throughout 2012, a common theme was the fact
that eurozone banks had limited lending
capacity
Deal flow in the eurozone fell back as austerity bit
Volumes in EMEA region fell by 18.5% to $67.9bn
Into 2013, EMEA deal flow remains constrained
The proportion of capital provided by European
banks continues on its downward trend
Liquidity issues and higher pricing were primarily a
result of:
Increased regulatory requirements which have
increased bank capital requirements and
reduced lending capacity
Higher bank funding costs, and a move towards
matching funding with tenor of underlying
assets
___________________________ Source: Dealogic, Project Finance International.
EMEA project finance volumes
0
50,000
100,000
150,000
2003 2004 2005 2006 2007 2008 2009 2010 2011 2012
$mn
0
200
400
600
No. Deals
EM EA loan volumes No. of deals
EMEA project finance loans – 2007YTD
0
25
50
75
100
125
150
2007 2008 2009 2010 2011 2012
$bn
0%
10%
20%
30%
40%
50%
60%
70%
Market Share
IT/FR/ESP/POR UK & Ireland
Continental & Nordic CIS
Japan Other
IT/FR/ESP/POR market share
Commentary
The dynamics are evolving
8

Loan Markets: Domestic Bank Markets: Single Lending Capacity
Capital reserves determines each bank‟s
single lending capacity
Even for the South African market,
capacity is not big enough to fund mega
infrastructure projects
Top 20 RSA bank aggregate single
lending capacity is USD 7.2bn
For USD 250m-300m sized projects, loan
market funding now dependant on
multiple banks forming a syndication
This data reinforcing African
Development Bank report that bank
funding will not suffice
Just taking South Africa as an example:
___________________________ BA900 Returns for Mar 2013. FX – ZAR:USD 0.098 as of 21/06/2013.
Institution
Total Capital
Reserve (less
impairments)
R‟000
Single
lending
capacity
R‟000
THE STANDARD BANK OF S A LTD 71,137,334 17,784,333.50
ABSA BANK LTD 57,589,691 14,397,422.75
FIRSTRAND BANK LIMITED 54,875,293 13,718,823.25
NEDBANK LTD 44,937,989 11,234,497.25
INVESTEC BANK LTD 20,392,451 5,098,112.75
AFRICAN BANK LIMITED 13,029,258 3,257,314.50
CAPITEC BANK 8,439,237 2,109,809.25
CITIBANK N.A 4,490,619 1,122,654.75
JPMORGAN CHASE BANK 2,650,000 662,500.00
STANDARD CHARTERED BANK 2,068,226 517,056.50
THE HK & SHANGHAI BANKING CORP 1,866,371 466,592.75
BIDVEST BANK LIMITED 1,821,468 455,367.00
MERCANTILE BANK LTD 1,679,089 419,772.25
BANK OF CHINA LTD JHB BRANCH 1,608,023 402,005.75
CHINA CONSTRUCTION BANK 1,345,868 336,467.00
DEUTSCHE BANK AG 1,302,168 325,542.00
STATE BANK OF INDIA 751,685 187,921.25
SASFIN BANK LTD 599,796 149,949.00
UBANK LIMITED 539,841 134,960.25
GRINDROD BANK LIMITED 526,374 131,593.50
Total R’000 292,132,080 73,033020
Total USD ‘000 28,628,944 7,157,236
9

2.0
3.0
4.0
5.0
6.0
7.0
8.0
9.0
10.0
11.0
12.0
13.0
14.0
15.0
Nov-07 Jan-09 Apr-10 Jul-11 Oct-12
(%)
US credit EM credit
Bond Market: Substantial Growth in recent years
With emerging markets growth hitting record levels
0
1,000
2,000
3,000
4,000
5,000
'00 '01 '02 '03 '04 '05 '06 '07 '08 '09 '10 '11 '12'13ytd
USDbn
0%
3%
6%
9%
12%
15%
Global EM as % of global issuance (RHS)
___________________________ Source: Barclays, Bloomberg, April 2013.
Global new issue market overview Credit spreads have compressed
10
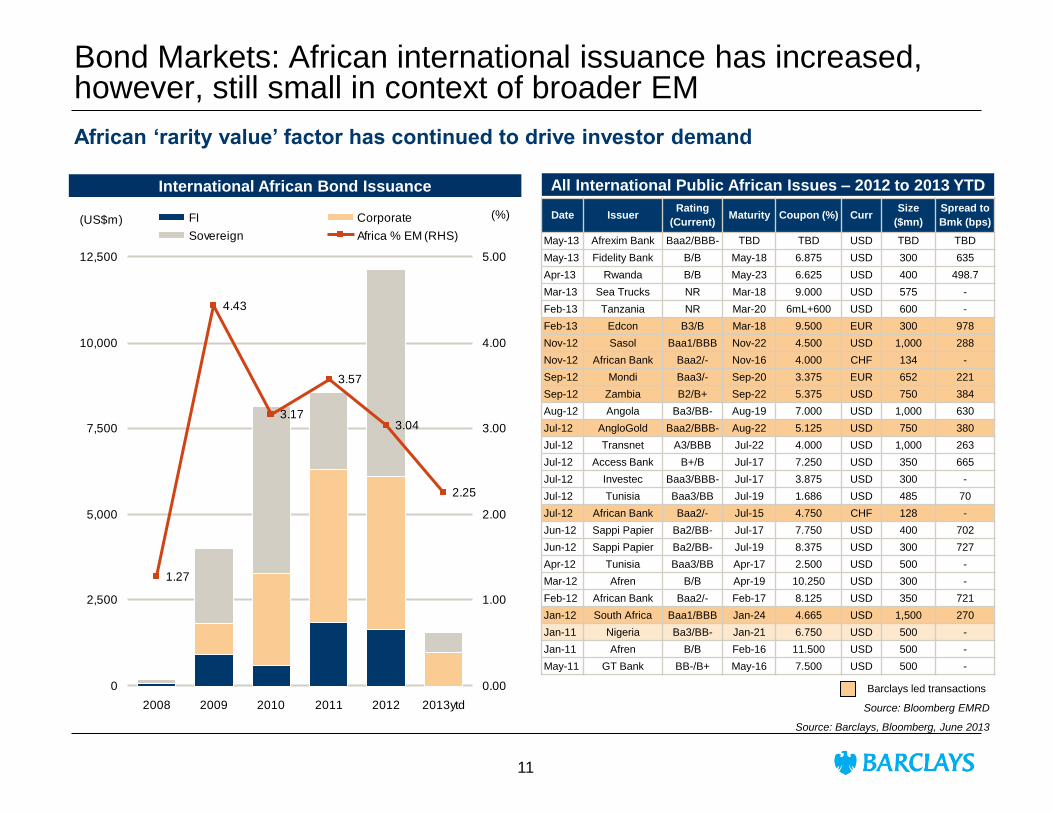
African „rarity value‟ factor has continued to drive investor demand
Bond Markets: African international issuance has increased, however, still small in context of broader EM
1.27
4.43
3.17
3.57
3.04
2.25
0
2,500
5,000
7,500
10,000
12,500
2008 2009 2010 2011 2012 2013ytd
(US$m)
0.00
1.00
2.00
3.00
4.00
5.00
FI Corporate
Sovereign Africa % EM (RHS)
(%) Date Issuer Rating
(Current) Maturity Coupon (%) Curr
Size
($mn)
Spread to
Bmk (bps)
May-13 Afrexim Bank Baa2/BBB- TBD TBD USD TBD TBD
May-13 Fidelity Bank B/B May-18 6.875 USD 300 635
Apr-13 Rwanda B/B May-23 6.625 USD 400 498.7
Mar-13 Sea Trucks NR Mar-18 9.000 USD 575 -
Feb-13 Tanzania NR Mar-20 6mL+600 USD 600 -
Feb-13 Edcon B3/B Mar-18 9.500 EUR 300 978
Nov-12 Sasol Baa1/BBB Nov-22 4.500 USD 1,000 288
Nov-12 African Bank Baa2/- Nov-16 4.000 CHF 134 -
Sep-12 Mondi Baa3/- Sep-20 3.375 EUR 652 221
Sep-12 Zambia B2/B+ Sep-22 5.375 USD 750 384
Aug-12 Angola Ba3/BB- Aug-19 7.000 USD 1,000 630
Jul-12 AngloGold Baa2/BBB- Aug-22 5.125 USD 750 380
Jul-12 Transnet A3/BBB Jul-22 4.000 USD 1,000 263
Jul-12 Access Bank B+/B Jul-17 7.250 USD 350 665
Jul-12 Investec Baa3/BBB- Jul-17 3.875 USD 300 -
Jul-12 Tunisia Baa3/BB Jul-19 1.686 USD 485 70
Jul-12 African Bank Baa2/- Jul-15 4.750 CHF 128 -
Jun-12 Sappi Papier Ba2/BB- Jul-17 7.750 USD 400 702
Jun-12 Sappi Papier Ba2/BB- Jul-19 8.375 USD 300 727
Apr-12 Tunisia Baa3/BB Apr-17 2.500 USD 500 -
Mar-12 Afren B/B Apr-19 10.250 USD 300 -
Feb-12 African Bank Baa2/- Feb-17 8.125 USD 350 721
Jan-12 South Africa Baa1/BBB Jan-24 4.665 USD 1,500 270
Jan-11 Nigeria Ba3/BB- Jan-21 6.750 USD 500 -
Jan-11 Afren B/B Feb-16 11.500 USD 500 -
May-11 GT Bank BB-/B+ May-16 7.500 USD 500 -
Barclays led transactions
All International Public African Issues – 2012 to 2013 YTD International African Bond Issuance
Source: Bloomberg EMRD
Source: Barclays, Bloomberg, June 2013
11

Bond Markets: Zambia’s Recent Inaugural Bond
A good example: where there is appetite – tap it
Initial issue at USD 500m
Upsized to USD 750m due to strong demand
56% of investors from the USA
16 times oversubscribed – investor appetite reached c. USD 12bn
10 year bond at a coupon of 5.375% - lower than that of the Kingdom of Spain
Have in mind:
1. Be prepared. The window may not always be open. It is susceptible to periods of
market weakness. Important to be ready to launch to take advantage of market
strengths
2. Bond Market funding may not always be appropriate for infrastructure financing given
the negative cost of carry
“Zambia - Investors clamour for debut bond”
“Zambia's record-breaking Eurobond rises in
first day trade”
“Review: Zambia gets blowout response on
USD debut”
12
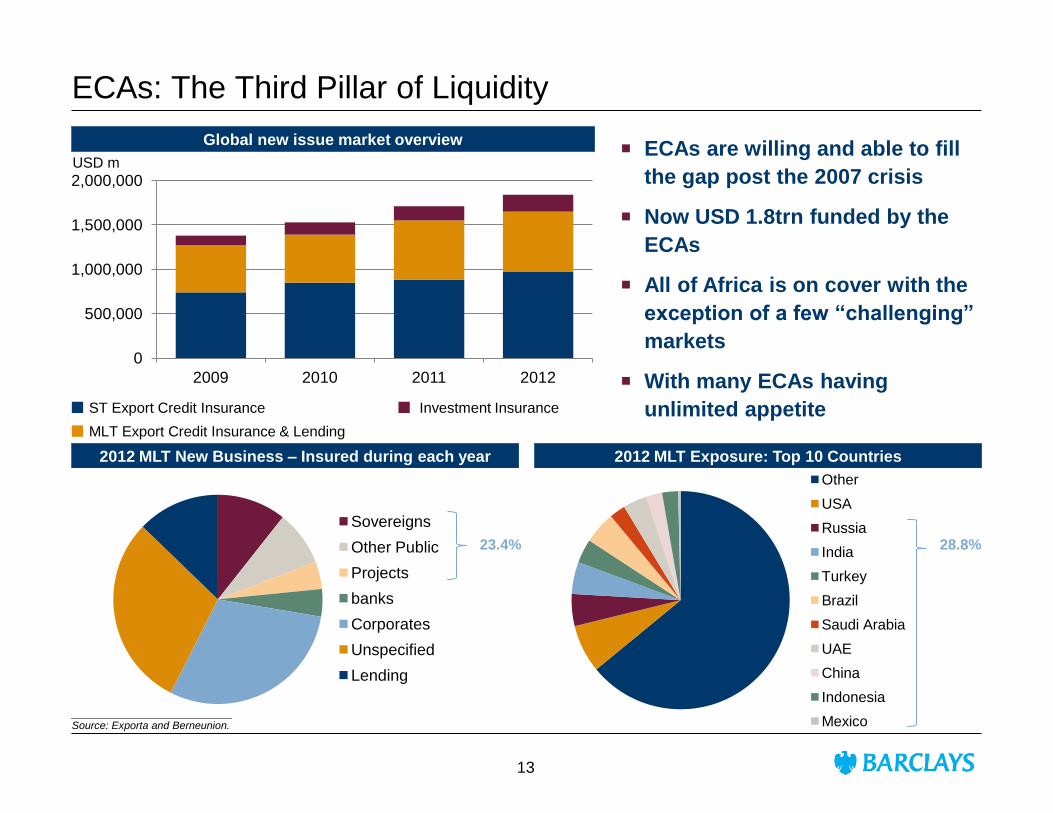
ECAs: The Third Pillar of Liquidity
ECAs are willing and able to fill
the gap post the 2007 crisis
Now USD 1.8trn funded by the
ECAs
All of Africa is on cover with the
exception of a few “challenging”
markets
With many ECAs having
unlimited appetite
0
500,000
1,000,000
1,500,000
2,000,000
2009 2010 2011 2012
Global new issue market overview
Sovereigns
Other Public
Projects
banks
Corporates
Unspecified
Lending
Other
USA
Russia
India
Turkey
Brazil
Saudi Arabia
UAE
China
Indonesia
Mexico
2012 MLT New Business – Insured during each year 2012 MLT Exposure: Top 10 Countries
___________________________ Source: Exporta and Berneunion.
USD m
23.4%
ST Export Credit Insurance
MLT Export Credit Insurance & Lending
Investment Insurance
28.8%
13
Key Benefits
ECAs are under lent to Africa
Many are extremely keen to do more and can provide FX & interest rate flexibility
Eligibility to tap ECAs is high as a significant % of Africa Infrastructure is imported
Don’t forget the 3 L’s:
Low margins: cheaper than the bank or bond markets and limited to no cost of carry
Longer tenors: build period + 18 years possible
Liquidity: separate pool & no crowd out
But preposition is key
ECA’s remit is to support exporters win contracts
It is therefore important to start negotiations with ECAs before the commercial contract is
signed
It is complex and it is never too early to start the process
ECA’s provide some key advantages For African Infrastructure Projects
14

ECA: Ghana’s New Benchmark ECA Financing
Government of Ghana
USD 175m
Financing of District Hospitals
Coordinating MLA
Issuing / LC bank
Bookrunner
Agent
Lender of GHS 55m uncovered portion
MLA and lender of ECA portion
MLA and lender of ECA portion
ECA
International law firm
Local law firm
October 2012
12.5 years USD funding with an all-in
cost of 3.72%
From mandate to close in 8 months
7 Hospitals
Integrated financing solution
Tender Panel providing an open and
transparent funding mechanism
Providing an all in cost that achieves
affordability criteria without aid / donor
support
15

Depth of liquidity
Maximum tenor
All in pricing
Low cost of negative carry
Flexibility to cover project risk
FX / Interest Rate flexibility
Ratings requirements
In summary:
In Summary: Tap all 3 in a balanced way
Loan Market Bond Market ECA Market
Not Required
Not Required
Required
Flexibility & local
cost funding
Tenor & depth of
appetite
Can attract liquidity
Susceptible to
periods of market
weakness
Cheapest & attracts
liquidity
Prepositioning and
limited to Goods &
Services imported
16

Disclaimer all ex Ita,MEast This document has been prepared by Barclays Bank PLC, acting through its investment bank (“Barclays”), for information purposes only. This document is an indicative summary of the terms and conditions of the securities/transaction described herein and may be amended, superseded or replaced by subsequent summaries. The final terms and conditions of the transaction and any related security will be set out in full in the applicable transaction confirmation, offering document(s), pricing supplement or binding transaction document(s).
This document shall not constitute an underwriting commitment, an offer of financing, an offer to buy or sell, or the solicitation of an offer to buy or sell any securities described herein, which shall be subject to Barclays’ internal approvals. No transaction or service related thereto is contemplated without Barclays’ subsequent formal agreement.
Barclays is acting solely as principal and not as advisor or fiduciary. Barclays does not provide, and has not provided, any investment advice or recommendation to you in relation to the transaction and/or any related securities described herein and is not responsible for providing or arranging for the provision of any general financial, strategic or specialist advice, including legal, regulatory, accounting, model auditing or taxation advice or services or any other services in relation to the transaction and/or any related securities described herein. Accordingly Barclays is under no obligation to, and shall not, determine the suitability for you of the transaction described herein. You must determine, on your own behalf or through independent professional advice, the merits, terms conditions and risks of the transaction described herein. You must also satisfy yourself that you are capable of assuming, and assume the risks of any such transaction. Neither Barclays nor any of its subsidiaries, affiliates or ultimate holding company, nor any of the subsidiaries or affiliates of such holding company (the“ Barclays Group”), nor any of their respective directors, officers, employees, representatives or agents, accepts any liability whatsoever for any direct, indirect or consequential losses (in contract, tort or otherwise) arising from the use of this document or its contents or reliance on the information contained herein.
Barclays does not guarantee the accuracy or completeness of information which is contained in this document and which is stated to have been obtained from or is based upon trade and statistical services or other third party sources. Any data on past performance, modelling, scenario analysis or back-testing contained herein is no indication as to future performance. No representation is made as to the reasonableness of the assumptions made within or the accuracy or completeness of any modelling, scenario analysis or back-testing. All opinions and estimates are given as of the date hereof and are subject to change. The value of any investment may fluctuate as a result of market changes. The information in this document is not intended to predict actual results and no assurances are given with respect thereto.
Barclays is a full service securities firm engaged in a wide range of businesses and from time to time, in the ordinary course of its business, Barclays and/or other parts of the Barclays Group may hold long or short positions and trade or otherwise effect transactions for their own account or the account of their customers in the securities referred to herein and/or the debt or equity securities, assets or loans (or any derivatives thereof) of the companies referred to herein. Additionally, Barclays and/or other parts of the Barclays Group may have investment and commercial banking, lending, asset management and other relationships with parties which are or may become involved in the transactions referred to herein and/or which may have interests which could potentially conflict with the interests of the recipient hereof. Barclays and/or other parts of the Barclays Group have in place policies and procedures to restrict the flow of information and to identify, consider and manage such potential conflicts of interest. Accordingly, you acknowledge and agree that no part of the Barclays Group is required to restrict its activities as a result of the provision of this document, and that all parts of the Barclays Group may undertake any activities without further consultation with or notification to you. Barclays shall not be required to account to you for any revenue or profits obtained in connection with any activities of the Barclays Group as referred to herein.
Barclays’ research analysts and research departments are independent from Barclays’ investment banking division and are subject to certain regulations and internal policies. Barclays’ research analysts may hold and make statements or investment recommendations and/or publish research reports with respect to any company referred to herein, the transactions contemplated herein or any person involved therein or related thereto that differ from or are inconsistent with the views or advice communicated by Barclays’ investment banking division.
Barclays Bank PLC is authorised and regulated by the UK Financial Services Authority and a member of the London Stock Exchange. Barclays Bank PLC is registered in England No. 1026167. Registered Office: 1 Churchill Place, London E14 5HP. Copyright Barclays Bank PLC, 2013 (all rights reserved).
This document is confidential, and no part of it may be reproduced, distributed or transmitted without the prior written permission of Barclays.
17