Embed Size (px)
Citation preview

The Financial Sector4Sources and Uses of Funds of theFinancial System
The improved economic activity in 1999 was reflectedin the total assets of the financial system which roseby 6.9% to RM1,171 billion at the end of 1999 (adecline of 1.7% in 1998). This was attributable to theincrease in the assets of both the non-bank financialintermediaries (NBFIs) (11.6%) and the banking system(4.8%). The banking system recorded a significant
turnaround in the growth of its assets, compared witha decline of RM45.3 billion or 5.6% in 1998.Nevertheless, given the increased pace of growth ofthe assets of the NBFIs, the banking system’s shareof the financial system assets declined marginally from70% at the end of 1998 to 68.6% at the end of 1999.Within the banking system, the assets of the commercialbanks (including Islamic banks) registered an increaseof 5.2% compared with a decline of 5.4% in 1998,reflecting mainly the increase in deposit placementswith other domestic financial institutions. The totalassets of the finance companies declined further butat a moderate rate, reflecting the more favourableeconomic environment. The decline in assets of thefinance companies reflected the constraint in theirlending activities arising from the merger and otherrestructuring exercises undertaken in the industry, aswell as the absorption of eight finance companies bythe parent commercial banks.
For the NBFIs, total assets rose faster by 11.6%in 1999, compared with a growth of 8.8% in 1998.Consequently, their share of total financial systemassets increased further from 30% at the end of 1998to 31.4% at the end of 1999. The higher growth wasprincipally supported by strong expansion in the assetsof the provident, pension and insurance funds (14%),which accounted for 78.7% of the increase in the totalassets of the NBFIs. Total assets of the developmentfinance institutions also continued to grow, albeit at aslower rate of 13.2% (28.8% in 1998). The growthwas due mainly to the increase in loans extended byBank Pembangunan dan Infrastruktur Malaysia Berhad,following the large increase in its paid-up capital toRM1 billion to enable the bank to undertake financingof infrastructure projects.
Concomitant with the improved economic activity,large trade surplus, and general rise in income andbusiness profits during the year, deposits mobilised bythe financial institutions recorded a stronger increaseof 10.9% in 1999 (2.2% in 1998). As a result, depositscontinued to be the main source of funds for thefinancial system, accounting for 47.9% of total sourcesof funds at the end of 1999 (46.1% in 1998). The
1998 1999p
Banking system 145.3 37.2 803.9 68.6Bank Negara Malaysia 15.8 22.3 147.0 12.6Commercial banks1 –26.3 24.0 483.2 41.3Finance companies –28.8 –7.7 115.9 9.9Merchant banks –5.1 0.0 39.2 3.3Discount houses –1.0 –1.4 18.6 1.6
Non-bank financialintermediaries 26.5 38.1 367.1 31.4
Provident, pension andinsurance funds 24.0 30.0 243.6 20.8
Employees ProvidentFund 16.2 20.0 168.6 14.4
Other provident &pension funds 3.4 3.5 28.5 2.4
Life insurance funds 3.1 5.5 32.3 2.8General insurance funds 1.4 1.0 14.2 1.2
Development financeinstitutions2 4.4 2.6 22.4 1.9
Savings institutions3 –0.3 1.8 20.9 1.8
Other financialintermediaries4 –1.7 3.7 80.3 6.9
Total -18.8 75.2 1 ,171.0 100.0
1 Includes Bank Islam Malaysia Berhad and Bank Muamalat MalaysiaBerhad (since 1999).
2 Includes Malaysian Industrial Development Finance Berhad,BankPertanian Malaysia, Borneo Development Corporation, Sabah
Development Bank Berhad, Sabah Credit Corporation, Export - ImportBank Malaysia Berhad, Bank Pembangunan dan InfrastrukturMalaysia Berhad and Bank Industri Malaysia Berhad (Renamed “BankIndustri dan Teknologi Malaysia Berhad” as of 28 February 2000).
3 Includes National Savings Bank, Bank Kerjasama Rakyat and co-operative societies.
4 Includes unit trusts (ASN, ASB, ASW 2020 and ASM Mara), buildingsocieties, Pilgrims Fund Board, Credit Guarantee Corporation,
Cagamas Berhad, leasing companies, factoring companies andventure capital companies.
p Preliminary
RM billion
As at end-1999p
Annual change
Table 4.1Assets of the Financial System
%share

banking institutions (comprising commercial banks,finance companies, merchant banks and discounthouses) accounted for 83.1% of total deposits mobilisedby the financial system (86% in 1998). Among thebanking institutions, the significant growth of depositsplaced with the commercial banks more than offsetthe decline in deposits mobilised by the financecompanies and merchant banks.
The non-financial private sector (comprisingindividuals and business enterprises) accounted forthe bulk (62.6%) of the outstanding deposits withthe financial institutions. The faster growth in depositsof this group with the financial system (5.4%,compared with 3.7% in 1998) reflected improvedincomes as economic expansion and stock marketactivities gathered momentum in 1999. Fixeddeposits continued to account for the bulk of depositsplaced by the non-financial private sector, accounting
for 95.1% of the increase in total deposits of thesector (118.4% in 1998). By maturity, fixed depositscontinued to be concentrated in shorter-endmaturities. At the same time, both demand andsavings deposits also registered significant increasesof 28% and 20.8% respectively.
Contractual savings with provident fundsand contributions to insurance funds remained asmajor sources of funds for the financial system,expanding by 13.5% (11.4% in 1998), to accountfor 18.2% of the outstanding total funds of thefinancial system. With the exception of borrowingsand other liabilities, other sources of funds alsoregistered increases. Capital and reserves of thefinancial system increased by 6.1% (–2.9% in 1998),consonant with healthier business profits and gainsfrom investments in the stock market recorded duringthe year. Funds obtained from other financialinstitutions registered a small increase in 1999,compared with a large reduction in 1998 which wasdue to the reduction in the statutory reserverequirement from 13.5% to 4%.
1998 1999p
% share
Sources:Capital and reserves –3.0 6.3 109.6 9.4Currency –4.0 9.9 30.5 2.6Deposits1 10.7 55.3 560.6 47.9Borrowings –24.0 –0.2 8.5 0.7Funds from other financial
institutions1 –83.5 1.6 72.7 6.2Insurance and
provident funds 19.3 25.3 213.0 18.2Other liabilities 65.9 –23.1 176.1 15.0
Total -18.8 75.2 1,171.0 100.0
Uses:Currency –0.8 4.6 7.9 0.7Deposits with other
financial institutions –67.2 28.8 180.6 15.4Bills –11.1 6.1 16.4 1.4
Treasury –0.1 –0.1 3.7 0.3Commercial –10.9 6.2 12.8 1.1
Loans and advances –1.3 –12.5 471.9 40.3Securities 17.5 14.9 239.5 20.5
Malaysian Government 5.5 3.6 75.1 6.4Foreign 0.0 0.3 1.5 0.1Corporate 12.8 11.7 156.8 13.4Others –0.7 –0.7 6.1 0.5
Gold and foreign exchangereserves 39.2 17.5 113.8 9.7
Other assets 4.8 15.8 140.9 12.0
1 Effective 1998, the statutory reserves of banking institutions have beenreclassified as "Funds from other financial institutions" rather than"Deposits". In this regard, data from prior years have also been revisedaccordingly.
p Preliminary
RM billion
As at end-1999p
Table 4.2Sources and Uses of Funds of the Financial System
Annual change
Table 4.3Non-Financial Private Sector Deposits 1 with theFinancial System 2
Annual change
1998 1999p
%share
Deposits3 with:Commercial banks 5.0 21.5 250.1 71.2Finance companies 4.0 –7.3 59.0 16.8Merchant banks –0.5 –0.4 10.9 3.1Discount houses 0.0 0.2 3.9 1.1National Savings Bank 0.6 0.9 8.0 2.3Others 2.7 3.1 19.1 5.4
Total 11.9 18.0 351.1 100.0
Demand deposits –5.2 9.0 41.2 11.7Fixed deposits 14.0 17.1 239.1 68.1Savings deposits 2.3 9.0 52.5 14.9NIDs4 0.1 –15.5 2.9 0.8Repos5 0.6 –1.6 15.5 4.4
Fixed depositsOf which:
Up to 1 year 19.6 18.9 220.8 62.9More than 1 year –5.5 –1.7 18.2 5.2
1 Refers to deposits of business enterprises (excluding NFPEs) andindividuals.
2 Excludes provident, pension and insurance funds, and other financialintermediaries.
3 Refers to demand, savings and fixed deposits, negotiable instruments ofdeposit and repos.
4 Refers to negotiable instruments of deposit.5 Refers to repurchase agreements.p Preliminary
RM billion
As at end-1999p
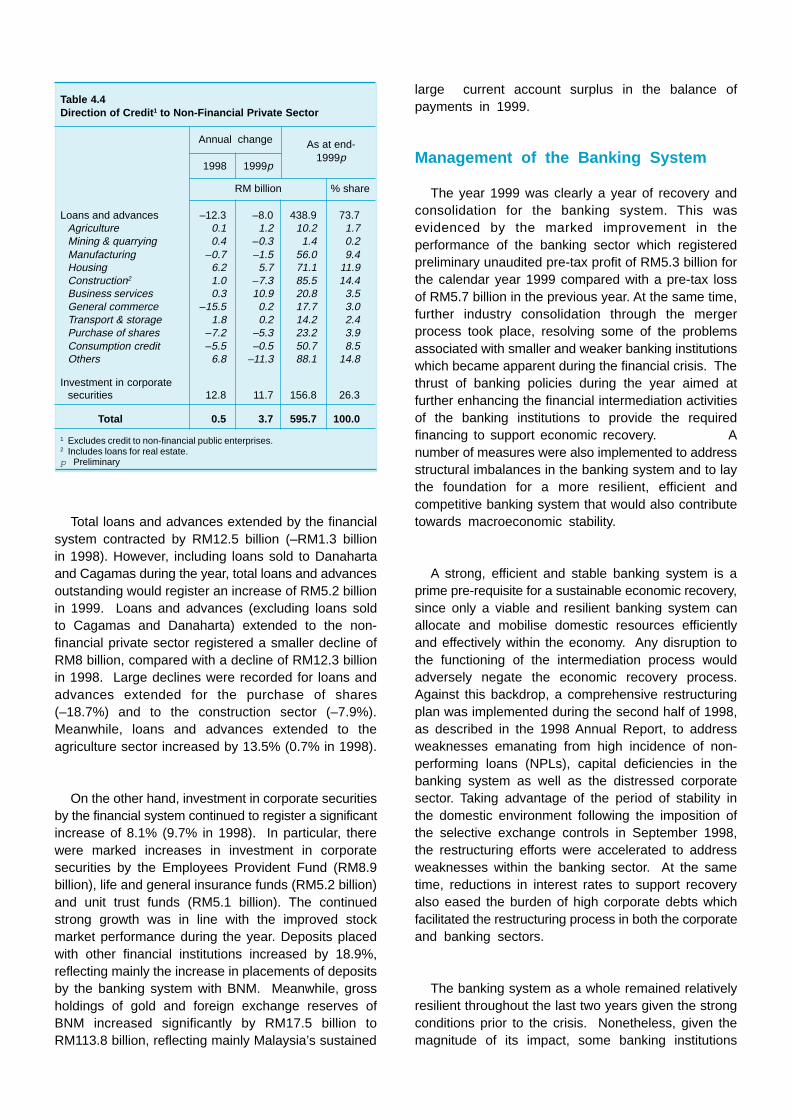
Total loans and advances extended by the financialsystem contracted by RM12.5 billion (–RM1.3 billionin 1998). However, including loans sold to Danahartaand Cagamas during the year, total loans and advancesoutstanding would register an increase of RM5.2 billionin 1999. Loans and advances (excluding loans soldto Cagamas and Danaharta) extended to the non-financial private sector registered a smaller decline ofRM8 billion, compared with a decline of RM12.3 billionin 1998. Large declines were recorded for loans andadvances extended for the purchase of shares(–18.7%) and to the construction sector (–7.9%).Meanwhile, loans and advances extended to theagriculture sector increased by 13.5% (0.7% in 1998).
On the other hand, investment in corporate securitiesby the financial system continued to register a significantincrease of 8.1% (9.7% in 1998). In particular, therewere marked increases in investment in corporatesecurities by the Employees Provident Fund (RM8.9billion), life and general insurance funds (RM5.2 billion)and unit trust funds (RM5.1 billion). The continuedstrong growth was in line with the improved stockmarket performance during the year. Deposits placedwith other financial institutions increased by 18.9%,reflecting mainly the increase in placements of depositsby the banking system with BNM. Meanwhile, grossholdings of gold and foreign exchange reserves ofBNM increased significantly by RM17.5 billion toRM113.8 billion, reflecting mainly Malaysia’s sustained
large current account surplus in the balance ofpayments in 1999.
Management of the Banking System
The year 1999 was clearly a year of recovery andconsolidation for the banking system. This wasevidenced by the marked improvement in theperformance of the banking sector which registeredpreliminary unaudited pre-tax profit of RM5.3 billion forthe calendar year 1999 compared with a pre-tax lossof RM5.7 billion in the previous year. At the same time,further industry consolidation through the mergerprocess took place, resolving some of the problemsassociated with smaller and weaker banking institutionswhich became apparent during the financial crisis. Thethrust of banking policies during the year aimed atfurther enhancing the financial intermediation activitiesof the banking institutions to provide the requiredfinancing to support economic recovery. Anumber of measures were also implemented to addressstructural imbalances in the banking system and to laythe foundation for a more resilient, efficient andcompetitive banking system that would also contributetowards macroeconomic stability.
A strong, efficient and stable banking system is aprime pre-requisite for a sustainable economic recovery,since only a viable and resilient banking system canallocate and mobilise domestic resources efficientlyand effectively within the economy. Any disruption tothe functioning of the intermediation process wouldadversely negate the economic recovery process.Against this backdrop, a comprehensive restructuringplan was implemented during the second half of 1998,as described in the 1998 Annual Report, to addressweaknesses emanating from high incidence of non-performing loans (NPLs), capital deficiencies in thebanking system as well as the distressed corporatesector. Taking advantage of the period of stability inthe domestic environment following the imposition ofthe selective exchange controls in September 1998,the restructuring efforts were accelerated to addressweaknesses within the banking sector. At the sametime, reductions in interest rates to support recoveryalso eased the burden of high corporate debts whichfacilitated the restructuring process in both the corporateand banking sectors.
The banking system as a whole remained relativelyresilient throughout the last two years given the strongconditions prior to the crisis. Nonetheless, given themagnitude of its impact, some banking institutions
Table 4.4Direction of Credit 1 to Non-Financial Private Sector
Annual change
1998 1999p
RM billion % share
Loans and advances –12.3 –8.0 438.9 73.7Agriculture 0.1 1.2 10.2 1.7Mining & quarrying 0.4 –0.3 1.4 0.2Manufacturing –0.7 –1.5 56.0 9.4Housing 6.2 5.7 71.1 11.9Construction2 1.0 –7.3 85.5 14.4Business services 0.3 10.9 20.8 3.5General commerce –15.5 0.2 17.7 3.0Transport & storage 1.8 0.2 14.2 2.4Purchase of shares –7.2 –5.3 23.2 3.9Consumption credit –5.5 –0.5 50.7 8.5Others 6.8 –11.3 88.1 14.8
Investment in corporatesecurities 12.8 11.7 156.8 26.3
Total 0.5 3.7 595.7 100.0
1 Excludes credit to non-financial public enterprises.2 Includes loans for real estate.p Preliminary
As at end-1999p

suffered substantial losses arising primarily from highlevels of NPLs which rapidly eroded their capital. Inorder to prevent further deterioration in the financialhealth of these banking institutions, BNM assumedcontrol over the operations of four banking institutions,namely Kewangan Bersatu Berhad, MBf FinanceBerhad, Sabah Finance Berhad and Sime MerchantBankers Berhad. The move also aimed to pre-emptivelycontain any possibility of a systemic failure in thesystem. With the exception of MBf Finance Berhad,the control over the operations and management ofthe three ailing banking institutions still remain underBNM. The three banking institutions have also beenrestricted from engaging in new lending activities soas to preserve their balance sheets and variousschemes have been worked out to address problemsrelating to these institutions. As part of the rescueoperations, Kewangan Bersatu Berhad and SabahFinance Berhad will be absorbed by Mayban FinanceBerhad and Multi-Purpose Bank Berhad respectively.The purchase of assets and assumption of liabilitiesof these weak institutions by stronger entities willensure that the operations and services of the formerwill not be disrupted. Meanwhile, resolution of SimeMerchant Bankers Berhad was achieved via an opentender exercise conducted towards end-1998. Theweak capital position of MBf Finance Berhad wasresolved through capital injection amounting to RM2.3billion in the form of tier-1 capital by Danamodal NasionalBerhad (Danamodal). Danamodal has also appointedits nominees to oversee its investment as well as toenhance the effectiveness of the Board andmanagement of MBf Finance Berhad.
In addition, two of the larger domestic commercialbanks, namely Bank Bumiputra Malaysia Berhad andSime Bank Berhad, also incurred large losses as a resultof substantial provisions arising from high NPLs. Giventhe size and the potential impact of these institutionson the overall system stability and depositors’ confidence,these two institutions were merged with strongercommercial banks. Bank Bumiputra Malaysia Berhadwas absorbed by Bank of Commerce (M) Berhad andSime Bank Berhad was taken over by RHB Bank Berhad.To ensure that the mergers would not weaken thestrength of the acquiring banks, the distressed assetsof the weaker institutions were removed to subsidiariesof Pengurusan Danaharta Nasional Berhad (Danaharta)that were specifically set up to manage the distressedassets of these banks prior to the merger and for asubsequent period which ranging from 12 to 18 monthsfrom the date of their mergers. The two mergersinvolving Sime Bank Berhad and Bank BumiputraMalaysia Berhad were successfully completed on30 June 1999 and 30 September 1999 respectively.
Following the accelerated implementation of therestructuring plan, together with lower interest ratesand improved liquidity conditions, the strains on thebanking sector began to subside. The removal of NPLsby Danaharta and recapitalisation by Danamodal placedthe banking sector in a better position to undertakethe intermediation function more effectively.Furthermore, the success of Danaharta and Danamodalin achieving their targets six months ahead of schedulehas enabled the banking sector to play its rightful rolein supporting economic activities.
The ample liquidity in the banking system and lowinterest rates means that borrowers have greater andeasier access to financing and are less burdened byhigh debt servicing cost. Nevertheless, as in anyeconomy recovering from a recession, demand forlarge-scale and capital investment-related financinghas been slow as several industries were experiencingexcess capacity. Until the economy is operating closeto its full capacity, most of the financing needs duringthis period are focused on working capital requirements,leaving a large proportion of approved and committedfacilities largely unutilised. The rate of loan repaymentshas also been high as businesses optimise theirresources by utilising surplus cash to ease theirdependence on bank borrowings and reduce theirleverage. The high rate of loan repayments in turnreflects the higher turnover in economic activities whichhave increased the capacity of borrowers to repay theirloans. Such repayment in itself while benefitingbusinesses in reducing their leverage, was alsoinstrumental in enhancing the stability of the bankingsector as it improved the quality of assets of bankinginstitutions, thus resulting in healthier balance sheets.
On the prudential front, BNM recognised thatinjection of capital funded by short-term borrowingswould result in a high incidence of double leveragingin the banking system which could increase thevulnerability of the banking system. The mismatchbetween long-term capital investments and short-term funding may exert undue pressure on thebanking institutions to generate the necessary returnsin the short run to enable the shareholders to servicetheir debts at the expense of long term risks. Tocontain such imprudent practices, BNM now requiresthat any new capital injection by shareholders ofbanking institutions must be funded through non-debt sources or very long-term debt instruments.Banking institutions are also no longer allowed tolend to their shareholders with controlling and/orinfluential interest to minimise occurrence ofconnected lending within the banking institution.
This new measure effectively complements theexisting rules of prohibiting banking institutions fromlending to their directors and officers. This prohibitionis aimed at curtail ing any potential misuseand irregular practices by the shareholders, beingowners of the institutions themselves in steeringcredit decisions related to themselves or partiesrelated to them.
The crisis has also highlighted the weaknesses inthe management of some banking institutions. Giventhe nature of banking operations in assuming andmanaging risks, the strength and effectiveness of itsmanagement would undoubtedly affect the strength ofthe banking institution itself. Indeed, the first line ofdefence against unsound banking institutions iscompetent banking management. Thus, to ensure thatthe banking institutions continue to be managed bycompetent management, equipped with a high degreeof integrity and professionalism, the suitability of thechief executive officers and directors of bankinginstitutions will now be reviewed once every two years.
During the recent financial crisis, it was evident thata fragmented banking sector is highly vulnerable toshocks and can pose systemic risks to the bankingsector. Growing competition and strong pressuresemerging from the external front to further liberalisethe banking sector has also clearly shown that thedomestic banking sector can no longer remainprotected. The financial liberalisation envisaged underthe ASEAN Framework Agreement on Services andthe General Agreement on Trade in Service, to graduallyremove barriers to entry and access among the ASEANcountries and among the WTO (World TradeOrganisation) Members, has highlighted the crucialneed for the domestic banking sector to gear itself andbe able to meet the challenges and competition arisingfrom increasing globalisation and technologicaladvancements. Furthermore, in the global market, rapidconsolidation of banking institutions is now taking placeto take advantage of economies of scale and tappotential synergies.
The banking crisis in the mid-1980s had clearlyhighlighted the vulnerabilities of the weaker bankinginstitutions which were not adequately capitalised towithstand shocks. Against this backdrop, BNM hasalways recognised the importance of and the needfor consolidation in the banking sector in order toattain the critical mass to meet the demands of thechanging domestic economic structure, futurechallenges from globalisation and liberalisation as well
as to contribute towards sustainable economic growth.During the economic boom in the late 1980s and early1990s, calls for rationalisation and consolidation wereoften ignored. The buoyant economic growth duringthat period has led to significant improvements in theperformance of the banking system. While some weresimply satisfied with the returns earned on theirinvestments and did not realise the urgency for furtherstrengthening and consolidation, others had resortedto short-term funding for their capital expansion.Voluntary mergers were not forthcoming. Since themid-80s crisis, only two market-oriented mergers weresuccessfully implemented, between Kwong Yik BankBerhad and DCB Bank Berhad and between ChungKhiaw Bank (Malaysia) Berhad and United OverseasBank (Malaysia) Berhad.
The sooner the domestic banking sector in Malaysiaundergoes a consolidation and rationalisation exercise,the more well-placed will the domestic banking sectorbe to meet future challenges. In this regard, the mergerprogramme for the finance company industry initiatedin 1998 was extended to the domestic banking sectoras a whole in 1999. Specifically, all domestic bankinginstitutions were given the flexibility to form their ownmerger groups and choose their own leader in eachgroup to lead the merger process and revert to BNMby end-January 2000. In response to this approach,approval was granted for the formation of 10 bankinggroups to be led by Malayan Banking Berhad, RHBBank Berhad, Public Bank Berhad, Bumiputra-Commerce Bank Berhad, Multi-Purpose Bank Berhad,Hong Leong Bank Berhad, Perwira Affin Bank Berhad,Arab-Malaysian Bank Berhad, Southern Bank Berhadand EON Bank Berhad, each with minimumshareholders’ funds of RM2 billion and asset base ofat least RM25 billion. With the formation of these 10banking groups, the number of domestic bankinginstitutions would be reduced substantially from thecurrent 54 to 29 banking institutions. The consolidationexercise would enable the banking groups to reapmaximum synergy and enhance their profitability andefficiency. To ensure that the industry consolidationexercise is not delayed, BNM has set the target dateof end-December 2000 for the completion of the entireconsolidation exercise.
Prudential regulation of banking institutions isnecessary as these institutions serve as theintermediaries for the productive mobilisation anddistribution of capital within the economy and theprime channels of monetary policy. In order to maintainthe safety and soundness of the financial system aswell as the position of the banking system to thrive

within a dynamic and competitive environment,prudential regulations will continue to be emphasised.In this regard, additional prudential regulations will beintroduced in the near future. These include measuresto inculcate sound and effective credit risk management,refining the existing risk-based capital adequacyframework, developing a system of prompt correctivemeasures as well as limiting the Government’s financialsafety net so that it will not contribute to excessiverisk-taking and not undermine market discipline.
The recent experience showed that there is atendency for bankers as well as corporate players toforget the lessons learned from the crisis in the mid-1980s. Despite the costly experience in the previousrecession stemming from imprudent and excessiveexposures to the property sector, similar over-concentration was also observed during the recentcrisis. In the pursuit of high returns in the propertymarket, substantial amount of resources was channeledto finance various real estate activities. Such decisionswere often induced by the wrong assumption thatcollateral value alone is sufficient to demonstratecreditworthiness and repayment capacity of theborrowers. This imprudent lending practice, on the partof the banking institutions, and the over-optimisticexpectations of the property developer, had contributedto a large overhang in certain segments of the propertymarket, in particular, the high-end residential propertiesand shophouses as well as commercial properties.Therefore, to contain further accumulation in the supplyof high-end residential and commercial properties andto clear the abundant stock of unsold properties createdby the recession, financing restriction was imposed onthe provision of bridging finance for the developmentof residential properties and shophouses valued inexcess of RM250,000 per unit as well as commercialproperties. This prohibition is aimed at preventingfurther downward adjustments in the different segmentsof the property market. At the same time, two homeownership campaigns were organised during the yearat the national level to reduce the overhang of propertiesin the market. The two campaigns were extremelysuccessful with a total of RM6.4 billion worth ofproperties sold during the campaign periods. Thelending restriction to the high-end property market isalso expected to free up resources to other sectorsof the economy, including for the development ofaffordable residential properties where demand hasremained high even during the crisis. Moving forward,it is imperative for the banking institutions to rememberthat property booms are often fueled by the easy andexcessive credit and oversupply can result. Given thelong cycles in property prices, the challenge is toensure that the next generation of credit officers and
managers do not repeat the same mistake in thefuture. In this regard, BNM has issued a consultativepaper to the banking industry on “Minimum Standardson Credit Risk Management” in November 1999, whichoutlines the minimum principles which bankinginstitutions should observe in their credit operations.These minimum standards aim to develop and enhancecredit risk management standards in the banking sector.
The crisis has also highlighted the losses sufferedby the banking institutions due to weak internal andrisk management controls. The mismatch between therisk profile of a banking institution’s portfolio vis-à-visthe minimum capital requirement led to anoverstatement of the banking institution’s capability inabsorbing potential shocks. Generally, these bankinginstitutions would also be the ones experiencing higherlevels of NPLs and capital deficiencies. Suchobservation also highlighted the deficiencies of thepresent capital adequacy framework which classifiesthe assets of banking institutions into five broad riskweight categories, without taking into considerationthe risk profile of the loan exposures and the inherentstrength or weakness of the banking institutions inmanaging credit risk. Preliminary studies are currentlybeing conducted to refine the capital adequacyframework to reflect capital charges whichcommensurate with the risk profile and strength of riskmanagement of banking institutions.
The setting up of Danamodal to address therecapitalisation of weak banking institutions duringthe crisis has also shown that timely supervisoryintervention is critical to minimise capital erosionand subsequent potential financial costs to theGovernment. On a larger scale, it would also wardoff the contagion effect of a bank-specific crisis frombecoming endemic, which would have adverselyaffected the stability of the banking system as awhole. In this regard, a system of prompt correctivemeasures is being developed and would beintroduced to act as a first line of action againstbanking institutions which are found to be operatingin a manner that would potentially threaten theirfuture solvency. The measures would comprise aset of actions that would automatically be institutedif certain transparent prudential indicators as specifiedby BNM were triggered. This would ensure thatcapital can be conserved and that further build-upof risks in an ailing or potentially ailing institutioncan be avoided. While this is not a pre-emptivemeasure to prevent an institution from failing, itwould certainly act as a damage control instrumentto minimise capital erosion by allowing BNM to

undertake the necessary course of action to containand rectify the problems.
The concept of disassociating non-supervisedentities from banking groups would be introducedprimarily to ensure that the obligation of theGovernment in assuring the safety of deposits wouldnot be extended to other non-supervised institutionsof a financial group. In the past, instances haveemerged in which the failure of a non-bank entityhad affected the confidence of the public in thebanking entity within the same financial group. Tominimise the occurrence of such events in the future,a bank holding company would have to be set upseparately to hold only banking institutions andsubsidiaries which are supervised by BNM and theSecurities Commission. The harmonisation of holdingcompanies that merely hold investments insupervised entities across all banking groups wouldalso facilitate the implementation of prudentialregulations on bank holding companies in the future.
As a developing nation, Malaysia requires a strongand efficient banking system that is resilient and capableof supporting the financing needs of the economy inits next phase of development so that the nation cancontinue to achieve a strong and sustainable growthin the future. The development of a resilient, efficientand competitive banking sector however, cannot beachieved within a short period of time. It requiresconsiderable effort and commitment as well as acomprehensive set of policies which need to be nurturedand implemented over time. The merger andconsolidation exercise is only one of the necessary pre-conditions to create strong, efficient and competitivedomestic banking institutions and cannot on its own beexpected to fully realise these objectives. This needsto be supplemented and complemented with othermeasures which would need to be introduced over themedium and longer-term.
In this regard, BNM has embarked on acomprehensive masterplan for the Malaysian financialsystem that focuses on building the foundation andcharting the strategic direction of the banking sectorfor the next 10 years. The masterplan will providea clear and common long-term vision for thedevelopment of a resilient, efficient and competitivebanking sector which is able to operate effectively inan environment of emerging new technologicaladvances and more sophisticated consumer demands.The objective of the masterplan is not only to ensurethat the banking sector continues to be able to meet
the needs of the changing domestic environment butalso to play a catalytic role in the transformation ofthe economy. Within this broad objective, the mainthrust will be to develop a core of strong and forwardlooking domestic banking institutions which will forman integral part of the Malaysian banking system. Themasterplan will identify key issues for the Malaysianbanking sector as well as formulate strategies andaction plans that need to be pursued over the mediumto long term to increase the resilience, competitivenessand dynamism of the banking institutions in the contextof the impending challenges of a globalised andliberalised environment. In doing so, a more holisticassessment of the banking sector will be undertakento ensure that reforms are co-ordinated and objective-oriented. The masterplan will also identify the optimalregulatory and supervisory framework to be adoptedby BNM to achieve these objectives.
The years ahead will undoubtedly witness significantchanges within the banking sector. A major pre-requisite to be able to adjust and adapt to this changingenvironment is the development of a sound and strongfinancial system and institutions. In this regard, BNMhas and will continue to consciously develop a modernand sophisticated financial system which will effectivelymobilise and allocate resources for productive use intandem with the rapid transformation of the economy.For the banking institutions, in rising to this challenge,greater focus on improving efficiency andcompetitiveness needs to be accorded. The impetusto the improvements would rely on innovation, flexibility,skill enhancements, customer-orientation, productdevelopment and the need to pay close attention tothe return on equity and consolidation of the bankingsector. In this context, the importance of achievingcritical size would assume greater significance in orderfor banking institutions to be able to reap the gainsfrom economies of scale and reduce costs and excesscapacity, as well as enable higher spending oninformation technology to remain efficient andcompetitive. Larger institutions that are well-capitalisedand well-managed would be able to position themselvesto meet the challenges of an increasingly liberalisedoperating environment and market driven approachthat are unfolding across the globe. A core of strong,efficient, resilient and competitive banking institutionswould not only be able to withstand future shocks,thereby minimising the adverse implications onmacroeconomic stability, but would also enhance thepayments system infrastructure and market surveillancemechanism to monitor capital flows and other sourcesof risk in the banking system and the economy as awhole. The merger programme is an important steptowards accomplishing this objective.

Abolishment of the Two-Tier RegulatorySystem (TTRS): The Two-Tier Regulatory System(TTRS) for banking institutions was abolished on10 April 1999. As a result, incentives that werepreviously accorded to Tier-I banking institutionswere made available to all institutions, subject tothe approval of BNM. The blanket approvalpreviously granted to all Tier-I domestic banks toopen new branch offices was withdrawn.
The TTRS, with its emphasis on absolutecapital size as one of the pre-requisites for theattainment of Tier-I status, led banking institutionsto embark on over-zealous capital expansionprogram funded by shareholders’ borrowings. As aresult, significant pressures were exerted on themanagement of these banking institutions toaggressively increase their loan portfolio in orderto generate the requisite returns to meet debtservicing obligations of their shareholders. This, inturn, contributed to poor credit decisions in a numberof banking institutions which subsequentlyaffected their asset quality, particularly during theeconomic downturn.
Approval for Increases in Capital Funds:Arising from lessons learnt under the TTRS, BNM,with effect from 14 April 1999, requires futurecapitalisation of banking institutions by controllingshareholders to come from non-obligatorysources of financing such as equity, internallygenerated funds and very long-term debt(preferably by way of bond issue) of at least 10years maturity. Banking institutions which seekBNM’s approval to issue new capital (ordinaryshares, preference shares, hybrid capital andsubordinated term loans) will have to provide BNMa statement from their controlling shareholdersparticipating in the capital injection on the degreeof leverage they will incur in raising the funds tobe injected into the banking institution.
Prohibition on Lending to Controlling and/orInfluential Shareholders: With effect from 4 August1999, BNM’s guideline on ‘Prohibition of loans to
Banking Measures in 1999
its directors, staff and their interested corporations’(BNM/GP6) was expanded to also prohibit thegranting of credit facilities to shareholders withcontrolling and/or influential interest in the bankinginstitution and to any related companies of theshareholder, any firm in which the shareholder hasinterest as a partner, manager, agent or guarantorand any person for whom the shareholder is aguarantor. Existing credit facilities granted tocontrolling/influential shareholders and theirrelated parties would be allowed until theirmaturity or the next review date. An individual orlegal entity shall be deemed to be a controllingshareholder of a banking institution if it fulfilseither one of the following criteria:- a) controlsmore than 50% of the voting rights; b) holds morethan 50% of the issued share capital; c) controlsthe composition of the board of directors; d) hasthe power to appoint or remove all or a majorityof the directors; or e) controls the controllingshareholder of the banking institution. Influentialinterest is defined as:- a) if the person, togetherwith other parties which he controls or acts inconcert with, holds 20% or more interest in thevoting rights of the banking institution; or b) if theperson has the power to appoint at least oneperson to the board of directors.
Amendments to the New Liquidity Framework:On 30 September 1999, BNM extended thetransitional period for banking institutions to crossover to the new liquidity framework by another yearto 31 December 2000.
The extension of the transitional period is toaccommodate the integration efforts of the mergerprogramme among banking institutions.
Cagamas Berhad Bonds - Liquid Asset Status:With effect from 1 April 1999, holdings of bondsissued by Cagamas Berhad to finance the purchaseof commercial and industrial property loans can beclassified as liquid assets for purposes of meetingbanking institutions’ liquid asset ratio requirementunder the old liquidity framework.
In 1997, Cagamas Berhad expanded its housingloan securitisation scheme to encompasscommercial and industrial property loans. Unlikebonds issued to finance housing loans, bondsissued to finance the purchase of commercialand industrial property loans initially did notqualify as liquid assets. This had led to a disparityin pricing among bonds issued by CagamasBerhad. As at 31 December 1999, totaloutstanding bonds issued by Cagamas Berhadfor this purpose amounted to RM699 million. Tostreamline incentives given to Cagamas for itsloan securitisation activity and to remove thedisparity in the pricing among Cagamasbonds, all bonds issued by Cagamas Berhadhave been designated as liquid assets under theold liquidity framework.
Investment in “BB” Rated Private DebtSecurities: With effect from 19 July 1999, bankinginstitutions are allowed to invest and trade incorporate bonds rated “BB” and above. Previously,banking institutions were only allowed to holdbonds rated at least “BBB”.
The economic downturn has caused therating of a number of corporate bonds held bybanking institutions to be downgraded to belowBBB rating. Relaxation of the above requirementwould allow banking institutions to continueholding these bonds which have beendowngraded to BB, rather than to subject themto mandatory disposal when market sentiment onthese bonds is already poor.
Disposal of Shares Acquired in Debt-EquityConversion Scheme: With effect from 2 March1999, pursuant to section 66(3) of the Bankingand Financial Institutions Act 1989 (BAFIA),banking institutions may hold shares acquiredfrom debt-equity conversion schemes for a periodof up to five years from the date the shares areacquired. Previous guideline on debt-equityschemes required banking institutions to disposethe shares not later than six months after thepublished audited results of the investee companyshow an operational profit.
The restructuring exercise in the banking sectorhas resulted in banking institutions holding
substantial amount of shares from debt-equityconversion schemes. The extension of the holdingperiod to five years is to avoid unnecessarycapital losses for the banking institutions whichmay be incurred if banking institutions are forcedto pre-maturely sell the shares before allowingthem to appreciate to their full potential value.
Accounting Treatment for Bonds AcquiredUnder Debt to Bond Conversion: On 19 July1999, BNM had prescribed the accounting treatmentto be adopted by banking institutions for debtrestructuring schemes where book debts have beenconverted into bonds issued by the borrower. Bondsreceived are recognised at its fair value (i.e. presentvalue) on inception. Where the fair value of thebonds is lower than the net book value of theoriginal debt (the outstanding amount of the debt,net of specific provision and interest-in-suspense),the losses should be charged to the profit and lossaccount in the current accounting period. When thefair value is higher than the net book value, thegain should not be recognised as income, buttransferred to the “Provision for diminution in value”account and netted off from “Investment/Dealingsecurities” account in the balance sheet. Theunrealised gain can only be recognised asincome upon disposal or redemption of thebonds by the issuer. Where unconditionalforgiveness of debt is involved in the restructuringscheme, the amount forgiven should be written offfrom the loan outstanding.
In line with the existing treatment on privatedebt securities(PDS), bonds treated as investmentsecurities will be stated at cost less provision forany permanent diminution in value. Only bondsthat are either guaranteed by the Governmentor by other banking institutions or bonds thathave been otherwise permitted by BNM, may bestated at cost adjusted for amortisation ofpremium or accretion of discount. Bonds treatedas dealing securities will be stated at the lowerof cost and market value.
In view of the numerous debt restructuringschemes participated by banking institutions asa result of the economic downturn, the accountingtreatment has been recommended in order tobring consistency in treatment and encourage theprudent recognition of income.

Extension of Permissible Activity for FinanceCompanies and Discount Houses to FacilitateCorporate Debt Restructuring Schemes: Witheffect from 1 March 1999, finance companies arepermitted to hold unsecured debt securities issuedby the borrower pursuant to a debt restructuringexercise with respect to the portion of debt forwhich the finance companies have been lenders.This permissible investment has been gazettedunder the Banking and Financial Institutions (CreditFacility Without Security) (Licensed FinanceCompany) Order 1999 pursuant to Section 60(2)of the BAFIA.
With effect from 22 October 1999, discounthouses are allowed to invest in equity-linked debtsecurities, whether redeemable or irredeemable,with remaining maturity of more than 10 yearsthat are issued pursuant to a debt restructuringscheme. The exercise is subject to the conditionthat if any such investments are convertible into
shares, the discount houses must dispose thembefore conversion date; or redeem for cash onmaturity; or line up buyers prior to conversiondate so as to dispose of the shares obtainedfrom the conversion on conversion date. Thisadditional permissible investment has beengazetted under the Banking and FinancialInstitutions (Investment Business of DiscountHouses) Order 1999.
Companies undertaking corporate debtrestructuring schemes normally offer a combinationof debt and equity instruments. Nevertheless, theschemes cannot be implemented without theconsent of the majority of creditors, especially iffinance companies and discount houses are alsoinvolved as lenders. This relaxation will providethe finance companies and discount houses greateroperational flexibility to participate in debtrestructuring schemes to enhance recoverability ofdistressed debts.
Progress of Banking Sector Restructuring
As at 31 December 1999, Danaharta acquired andis managing NPLs with loan rights amounting to RM45.5billion from the financial system, of which RM35.7billion was the loan rights acquired from the bankingsystem. The book value of the loans removed fromthe banking system amounted to RM34 billion,representing approximately 42% of NPLs in the bankingsystem. The removal of these NPLs from the bankingsector has reduced the residual NPL level to 6.6%(based on 6-month classification) as at end-December1999, from the peak of 9% (based on 6-monthclassification) as at end-November 1998. The overallweighted average discount rate for the acquired NPLswas about 56%. A total of RM10.3 billion nominal valuezero-coupon bonds have been issued up to end-December 1999 as consideration for the loanacquisitions. This is considerably lower than the totalfinancing requirement of RM15 billion budgeted earlier.Danaharta has also embarked on the secondary carveout of NPLs in October 1999. With the bulk of theNPLs successfully removed during the primary phase,the amount of NPLs to be acquired under thesecondary phase is expected to be minimal. Thesecondary carve-out will focus on common borrowerswhose other accounts are already in Danaharta’sportfolio, loans of borrowers with a total gross valueexceeding RM50 million, unsecured loans granted to
public listed companies or loans from banking institutionswith net NPL ratio in excess of 10%.
Danaharta has now entered into the loan and assetmanagement stage. As at 31 December 1999, a totalof RM17.6 billion of the loans and assets under itsmanagement has been restructured or disposed, withan average recovery rate of 80.2%. Danaharta hasalso conducted two successful restricted open tendersto dispose of foreign currency loans and papers inAugust 1999 and December 1999 involving 43 accountsworth US$394.25 million. Under the initial tenderexercise, Danaharta achieved a recovery rate of 55.3%on 13 of the accounts, whilst a 71% recovery wasachieved on 25 accounts in the second tender exercise.With these two tender exercises, Danaharta hassuccessfully disposed of foreign currency assets withprincipal value of US$339.8 million.
On the asset management front, Danaharta hasconducted its first open tender exercise involvingforeclosed properties in December 1999. Out of the44 properties opened for the tender with indicativevalue of RM122.6 million, 24 bids were successfulraising total consideration of RM17.8 million. Theamount received on the successful bids representedan 8% surplus over the indicative value of RM16.5

million. The remaining 20 properties with an indicativevalue of RM106.1 million were transferred to anasset subsidiary of Danaharta at the minimum bidprice. This would allow Danaharta the opportunityto manage and enhance the value of the propertiesfor future disposal.
In the case of recapitalisation exercise by Danamodal,total capital injection into the initial 10 banking institutionshas declined to RM5.3 billion as at end-December1999 following repayments by five banking institutions.The recapitalisation by Danamodal has helped tostrengthen the RWCR position of these institutionsfrom 9.9% as at end-September 1998 to 12.3% asat end-December 1999.
On the corporate debt restructuring exercise,Corporate Debt Restructuring Committee (CDRC), asat 29 February 2000, has successfully completed therestructuring of 19 cases with debts amounting toRM14.1 billion, whilst 10 cases have been referred toDanaharta. Reflecting the improved conditions of thecorporate sector, there has not been many newapplications submitted to CDRC since late 1999. CDRCexpects to complete the debt restructuring of 26 casesinvolving debts amounting to RM16.4 billion currentlyoutstanding by the third quarter of 2000. Apart fromcorporate restructuring, CDRC is also actively lookinginto the restructuring of the transportation,telecommunication and steel industries involving ninecompanies (of which four companies are currentlyunder CDRC) to ensure that the restructured companiesoperating within the industry would become feasibleand viable. The scope of the industry restructuringwould differ depending on the nature and extent ofstructural inefficiencies within the industry.
Performance of the Banking System
Profitability
Two and a half years after the onset of the financialcrisis which plagued the Asian region, the Malaysianbanking system has turned around to record a pre-tax profit of RM5.3 billion for calendar year 1999, froma pre-tax loss of RM5.7 billion in 1998 (which waslargely contributed by exceptionally large losses ofthree banking institutions). With the improvement inprofitability, the banking system was again able toprovide a positive return on assets of 0.8% and areturn on equity of 11.5% for the year. Although stillconsiderably lower than the levels enjoyed during thepre-crisis period, the encouraging improvement clearly
indicates that the banking system is on the path towardsrecovery and has been able to do so within arespectably short period of time.
On a quarterly basis, the banking system continuedto experience its fourth consecutive quarter of lossesup to 31 March 1999. The losses recorded by thebanking system in the first quarter of 1999, which waslower than the average quarterly loss recorded in thepreceding three quarters, were due to exceptionallylarge losses recorded by one banking group as wellas by two other commercial banks and one financecompany. After experiencing a pre-tax loss totallingRM8.5 billion during the 12-month period ended31 March 1999, the performance of the banking systembegan to take a turn for the better and it begangenerating profits beginning from the second quarterof 1999 in line with the turnaround in overall economicgrowth. The banking system rebounded strongly fromthe crisis to achieve an aggregate pre-tax profit of
Table 4.5Banking System: Income and Expenditure
For the calendar year
1998 1999p Annual changeRM million %
Interest income net ofinterest-in-suspense 60,749 38,653 –22,096 –36.4
(Interest-in-suspense) 4,983 3,406 –1,577 –31.6
Less: Interest expense 45,893 24,233 –21,660 –47.2
Net interest income 14,856 14,420 –436 –2.9
Add: Non-interestincome 6,017 6,767 750 12.5
Less: Staff Cost 3,905 3,508 –397 –10.2Overheads 5,304 4,870 –434 –8.2
Profit before provisions 11,664 12,809 1,145 9.8
Less: Loan loss provisions 17,396 7,543 –9,853 –56.6
Pre-tax profit –5,732 5,266 10,998(excluding 3 institutions)1 -1,258 3,992 5,250
Of which:Commercial banks –2,687 6,428 9,115Finance companies –2,388 –996 1,392Merchant banks –657 –166 491
Return on assets (%) –0.9 0.8(excluding 3 institutions)1 –0.2 0.7
Return on equity (%) –12.3 11.5(excluding 3 institutions)1 –2.8 9.0
1 Excluding three banking institutions that made exceptional loss in 1998.p Preliminary

RM7.4 billion during the last three quarters of 1999.Generally, most banking institutions turned profitableagain in the last three quarters of 1999, whilst thosethat were still incurring losses (15 banking institutions)were registering lower losses as compared with thepreceding three quarters.
The higher profitability recorded in 1999 was largelydue to significantly lower bad debt provisioning thathad to be set aside against NPLs. During the year,the banking system charged RM7.5 billion for loan lossprovisions, 56.6% less than the amount provided inthe previous year (1998: RM17.4 billion). The lowerloan loss provisioning for 1999 was as a result of loweradditional specific provisions required for the year, aswell as significant write-back of provisions alreadymade previously. The improved profitability position ofthe banking system was attained even after chargingRM399 million to their profit and loss account forlosses incurred as a result of sale of loans to Danaharta,leaving a total of RM1.4 billion still to be amortised.
However, at the operating level, the banking systemstill recorded a decline in net interest income of RM436million (–2.9%) although it was much lower than thedecline of 11.1% recorded in 1998 as interest-in-suspense charged in 1999 dropped by 31.6%.Nevertheless, net interest income continued to declinein 1999, due to the negative growth in total outstandingloans (excluding loans sold to Danaharta) while theaverage net interest margin of the banking system forthe year remained virtually unchanged at3.7 percentage points.
In reviewing the interest rate trends throughout1998 and 1999, the banking system experienced adecline in net interest margin between June 1998 andMarch 1999 before it gradually widened from thesecond quarter of 1999 onwards. There was a rapiddecline in deposit rates due to excess liquidity in themarket coupled with lower lending rates which were
Graph 4.1Banking System: Profitability
RM billion
30
20
10
0
-10
-20
-30
1998 1999
Net interest income
Loan loss provisions
Non-interest income
Staff cost
Overheads
INCOME
EXPENDITURE
J F M A M J J A S O N D J F M A M J J A S O N D0
2
4
6
8
10
12
14
16
18
20
1998
Commercial Banks
J F M A M J J A S O N D J F M A M J J A S O N D0
2
4
6
8
10
12
14
16
18
20
J F M A M J J A S O N D J F M A M J J A S O N D0
2
4
6
8
10
12
14
16
18
20
ALR ACOF
Finance Companies
Merchant Banks
%
%
%
Graph 4.2Average Lending Rates and Average Cost of Funds
1999
1998 1999
1998 1999
Note: ALR includes interest which have been suspended and penalty interest on NPLs.ACOF excludes the cost of overheads, statutory reserve and liquid assetrequirements.

brought down by a series of downward base lendingrate adjustments, as a result of progressive reductionsof the statutory reserve requirement and lowering ofthe intervention rate. The gross unadjusted interestrate margin (difference between average gross lendingrates and average cost of funds) of the commercialbanks declined to a low of 3.2 percentage points inSeptember 1998 due to the locked-in deposit funds,before gradually improving to 4.5 percentage pointsin the final quarter of 1999 when interest rates levelstabilised. The finance company industry, which sufferedsevere interest margin contraction throughout 1998when deposit rates rose on the back of fixed rateloans, gained the most from the low interest rateenvironment when it saw tremendous improvement innet interest margin, from 2.1 percentage points in 1998to 4.3 percentage points in 1999.
The non-interest income of the banking systemincreased by RM750 million or 12.5% in 1999. Thiswas mainly due to gains from the sale of investmentsecurities, as well as higher dividend income receivedfrom investment securities, in tandem with the generalimprovement in the stock market and better performanceof the corporate sector. The improved pre-tax profitposition of the banking system was also aided by lowerstaff cost incurred during the year (–10.2%)as a result of a 4.4% reduction in the number ofemployees in the banking sector, as well as a declinein overheads (–8.2%).
Loan Activity
Amidst an improving economic environment andgreater economic activities, the banking systemcontinued to play its intermediation function by providingfinancing to support the increased demand. New loansapproved in the banking system increased by nearlytwo-fold in 1999 to RM104.8 billion, as compared toRM65.1 billion in 1998. Disbursements of approvedcredit facilities also improved by 28.7%, from RM251.1billion in 1998 to RM323.2 billion in 1999. However,loan repayments increased by 24%, from RM270.5billion in 1998 to RM335.6 billion in 1999. Theencouraging rate of turnover of loans clearly reflectedthe improvement in the business environment broughtabout by a low interest rate environment, ample liquiditysituation and rising investor’s confidence, whichtranslated into a strong GDP growth of 5.4% for theoverall Malaysian economy in 1999.
For the year 1999, the banking system directed thelargest proportion of new financing to the manufacturing
sector and for the purchase of residential properties.Over 33% of new loans approved in the bankingsystem were channelled to these two sectors. Moreimportantly, loans approved for the purchase ofresidential properties costing RM250,000 and belowaccounted for about 74% of new loans approved forthe purchase of residential properties. The finance,insurance and business services sector also benefitedfrom the increase in loan approvals, accounting forover 10.1% of total new loans approved in 1999.
In terms of loan disbursements, the manufacturingsector alone accounted for 26.3% of total loansdisbursed in 1999. The bulk of loans was also disbursedto the wholesale, retail, restaurants and hotels, andfinance, insurance and business services sectors,totalling over 29.9% of loan disbursements in 1999.Although loans disbursed to the broad property sectoraccounted for 17.6% of total loan disbursements in1999, 74.8% of these loans were channelled to theconstruction sector and financing for the purchase ofresidential properties.
Despite the strong improvement recorded in loanapprovals and loan disbursements in 1999, this wasnot translated into a significant increase in the amountof total outstanding loans due to several developments,namely, the large amount of loans sold to Danaharta,bad debts written off during the year, and loansconverted into private debt securities, equity and otherassets. If these items were added back, including thebanking institutions’ holdings of private debt securities(PDS), the adjusted total financing provided by thebanking system would have increased by 2.8% from1998 to 1999. The strong increase in loan
Table 4.6Banking system: Loan Activity
1998 1999RM million %
Loan approvals 65,124 104,804 60.9Loan disbursements 251,127 323,169 28.7Loan repayments 270,546 335,587 24.0
1998 1999RM million %
Adjusted totalfinancing1 435,638 447,712 2.8
1 Adjusted for loans sold to Danaharta, bad debts written off during the year,private debt securities held and loans converted into equity and otherassets.
For the year
As at end-
Annualgrowth
Annualgrowth

disbursements in 1999 was also offset by higher loanrepayments which grew by 24% from 1998 to 1999.
During the financial crisis, a great deal of attentionwas focused on the growth in bank lending becauseof its importance in the economic recovery process.However, it needs to be recognised that the outstandingloan figures do not reflect the growth in new loansdue to the various adjustments mentioned earlier, andthat it would not be entirely appropriate to link directlythe outstanding loans with the supply of funds into theeconomy.
Loan growth is a function of both the demand andsupply of credit. The provision of credit by bankinginstitutions should be measured against their willingnessto provide new financing or allow further drawdownof existing approved credit facilities. Therefore, a moreaccurate barometer of banking institution’s supply ofcredit to the economy should be the amount of newloans approved and disbursements of approved creditfacilities. From the analysis of the credit performancein terms of loan approvals and loan disbursements,there was clearly no evidence of constraints on thesupply of credit into the economy.
In terms of demand for credit, most businesseswere hesitant to expand their operations especiallyduring the early months of 1999 given the uncertaintiesin the outlook of the economy. With the existing excesscapacity in the economy, most businesses scaled downtheir operations to meet the underlying demands.Therefore, many credit facilities were left unutilised, asindicated by the large amount of undrawn credit facilitiesin the banking system, totalling RM113.1 billion as atend-1999. It was also noted that most businesseschose to use their surplus cash reserves to repay theirloans to reduce their leverage positions, as observedin the higher loan repayments recorded by bankinginstitutions in 1999. With such high levels of repayments,the outstanding loans of several institutions registereda flat, marginal or even negative growth althoughfinancial resources were actually channelled to meetthe increase in demand for financing.
In summary, an increase in the turnover of loans isa better reflection and indication of economic activity,rather than outstanding loans. A higher rate of turnoverin loans, measured by loan disbursements and loanrepayments, can be expected to result in the generationof increased economic activities and overall GDP growth.
Asset Quality
The asset quality of the banking system improvedin 1999, after being adversely affected by the financialcrisis the previous year. NPLs net of provisions ofthe banking system declined from 9% to 7.8% of totalloans or from RM34.9 billion to RM29.7 billion. NetNPLs of the banking system for the year 1999 peakedin January and since July, have been trendingdownwards. Even if loans sold to Danaharta are addedback, NPLs in the banking system have trendeddownwards since August 1999. The sale of NPLs toDanaharta had kept NPLs in the banking system atmanageable levels and relieved the banking institutionsfrom the burden of managing high levels of NPLs.Three significant sales to Danaharta were made inDecember 1998 (RM12.1 billion), March 1999 (RM7.8billion) and December 1999 (RM4.4 billion). As at31 December 1999, a total of RM34 billion NPLs hadbeen sold to Danaharta, of which RM21 billion wassold in 1999.
Of the remaining loans outstanding with thebanking institutions, the amount of loans which werein arrears had declined in 1999. Customers whowere previously deferring the servicing of their loansas a result of high interest rates and lower economicactivity, were able to service them again. Overall,total loans that were in arrears experienced adecreasing trend throughout the year in line with thestronger economic growth. Total loans that werein arrears for more than one month declined byRM17.9 billion or 13.9% in 1999. However, totalloans which had been in arrears for a period ofmore than twelve months increased in 1999, in partdue to the migration of doubtful or sub-standard
0
2
4
6
8
10
12
14
16
18
20
Net NPL Ratio
NPL (RMb)
Graph 4.3Banking System: Net Non-performing Loans
Dec Mar Jun Sep Dec Mar Jun Sep Dec97 98 98 98 98 99 99 99 99
Net NPL
NPL ratio (%)45
40
35
30
25
20
15
10
0
5

loans as well as the longer time period needed torecover bad loans. Some of the loans in the morethan 12 months category also consisted of loanswhich were undergoing restructuring under theCDRC. Around 8% or RM31.3 billion of total loansin the banking system have been restructuredor rescheduled.
Both commercial banks and merchant banksexperienced similar trends in the ageing profile oftheir loans as a result of loan concentration tosimilar sectors of the economy, namelythe manufacturing, construction and financing,insurance and business services sectors.These sectors were adversely affected during thef inancial cr is is and took a longer t ime torecover, the result of which was evident in theincrease in NPLs in the construction and financing,insurance and business services sectors. Totalloans in arrears of the f inance companiesref lected a different pattern as a moresignificant portion of their loans were directed mainlyto the real estate sector and for the purchase oftransport vehicles and securities. As the economypicked up towards the end of 1999, customers wereable to service their loans for the purchase oftransport vehicles while the bullish trend in theKuala Lumpur Stock Exchange boosted theservicing of share financing loans. NPLs in thereal estate sector also declined as a result ofloans being sold to Danaharta. Hence, amuch better turnaround was observed forfinance companies.
Despite the decrease in NPLs, the loan lossprovisions (interest-in-suspense, specific provisions andgeneral provisions) of the banking system did notdecline, but increased slightly from RM33.1 billion asat end-1998 to RM33.2 billion as at end-1999 due toincreases in interest-in-suspense outstanding whichwas offset by similar declines in general provisions,and the excess general provisions being transferredto specific provisions. Interest-in-suspense outstandingincreased by RM619.4 million in line with continuedsuspense of interest on the NPLs of the bankingsystem. The increase in interest-in-suspense, however,was not as much as that in 1998 (RM12.2 billion),hence, banking institutions were still able to recordan increase of RM5.3 billion in their pre-tax profit.The drop in general provisions by RM553.7 millionwas in line with the reduction in the loan baseof the banking system which shrank by 5%. Specificprovisions outstanding of the banking system remainedrelatively stable.
In terms of the performance of different bankinginstitutions, both commercial and merchant bankswere found to experience a slight decline in theirspecific provisions outstanding as a result ofincreases in their collateral value, which increasedby RM3.2 billion and RM488.8 million respectivelyto RM33.2 billion and RM3.2 billion in 1999.However, the situation was reversed for the financecompanies. Although NPLs had declined slightly,straight line amortisation policy on vehicle loansresulted in declining collateral values and hence,increased level of provisions. Collateral value of
RMb
Graph 4.5Ageing Profile of Loans in Arrears:By Type of Institution
<3 mths 6-<9 mths
9-<12 mths
3-<6 mths
12 mths & above
70
60
40
20
0
50
30
10
98 99D M J S D
98 99D M J S D
98 99D M J S D
Commercial Banks Finance Companies Merchant Banks
Dec Jan Feb Mar Apr May Jun Jul Aug Sep Oct Nov Dec
RMb
Graph 4.4Banking System: Ageing Profile of Loans in Arrears(excludes loans sold to Danaharta)
1998 1999
<3 mths 3-<6 mths 6-<9 mths
9-<12 mths 12 mths & aboves
140
120
100
80
60
40
20
0

NPLs of finance companies dropped by RM5.7 billionto RM14 billion in 1999.
The combined effect of decreasing NPLs and slightincrease in loan loss provisions resulted in an increasein the loan loss coverage ratio of the banking systemfrom 55.9% to 61.7% in 1999. Including the value ofcollateral, the total loan loss coverage of the bankingsystem amounted to 155.2% of NPLs as at31 December 1999.
Non-Performing Loans by Sector
In general, the level of NPLs associated withmost economic sectors declined in 1999 due mainlyto the sale of NPLs to Danaharta. Loans to themanufacturing and construction sectors and for sharefinancing formed the most significant portion of loansacquired by Danaharta.
The level of NPLs for the purchase of securitiesin the banking system recorded a healthy decline of35.8% in 1999, due mainly to sales to Danaharta. Thegross NPL ratio for the purchase of securities fell from23.2% as at end-1998 to 19.2% as at end-1999. Evenif NPLs sold to Danaharta are added back, NPLs forthe purchase of securities declined by 2.6% in absoluteterms. Loans to this sector also shrank significantlynot only due to recoveries but also due to lowerutilisation of such facilities.
Given the high exposure of the banking system tothe broad property sector, NPLs to this sector continuedto account for the largest portion of total NPLs in thebanking system. The construction sector accounted for40.6% of total NPLs to the broad property sector. Ofthis, 39.6% was attributable to loans for the constructionof commercial complexes and infrastructure projects.Nevertheless, sales to Danaharta contained the levelof NPLs at manageable levels.
In line with the Government’s call to promote houseownership, the banking system continued to channela significant portion of total loans for the purchase ofresidential properties. During 1999, loans for thepurchase of residential properties (excluding loanssold to Danaharta) increased significantly by RM6.4billion or 11.4%. Nevertheless, the NPL ratio of suchloans remained relatively low at 7.9% of total loansto this sector. In addition, NPLs to this sector accountedfor only 9.2% of total NPLs in the banking system,although loans to this sector (excluding loans sold toDanaharta) constituted 16% of the total loan portfolioin the banking system.
NPLs to the manufacturing sector accounted for16.1% of total NPLs in the banking system as at 31December 1999. Nevertheless, about 60% of NPLs tothe manufacturing sector had outstanding balances ofRM5 million and below and were channelled to thesmall- and medium-sized industries, and thus were noteligible for sale to Danaharta. To assist these smallerborrowers, the Government has established the
Table 4.7Banking System: Non-performing Loans and LoanLoss Provisions
1998
RM million
Commercial banksGeneral provisions 6,540.4 6,376.3 6,419.5 5,033.8Interest-in-suspense 4,081.9 4,845.4 4,934.7 4,397.2Specific provisions 12,688.5 11,317.0 11,492.9 10,179.4
Non-performing loans 37,253.5 35,561.5 41,184.8 30,402.3Net NPL ratio (%)2 7.3 7.0 9.0 5.7Total provisions /
NPL (%) 62.6 63.4 55.5 64.5
Finance companiesGeneral provisions 1,823.5 1,442.1 1,211.1 1,258.8Interest-in-suspense 2,193.1 2,031.3 2,091.7 2,010.1Specific provisions 3,606.5 5,187.5 4,893.7 5,194.3
Non-performing loans 17,901.3 14,415.2 19,073.4 13,570.6Net NPL ratio (%)2 14.0 9.8 16.4 8.6Total provisions /
NPL (%) 42.6 60.1 43.0 62.4
Merchant banksGeneral provisions 423.6 415.4 406.7 407.6Interest-in-suspense 463.6 481.2 520.6 441.0Specific provisions 1,320.9 1,083.6 997.6 879.9
Non-performing loans 4,122.1 3,764.5 5,582.7 3,487.5Net NPL ratio (%)2 11.5 12.7 23.4 12.3Total provisions /
NPL (%) 53.6 52.6 34.5 49.6
Banking systemGeneral provisions 8,787.5 8,233.8 8,037.3 6,700.3Interest-in-suspense 6,738.6 7,358.0 7,547.1 6,848.3Specific provisions 17,615.9 17,588.1 17,384.2 16,253.5
Non-performing loans 59,276.9 53,741.2 65,840.9 47,460.3Net NPL ratio (%)2 9.0 7.8 11.1 6.6Total provisions /
NPL (%) 55.9 61.7 50.1 62.8
1 Loans classified as NPL based on individual banking institution’s NPLclassification policy i.e. 3-month or 6-month classification.
2 Net NPL ratio = (NPL less IIS less SP) / (Gross loans less IIS less SP)x 100%
1999
As at end-
6-month3-monthActual1Actual1
Classification
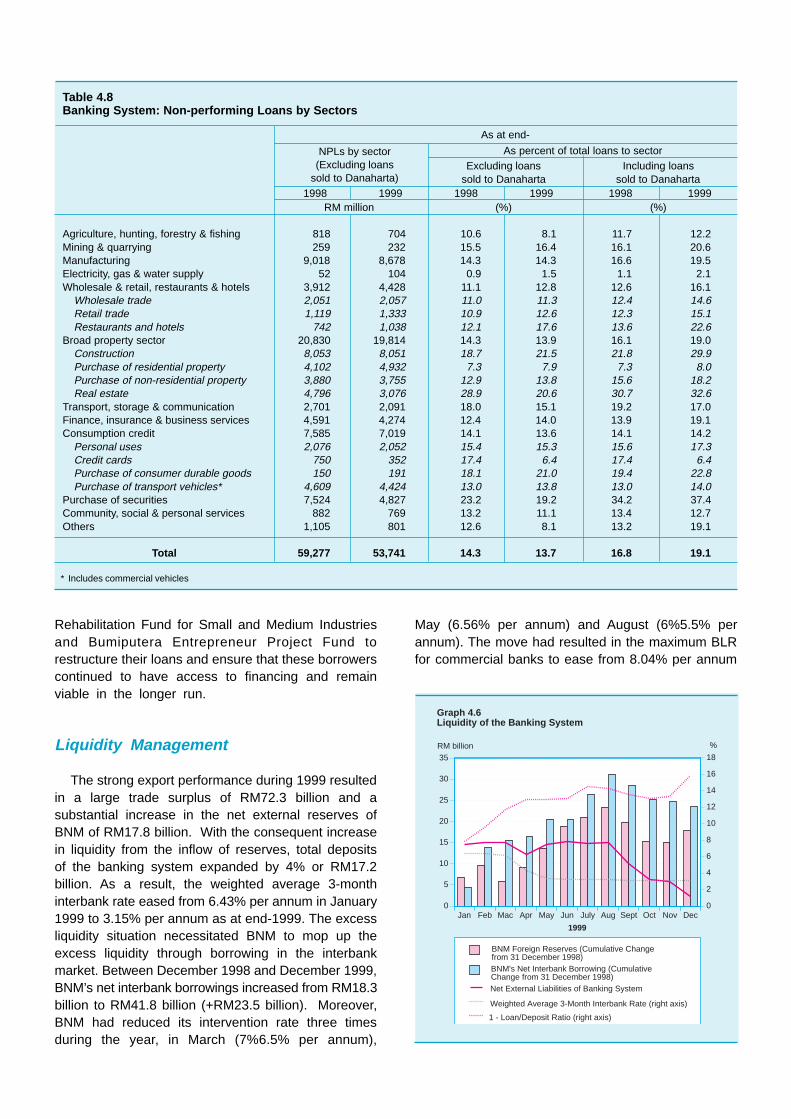
Rehabilitation Fund for Small and Medium Industriesand Bumiputera Entrepreneur Project Fund torestructure their loans and ensure that these borrowerscontinued to have access to financing and remainviable in the longer run.
Liquidity Management
The strong export performance during 1999 resultedin a large trade surplus of RM72.3 billion and asubstantial increase in the net external reserves ofBNM of RM17.8 billion. With the consequent increasein liquidity from the inflow of reserves, total depositsof the banking system expanded by 4% or RM17.2billion. As a result, the weighted average 3-monthinterbank rate eased from 6.43% per annum in January1999 to 3.15% per annum as at end-1999. The excessliquidity situation necessitated BNM to mop up theexcess liquidity through borrowing in the interbankmarket. Between December 1998 and December 1999,BNM’s net interbank borrowings increased from RM18.3billion to RM41.8 billion (+RM23.5 billion). Moreover,BNM had reduced its intervention rate three timesduring the year, in March (7%6.5% per annum),
May (6.56% per annum) and August (6%5.5% perannum). The move had resulted in the maximum BLRfor commercial banks to ease from 8.04% per annum
Table 4.8Banking System: Non-performing Loans by Sectors
As percent of total loans to sectorExcluding loans Including loans
sold to Danaharta sold to Danaharta1998 1999 1998 1999 1998 1999
RM million (%) (%)
Agriculture, hunting, forestry & fishing 818 704 10.6 8.1 11.7 12.2Mining & quarrying 259 232 15.5 16.4 16.1 20.6Manufacturing 9,018 8,678 14.3 14.3 16.6 19.5Electricity, gas & water supply 52 104 0.9 1.5 1.1 2.1Wholesale & retail, restaurants & hotels 3,912 4,428 11.1 12.8 12.6 16.1
Wholesale trade 2,051 2,057 11.0 11.3 12.4 14.6Retail trade 1,119 1,333 10.9 12.6 12.3 15.1Restaurants and hotels 742 1,038 12.1 17.6 13.6 22.6
Broad property sector 20,830 19,814 14.3 13.9 16.1 19.0Construction 8,053 8,051 18.7 21.5 21.8 29.9Purchase of residential property 4,102 4,932 7.3 7.9 7.3 8.0Purchase of non-residential property 3,880 3,755 12.9 13.8 15.6 18.2Real estate 4,796 3,076 28.9 20.6 30.7 32.6
Transport, storage & communication 2,701 2,091 18.0 15.1 19.2 17.0Finance, insurance & business services 4,591 4,274 12.4 14.0 13.9 19.1Consumption credit 7,585 7,019 14.1 13.6 14.1 14.2
Personal uses 2,076 2,052 15.4 15.3 15.6 17.3Credit cards 750 352 17.4 6.4 17.4 6.4Purchase of consumer durable goods 150 191 18.1 21.0 19.4 22.8Purchase of transport vehicles* 4,609 4,424 13.0 13.8 13.0 14.0
Purchase of securities 7,524 4,827 23.2 19.2 34.2 37.4Community, social & personal services 882 769 13.2 11.1 13.4 12.7Others 1,105 801 12.6 8.1 13.2 19.1
Total 59,277 53,741 14.3 13.7 16.8 19.1
* Includes commercial vehicles
As at end-
NPLs by sector(Excluding loans
sold to Danaharta)
Jan Feb Mac Apr May Jun July Aug Sept Oct Nov Dec0
5
10
15
20
25
30
35
%RM billion
Graph 4.6Liquidity of the Banking System
0
2
4
6
8
10
12
14
16
18
1999
BNM Foreign Reserves (Cumulative Changefrom 31 December 1998)BNM's Net Interbank Borrowing (CumulativeChange from 31 December 1998)Net External Liabilities of Banking System
Weighted Average 3-Month Interbank Rate (right axis)
1 - Loan/Deposit Ratio (right axis)

in January 1999 to 6.79% per annum since August1999, and for the finance companies from 9.5% perannum to 7.95% per annum. This assisted in supportingeconomic activities and expediting recovery.
The exchange control policy introduced on1 September 1998, with the minimum holding periodrequiring foreign portfolio capital to remain in Malaysiafor at least 12 months, had stabilised short-term capitalflows and contributed significantly to the stability of thefinancial markets. On 15 February 1999, the one-yearminimum holding period was relaxed, where the principalcapital and profits were allowed to be repatriated subjectto a graduated levy depending on when the funds werebrought into Malaysia and the duration of investment.In September 1999, following the expiry of the one-year minimum holding period, there was a net outflowof portfolio funds of RM5.2 billion, of which a substantialproportion were deposits by non-residents.Subsequently the outflow moderated to RM3.1 billionduring the period from October to December 1999.Nevertheless, during the same period, net externalliabilities of the banking system experienced a furtherdecline of RM8 billion. This was mainly due to thereduction in foreign currency interbank borrowing bythe banking system arising from the US dollar interestrate hike which coincidentally occurred in September1999. The impact on the banking system liquidity was,however, easily offset by the continuous inflow ofexport proceeds and some easing of BNM’s borrowingin the interbank market.
The activities of Danaharta in removing NPLs fromthe banking system played a pivotal role in improvingthe liquidity of banking institutions in 1999. Non-liquefiable NPLs were replaced by Danaharta bonds
which can be discounted or sold under repo with BNMto yield liquidity for the affected banking institutions.
In terms of managing liquidity to meet withdrawalobligations, the banking system as a whole was ableto maintain sufficient liquidity, including a buffer stockof liquefiable assets to meet any unexpectedrequirement. As at 31 December 1999, the bankingsystem had a cumulative liquidity surplus of RM19.9billion to meet estimated liquidity demands of up toone week and a surplus of RM24.6 billion for demandsof up to one month. The amount for December wasmuch lower than the amount normally maintainedthroughout 1999, partly due to the festive seasons aswell as the withdrawal of deposit placements, followingthe expiry of capital outflow moratorium and US interestrate hikes since September 1999.
In terms of the liquidity position by type of institutions,there was notable difference in the liquidity profile, withmerchant banks and finance companies maintainingsomewhat lower levels of liquidity surplus due to theirsmaller deposit base. About 73.1% of bankinginstitutions forecasted surpluses to meet excessivewithdrawal based on the past one year historical data(commercial banks: 82.9%, finance companies: 65%and merchant banks: 58.3%), for at least one monthahead as at 31 December 1999, compared to 77.3%as at 31 December 1998.
Interest Rate Risk
The interest rate exposure profile of Malaysian bankinginstitutions is typically signified by a negative gap (net
Jan Feb Mar Apr May June July Aug Sept Oct Nov Dec0
20
40
60
80
100
RM billion
Graph 4.7Banking System: Liquidity Surplus to Meet WithdrawalObligation of up to One Week in 1999
1999
<-5% -5% - 0% 0% - 5% 5% - 15% > 15%0
2
4
6
8
10
12
14
16
18
20
Commercial Banks
Finance Companies
Merchant Banks
Number of Institutions
Graph 4.8Banking System: Profile of Potential Liquidity Surplus/Shortfall up to One Month Ahead as at 31 December 1999
As a percentage of deposits

liability) position in the shorter term and a positive gap(net asset) position for tenures above one year. Thisis because for most banking institutions, their mainsource of funding comes from their deposits whichnormally have a maturity of less than one year. Thepositive gap positions in the longer term tenures arisefrom holdings of fixed rate debt securities and long termgovernment papers for liquidity and investment purposes.As for finance companies, their positive gap positionswere due to their fixed rate loan activities such as hirepurchase, block discounting and lease financing.
In terms of the amount of risk, the main sourceof banking institutions interest rate risk comes frompositive gap positions in the 3- to 10-year maturity.Exposures in these tenures have a duration weightednet position of RM1.4 billion for commercial banks,RM0.9 billion for finance companies and RM132million for merchant banks. (Duration weighted netposition indicates the potential loss in the economicvalue of banking institutions’ on- and off-balancesheet positions for a one percentage point increasein interest rate). This 3- to 10-year tenure accountedfor 74% of the approximated total duration weightednet position of the banking system. The lack ofsufficient medium- to long-term fixed rate fundinginstruments in the market has constrained the abilityof banking institutions in hedging their interest raterisks arising from net asset positions in the longer-term tenures. For commercial banks and merchantbanks, exposure to holdings of fixed rate debtsecurities (amounting to RM25.9 billion) attributedto this phenomenon, while for finance companies,fixed rate loans amounting to RM16.5 billion
accounted for a larger portion of the positive gapposition in this tenure. Most banking institutions’interest rate exposure is in ringgit. Non-ringgitinterest rate risk accounted for less than 8% of thebanking system’s interest rate risk.
In measuring the ability of banking institutionsto absorb the potential losses that themismatches produced, the total approximated durationweighted net position is divided by capital base andtotal assets respectively.
Interest rate position mismatches have the greatestimpact on the solvency and balance sheets of financecompanies. A one percentage point rise in interestrates can erode finance companies’ capital base by15.9%. The higher impact reflects the inherent risk offinance company business as approximately 53% ofits lending activities are in long-term fixed rate productssuch as hire purchase, block discounting, leasing andsome fixed rate mortgages. The impact of interestrate position mismatches on the solvency of commercialbanks and merchant banks is 3.5 times lesser. A onepercentage point increase in interest rates would onlyimpact the capital base of commercial banks andmerchant banks by 4.5% and 4.3% respectively.Similarly, in terms of sensitivity of the banking institutions’balance sheets to movements in interest rates, financecompanies exhibit the highest degree of sensitivitywhere 1.1% of the balance sheet value would movewith every one percentage point change in interestrates. This is 2.8 times more sensitive compared tocommercial banks and merchant banks which recordeda sensitivity of 0.4% each.
In reviewing the distribution of banking institutionsaccording to the duration weighted net position as apercentage of capital base, approximately 11% ofcommercial banks and 1% of merchant banks would
Table 4.9Banking System: Impact of 1% Rise in Interest Rate onSolvency and Balance Sheet
Commercial Banks* –1,929 –4.5 –0.4Finance Companies –1,265 –12.9 –1.1Merchant Banks –174 –5.3 –0.4
* Includes Bank Islam Malaysia Bhd. and Bank Muamalat Malaysia Bhd.
Balance SheetSize (%)
Duration Weighted Net Position
Capital Base(%)
(RM million)
As a Percentage of
-60
-40
-20
0
20
40
60
80
Commercial Banks
Finance Companies
Merchant Banks
Banking System
Mismatches (RM billion)
Graph 4.9Banking System: Net Interest Rate Position Mismatchesas at end 1999
up to 1 >1 to 3 > 3 to 6 > 6 to12 >1 to 2 > 2 to 3 > 3 to 5 > 5 to 10 >10 to 15 >15mth mths mths mths yrs yrs yrs yrs yrs yrs
Tenure range
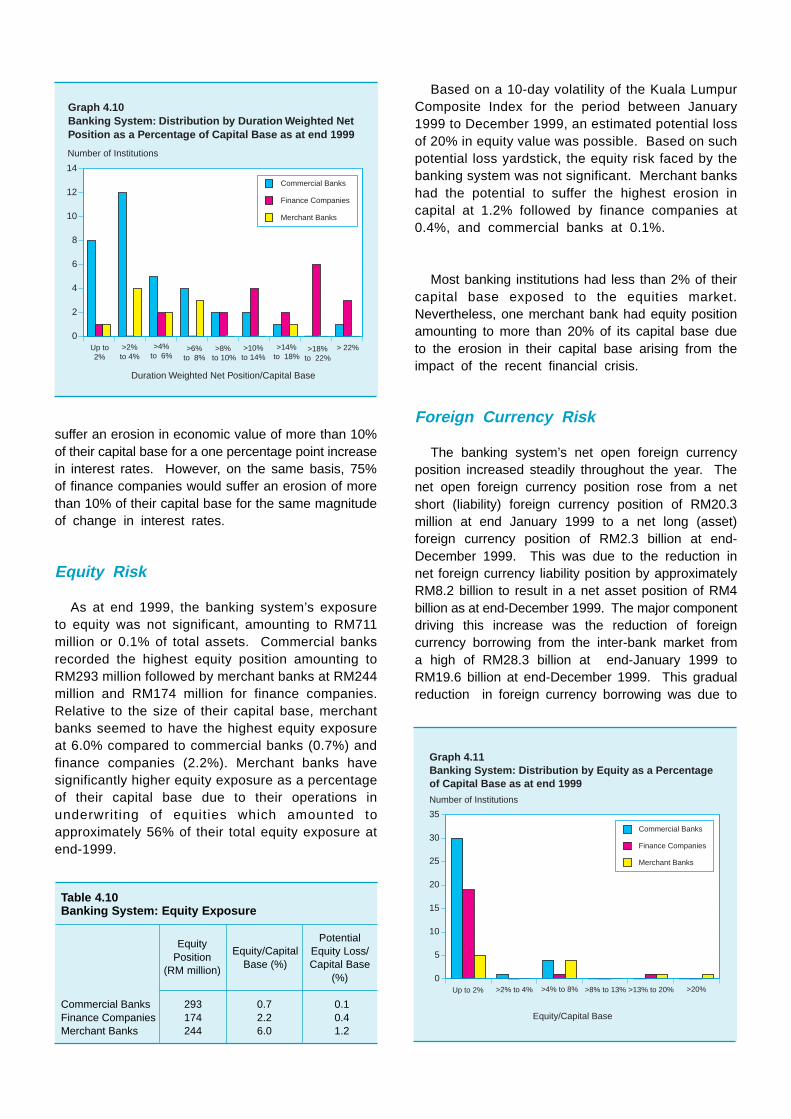
suffer an erosion in economic value of more than 10%of their capital base for a one percentage point increasein interest rates. However, on the same basis, 75%of finance companies would suffer an erosion of morethan 10% of their capital base for the same magnitudeof change in interest rates.
Equity Risk
As at end 1999, the banking system’s exposureto equity was not significant, amounting to RM711million or 0.1% of total assets. Commercial banksrecorded the highest equity position amounting toRM293 million followed by merchant banks at RM244million and RM174 million for finance companies.Relative to the size of their capital base, merchantbanks seemed to have the highest equity exposureat 6.0% compared to commercial banks (0.7%) andfinance companies (2.2%). Merchant banks havesignificantly higher equity exposure as a percentageof their capital base due to their operations inunderwriting of equities which amounted toapproximately 56% of their total equity exposure atend-1999.
Based on a 10-day volatility of the Kuala LumpurComposite Index for the period between January1999 to December 1999, an estimated potential lossof 20% in equity value was possible. Based on suchpotential loss yardstick, the equity risk faced by thebanking system was not significant. Merchant bankshad the potential to suffer the highest erosion incapital at 1.2% followed by finance companies at0.4%, and commercial banks at 0.1%.
Most banking institutions had less than 2% of theircapital base exposed to the equities market.Nevertheless, one merchant bank had equity positionamounting to more than 20% of its capital base dueto the erosion in their capital base arising from theimpact of the recent financial crisis.
Foreign Currency Risk
The banking system’s net open foreign currencyposition increased steadily throughout the year. Thenet open foreign currency position rose from a netshort (liability) foreign currency position of RM20.3million at end January 1999 to a net long (asset)foreign currency position of RM2.3 billion at end-December 1999. This was due to the reduction innet foreign currency liability position by approximatelyRM8.2 billion to result in a net asset position of RM4billion as at end-December 1999. The major componentdriving this increase was the reduction of foreigncurrency borrowing from the inter-bank market froma high of RM28.3 billion at end-January 1999 toRM19.6 billion at end-December 1999. This gradualreduction in foreign currency borrowing was due to
Table 4.10Banking System: Equity Exposure
PotentialEquity Loss/Capital Base
(%)
Commercial Banks 293 0.7 0.1Finance Companies 174 2.2 0.4Merchant Banks 244 6.0 1.2
EquityPosition
(RM million)
Equity/CapitalBase (%)
0
5
10
15
20
25
30
35
Commercial Banks
Finance Companies
Merchant Banks
Number of Institutions
Up to 2% >2% to 4% >4% to 8% >8% to 13% >13% to 20% >20%
Equity/Capital Base
Graph 4.11Banking System: Distribution by Equity as a Percentageof Capital Base as at end 1999
0
2
4
6
8
10
12
14
Commercial Banks
Finance Companies
Merchant Banks
Graph 4.10Banking System: Distribution by Duration Weighted NetPosition as a Percentage of Capital Base as at end 1999
Number of Institutions
Up to2%
>2%to 4%
>4%to 6%
>6%to 8%
>8% to 10%
>10%to 14%
>14%to 18%
>18%to 22%
> 22%
Duration Weighted Net Position/Capital Base

Introduction
In the changing operating environment, theMalaysian financial system must evolve to play itsappropriate role in the next stage of the country’seconomic development. The challenge to thefinancial system in Malaysia is in terms of its abilityto position itself not only to support, but also toact as a catalyst in transforming the economy,particularly, as Malaysia evolves towards becominga higher value-added and knowledge-basedeconomy (K-economy). The challenges that confrontthe financial system include meeting the financingneeds of these new economic activities andincreasingly sophisticated customers, increasingcompetition, enhancing risk management processes,and changes in the scope of banking business. Inaddition, the forces of liberalisation and globalisation,together with the rapid advancement of technology,pose additional challenges to the domestic financialsystem. The ability of the financial system to meetthese challenges would be critical in ensuring theprospects for sustainable economic growth. In thecontext of these challenges, this box article willdiscuss the implications for the domestic financialsystem and the broad areas that need to beaddressed to enhance the role of the financialsystem in supporting the changes in the realeconomy while continuing to strengthen in order tomanage new risks in the more globalised financialsystem. Addressing these issues involves changesby the financial services industry themselves aswell as the regulatory authorities.
Challenges in a Dynamic OperatingEnvironment
Financing the New Economy
One of the biggest challenges facing theMalaysian economy amid the rapid transformationof the global economy and emergence of lowercost competitors is to formulate new strategies tosupport future growth, and to strengthen the structureand improve the efficiency of the economy. Thecurrent strategy of moving towards higher value-added economic activities to sustain economic
The Financial Sector in a Globalised Economy
growth is also being reinforced further by the fastpace of development in information andcommunications technology (ICT). In thisconnection, while efforts are being directed to furtherdiversify the economic base, strengthen thecompetitiveness of industry and enhancingproductivity-driven growth, the scope of economictransformation needs to take account of globaldevelopments in ICT and the increasing role ofknowledge-based activities.
The challenge facing the financial system, is torecognise this economic transformation and adaptand adjust to meet the changing requirements forfinancing in these new areas of economic activityin an effective and efficient manner. In particular,the new areas of growth in the K-economy havedifferent characteristics which may limit their accessto the traditional form of bank-based financing.These characteristics reflect the nature of thesenew activities which rely on intangible assets suchas knowledge, skills, human capital, while theinnovative and “path-breaking” nature of theirproducts lack track record and require long leadtime from investment to fruition. Given thecharacteristics of these new areas of economicactivity, their financing needs are in some casesbetter met by non-bank forms of financing, suchas the bond market and venture capital.
Impact and Challenges of Globalisation
The rapid intensification of globalisation in recentyears has significantly affected the structure andoperations of financial institutions. The global trendtowards deregulation and liberalisation in the financialsystem has led to the blurring of traditionaldemarcation lines separating the activities of thedifferent groups of financial institutions and removedbarriers to competition. As a result, the range ofactivities that can be undertaken by different groupsof financial institutions is converging. Financialinstitutions worldwide are also undertakingconsolidation and mergers, driven primarily by the
Box VI
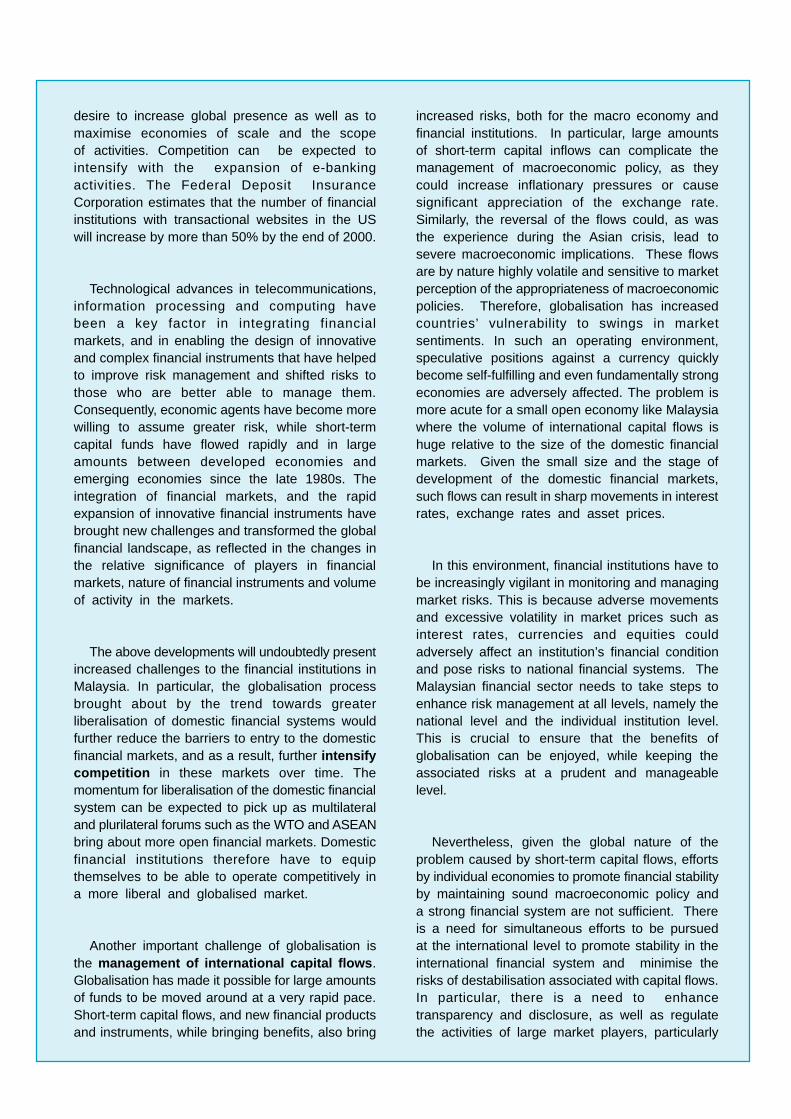
desire to increase global presence as well as tomaximise economies of scale and the scopeof activities. Competition can be expected tointensify with the expansion of e-bankingactivities. The Federal Deposit InsuranceCorporation estimates that the number of financialinstitutions with transactional websites in the USwill increase by more than 50% by the end of 2000.
Technological advances in telecommunications,information processing and computing havebeen a key factor in integrating financialmarkets, and in enabling the design of innovativeand complex financial instruments that have helpedto improve risk management and shifted risks tothose who are better able to manage them.Consequently, economic agents have become morewilling to assume greater risk, while short-termcapital funds have flowed rapidly and in largeamounts between developed economies andemerging economies since the late 1980s. Theintegration of financial markets, and the rapidexpansion of innovative financial instruments havebrought new challenges and transformed the globalfinancial landscape, as reflected in the changes inthe relative significance of players in financialmarkets, nature of financial instruments and volumeof activity in the markets.
The above developments will undoubtedly presentincreased challenges to the financial institutions inMalaysia. In particular, the globalisation processbrought about by the trend towards greaterliberalisation of domestic financial systems wouldfurther reduce the barriers to entry to the domesticfinancial markets, and as a result, further intensifycompetition in these markets over time. Themomentum for liberalisation of the domestic financialsystem can be expected to pick up as multilateraland plurilateral forums such as the WTO and ASEANbring about more open financial markets. Domesticfinancial institutions therefore have to equipthemselves to be able to operate competitively ina more liberal and globalised market.
Another important challenge of globalisation isthe management of international capital flows .Globalisation has made it possible for large amountsof funds to be moved around at a very rapid pace.Short-term capital flows, and new financial productsand instruments, while bringing benefits, also bring
increased risks, both for the macro economy andfinancial institutions. In particular, large amountsof short-term capital inflows can complicate themanagement of macroeconomic policy, as theycould increase inflationary pressures or causesignificant appreciation of the exchange rate.Similarly, the reversal of the flows could, as wasthe experience during the Asian crisis, lead tosevere macroeconomic implications. These flowsare by nature highly volatile and sensitive to marketperception of the appropriateness of macroeconomicpolicies. Therefore, globalisation has increasedcountries’ vulnerability to swings in marketsentiments. In such an operating environment,speculative positions against a currency quicklybecome self-fulfilling and even fundamentally strongeconomies are adversely affected. The problem ismore acute for a small open economy like Malaysiawhere the volume of international capital flows ishuge relative to the size of the domestic financialmarkets. Given the small size and the stage ofdevelopment of the domestic financial markets,such flows can result in sharp movements in interestrates, exchange rates and asset prices.
In this environment, financial institutions have tobe increasingly vigilant in monitoring and managingmarket risks. This is because adverse movementsand excessive volatility in market prices such asinterest rates, currencies and equities couldadversely affect an institution’s financial conditionand pose risks to national financial systems. TheMalaysian financial sector needs to take steps toenhance risk management at all levels, namely thenational level and the individual institution level.This is crucial to ensure that the benefits ofglobalisation can be enjoyed, while keeping theassociated risks at a prudent and manageablelevel.
Nevertheless, given the global nature of theproblem caused by short-term capital flows, effortsby individual economies to promote financial stabilityby maintaining sound macroeconomic policy anda strong financial system are not sufficient. Thereis a need for simultaneous efforts to be pursuedat the international level to promote stability in theinternational financial system and minimise therisks of destabilisation associated with capital flows.In particular, there is a need to enhancetransparency and disclosure, as well as regulatethe activities of large market players, particularly

highly leveraged institutions so as to reduce theirability to cause instability in the global financialmarkets. Co-operation at the internationallevel, involving the developed and developingcountries as well as the private sector, would helpto ensure that the international financial system ismore stable and not prone to frequent instabilityand crisis, thereby ensuring the prospects forsustained prosperity.
Financial Sector as a New Area ofGrowth
Efforts to increase the effectiveness, efficiencyand competitiveness of the domestic financial sectorto meet the challenges of globalisation as well asthe financing needs of the economy would presentopportunities to develop the financial sector as agrowth sector, in line with the vision of promotingservices as a source of new growth. In particular,this would result in an increase in the financialsector’s contribution to the nation’s gross domesticproduct (GDP). The contribution of the broadfinancial sector to GDP at 13% in Malaysia is low(Graph VI.1) suggesting that there is scope andopportunity for the sector to increase its contribution.In addition, a progressive and well-developedfinancial sector would also help to reduce thedemand for financial services from abroad, andthus assist in reducing the services deficit of thebalance of payments.
Response to Challenges
The further development of the financialsystem is an area of priority in the nationalagenda, and resources have been committed todraw up the Master Plans for the development ofthe financial sector over the next ten years.The Government will formulate the blue-print for thedevelopment of the financial sector, including thenecessary regulatory framework to ensure a resilient,sound and stable financial sector. The focus onstrengthening the financial sector will form thefoundation on which further development willtake place to develop an efficient and competitivefinancial sector. On the part of the financialinstitutions, there is a need to continually enhancetheir ability to meet the new requirementsof customers and the economy, as well asmaintain competitiveness by increasing efficiencyand effectiveness.
Strengthening the Financial System
The recent economic and financial crisis hasheightened the need for developing more diversifiedforms of financing in the economy and to reduceover-reliance on the banking system. The crisisalso demonstrated the vulnerability of the bankinginstitutions, particularly the finance companies, giventhe fragmented nature of the industry, and theinadequate risk management processes of thebanking institutions. Measures were thereforeundertaken to address the rising non-performingloans and erosion of capital, as well as providinga platform to restructure corporate debt. In addition,a merger programme for the finance companieswas also introduced. At the same time, steps weretaken to further strengthen the regulatory andsupervisory framework, including the refinement ofthe capital adequacy framework, greater informationdisclosure and initiatives to improve riskmanagement of banking institutions.
(a) Regulation and risk management
Given the changes brought about by theglobalisation process and advances in technology,efforts to ensure the soundness and stability of thefinancial system will have to be intensified.Appropriate standards of prudential supervisionwould need to be maintained to ensure that thebenefits of increasing competition and sophisticationcould be reaped without compromising safety andstability in the financial system. In this regard, BNMwill balance between over-regulation, which couldlimit innovation and inhibit growth and development
0
Graph VI.1Broad Financial Sector as a Share of GDP(at end-1998)
30
25
20
15
10
5
Singapore UnitedKingdom
(end-1997)
Malaysia Indonesia Thailand
%
28%27%
23%
13%
8% 8%
Hong KongSAR
(end-1997)
of the financial system, and under-regulation,which could, on the other hand, undermine thesoundness of the system.
In this context, new modalities in bank regulationhave to be explored. There has been a global trendtowards a market-driven approach as the foundationfor the regulatory framework to reap the benefitsof competition. Under the market-driven approach,the market is entrusted to allocate risks andresources, while the main task of the supervisoris to contain excessive risk-taking activities, minimisethe effect of moral hazard and protect consumers’interests. Under this arrangement, the prudentialregulatory and supervisory framework iscomplemented by the requirement for greaterdisclosure, transparency and market disciplineamong market participants.
In the design of the regulatory framework, BNMwill strive to balance the elements of protective andpreventive regulations. By definition, protectivebank regulation is designed to provide supportgiven that the playing field is not level. Meanwhile,preventive bank regulation is designed to curbexcess risk-taking by banks and, thereby, reducethe prospect of liquidity and solvency problems. Inthe market-driven approach, regulation will providea framework within which competition is allowed togenerate a more competitive banking environmentwithout increasing systemic risks, and causingeconomic and social dislocation. Towards this end,less emphasis will be placed on micro managing,while according greater adherence to a consistentand transparent supervisory philosophy.
In addition to the role of the authorities, themarket-driven approach will also have wideimplications on the role of the financial institutionsin ensuring the resilience of the banking sector.The accountability, transparency and appropriateskills level of Board members and management willbe of paramount importance to promote thisdevelopment. Bank management will be undergreater scrutiny, and needs to be responsive tomarket requirements to stay competitive. Bankinginstitutions will increasingly have to focus onimproving their efficiency and competitiveness. Theimpetus for these improvements would depend onthe banking institutions’ capacity for innovation,flexibility, skill enhancement, customer-orientation
and product development. Equally important is theneed to pay closer attention to the return on equity.In this operating environment, the bankinginstitutions would also have to increase their riskmanagement capability and improve corporategovernance. Adequate internal control and systemsneed to be in place to ensure that there is noexcessive risk-taking that could result in adverseconsequences. Towards this end, guidelines willbe issued to inculcate sound and effective creditrisk as well as to set the minimum standards onrisk management practices for derivatives.Best practices have also been outlined in orderto govern the role of management and employeesof banking institutions to ensure that they exhibithigh standards of competency, experienceand integrity.
(b) Broadening and deepeningfinancial markets
Traditionally, much of the financing for theMalaysian economy is intermediated through thebanking system as reflected by the high ratio ofbank credit (excluding loans securitised by Cagamasand sold to or managed by Danaharta) to GDP of126% at the end of 1999 (138.7% at the end of1998) as well as the high ratio of bank loans tonet funds raised in the capital market of 263.0%during 1997. This suggests the potential fordeveloping alternative sources of financing to meetthe financing needs of the economy, which wouldalso help diversify risks in the economy. In thisregard, there is a need to further deepen andbroaden the financial system in terms of financialproducts and markets.
As there is already a well-functioning and activeequity market in Malaysia, efforts have been steppedup to further develop private debt securities as wellas to encourage secondary trading in theGovernment securities markets. The developmentof an active private debt securities market wouldenhance the capability of the domestic capitalmarket to accommodate large and more complexfunding arrangements and diversify financing awayfrom the banking sector. The bond market wouldallow companies to obtain long-term fixed ratefinancing at a lower cost relative to bank credit.This is because intermediation would be minimised,and as risks are diversified among a large poolof investors and liquidity risks for investors

are reduced, investors are prepared to accepta lower return.
The commencement of trading of the MalaysianExchange of Securities Dealing & AutomatedQuotation Bhd. (MESDAQ), a stock exchangetargeted specifically at growth and technologycompanies, is also a significant step in providingan alternative source of financing, and wouldalso serve as an exit mechanism for venturecapital companies . At the same time, theGovernment recognises that the venture capitalindustry has an important role to play in providingequity capital to finance high-risk investmentsto support the emergence of a knowledge-basedeconomy, and has granted the industrytax incentives. Other alternative sources offinance such as “business angel” investment and“specialist seed capital” firms would complementventure capital financing and would also haveto be promoted.
The development of non-bank based sources offinancing bode well for the development of aK-economy. Given the different nature of thebusiness, alternative sources of financing for high-risk investments are required. In the case of venturecapital, it allows investors to share more fully in therewards to a successful venture and it helps firmsavoid the cash flow problems associated with debtfinance. Equally important is the development ofinstruments that enable the unbundling of risks so
that such risks will be borne and managed by thosewho are best able to do so, so that the risktolerance of the economy increases and financingwould be available at reasonable cost.
Liberalisation
The Government recognises that gradual andprogressive liberalisation of the financial systemwould contribute towards creating a more efficient,competitive and market-driven financial sector, thusenabling the sector to play a more efficient andeffective role in the economy. It is clear that theprotection of the domestic economy, including thefinancial system, is not a permanent option in aglobal economy. Protective measures if maintainedfor too long would erode competitiveness andprospects of economic growth in the longer term.In addition, the circumvention of regulatory obstacleswill reduce the effectiveness of protection. Suchcircumvention would be difficult to detect with newtechnology and the emergence of e-transactions.
The Malaysian financial sector already hassignificant foreign presence. In the banking sector,there are 13 commercial banks that are whollyforeign-owned, with foreigners in the aggregate,accounting for about 30% of total assets ofcommercial banks. Similarly, foreign presence alsofeatures significantly in the insurance industry, withforeign market share amounting to 74% of lifeinsurance premiums and 35% of general insurance
Graph VI.2 Financing of the Economy
External Debt28.7%
Public Debt31.2%
Loans by banking system39.9%
Private DebtSecurities
0.2%
1987 1999
External Debt21.1%
Public Debt13.7%
Loans by banking system50.2%
Private DebtSecurities
14.9%

premiums. Thus far, Malaysia has adopted agradual and progressive approach to liberalisationwhere liberalisation is undertaken at a pace thatis consistent with the prevailing conditions,infrastructrure and regulatory framework and theneeds of the economy, taking into consideration theneed to ensure that liberalisation does notmarginalise the domestic financial institutions.
The strengthening of the financial systemis a necessary first step in the liberalisationprocess. At the same time, the forces ofglobalisation and the momentum of multilateralfora to open up financial markets would placegreater urgency on banking institutions to focusefforts to enhance their competitiveness. In thiscontext, the measures taken thus far to strengthenthe banking system and the present mergerprocess in the banking industry would help theinstitutions to achieve critical size. This wouldenable such institutions to reap the gains fromeconomies of scale, reduce costs and excesscapacity, as well as afford higher spending oninformation technology and risk managementsystems.
New Sources of Growth for the FinancialSector
As competition increases, intermediation marginswould narrow and reduce traditional interest incomesof the banking institutions. This trend will intensifyas capital markets develop further and the processof disintermediation lead more corporations toaccess the capital markets directly for financing.In order to meet these challenges, the domesticbanking institutions must seek new sources ofincome. In this regard, non-interest based activitiesrepresent a significant source of potential growthfor the domestic banking sector, given that only29% of the earnings of the banking institutionsin Malaysia are accounted for by non-interestincome, compared to approximately 50% for Britishbanks. These activities include traditional fee-based activities such as equity underwriting andguarantee as well as consultancy.
The financial system would also have to playa role in developing products and solutions thatcan meet the changing and more sophisticatedneeds of new areas of economic activity. In this
operating environment, bank customers will nolonger be satisfied with the traditional “bread andbutter” products and banking institutions need tostrive to bring the right products and solutionsthat anticipate the needs of their customers. Inaddition, the development of alternative sourcesof financing, such as a vibrant capital market,is a vital complement to the role of the bankinginstitutions. In this regard, technology wouldenable the financial institutions to furtherenhance their services, tap new opportunities anddevelop new products. For instance, those withthe capacity and the necessary skills would bein a position to provide other services such asdocument handling and transmission servicesrelating to trade financing. The broadening anddeepening of the financial markets would alsostimulate the growth of the financial sector,particularly in the form of increased activities, andhence fee-income, for a multitude of financialinstitutions, including, investment banks andsecurities and research houses, as well as supportservices such as rating agencies and consultancyfirms.
New Technology
Investment in new technology is important toenable the financial institutions to enhance theireffectiveness, efficiency and ability to providevalue-added services, while also being better ableto meet the financing needs of the new economy.This need to invest in new technology is continualand is primarily the result of the rapid pace ofIT innovation which has resulted in an accelerationof “creative destruction”, with capital shifting fromfailing technology into new, cutting-edge technology.Financial institutions which fail to invest in thelatter would soon find themselves increasinglydisadvantaged to compete, as they would lackthe ability to develop innovative products, whileefficiency deteriorates and delivery costs increase.Over time, efficiency of the financial system andeconomy would be affected.
Human Capital
A necessary complement to the above effortsis the development of human capital. In particular,the transition to a truly knowledge-based financialsector which is more competitive, effective andbetter able to manage risks would require further

developments in a number of key areas. Firstly,commitment of management teams: themanagement of financial institutions need to bevibrant and innovative in adding value to thetraditional financial activities, and in exploringnew avenues to enhance services. In thisregard, an environment conducive for innovationand creativity must be promoted. The importanceof management support is reflected by theresults of a recent MORI poll, which revealedthat 91% and 65% of companies surveyed inthe US and Europe respectively had a boardmember in charge of e-business. Secondly,human and intellectual capital: knowledge-based financial activities such as e-banking andon-line share trading will require financial servicesemployees to be technologically competent andable to think, assimilate and apply informationand knowledge. In addition, in marketing themultitude of new financial products, financialservices employees must have a thoroughunderstanding of these products and theassociated risks so that customers obtain thebenefits of these products with a fullunderstanding of the risks involved. Thirdly,knowledge infrastructure: this would allow
ideas and knowledge to be transmitted, sharedand built within and across companies andcountries. The infrastructure will consist ofphysical networks and, possibly, theirinterconnections with knowledge or ‘thought’centres such as universities, and businesscentres globally.
Conclusion
Given the important role of the financialsector in the economy, it is clear that meetingthe above challenges would require efforts onthe part of both the Government and the financialindustry. The Government would focus on creatinga conducive regulatory and supervisory frameworkthat encourages efficiency and competition whilemaintaining the soundness of the financial system.Ultimately, it is in the interest of the financialinstitutions themselves to continually enhancetheir resilience, efficiency and competitiveness.The ability of the financial system to assume higherrisks while remaining efficient, competitive andresilient in the face of these challenges would ensureits continued prosperity.

the declining attraction of US dollar (US$) borrowingsas opposed to ringgit borrowings as the weightedaverage 3-month KLIBOR rate fell from 6.43% perannum at end-January 1999 to 3.15% per annum atend-December 1999. In contrast, the 3-month US$LIBOR interest rate rose from 4.97% per annum atend-January 1999 to 6.00% per annum at end-December 1999.
During the year, the outstanding amount of grossforward foreign exchange contracts purchased by thebanking system declined from RM11.1 billion as atend-January 1999 to RM7.3 billion as at end-December1999 despite the consistent improvement in grossexports. In contrast, the outstanding amount of grossforward foreign exchange contracts sold by the bankingsystem increased from RM7 billion as at end-January1999 to RM8.5 billion as at end-December 1999. Thisreversed the banking system’s position from being anet purchaser of forward foreign exchange contracts
in January 1999 with a net outstanding balance of RM4billion to a net seller of forward foreign exchangecontracts (from October 1999 onwards) with a netoutstanding balance of RM1.3 billion as at end 1999.This change in position was due to the shift in interestrate differential from favouring the ringgit to favouringthe US$. With the ringgit-US$ exchange ratepegged at RM3.8, exporters were becomingless attracted to the increasing forward discountrate caused by the falling ringgit interest rates.The 3-month average KLIBOR fell by 2.83percentage points from 6.19% per annum at end-March 1999 to 3.36% per annum at end-May 1999,while the 3-month US$-LIBOR rate rose from 5.52%per annum at end-August 1999 to 6.08% per annumin September 1999. As a result, importers were buyingUS$ forward contracts to take advantage of the forwarddiscount rate which contributed to the increase ofRM1.5 billion for the year.
Nevertheless, despite the size of foreign exchangeactivity, the commercial banks and merchant banksnormally hedged their positions and maintained theirnet exposure within a manageable range. As at end-December 1999 commercial banks’ net open foreigncurrency position as a percentage of their capital basestood at 5.1% compared to 2.3% for merchant banks.All merchant banks and 80% of commercial banks hadnet open foreign currency positions not exceeding 10%of their capital base. A number of commercial banks,however, were maintaining significant long foreigncurrency positions partly to take advantage of thefavourable interest rate differentials which existedbetween domestic ringgit interest rates and US$ interestrates towards the second half of 1999.
-6
-4
-2
0
2
4
6
8
10
Net foreign currency assets (plus value spot &tomorrow purchases)
Net outright forward foreign currency purchased
Net foreign currency swap purchased
Net open foreign currency position
31-Jan 28-Feb 31-Mar 31-May30 Apr 30-Jun 30-Sep31-Jul 31-Aug 31-Oct 30-Nov 31-Dec
Graph 4.12Banking System: Foreign Currency Exposure
1999
-6
-4
-2
0
2
4
6
8
3 month average KLIBOR (right axis)
3 month USD-LIBOR (right axis)
% interest ratesRM billion
0
2
4
6
8
10
12
14
16
18
20
Commercial Banks
Merchant Banks
Number of Institutions
Up to 2% >2% to 4%
>4% to 6%
>6% to10%
>10% to20%
>20%
NOP/Capital Base
Graph 4.13Banking System: Distribution by Net Open ForeignCurrency Position as a Percentage of Capital Base as atend 1999
Table 4.11Banking System: Foreign Currency Exposure
Commercial Banks 2,217 5.1Merchant Banks 92 2.3
NOP/CapitalBase(%)
Net Open ForeignCurrency
Position (NOP)(RM million)

Capital Strength
In consonance with the recovery of the Malaysianeconomy, total Tier-1 capital of the banking systemincreased by RM1.7 billion (4.1%) to RM43.8 billionas at end-1999. The increase was due to better overallprofitability of the banking system and the conversionof some banking institutions’ ExchangeableSubordinated Capital Loan of RM2.6 billion to eitherordinary or preference shares. The year, however, sawa reduction in the paid-up capital of finance companiesdue mainly to the absorption of eight finance companiesby their parent banks. Tier-2 capital funds showed asignificant decline as a result of conversion andrepayment of Exchangeable Subordinated Capital Loantotalling RM4.5 billion. Overall, capital base declinedby 3.2% or RM1.8 billion.
Total risk-weighted assets of the banking systemdeclined by 6.8% or RM32.2 billion to RM 438.6 billionas at end-1999, due mainly to negative loan growth
of the banking system. This contraction of creditcontributed in large part to the decrease of RM33.2billion or 8.0% in assets of the 100% risk-weightcategory. Similarly, risk-weighted assets in the 10%category fell significantly by RM4.4 billion or 16.9%as banking institutions reduced the holdings of Cagamaspapers. On the other hand, assets in the 0% and 50%risk-weight category increased for the year to RM121.7billion and RM67.8 billion respectively due mainly tointer-bank placement with BNM and the expansion inhome financing.
On the whole, the RWCR of the banking systemshowed an increase of 0.5 percentage points to 12.3%as at end-1999. The commercial banks showed animprovement in their RWCR from their end-1998 positionto 12.5%. Finance companies and merchant banks,however, experienced a decline in their RWCR ratiodue to overall losses for the year 1999.
Islamic Banking
Sources and Uses of Funds
The strong and early economic recovery had positivespillover effects on the Islamic banking system whichwas also affected by the economic crisis. The totalassets of the Islamic banking sector continued toincrease strongly by RM14.1 billion or 65.3% to RM35.8billion as at end-1999. The growth was contributedmainly by a sharp increase in trading and investmentsecurities held by the banking institutions (121.8% orRM11.2 billion) and holding of cash and short-termfunds (123.8% or RM3.5 billion). The Islamic banksrecorded the highest asset growth of 97.5%, althoughthe commercial banks still have the largest marketshare of assets in Islamic banking of 44.2%. The shareof Islamic banking assets in the banking system roseto 5.4% from 3.4% in 1998.
During the year, a major portion of funds in theIslamic banking sector continued to be sourced fromdeposits placed with the banking institutions, whichrecorded a growth of 50.6% (RM8.3 billion) to RM24.7billion, accounting for 69.2% of the total resources ofthe Islamic banking sector. As in previous years, thecommercial banks and the Islamic banks accountedfor the bulk of the increase in these deposits, mobilising81% of total deposits in the Islamic banking sector.In terms of types of customers, the deposits were heldmainly by the domestic non-financial private sector,comprising individuals and business enterprises, whichconstituted about 59.8% of total deposits. Investment
Table 4.12Banking System: Constituents of Capital
1998 1999
Tier-1 capital 42,102 43,829 1,728 4.1Tier-2 capital 18,302 15,008 –3,294 –18.0
Total capital 60,403 58,837 –1,566 –2.6
Less:Investment in
subsidiaries andholdings of otherbankinginstitutions’ capital 4,665 4,892 227 4.9
Capital base 55,739 53,945 –1,793 –3.2
Risk assets:0% 87,976 121,707 33,731 38.310% 26,160 21,735 –4,426 –16.920% 109,742 103,670 –6,072 –5.550% 62,452 67,828 5,376 8.6100% 414,994 381,813 –33,181 –8.0
Total risk-weightedassets 470,785 438,634 –32,151 –6.8
Risk-weightedcapital ratio (%)
Banking system 11.8 12.3 0.5Commercial banks 11.7 12.5 0.8Finance companies 11.1 10.4 –0.7Merchant banks 15.2 14.6 –0.6
Annualchange
RM million RM million (%)
As at end-

deposits continued to account for the bulk of depositsplaced in Islamic banking, accounting for 65.6% of theincrease in total deposits. In terms of maturity profile,investment deposits remained concentrated in theshorter-end maturities. Notably, current depositsrecorded a growth of 79.9% in 1999 thereby constituting22.2% of total Islamic banking deposits, as comparedwith a decline of 8.2% in 1998.
The shareholders’ funds of the Islamic bank and theIslamic banking capital fund of the conventional bankinginstitutions also improved during the year, increasing byRM589 million to RM2.2 billion as at end-1999. Theincrease was contributed by the new capital injectioninto the second Islamic bank and the Islamic bankingfund of the discount houses as well as the higher amountof retained profits. In terms of profitability, the Islamicbanking sector recorded an impressive pre-tax profit ofRM352 million for the financial year ended 1999, higherby 137.8% than the pre-tax profit of RM148 millionrecorded for the financial year ended 1998. The improvedprofit was largely due to higher financing income andlower financing loss provisions made by the bankinginstitutions in 1999. The lower financing loss provisionscharged during the year were largely due to higher write-backs and recoveries.
The Islamic funds mobilised were utilised mainly forfinancing activities, while the remaining funds werelargely placed as deposits with other banking institutions,in particular in the form of Mudharabah inter-bankinvestment, and invested in Islamic securities. In 1999,total financing extended by the Islamic banking sectorcontinued to expand by RM3.1 billion or 28%. However,the growth in financing was much lower than thegrowth in deposits (50.6%). As a result, the financing-deposits ratio declined from 66.6% as at end-1998to 56.6% as at end-1999.
The exposure of Islamic banking to the broadproperty sector remained significant at 42.6% of total
Table 4.13Islamic Banking: Key Data
Annual Change (%)
1998 1999 1998 1999
Number of financialinstitutions 49 52 –5.8 6.1
Commercial banks 25 22 4.2 –12.0Finance companies 18 16 –18.2 –11.1Merchant banks 5 5 – 0.0Islamic banks 1 2 – 100.0Discount houses – 7 – –
Total assets(RM million) 21,632 35,754 21.0 65.3
Commercial banks 11,835 15,812 30.4 33.6Finance companies 3,321 4,704 13.6 41.6Merchant banks 778 1,407 14.9 80.8Islamic banks 5,698 11,253 9.5 97.5Discount houses – 2,578 – –
Total deposits(RM million) 16,432 24,739 59.1 50.6
Commercial banks 9,108 10,366 63.9 13.8Finance companies 2,677 2,642 123.1 –1.3Merchant banks 607 909 73.9 49.8Islamic banks 4,040 9,713 25.3 140.4Discount houses 1,109.0 – –
Total financing(RM million) 10,943 14,007 1.8 28.0
Commercial banks 4,764 5,203 1.2 9.2Finance companies 2,108 2,996 –3.7 42.1Merchant banks 421 778 –16.3 84.8Islamic banks 3,650 5,030 8.9 37.8Discount houses
Financing-depositsratio (%) 66.6 56.6 –37.5 –15.0
Commercial banks 52.3 50.2 –32.4 –4.0Finance companies 78.7 113.4 –103.8 44.0Merchant banks 69.4 85.6 –74.8 23.4Islamic banks 90.3 51.8 –13.6 –42.7Discount houses 0.0 0.0 0.0 0.0
Number of branches 90 128 n.a 2.4Commercial banks 7 6 n.a –14.3Finance companies 3 2 n.a –33.3Islamic banks 80 120 n.a 50.0
Number of counters 2,391 2,095 n.a –21.5Commercial banks 1,619 1,370 n.a –15.4Finance companies 766 719 n.a –6.1Merchant banks 6 6 n.a –
–
– – – –
As at end-
Table 4.14Islamic Banking: Sources and Uses of Funds
Annual change
1998 1999
RM million % share
Sources:Capital and reserves 220 589 2,191 6.13Deposits 5,647 8,307 24,739 69.19Amount due to
financial institutions 691 3,220 6,498 18.17Other liabilities –1,451 2,006 2,326 6.51
Total 5,108 14,121 35,754 100.00
Uses:Loans, financing
and advances 584 2,872 13,333 37.29Investment securities 1,752 3,357 6,844 19.14Dealing securities 1,381 2,808 4,381 12.25Amount due from
financial institutions 1,084 1,822 4,062 11.36Other assets 308 3,263 7,134 19.95
As at end-1999
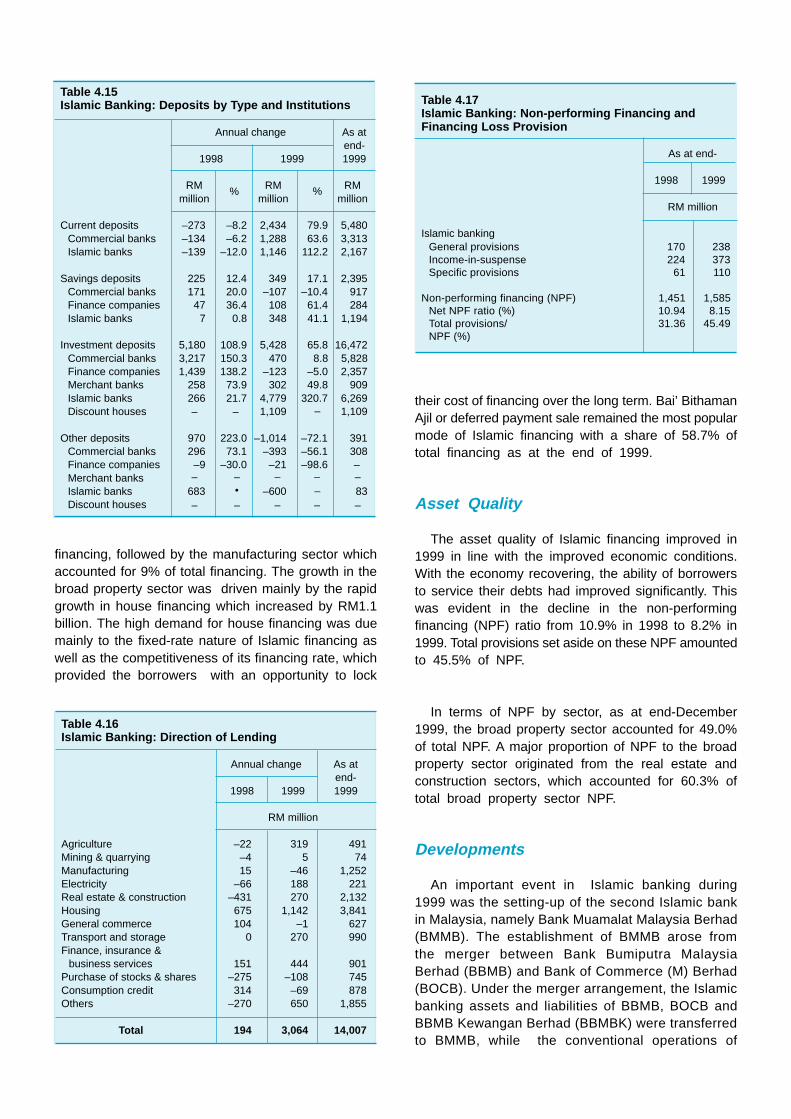
financing, followed by the manufacturing sector whichaccounted for 9% of total financing. The growth in thebroad property sector was driven mainly by the rapidgrowth in house financing which increased by RM1.1billion. The high demand for house financing was duemainly to the fixed-rate nature of Islamic financing aswell as the competitiveness of its financing rate, whichprovided the borrowers with an opportunity to lock
their cost of financing over the long term. Bai’ BithamanAjil or deferred payment sale remained the most popularmode of Islamic financing with a share of 58.7% oftotal financing as at the end of 1999.
Asset Quality
The asset quality of Islamic financing improved in1999 in line with the improved economic conditions.With the economy recovering, the ability of borrowersto service their debts had improved significantly. Thiswas evident in the decline in the non-performingfinancing (NPF) ratio from 10.9% in 1998 to 8.2% in1999. Total provisions set aside on these NPF amountedto 45.5% of NPF.
In terms of NPF by sector, as at end-December1999, the broad property sector accounted for 49.0%of total NPF. A major proportion of NPF to the broadproperty sector originated from the real estate andconstruction sectors, which accounted for 60.3% oftotal broad property sector NPF.
Developments
An important event in Islamic banking during1999 was the setting-up of the second Islamic bankin Malaysia, namely Bank Muamalat Malaysia Berhad(BMMB). The establishment of BMMB arose fromthe merger between Bank Bumiputra MalaysiaBerhad (BBMB) and Bank of Commerce (M) Berhad(BOCB). Under the merger arrangement, the Islamicbanking assets and liabilities of BBMB, BOCB andBBMB Kewangan Berhad (BBMBK) were transferredto BMMB, while the conventional operations of
Table 4.15Islamic Banking: Deposits by Type and Institutions
Annual change As atend-
1998 1999 1999
RM RM RMmillion million million
Current deposits –273 –8.2 2,434 79.9 5,480Commercial banks –134 –6.2 1,288 63.6 3,313Islamic banks –139 –12.0 1,146 112.2 2,167
Savings deposits 225 12.4 349 17.1 2,395Commercial banks 171 20.0 –107 –10.4 917Finance companies 47 36.4 108 61.4 284Islamic banks 7 0.8 348 41.1 1,194
Investment deposits 5,180 108.9 5,428 65.8 16,472Commercial banks 3,217 150.3 470 8.8 5,828Finance companies 1,439 138.2 –123 –5.0 2,357Merchant banks 258 73.9 302 49.8 909Islamic banks 266 21.7 4,779 320.7 6,269Discount houses 1,109 1,109
Other deposits 970 223.0 –1,014 –72.1 391Commercial banks 296 73.1 –393 –56.1 308Finance companies –9 –30.0 –21 –98.6Merchant banksIslamic banks 683 –600 83Discount houses
–––
–
–
•– –– ––
– –– ––
% %
Table 4.16Islamic Banking: Direction of Lending
Annual change As atend-
1998 1999 1999
RM million
Agriculture –22 319 491Mining & quarrying –4 5 74Manufacturing 15 –46 1,252Electricity –66 188 221Real estate & construction –431 270 2,132Housing 675 1,142 3,841General commerce 104 –1 627Transport and storage 0 270 990Finance, insurance &
business services 151 444 901Purchase of stocks & shares –275 –108 745Consumption credit 314 –69 878Others –270 650 1,855
Total 194 3,064 14,007
Table 4.17Islamic Banking: Non-performing Financing andFinancing Loss Provision
As at end-
1998 1999
RM million
Islamic bankingGeneral provisions 170 238Income-in-suspense 224 373Specific provisions 61 110
Non-performing financing (NPF) 1,451 1,585Net NPF ratio (%) 10.94 8.15Total provisions/ 31.36 45.49NPF (%)

BBMB, BOCB and BBMBK were transferred toBOCB. In addition, BMMB was given 40 branchesof BBMB and BBMBK in various locations throughoutMalaysia with a staff workforce of 1,000. The bankcommenced operations on 1 October 1999. Thesetting-up of the second Islamic bank is expectedto play a key role towards fostering an active andprogressive Islamic banking system.
BNM also allowed full-fledged Islamic bankingbranches operated by banking institutions participatingin the Islamic Banking Scheme (SPI banks) to acceptconventional deposit placements, facilitate withdrawalof conventional deposits and receive payments forconventional loans from customers of conventionalbranches. The move is to enable customers of thesame banking institution to perform their bankingtransactions with all branches, although the approvalis subject to the condition that the full-fledged Islamicbranches implement adequate mechanisms to ensureproper segregation between the conventional andIslamic funds.
One of the requirements to be met by the SPI banksby end-1999 was the attainment of a minimum targetof 5% market share in terms of deposits and financinggranted by their respective banking institutions.Nevertheless, taking cognizance of the financial crisisand the merger exercise currently being carried outby the domestic banking institutions, BNM has decidedto defer the compliance deadline to end-2000.Notwithstanding the deferment, 10 SPI banks, all ofwhich are domestic banks, managed to surpass the5% target in terms of deposits and financing at end-1999. In terms of financing, three commercial banks,five finance companies and two merchant banks metthe target, while seven commercial banks, two financecompanies and one merchant bank reached the 5%minimum market share for deposits. It is expected thatonce the merger exercise has been completed, theSPI banks will channel more resources and effortstowards meeting the 5% target.
The first term of the National Syariah AdvisoryCouncil for Islamic Banking and Takaful (the Council)ended on 30 April 1999. Among the decisions madeby the Council were as follows:
(i) Banking institutions are allowed to chargecompensation on the default financing;
(ii) Women and non-Muslim lawyers could attestto all Islamic financial documents;
(iii) Pledging an asset for more than one contractis allowed subject to the following:(a) permission from the first chargee;(b) sufficient value to cover all contracts; and(c) no “dharar” (harmful) to any party to
the contract;
(iv) Cross default clause is allowed to beincorporated in the Islamic banking agreementin order to ensure justice;
(v) For Islamic hire purchase, only the concept ofAl-Ijarah Thumma Al-Bai’ (Lease and thenpurchase) will be applied; and
(vi) All banking institutions would be compensatedunder the RENTAS system for extendingovernight financing to other banking institutions,and the amount of compensation is based onthe overnight average rate of return of Islamicbanks and SPI banking institutions.
For the second term of the Council, BNM has re-appointed four Council members, and appointed twonew Council members.
Other Financial Institutions
Discount Houses
The discount houses experienced a furthercontraction in activities, with total resources decliningby RM1.4 billion or 7.1% to RM18.6 billion at end-1999(–RM970.2 million or –4.6% in 1998). Nevertheless,the environment of ample liquidity and low interestrates enabled the discount houses to achieve a higherlevel of profitability in 1999 as income earned oninvestments exceeded the cost of funds appropriatedby the discount houses.
The decline in the industry’s total resources was dueto lower interbank borrowings (–RM2.9 billion or –30.3%). Lending by banking institutions to discounthouses had declined due, to some extent, to changesin liquidity requirements under the New LiquidityFramework introduced by BNM, as well as theconsolidation of the banking system, which saw severalmergers and absorptions taking place in 1999. Inaddition, interest rates on interbank borrowingswere higher than interest rates on fixeddeposits throughout the year, which made suchborrowings a relatively more expensive source offunding for discount houses.

Nevertheless, total deposits mobilised by discounthouses increased by 10.2%, reflecting mainly anincrease in deposits by non-bank entities. In terms oftype of deposits, fixed deposits increased by RM1.4billion or 23.6% (+RM660.6 million or 12.4% in 1998)mainly due to higher deposits by non-bank financialinstitutions (+RM906.2 million) and business enterprises(+RM539.4 million). As the economy recovered, manycorporations had surplus liquidity and the discounthouses were able to tap some of these funds byoffering higher rates than those offered by bankinginstitutions. Meanwhile, call money placed with discounthouses declined by RM401.4 million or 14.6%(–RM4.8 billion or –63.6% in 1998), mainly as a resultof lower placements by commercial banks (–RM674.5million) and finance companies (–RM456.8 million).The decline was partially offset by higher depositsfrom non-bank financial institutions (+RM426.9 million)and business enterprises (+RM314.1 million).
Following the contraction in total resources, totalinvestment of discount houses declined by 13% in1999 (5.2% in 1998). The bulk of the decline wasdue to lower investments in private debt securities,bankers acceptances and Malaysian GovernmentSecurities. On the other hand, investments in negotiableinstruments of deposits increased marginally.
During the year, the fee-based activities of thediscount houses, however, increased. The industry as
a whole arranged, lead-managed and co-managed theissuance of private debt securities (PDS) amountingto RM1.9 billion (RM180 million in 1998). Meanwhile,the total amount underwritten by the discount housesincreased to RM585.6 million (RM508 million in 1998),representing a total of 15 PDS issues (seven issuesin 1998). As in the previous year, there were onlythree discount houses appointed as principaldealers in 1999. However, following the annual reviewof the Principal Dealer System by BNM at the endof 1999, the number of discount houses appointed asprincipal dealers has been reduced to two, effectiveJanuary 2000.
National Savings Bank
During the year, the National Savings Bank (NSB)reviewed its corporate mission to be a total financialservices provider following the banking sector mergerprogramme, which involved NSB’s associatecompany, BSN Commercial Malaysia Berhad and itssubsidiary companies, BSN Finance Berhad andBSN Merchant Bank Berhad. Following the review,the decision was taken to focus on its core businessof retail banking with an emphasis on personalfinance, catering for the total financial requirementsof individuals and households.
Total resources of the NSB increased by RM594million or 7.2% to RM8.8 billion at end-1999 (+RM697.9million or 9.2% in 1998). The increase was due mainlyto higher deposits, although the number of activeaccount holders declined marginally from 8.7 millionat the end of 1998 to 8.5 million at the end of 1999.By type of deposits, the main source of increase wasfixed deposits, GIRO and Sistem Perbankan Islam(SPI) deposits. Fixed deposits rose by 29.8% reflectingmainly an increase in placements by corporate clientsfrom RM1.2 billion to RM1.8 billion. Fixed deposits byindividuals also increased by RM124.8 million. GIROdeposits turned around to increase by 7.7% in 1999(a decline of 3.5% in 1998). Of significance was thatSPI deposits more than doubled, partly attributable tohigher returns relative to fixed deposits.
During the year, fixed deposits remained the mostpopular deposit scheme, accounting for 44.8% of totaldeposits outstanding at the end of 1999, followed byGIRO deposits with a share of 34.5%. On the otherhand, savings deposits continued to decline by 5.3%in 1999 reflecting, to some extent, a shift from savingsto fixed deposits to take advantage of relatively higherinterest rates. Savings rates were in the range of
Table 4.18Discount Houses: Sources and Uses of Funds
RM million
Sources:Approved capital funds 157 549 1,596Deposits –4,274 933 10,095Interbank borrowings 2,977 –2,873 6,596Others 169 –24 272
Total -970 -1415 18,559
Uses:Investments in securities 911 –2,388 16,051
Government debt securites 653 –333 631MGS held 644 –363 591
Private debt securities 3 –1,512 10,362Bankers acceptances –169 –1,096 3,185Negotiable instruments of deposit 544 38 947Cagamas debt securities –211 206 452Others 91 309 474
Interbank placements –1,231 828 1,819Others –650 145 689
As atend-19991998 1999
Annual change
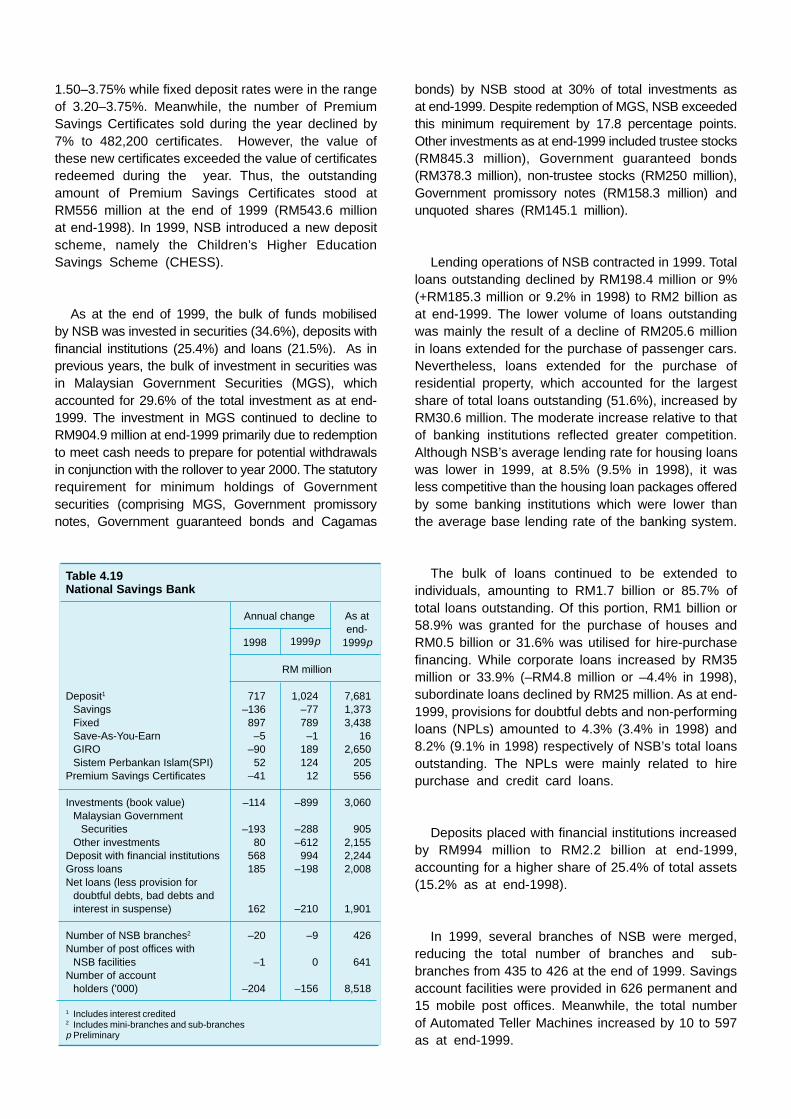
1.50–3.75% while fixed deposit rates were in the rangeof 3.20–3.75%. Meanwhile, the number of PremiumSavings Certificates sold during the year declined by7% to 482,200 certificates. However, the value ofthese new certificates exceeded the value of certificatesredeemed during the year. Thus, the outstandingamount of Premium Savings Certificates stood atRM556 million at the end of 1999 (RM543.6 millionat end-1998). In 1999, NSB introduced a new depositscheme, namely the Children’s Higher EducationSavings Scheme (CHESS).
As at the end of 1999, the bulk of funds mobilisedby NSB was invested in securities (34.6%), deposits withfinancial institutions (25.4%) and loans (21.5%). As inprevious years, the bulk of investment in securities wasin Malaysian Government Securities (MGS), whichaccounted for 29.6% of the total investment as at end-1999. The investment in MGS continued to decline toRM904.9 million at end-1999 primarily due to redemptionto meet cash needs to prepare for potential withdrawalsin conjunction with the rollover to year 2000. The statutoryrequirement for minimum holdings of Governmentsecurities (comprising MGS, Government promissorynotes, Government guaranteed bonds and Cagamas
bonds) by NSB stood at 30% of total investments asat end-1999. Despite redemption of MGS, NSB exceededthis minimum requirement by 17.8 percentage points.Other investments as at end-1999 included trustee stocks(RM845.3 million), Government guaranteed bonds(RM378.3 million), non-trustee stocks (RM250 million),Government promissory notes (RM158.3 million) andunquoted shares (RM145.1 million).
Lending operations of NSB contracted in 1999. Totalloans outstanding declined by RM198.4 million or 9%(+RM185.3 million or 9.2% in 1998) to RM2 billion asat end-1999. The lower volume of loans outstandingwas mainly the result of a decline of RM205.6 millionin loans extended for the purchase of passenger cars.Nevertheless, loans extended for the purchase ofresidential property, which accounted for the largestshare of total loans outstanding (51.6%), increased byRM30.6 million. The moderate increase relative to thatof banking institutions reflected greater competition.Although NSB’s average lending rate for housing loanswas lower in 1999, at 8.5% (9.5% in 1998), it wasless competitive than the housing loan packages offeredby some banking institutions which were lower thanthe average base lending rate of the banking system.
The bulk of loans continued to be extended toindividuals, amounting to RM1.7 billion or 85.7% oftotal loans outstanding. Of this portion, RM1 billion or58.9% was granted for the purchase of houses andRM0.5 billion or 31.6% was utilised for hire-purchasefinancing. While corporate loans increased by RM35million or 33.9% (–RM4.8 million or –4.4% in 1998),subordinate loans declined by RM25 million. As at end-1999, provisions for doubtful debts and non-performingloans (NPLs) amounted to 4.3% (3.4% in 1998) and8.2% (9.1% in 1998) respectively of NSB’s total loansoutstanding. The NPLs were mainly related to hirepurchase and credit card loans.
Deposits placed with financial institutions increasedby RM994 million to RM2.2 billion at end-1999,accounting for a higher share of 25.4% of total assets(15.2% as at end-1998).
In 1999, several branches of NSB were merged,reducing the total number of branches and sub-branches from 435 to 426 at the end of 1999. Savingsaccount facilities were provided in 626 permanent and15 mobile post offices. Meanwhile, the total numberof Automated Teller Machines increased by 10 to 597as at end-1999.
Table 4.19National Savings Bank
RM million
Deposit1 717 1,024 7,681Savings –136 –77 1,373Fixed 897 789 3,438Save-As-You-Earn –5 –1 16GIRO –90 189 2,650Sistem Perbankan Islam(SPI) 52 124 205
Premium Savings Certificates –41 12 556
Investments (book value) –114 –899 3,060Malaysian Government
Securities –193 –288 905Other investments 80 –612 2,155
Deposit with financial institutions 568 994 2,244Gross loans 185 –198 2,008Net loans (less provision for
doubtful debts, bad debts andinterest in suspense) 162 –210 1,901
Number of NSB branches2 –20 –9 426Number of post offices with
NSB facilities –1 0 641Number of account
holders ('000) –204 –156 8,518
1 Includes interest credited2 Includes mini-branches and sub-branchesp Preliminary
As atend-
1999p1998 1999p
Annual change

Provident and Pension Funds
Total resources of the 14 provident and pensionfunds (PPF) surveyed by Bank Negara Malaysiacontinued to grow in 1999, by 13.5% or RM23.5 billion(1998: +12.7%). As at end-1999, the total resourcesof the PPF amounted to RM197.1 billion, the bulk(85.5%) of which were the resources of the EmployeesProvident Fund (EPF). The significant growth in theresources of the PPF was largely due to the growthof accumulated contributions in contributors’ accounts.Accumulated contributions grew by 12.2% or RM18.9billion during the year (1998: +11.3%), reflecting mainlythe higher net contributions and dividends creditedduring the year.
Net contributions to the PPF during 1999 was higherby 22.9%, amounting to RM9.8 billion. This reflectedhigher gross contributions of RM17.5 billion and lowerwithdrawals of RM7.7 billion. The increase in grosscontributions was due to higher income levels of thecontributors amidst strong economic performance andthe increase in the number of contributors. The totalnumber of contributors increased by 3.0% to 18.4million persons at the end of 1999. Meanwhile, thelower withdrawals in 1999 reflected mainly the unusuallylarge amount of withdrawals under the Age 55Withdrawal Scheme in the previous year.
Another factor contributing to the higheraccumulated contributions in 1999 was the higher
amount of dividends credited to the accounts ofcontributors amounting to RM10.4 billion. This wasattributed to the higher investment income duringthe year of RM12.1 billion.
In terms of the composition of assets of the PPF,there was some shift from the holdings of depositsand money market papers to corporate bonds andequities. The share of deposits and money marketpapers declined to 22.1% (1998: 23.7%) while theshare of corporate bonds and equities increased to9.3% and 23.5% respectively (1998: 8.6% and 22.5%respectively). The shift reflected the preference forhigher return assets in an environment of robusteconomic growth. Meanwhile, the share of investmentsin Malaysian Government Securities and loans remainedrelatively unchanged at 27.3% and 14.5% respectively(1998: 27.4% and 14.4% respectively).
Several measures were announced in the Budget2000 that affected the PPF industry. Firstly, it wasproposed that income tax relief up to RM1,000 be givenon annuity premiums for annuities purchased under theEPF annuity scheme. This was to support the EPF’seffort to promote its annuity scheme. The EPF annuityscheme, which is expected to be launched in June 2000,will provide contributors with an option of receiving amonthly income upon retirement, instead of withdrawingtheir savings in a lump sum. Secondly, it was announcedthat civil servants who had been emplaced in the pensionscheme would be allowed to withdraw the balance oftheir contributions with EPF before reaching the age of55, while the Government’s contribution would be
Table 4.20Provident and Pension Funds: Selected Indicators
1997 1998 1999p
RM million
As at end Number ofContributors (’000) 16,788 17,833 18,366
Of which:EPF 8,275 9,158 9,532: SOCSO 8,253 8,429 8,598
Accumulated Contributions 139,246 155,034 173,944Assets 154,082 173,597 197,096
Of which: Investments in MGS 40,021 47,481 53,775
During the yearGross Contributions 16,888 17,097 17,511Withdrawals 6,378 9,104 7,683Net Contributions 10,510 7,994 9,828Dividends Credited 8,179 9,110 10,376Investment Income 10,223 11,131 12,140
p Preliminary
Source: Employees Provident Fund, Pension Trust Fund, Social SecurityOrganisation, Armed Forces Fund, Malaysian Estates Staff Provi-dent Fund, Teachers Provident Fund and eight other private provi-dent and pension funds.
1997 1998 1999
Fixed Assets
MGS
Loans
Bonds
Equity
Deposits & Money Mkt
Foreign Investment
Other Assets
% of Total Assets
Graph 4.14Provident and Pension Funds: Assets
Total Assets (RM billion)
RM billion
24.2%
23.7%
8.8%
14.2%
26.0%
23.7%
22.5%
8.6%
14.4%
27.4%
22.1%
23.5%
9.3%
14.5%
27.3%
100
80
60
40
20
0
250
200
150
100
50
0
p Preliminary
p

transferred to the Pension Trust Fund. This measurewas aimed at enhancing purchasing power as well asincreasing demand and economic activity. Thirdly, aChildren’s Education Withdrawal Scheme was proposedto ease the burden of EPF contributors in educating theirchildren. The scheme would allow contributors to withdrawa portion of their EPF contributions for the purpose oftertiary education of their children. In addition, it wasannounced that EPF contributors would be allowed tomake withdrawals for the purchase of computers.
Pilgrims Fund Board
The activities of the Pilgrims Fund Boardcontinued to expand in 1999, although like other financialinstitutions, it faced challenges, arising from the weakperformance of the KLSE in the early part of 1999 andlow returns from deposits placed with domestic bankinginstitutions. Total resources mobilised by the Boardamounted to RM8.6 billion at the end of 1999,representing an increase of RM1.3 billion or 17.3%(+RM1.2 billion or 18.9% in 1998). The increase inresources was due mainly to the expansion of itsoperations and the subsequent increase in the numberof depositors by 8.9% to 3,748,208 at the end of 1999compared with 3,440,971 in the previous year. At thesame time, the number of Muslims registered with theBoard to perform the pilgrimage was higher at 34,926(29,404 in 1998).
Total depositors’ balance, including bonuses credited,rose by RM1.2 billion or 18.1% (+RM1.1 billion or 18.5%in 1998) to RM8 billion, accounting for 93% of the totalresources mobilised at the end of 1999 (92.4% at theend of 1998). During the year, new deposits placed withthe Board was higher by 15.9%, at RM3.4 billion, whilewithdrawals rose by 16.2% to RM2.7 billion, resulting
in a net increase of RM681 million in total depositsoutstanding. The bonus rate remained at 8% per annumin 1999, while the value of bonuses credited todepositor’s accounts was higher at RM539.8 million(1998: RM459.2 million).
As at end-1999, the bulk of the Board’s funds wereinvested in corporate securities. Investments in corporatesecurities rose by RM384.4 million or 11% (+RM499.3million or 16.8% in 1998) to RM3.9 billion, accountingfor 45.1% of total assets in 1999. Of these investments,73.5% was in quoted shares and 26.5% in unquotedshares. Investments in short-term instruments turnedaround to increase by RM443.7 million or 24.2%(–RM197 million or –9.7% in 1998) to RM2.3 billion atthe end of 1999, accounting for a higher share of 26.6%of total assets. Despite the increase in investments incorporate securities, gross dividends received by theBoard declined by 41% to RM147 million in 1999,reflective of lower dividend rates offered by the companiesin which the Board had invested. During the year, incomeearned from other investments was slightly higher,amounting to RM471.1 million (RM466.6 million in 1998).
Industrial Finance Institutions
Total assets of the industrial finance institutionsincreased by RM2.5 billion or 16.7% in 1999 comparedwith RM4.5 billion or 43% in 1998. The stronger assetgrowth in 1998 was primarily due to the transfer of theExport Credit Refinancing Scheme from Bank NegaraMalaysia to the Export-Import Bank of Malaysia Berhadin January 1998.
The growth in total assets in 1999 was mainly in theform of loans which accounted for 63.4% of the increase.
Table 4.21Industrial Finance Institutions: Changes in Direction of Lending
Year
Sector 1997/96 1998/97 1999/98
RM million % RM million % RM million %
Transport & storage –25.96 –2.36 125.77 8.04 995.29 62.37Real estate & construction 568.80 51.61 61.83 3.95 838.17 52.53Mining & quarrying 7.73 0.70 3.82 0.24 9.69 0.61Manufacturing 214.29 19.44 1,334.22 85.28 –0.77 –0.05General commerce 19.00 1.72 29.06 1.86 –24.76 –1.55Agriculture 22.75 2.06 –32.33 –2.07 –13.43 –0.84Others 295.56 26.82 42.06 2.69 –208.47 –13.06
Total 1,102.17 100.00 1,564.43 100.00 1,595.72 100.00

The increase was funded mainly by capital funds andborrowings. Industrial finance institutions have traditionallyrelied heavily on capital funds and borrowings to fundtheir asset growth as they are not licensed to mobilisedeposits from the public. Established primarily to promotedevelopment programmes in the agricultural, industrialand international trade and export sectors, theseinstitutions are able to access low-cost resources fromthe Government and foreign institutions including theJapan Bank of International Cooperation (the mergedentity of the Overseas Economic Cooperation Fund ofJapan and the Japan Export-Import Bank) and theIslamic Development Bank, Jeddah.
Capital funds of the industrial finance institutionsincreased by 68.6% as at end-1999 to RM3.1 billionaccounting for half of the total increase in liabilities in1999. This was due mainly to the increase in capitalfunds of Bank Pembangunan dan InfrastrukturMalaysia Berhad from RM105.5 million to RM1 billion(+RM894.5 million) and Bank Industri Malaysia Berhad1
from RM320.5 million to RM670.5 million (+RM350million). Bank Pembangunan dan Infrastruktur MalaysiaBerhad underwent capital restructuring at the end of1998 in which 65% (RM488.6 million) of its totalGovernment loans was converted into paid-up capital.Subsequently, in 1999, a bonus issue was declaredbased on the enlarged capital, increasing its paid-upcapital to RM650 million. In addition, a cash injectionof RM350 million by the Government had furtherincreased its paid-up capital to RM1 billion as at end-1999. Similarly, Bank Industri Malaysia Berhad alsoconverted its Government loans amounting to RM350million into paid-up capital, raising the amount to RM670.5million as at end-1999.
The other major source of funding of the industrialfinance institutions in 1999 was borrowings whichincreased by 10.8% to account for 44.9% of the increasein total liabilities. Borrowings by these institutions includedborrowings from related corporations (22.8%), theGovernment and Bank Negara Malaysia (40.2%) as wellas foreign institutions such as the Japan Bank ofInternational Cooperation and the Islamic DevelopmentBank, Jeddah (24.6%). Borrowings from non-Governmententities increased by 28% to RM8.8 billion in 1999, whileborrowings from the Government fell by 22.5%. Thedecline in borrowing from Government was due to thepartial conversion of the Government loans into sharecapital of the industrial finance institutions.
Loans extended by the industrial f inanceinstitutions increased by 20.8% (RM1.6 billion) in1999. The increase was attributed solely to BankPembangunan dan Infrastruktur Malaysia Berhad’sbuilding up of infrastructure loan portfolio sinceOctober 1998 when it was entrusted to finance thenation’s major infrastructure projects. Excluding BankPembangunan dan Infrastruktur Malaysia Berhad,loans extended by the industrial finance institutionsdeclined by RM362.1 million in 1999.
In terms of distribution by economic sector, transportand storage accounted for the largest share (62.3%)of the increase in loans, compared with 8% in theprevious year while the real estate and constructionsector accounted for 52.5% of the increase in loans.In contrast, loans to the manufacturing sector declinedby RM0.8 million in 1999. Despite the decline in loansto the manufacturing sector, the exposure of theindustrial finance institutions to this sector remainedhigh at 37%.
Overview of the Financial Markets
Developments in the financial markets were mixedin 1999. While trading volumes in the stock, bondand interest rate futures markets was higher, tradingin the money, foreign exchange and stock indexfutures markets registered lower volumes.
Trading volume in the money market was lower by24% in 1999, amounting to RM1.39 trillion. This reflectedthe lower trading volume in interbank deposits, whichmore than offset the higher trading in money marketpapers. The lower trading in interbank deposits was anoutcome of the ample liquidity situation and the subduedloan growth, which led to the reduced reliance on theinterbank market for funding needs. Meanwhile, tradingvolume in all money market papers was higher, exceptfor bankers acceptances and negotiable instruments ofdeposits. This reflected the shift in investments fromlower-yielding shorter-tenure papers to the higher-yieldinglonger-tenure papers. A notable amendment to theprivileges given to the principal dealers (PDs) in 1999was that PDs are now allowed to net off the actualholdings of excess specified securities from their eligibleliabilities base.
In the interbank foreign exchange (forex) market,the average daily volume of interbank forextransactions was lower by 61.3% in 1999, amountingto RM1.4 billion. The sharp decline followed the
1 Renamed “Bank Industri dan Teknologi Malaysia Berhad” asof 28 February 2000.

imposition of the selective exchange controls alongwith the pegging of the ringgit exchange rate to theUS dollar (US$) in September 1998. Following thecontrols, the offshore ringgit market, which previouslycontributed to the large volumes in the interbankforex market, was effectively eliminated. Tradingactivity in the ringgit was subsequently restricted togenuine trade-related transactions as well as forportfolio flows. This was evidenced by the shift inthe composition of the major buyers of the US$ forthe ringgit from offshore financial institutions todomestic enterprises. Activity continued to bedominated by transactions of the US$ against theringgit, reflecting the importance of the US$ as avehicle currency as well as the high US$concentration of trade settlements and external debt.
Funds raised in the capital market were marginallylower in 1999 amounting to RM17.2 billion (1998:RM17.8 billion). This reflected the lower fundsraised by the public sector, while funds raised bythe private sector were higher. The amount raisedby the public sector was lower because of thebetter-than-expected revenue collection and theavailability of surplus funds from the preceding year.Meanwhile, the funds raised by the private sectorwere higher, following improved sentiment in thecapital market as the economic recovery gainedmomentum. The higher funds raised by the privatesector were driven mainly by the higher amount offunds raised through equity issues, which was morethan three times the amount raised in 1998. Despitethe marginally lower overall net funds raised, thecapital market continued to be the main domesticsource of financing for the economy in 1999.
In the equity market, sentiment on the Kuala LumpurStock Exchange (KLSE) was generally bullish in 1999,with the benchmark KLSE Composite Index (KLSE CI)rising by 38.6% to end the year at 812.33 points.Similarly, market capitalisation and trading volume washigher (47.6% and 46.1% respectively). The positivemarket sentiment was driven mainly by the strongeconomic performance and improved corporateearnings. The more favourable outlook on the Malaysianeconomy, as evidenced by a series of sovereign creditratings upgrade and the impending reinstatement ofMalaysia into the Morgan Stanley Capital International(MSCI) indices, further encouraged market confidence.The year also witnessed the commencement of tradingoperations on Malaysian Exchange of Securities Dealingand Automated Quotation (MESDAQ), Malaysia’sexchange for growth and technology companies, withthe listing of a technology hardware company.
The size of the ringgit bond market continued toexpand in 1999 growing by 28.1% to RM201.5 billion.This was driven mainly by the higher issuance ofprivate debt securities (PDS) for corporate debtrestructuring schemes. As a result of the strong growthin PDS, the outstanding amount of PDS rose to a levelthat nearly matched that of Malaysian GovernmentSecurities. Trading activity for ringgit bonds was alsosharply higher in 1999, amounting to RM155.9 billionor more than three times the amount traded in 1998.Consequently, the market’s liquidity, as measured bythe ratio of trading volume to amount outstanding,improved significantly, rising to 77.4% from 28.9% in1998. These developments reflected the growingmaturity of the domestic bond market which wouldaugur well for the Government’s aim of developing adeep and liquid ringgit bond market.
In the futures market, while trading in the KLSECI Futures contracts declined significantly by 43%, the3-month Kuala Lumpur Interbank Offered Rate(KLIBOR) futures contract was more actively traded.The decline in stock index futures trading was duemainly to the lack of foreign participation, while thehigher trading in interest rate futures was attributedmainly to the improved liquidity situation in theunderlying cash market and the revival of the marketmaker scheme.
As in previous years, efforts continued to be focusedon developing the financial markets. Specifically,measures to improve corporate governance and minorityshareholder protection were introduced, notably, theFinance Committee Report on Corporate Governanceand the new Malaysian Code on Take-Overs andMergers. Measures were taken to enhancetransparency, such as the requirement for public limitedcompanies (PLCs) to file financial statements on aquarterly basis. The year also marked thecommencement of Phase 2 of a three-phaseprogramme to move from merit-based regulation todisclosure-based regulation, with the amendments tothe Guidelines on Issue/Offer of Securities.
A strategic initiative to develop a Capital MarketMaster Plan was also initiated in 1999, to chart thestrategic positioning and future direction of the capitalmarket for the next ten years. To provide the policydirection and to rationalise the regulatory frameworkfor the development of the bond market, the NationalBond Market Committee (NBMC) was establishedin June 1999. It was also announced that theSecurities Commission (SC) would be the single

regulatory authority for the supervision and regulationof the corporate bond market to rationalise theregulatory framework.
Money Market
The volume of funds traded in the money marketdeclined in 1999 by 23% to RM1,413 billion (see Table4.22). Although, the volume of trade in money marketpapers increased by 19.4%, this was more than offsetby the 28% decline in the volume of trade in interbankdeposits. Trading in interbank deposits declined toRM1,189 billion in 1999 from RM1,651 billion in 1998,an outcome of the continued ample liquidity situation inthe banking system which led to the reduced relianceon the interbank market for funding needs. The reducedrecourse to the interbank market for funds was also aresult of the subdued loan growth during the year. Bytenure of deposits, the volume of trade declined acrossall tenures except for deposits of 2-month and 12-monthmaturities. As a significant proportion of the funds wasplaced at longer tenures, there was a dampening effecton the overall volume of transactions given that the paceof turnover of longer-term funds is slower thereby, leadingto a lower volume of trade. In an environment of ampleliquidity, a marked increase in the volume of trades in12-month deposits reflected market perception thatinterest rates might have bottomed out. In 1999, thevolume of trades in the 12-month tenure increased byRM550 million (36.7 times the volume in 1998).
Trading in money market instruments increasedby 19.4% to RM223 billion in 1999 (RM187 billion in1998) reflecting higher trading volumes in all papersexcept bankers acceptances (BAs) and negotiableinstrument of deposits (NIDs). Lower trading volumesin the latter two instruments was due to the lowerissuance of both papers. Total NIDs outstanding in1999 fell by 51.2% to RM27.3 billion, while total BAsoutstanding fell by 20% to RM14.8 billion. There wasa notable increase in the trading volume of longer-tenured papers such as Malaysian GovernmentSecurities (MGS), Khazanah bonds, Cagamas bondsand notes. This was attributable to the shift ininvestments from the lower-yielding interbank moneymarket deposits into the higher-yielding money marketpapers. In addition, the lower net issuance of bondsin 1999 as compared with the previous year alsocontributed to the increased demand for theseinstruments. The net issuance of MGS was only RM3.3billion in 1999 (RM8.8 billion in 1998), while Cagamasbonds recorded a larger net redemption of RM2 billion(a net redemption of RM1.7 billion in 1998). There wasonly a marginally larger net nominal issuance ofKhazanah bonds of RM4.1 billion in 1999 (RM3.9billion in 1998).
A notable development in 1999 was the significantlyhigher trading volume in the Islamic interbank moneymarket increasing from RM158 billion in 1998 toRM436 billion in 1999. Trading was higher for interbankdeposits (+197%) which more than offset the reductionin the trading of Islamic papers (–14%). There wasa marked increase in Skim Perbankan Islam (SPI)deposits, especially in the first half of the year, to takeadvantage of the higher rates offered by the Islamicdeposits relative to the rates on conventional deposits.Although the relatively more favourable returns onIslamic fixed deposits declined in the second half-year,especially for 1-month deposits, which reversed its
Table 4.22Money Market *
1998 1999
Volume Annual Volume Annual(RM change (RM change
billion) (%) billion) (%)
Total Money MarketTransactions 1,837.7 -1.2 1,412.6 -23.1
Interbank Deposits 1,650.7 -1.4 1,189.3 -28.0
Money Market Papers 187.0 0.0 223.3 19.4Bankers Acceptances
(BAs) 79.3 –6.9 67.9 –14.4Negotiable Instruments
of Deposits (NIDs) 43.1 –23.6 27.2 –36.9Malaysian Government
Securities (MGS) 33.1 166.9 63.8 92.7Khazanah Bonds 5.0 – 16.1 222.0Treasury Bills 6.7 55.8 8.9 32.8Bank Negara Bills 0.0 – 0.0 –Cagamas Bonds 4.5 21.6 12.9 186.7Cagamas Notes 15.3 21.4 26.5 73.2
* All data are sourced from money market brokers, except for MGS,Khazanah bonds and Cagamas papers which are sourced from Bond
Information and Dissemination System (BIDS).
1998 19990
20
40
60
80
100
Overnight
Weekend
1 week
1-3 mth
6,12mth, oth.
Graph 4.15Share of Total Volume Traded
1998 19990
20
40
60
80
100
MGS
Khazanah
Cagamas papers
TBs
NIDs
BAs
%% Money Market PapersInterbank Deposits

trend, Islamic fixed deposits of other maturities continuedto offer higher rates than conventional fixed depositsof similar maturities. Since the increase in depositswas required to be invested in other Islamic products,this resulted in a marked increase in the trading volumeof Islamic interbank deposits. In addition, the increasedtrading volume of interbank deposits could also beattributed to the participation of discount houses inSPI. In 1999, discount houses were for the first timeallowed to participate in the Islamic banking scheme.This is particularly significant as discount houses areactive market makers specialising at the shorter-endof the money market. An analysis of the trading volumeby maturity indicated that there was a significantincrease of about 240% in the trading of overnight andweekend deposits. Meanwhile, trading in Islamic moneymarket papers declined due to the large decline in thetrading of Islamic Acceptance Bills (IABs), which wasonly partially offset by the increase in Green BankersAcceptances (Green BAs). However, the overall declinein the trading of Islamic money market papers wasin line with the decline in the total outstanding issuesof all types of BAs.
As part of the annual review of principal dealers(PDs) system, 12 financial institutions (16 in 1999)have been appointed as principal dealers in the year2000. One notable amendment was made to theprivileges given to the PDs. Previously, for the purposeof calculation of their statutory reserve requirement,PDs were allowed to net off from their eligible liabilities(EL) base, 50% of their sales or purchases (whicheveris lower) of specified instruments (MGS, Treasury Bills,Cagamas papers and Khazanah bonds) in thesecondary market. With the recent amendment, PDs
are now allowed to net off their actual holdings ofexcess specified securities from their EL base. Inaddition, as part of their new responsibility, each PDis now required to maintain a minimum market shareof 2.5% of the total specified securities traded by theindustry every month.
Foreign Exchange Market
The average daily volume of interbank foreignexchange transactions (spot and swap transactions)effected through the eight foreign exchange brokersin the Kuala Lumpur foreign exchange market declinedby 61.3% during the year, from RM3.7 billion in 1998to RM1.4 billion in 1999. The decline followed theimposition of the selective exchange controls and thepegging of the exchange rate to the United Statesdollar in September 1998.
Following the controls, the offshore ringgit market,which previously contributed to the large volumes inthe interbank foreign exchange market, had effectivelybeen eliminated. The trading activity in the ringgit wasessentially restricted to trade-related transactions aswell as for portfolio flows. The larger volumes oftrading in 1997 and 1998 were largely due to thesignificant growth of the swap market and the largervolume of big transactions, both of which reflected thespeculative activity.
Activity in the foreign exchange market in 1999continued to be dominated by transactions of theUnited States dollar against the ringgit, althoughits share of total transactions declined to 63.2%from 77.9% in 1998. The continued dominanceof US$/RM trades reflected the significance of theUS$ as a vehicle currency in the interbank foreign
Table 4.23Islamic Interbank Money Market*
1998 1999
Volume Annual Volume Annual(RM change (RM change
billion) (%) billion) (%)
Total IIMM Transactions 158.1 28.1 435.7 175.6
Interbank Deposits 142.0 36.9 421.9 197.1
Islamic Papers 16.1 -18.3 13.8 -14.3Green Bankers
Acceptances(Green BAs) 9.7 –15.7 12.6 29.9
Islamic AcceptanceBills (IABs) 6.4 –22.0 1.2 –81.3
* Volume traded through money market brokers
1993 1994 1995 1996 1997 1998 19990
200
400
600
800
1,000
1,200
1,400
0
200
400
600
800
1,000
1,200
1,400
RM billion
Graph 4.16Volume of Interbank Transactions in the Kuala LumpurForeign Exchange Market
Spot Swap Total
RM billion
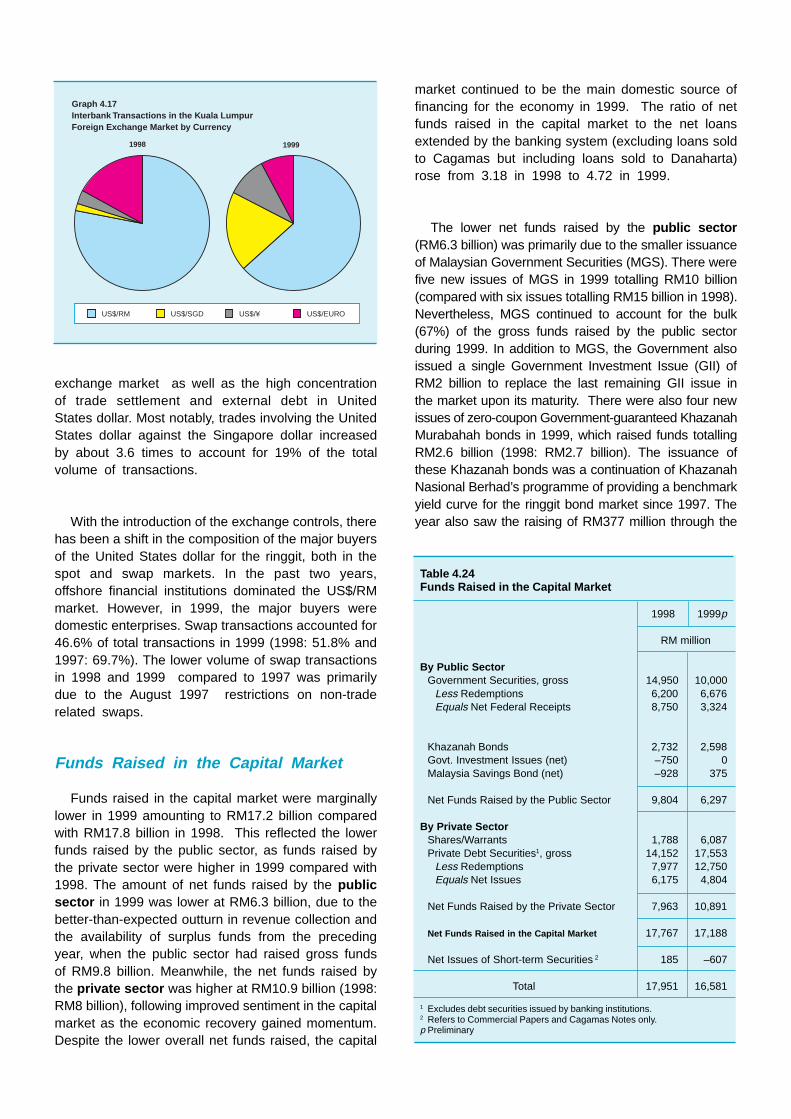
exchange market as well as the high concentrationof trade settlement and external debt in UnitedStates dollar. Most notably, trades involving the UnitedStates dollar against the Singapore dollar increasedby about 3.6 times to account for 19% of the totalvolume of transactions.
With the introduction of the exchange controls, therehas been a shift in the composition of the major buyersof the United States dollar for the ringgit, both in thespot and swap markets. In the past two years,offshore financial institutions dominated the US$/RMmarket. However, in 1999, the major buyers weredomestic enterprises. Swap transactions accounted for46.6% of total transactions in 1999 (1998: 51.8% and1997: 69.7%). The lower volume of swap transactionsin 1998 and 1999 compared to 1997 was primarilydue to the August 1997 restrictions on non-traderelated swaps.
Funds Raised in the Capital Market
Funds raised in the capital market were marginallylower in 1999 amounting to RM17.2 billion comparedwith RM17.8 billion in 1998. This reflected the lowerfunds raised by the public sector, as funds raised bythe private sector were higher in 1999 compared with1998. The amount of net funds raised by the publicsector in 1999 was lower at RM6.3 billion, due to thebetter-than-expected outturn in revenue collection andthe availability of surplus funds from the precedingyear, when the public sector had raised gross fundsof RM9.8 billion. Meanwhile, the net funds raised bythe private sector was higher at RM10.9 billion (1998:RM8 billion), following improved sentiment in the capitalmarket as the economic recovery gained momentum.Despite the lower overall net funds raised, the capital
market continued to be the main domestic source offinancing for the economy in 1999. The ratio of netfunds raised in the capital market to the net loansextended by the banking system (excluding loans soldto Cagamas but including loans sold to Danaharta)rose from 3.18 in 1998 to 4.72 in 1999.
The lower net funds raised by the public sector(RM6.3 billion) was primarily due to the smaller issuanceof Malaysian Government Securities (MGS). There werefive new issues of MGS in 1999 totalling RM10 billion(compared with six issues totalling RM15 billion in 1998).Nevertheless, MGS continued to account for the bulk(67%) of the gross funds raised by the public sectorduring 1999. In addition to MGS, the Government alsoissued a single Government Investment Issue (GII) ofRM2 billion to replace the last remaining GII issue inthe market upon its maturity. There were also four newissues of zero-coupon Government-guaranteed KhazanahMurabahah bonds in 1999, which raised funds totallingRM2.6 billion (1998: RM2.7 billion). The issuance ofthese Khazanah bonds was a continuation of KhazanahNasional Berhad’s programme of providing a benchmarkyield curve for the ringgit bond market since 1997. Theyear also saw the raising of RM377 million through the
Table 4.24Funds Raised in the Capital Market
1998 1999p
RM million
By Public SectorGovernment Securities, gross 14,950 10,000
Less Redemptions 6,200 6,676Equals Net Federal Receipts 8,750 3,324
Khazanah Bonds 2,732 2,598Govt. Investment Issues (net) –750 0Malaysia Savings Bond (net) –928 375
Net Funds Raised by the Public Sector 9,804 6,297
By Private SectorShares/Warrants 1,788 6,087Private Debt Securities1, gross 14,152 17,553
Less Redemptions 7,977 12,750Equals Net Issues 6,175 4,804
Net Funds Raised by the Private Sector 7,963 10,891
Net Funds Raised in the Capital Market 17,767 17,188
Net Issues of Short-term Securities 2 185 –607
Total 17,951 16,581
1 Excludes debt securities issued by banking institutions.2 Refers to Commercial Papers and Cagamas Notes only.p Preliminary
Graph 4.17Interbank Transactions in the Kuala LumpurForeign Exchange Market by Currency
1998 1999
US$/RM US$/SGD US$/¥ US$/EURO

issuance of the 2-year Malaysia Savings BondsSeries 2, which was aimed at ameliorating theadverse impact of the low interest rate environment onthe income earned by retirees on their deposits withfinancial institutions.
In the case of the private sector , the higher net fundsof RM10.9 billion raised by the private sector was drivenmainly by the higher amount of funds raised throughequity issues, which at RM6.1 billion, was more thanthree times the amount raised in 1998 (RM1.8 billion).The equity issues more than offset the lower amountof private debt securities (PDS) issued (RM4.8 billion;1998: RM6.2 billion), emerging as the main mobiliserof funds for the private sector in the capital market in1999. The share of funds raised by the private sectorthrough the issuance of equity securities increased from22.5% in 1998 to 55.9% in 1999.
In the equity market , the bulk of the RM6.1 billionraised was through rights issues (RM4.3 billion), whichwere significantly higher than the amount of RM0.7billion raised in 1998. Of the total rights issues, RM2.4billion, or more than half, was raised by a single firmfor the purpose of financing acquisitions. Other formsof equity issuance, namely initial public offers (IPOs),special issues and private placements, also recordedhigher amounts. Of significance, no IPO wasundersubscribed in 1999 compared with a 56.8%undersubscription in 1998.
In the PDS market , the net funds raised ofRM4.8 billion was marginally lower despite a higher
value of new PDS issues of RM17.6 billion (1998:RM14.2 billion). This was due to the much largeramount of redemptions, which was at a record levelof RM12.7 billion in 1999 (1998: RM8 billion). Thesignificantly higher PDS redemptions in 1999 wasdue partly to the maturity of PDS issued in 1994and 1996. Specifically, the bulk (57%) of the PDSwhich matured in 1999 were 5-year corporate bondsissued in 1994 (RM4.3 billion or 78% of corporatebonds issued in 1994) and 3-year Cagamas bondsissued in 1996 (RM3 billion or 63% of Cagamasbonds issued in 1996). In addition to the largescheduled redemptions, the PDS redemptions werealso due to 11 early redemptions in 1999 by sevenPDS issuers, totalling RM2.4 billion (1998: five earlyredemptions totalling RM805 million). Straight bondsaccounted for 54.5% of the RM17.6 billion grossfunds raised (1998: 72.3%), asset-backed Cagamasbonds, 25.2% (1998: 23.5%), Islamic bonds, 9.9%(1998: 2.4%), convertible bonds, 7.2% (1998: 0.7%),and bonds with warrants, 3.2% (1998: 1.1%).
The larger amount of PDS issued and the earlyPDS redemptions in 1999 were attributed partly tocorporate debt restructuring. Indeed, the largest PDSissue in 1999 (accounting for 39.7% of the gross fundsraised from PDS issues) was for a debt restructuringscheme. As for Cagamas bonds, there was a netredemption of RM2 billion (1998: –RM1.7 billion),reflecting the larger amount of redemption of RM6.5billion during the year, compared with RM4.4 billionin new funds raised. In terms of utilisation, 41.7%of the gross PDS funds raised was channelled to thetransport, storage and communications sector, while
1995 1996 1997 1998 1999-5
5
15
25
35
45
RatioRM billion
Graph 4.18Total Net Funds Raised in the Capital MarketBy the Public and Private Sectors
Public sector Private sectorRatio of Net Funds Raised toBank Loans Extended (RHS)
0
1
2
3
4
5
6
7
8
Table 4.25New Issues of Private Debt Securities by Sector(RM million)
1998 1999p
Agriculture, hunting, forestry & fishing 0.0 0.0Mining & quarrying 0.0 0.0Manufacturing 125.0 524.5Electricity, gas & water supply 529.0 523.8Wholesale & retail trade, restaurants& hotels 0.0 170.0
Construction 0.0 1,729.0Purchase of residential property 1,000.0 0.0Purchase of non-residential property 0.0 0.0Real estate 370.0 875.8Transport, storage & communication 1,103.3 7,316.9Financing, insurance & business services 11,024.5 5,169.6Purchase of securities 0.0 1,238.4Others 0.0 5.0
Total 14,151.8 17,553.0
p Preliminary

29.5% was channelled to the finance, insurance andbusiness services sector.
Equity Market
Market sentiment on the Kuala Lumpur StockExchange (KLSE) was generally bullish in 1999, withthe benchmark KLSE Composite Index (KLSE CI)ending the year higher at 812.33 points. This was anincrease of 38.6% from a year ago. Similarly, marketcapitalisation increased by 47.6% to reach RM553 billion.The positive market sentiment was driven by the strongeconomic performance, improved corporate earnings,considerable progress in bank restructuring and the lowinterest rate environment. The mix of policies andmeasures introduced by the Government and the KLSEprovided a conducive environment for businesses andinvestments. Market confidence was further encouragedby the more favourable outlook on the Malaysianeconomy, as evidenced by a series of upgrading ofMalaysia’s sovereign ratings by a number of internationalcredit rating agencies, the possible reinstatement ofMalaysia into the Morgan Stanley Capital International(MSCI) indices, as well as the economic and stockmarket recovery in the region.
Consistent with the performance of the KLSE CI,all other KLSE indices, except the Mining andPlantation indices, closed the year higher. The
Finance index was the top performer, rising by75.7%. The rise in the Finance index reflectedinvestors’ positive response to the significantprogress in bank restructuring. In contrast, thePlantation and Mining indices declined by 8.4% and4.5% respectively. The former was due mainly tothe decline in crude palm oil prices (–29.6%) whilethe latter was in line with the negative growth ofthe mining industry (–4%). The Second Board indexalso underperformed the KLSE CI, rising by 14%.This reflected investors’ interest in larger capitalisedcompanies.
The KLSE CI in 1999 was on an uptrend for themost part of the year, interspersed by briefperiods of decline. It went through four discerniblephases. The KLSE CI began the year with ashort period on the r ise before pressuresemerged in the last week of January to dampenthe uptrend, and this continued into the end ofMarch. It reached the lowest point of the year(494.57 points) on 24 March. Sentiment turnedaround in April, with the KLSE CI rising steadilyfor more than three months to reach a peak of851.67 points on 9 July. The rising momentumwas halted by a brief period of decline frommid-July to early-August, when the KLSE CI fell to668.21 points. The KLSE CI subsequentlyrecovered, turning bullish again to close the yearat 812.33 points.
Graph 4.19Performance of the KLSE CI in 1999
450
500
550
600
650
700
750
800
850
900
J F M A M J J A S O N D
Increasedinterest intechnologystocks
NewCabinetnamed
Deferment ofthe reinclusionof Malaysiainto MSCIindices fromFebruary toMay 2000
Renewedconcernsover theappreciationof the yen
BNM introduced flat10% exit levy onrepatriation of profits
GDPgrowth:4.1%
Announcementof reinstatementof Malaysia intoMSCI indices
Tightening of margin financing requirements bystockbroking houses; Fresh tensions between thePeople's Republic of China and Taiwan
KLSE CI closedat a 22-monthhigh of 851.67points
Release of abetter-than-expectedGDP:Ð1.3%
BNM interventionrate lowered to6.00% from 6.50%;DJIA breached11,000-point level
BNM interventionrate lowered to6.50% from7.00%
Standard and Poor'supgrade Malaysia's ratingConcerns over
Sabah's elections
Introductionof exit levysystem

The KLSE CI started off the year on a positivenote on news of a trade surplus for November1998 and the exchange control relaxation whichallowed the repatriation of profits arising fromcontra transactions. The price increases wasshortlived, however, as market sentiment began toweaken by the end of January, and deterioratedfurther until the end of March. Following theannouncement on 4 February 1999, on theintroduction of the levy on the early repatriation ofcapital (previously repatriation of capital withinthe 12-month holding period was not allowed), themarket fell as stocks were sold based on themisperception that only profits repatriated before15 February would be exempted from levy.Further clarification on the exit levy, however,produced an almost immediate recovery.Nevertheless, the subsequent announcement of afurther decline in the Industrial Production Index(IPI) and the concerns over the Sabah electionsdampened market sentiment.
The KLSE CI rebounded strongly from April tomid-July against a backdrop of improving prospectsfor economic recovery. The Index rose continuouslyfor three months from April to June by 34.2%, 10.1%and 9.2% respectively. The rise was due partly tothe improved views on Malaysia, expressed by anumber of major international credit rating agenciesand security houses. In addition, market sentimentwas also aided by the reduction in the BNM 3-monthintervention rate, positive growth in the IPI (3.1%in February; the first upturn in 12 months), themoderation in the CPI (from 3.8% in February to3% in March) and the smaller-than-expected GDPcontraction for the first quarter 1999 (–1.3%). Onthe external front, the rise of the Dow Jones IndustrialAverage (DJIA) index, which breached the 11,000-point level on 4 May also helped to boost regionalmarkets, including the KLSE.
The strong rally was interrupted in mid-July, asselling interest prevailed and pushed prices lower.Selling by foreign funds became more prominent asthey locked in profits. The falling prices resulted inrecurring margin calls by stockbrokers and financialinstitutions and prompted forced selling, thus reinforcingthe sell down. Sentiment was also affected by concernsover the rise in US interest rates, tensions betweenThe People’s Republic of China and Taiwan and thestrengthening of the Japanese yen.
The sharp decline of the KLSE CI reversed on9 August amidst several positive developments. Theseincluded the MSCI’s announcement that Malaysia would
Table 4.26Kuala Lumpur Stock Exchange: Selected Indicators
1998 1999p
Price IndicesComposite 586.13 812.33EMAS 146.94 206.39Second Board 158.37 180.57
Total TurnoverVolume (billion units) 58.3 85.2Value (RM billion) 115.2 185.3
Average Daily TurnoverVolume (million units) 236.9 343.4Value (RM million) 468.2 747.0
Market Capitalisation (RM billion) 374.5 552.7Market Capitalisation/GDP (%) 131.7 184.4
Total No. of Companies Listed 736 757Main Board 454 474Second Board 282 283
Market Liquidity:Turnover Value/Average Market
Capitalisation (%) 34.6 40.3Turnover Volume/Number of
Listed Securities (%) 37.1 49.4
Market Concentration:10 Most Highly Capitalised Stocks/
Market Capitalisation (%) 35.5 33.9
Average Paid-Up Capital ofStockbroking Firms (RM million) 91.9 103.2
p Preliminary
Source: Kuala Lumpur Stock Exchange
Index (Jan 1996=100) Volume (billion units)
Graph 4.20Kuala Lumpur Stock Exchange Composite Index,Second Board Index and KLSE Trading Volume
Second Board IndexVolume KLSE CI
Source: Kuala Lumpur Stock Exchange
0
5
10
15
20
25
0
20
40
60
80
100
120
140
160
180
200
Jan Jul Jan Jul Jan Jul Jan Jul96 96 97 97 98 98 99 99

Capital market measures introduced in1999 were aimed mainly at promoting a moreefficient, transparent, innovative and competitivecapital market that has the highest standards ofintegrity and systemic stability. The key measureswere as follows:
Improving Corporate Governance andMinority Shareholder Protection
• The new Malaysian Code on Take-Oversand Mergers 1998 came into force on1 January to enhance transparency and toprotect minority interests. The new Codecontained, among others, provisions to ensurethat minority shareholders were given relevantinformation necessary to make an informeddecision and provisions imposing criminalliability on parties that provide false ormisleading information.
• The Finance Committee Report on CorporateGovernance was released on 25 March .The Report contained 70 principalrecommendations to enhance corporategovernance standards and covered threebroad areas, namely, the developmentof the Malaysian Code on Corporate Governance,reform of laws, regulations and rules, and trainingand education. AnImplementation Project Team had beenestablished and entrusted with the task to leadand oversee the implementation of therecommendations in the Report.
• Effective 1 April , restrictions were placedon the number of directorships thatmay be held by directors of public listed companies(PLCs) to address the corporate governanceissues arising from multiple directorships, e.g.insufficient time and effort devoted to the boardsthey represent. The restrictions stipulated that adirector of a PLC should not hold more than 25directorships in companies, of which the numberof directorships held in PLCs should not bemore than 10.
Key Capital Market Measures in 1999
Enhancing Transparency
• Effective 18 June , listed companieswere required to present their financialstatements in accordance with accountingstandards issued by the MalaysianAccounting Standards Board (MASB). This wasto enhance the quality of information disclosedin financial statements and to ensure thataccounting standards issued by MASB werecomplied with.
• With effect from 31 July , PLCs were requiredto file financial statements with the KLSE ona quarterly basis . The aim was to strengthencorporate accountability and disclosure aswell as to aid investors in making informedinvestment decisions.
Strengthening the Stockbroking Industry
• Effective 28 May , the Capital AdequacyRequirements (CAR) were introduced toensure that the liquid capital of a stockbrokingcompany (SBC) would be sufficient tocover its total measured risks. CAR is arisk-based financial monitoring toolwith separately identifiable measures forthe specific risks associated with aSBC’s business.
• The KLSE issued standards for the treatmentof interest on non-performing accounts andprovision for bad and doubtful debts in thefinancial statements of SBCs, effective 1 July .The objective was to ensure consistency in therecognition of interest income and the provisionfor bad and doubtful debts.
• The KLSE introduced new Memorandum &Articles (M&A) and Rules , with effect from1 July . The new M&A and Rules incorporatedenhanced measures to strengthen thestockbroking industry and to achieve greaterclarity and transparency in the businessconduct of SBCs.
Strengthening the Financial Position ofPLCs
• On 30 April , the Securities Commission(SC) announced that revisions weremade to the requirements for KLSEMain and Second Board listings,reverse take-overs and back-doorlistings to strengthen the financial positionof PLCs. These revisions included morestringent profit track records, higherminimum issued and paid-up capital forcompanies seeking listing on the KLSE,a standard requirement for a moratoriumon the disposal of shares by the promotersof all Second Board applicants and MainBoard applicants involved in certain activities,as well as additional criteria for the listingof property development, construction andtrading/retailing companies.
Facilitating Capital Raising
• On 30 April , listed companies were allowed toissue and list new equity warrants with attractiveexercise prices to replace existing equitywarrants. This was to ease the capital raisingproblems of listed companies by enabling themto have access to more flexible avenues forcapital raising.
Facilitating the Move TowardsDisclosure-Based Regulation (DBR)
• On 30 December , the SC announced that the“Policies and Guidelines on Issue/Offer ofSecurities” (Issues Guidelines) were amendedto further facilitate the progressive move towardsDBR1. It marked the commencement of Phase2 of a three-phase implementation programmeto move from merit-based regulation2 toregulation based on disclosure. The focus of therevisions was generally on the liberalisation ofthe requirements on pricing of securities,valuation of assets and utilisation of proceeds.
Encouraging the Consolidation ofStockbroking Companies
• In the 2000 Budget proposals, taxincentives were granted to encouragethe consolidation of SBCs. These wereas follows:
– SBCs engaged in merger exerciseswould be given stamp duty and realproperty gains tax exemptions onal l instruments related to mergerscompleted between 30 October 1999 to31 December 2000.
– The acquiring SBCs would also be giventax credits (calculated as a sum equivalentto half of the losses suffered by theacquired entity multiplied by the incometax rate). The tax credit could only beclaimed against tax payable for two yearsof assessment immediately following theyear in which the merger was completed.
Enhancing Infrastructure and OtherMeasures
• The Institutional Settlement Service (ISS) waslaunched on 15 July to facilitate the settlementof trades of investors directly with the clearinghouse. The ISS allows resident custodianbanks and institutional investors to participatedirectly in the clearing and settlement process.
• The integrated electronic system for shareapplications was inaugurated on 26 August foran initial public offering. The system markedthe beginning of an easier share applicationprocess since it reduced the need for form-filling and queuing as it provided investorswith the option to use automated tellermachines.
• The KLSE Link, which is an internet-basedelectronic document management system, waslaunched on 8 October to enhance the content,consistency and timeliness of corporateannouncements;
• The KLSE Syariah Index was launched on17 April to cater to investors seeking toinvest in instruments which were in line withSyariah principles;
1 Under DBR, the SC regulates the quality of information disclosed inofferings of securities and investors determine the investment meritsof the offerings.
2 Under merit-based regulation, the investment merits of offerings ofsecurities are assessed and determined by the SC.

be reinstated into its MSCI indices in February 2000.The KLSE CI recovered by 15.7% in four days. Thisdevelopment was shortlived, however, as profit-takingand the non-committal attitude of investors ahead of1 September led the KLSE CI to trend lower. Sentiment,nevertheless, recovered somewhat, following theannouncements by BNM of the small amount of portfoliooutflows (US$456 million for the period 1-3 September),allaying the earlier fears of a large outflow of portfoliofunds from 1 September. The introduction of the flat10% levy system by BNM on 21 September was alsowell received by investors. Sentiment, however,remained weak due to the strengthening of theJapanese yen and the re-emergence of fears over thepossibility of an interest rate hike in the US.
Sentiment began to improve from October,influenced mainly by expectations of a pro-growthBudget. The decision to delay the reinstatement of
Malaysia into the MSCI indices from February toMay 2000 did, however, dampen sentimenttemporarily. Following the favourable response tothe new Cabinet line up and the rising interest intechnology stocks, sentiment turned bullish inDecember, with the KLSE CI rising by 10.6%.
In comparison with the performance of the otherstock markets in the region, the increase in the KLSECI (38.6%) was lower than the Korea Composite Index(82.8%), Singapore ST Index (74.8%) and JakartaOfficial Index (70.1%), but was higher than theThailand SET Index (35.4%). In terms of ranking, theKLSE ranked eighth in the Asia-Pacific region andsecond in ASEAN.
Reflecting the overall positive market sentiment,trading volume on the KLSE was 46.1% higher in
• KLSE strengthened its suspension policy in orderto ensure continuous trading and properfunctioning of the stock market. Effective14 June, PLCs were no longer allowed tosuspend trading by merely submitting requestswithout detailed justification and, the periods ofsuspension generally should not be longer thanthree market days.
• The regulation of depository receipts was putin place on 3 May to enhance foreign interestin Malaysian shares. Following that, sponsoredAmerican Depository Receipts (ADR)/GlobalDepository Receipts (GDR) programmes wereallowed to continue to operate for Malaysianlisted companies.
Further Developing the Capital Market
• A Capital Market Master Plan would bedeveloped to chart the strategic positioning andfuture direction of the Malaysian capital marketfor the next 10 years. Among others, it wouldaddress the weaknesses in the capital markethighlighted during the crisis, provide a strategicroad map to facilitate future businessdevelopment and assist in the creation of aresilient and competitive capital market.
• The National Bond Market Committee (NBMC)was established to provide the policy direction
and to rationalise the regulatory framework forthe development of the bond market as well asto recommend appropriate implementationstrategies to address impediments to thedevelopment of the bond market. Chaired by theSecretary-General of Treasury, the NBMCincluded representatives from BNM, SC,Economic Planning Unit (EPU), Registrar ofCompanies (ROC) and KLSE. Three workinggroups were established, namely, the Legal andRegulatory Reform Committee, the Product andInstitutional Development Committee and theInfrastructure and Operations Working Group. Itwas also announced that the SC would be thesingle regulatory authority for the supervisionand regulation of the corporate bond market torationalise the regulatory framework.
• To enhance the development of the bond market,it was proposed in the 2000 Budget that thetransfer of assets for the purpose of assetsecuritisation would be exempted from stampduty and real property gains tax , effective30 October 1999 until 31 December 2000.
• In the 2000 Budget proposals, unit trustssponsored by the Federal and StateGovernments were given income taxexemptions for 2000 and 2001 in order toassist the Government sponsored unit trusts toplay a bigger role in mobilising savings and toenhance the stability of the stock market.

Arg
en
tina
Ta
iwa
n
Th
aila
nd
Ma
lays
ia
Po
lan
d
Ch
ile
Ho
ng
Ko
ng
Ind
on
esi
a
Sin
ga
po
re
Ko
rea
Bra
zil0
20
40
60
80
100
120
140
160
180
Graph 4.21Performance of Selected Regional & Emerging StockMarket Indices (% change from 1998 to 1999)
21.9%31.6% 35.4%
38.6% 41.3% 43.8%
65.2%70.1% 74.8%
82.8%
151.9%
%
Source: International Federation of Stock Exchanges (FIBV)
0
500
1,000
1,500
2,000
2,500
3,000
Turnover Value (RM'000)
0
20
40
60
80
100
120
140
MCI (points, end-mth)
Turnover Value (RM'000)
Graph 4.22Malaysian Exchange of Securities Dealing and AutomatedQuotation: Trading and MESDAQ Composite Index (MCI)
MCI (points, end-mth)
Apr May Jun Jul Aug Sep Oct Nov Dec1999
Source: Malaysian Exchange of Securities Dealing and Automated Quotation
1999, amounting to 85.2 billion units or an averagedaily volume of 343 million units (1998: 58.3 billionunits and 237 million units respectively). In terms oftransacted value, the turnover was 60.8% higher atRM185.3 billion (1998: RM115.2 billion). The bulk ofthe trading (62.4%) was in April to July when marketsentiment was most bullish. Trading remained centredon the trading/services (24.4% of total trade) andfinance (12.9%) sectors on the Main Board. Ofsignificance was the higher trading volume in theLoans/TSR sector (17.1% of total trade; 1998: 10.8%).This was attributed partly to the decision by the SCto allow the issuance and listing of new warrants toreplace the existing warrants. Market liquidity (measuredby the ratio of units traded to the number of units ofsecurities listed) increased to 49.4% in 1999from 37.1% in 1998. Similarly, the ratio of tradingvalue to average market capitalisation rose to 40.3%in 1999 (1998: 34.6%).
Several measures were introduced during theyear, to further develop the capital market. The keymeasures are contained in the box, Key Capital MarketMeasures in 1999.
The year 1999 was an important year for MESDAQ,Malaysia’s exchange for growth and technologycompanies. The highlight of the year was thecommencement of trading operations on 30 April 1999with the listing of a technology hardware company onthe exchange. The MESDAQ Composite Index (MCI)declined initially and rebounded in the last quarter of1999, broadly in line with the KLSE CI, to close at
89.94 points at end-1999. Trading volume on MESDAQamounted to RM5.3 million, with the bulk of the trading(53%) concentrated in May. In addition to the singlelisting, two companies applied for listing in 1999, oneof which was involved in smart-card technology whilethe other was a pharmaceutical company.
During the year, MESDAQ also introducedMalaysia’s first electronic prospectus and launchedthe Malaysian Enterprise Network (MEnet). Theelectronic prospectus was introduced with the firstlisting on 30 April, and was intended to reduce thecost of IPOs and at the same time extend the reachof prospectuses by leveraging on internet technology.As it turned out, the prospectus for the maidenlisting at MESDAQ attracted 64,000 on-line hits withapproximately 2,000 copies downloaded. Anotherdevelopment in financial information disseminationduring the year was the launch of the MEnet on16 April. The MEnet is an internet-based bulletinboard sponsored by MESDAQ, where Malaysianprivate limited companies could efficiently and cost-effectively profile themselves to potential investors.As at end-1999, 20 companies and 16 investors hadregistered with MEnet.
As at end-1999, MESDAQ had 13 stockbrokingcompanies as members, the same number aswhen trading commenced on 30 April. Seven ofthese stockbroking companies were market-makers.An open trading system is expected to beimplemented by end-2000 to replace theexisting trading system, the MESDAQ Quotation

System (MQS). The move, from the currentproprietary platform and network to an opentrading architecture which utilises internet-basedtechnologies and standards, would increasethe trading system’s flexibility and would allowMESDAQ to respond rapidly to the impendingborderless marketplace that is being opened up byelectronic commerce and the increasing connectivityof issuers and investors worldwide. Meanwhile,as in past years, various roadshows andpresentations were also organised for potentialissuers, the investment community, the media andthe general public, in an effort to market MESDAQas well as the MEnet.
Bond Market
The size of the ringgit bond market, comprisingpublic debt securities2 and private debt securities3
(PDS), increased by 28.1% during the year, fromRM157.3 billion at the end of 1998 to RM201.5 billionat the end of 1999. The growth was driven mainly bythe higher issuance of PDS for corporate debtrestructuring and the purchase of non-performing loans.
The increase in the size of the bond marketreflected mainly the rise in the outstandingamount of other PDS4 (+RM30.7 bi l l ion or65.6%) and bonds issued by the national asset
management company, Pengurusan DanahartaNasional Berhad (+RM7.7 billion or 298%). MalaysianGovernment Securities (MGS) continued to accountfor the largest portion of the total bonds outstanding,although its share fell significantly to 38.9% from47.7% in the previous year. Most notably, the shareof other PDS had risen to a level (38.4%) thatnearly matched that of MGS, reflecting theconsiderable expansion of other PDS in 1999. Thisdevelopment is a positive step towards achievingthe Government’s aim of developing a deep andliquid PDS market.
Trading activity in the secondary market for ringgitbonds was sharply higher in 1999. Trading volumeamounted to RM155.9 billion, more than three timesthe amount traded in 1998 (RM45.5 billion). Similarly,the bond market’s liquidity, as measured by the ratioof trading volume to amount outstanding, had also
Table 4.27Outstanding Amount of Ringgit Bonds
1998 1999p
RM mil % Share RM mil % Share
Malaysian Government Securities 75,012 47.7 78,336 38.9 3,324Government Investment Issues 2,000 1.3 2,000 1.0 –Khazanah Bonds 4,850 3.1 8,980 4.5 4,130Malaysia Savings Bonds 4 0.0 379 0.2 375Danaharta Bonds 2,601 1.7 10,344 5.1 7,743Danamodal Bonds 11,000 7.0 11,000 5.5 –Cagamas Bonds 15,064 9.6 13,019 6.5 –2,045Other Private Debt Securities 46,737 29.7 77,413 38.4 30,676
Total 157,268 100.0 201,470 100.0 44,202
p Preliminary
Change (RM mil)
0
10,000
20,000
30,000
40,000
50,000
60,000
70,000
80,000
90,000
Graph 4.23Size of the Ringgit Bond Market: Amount Outstanding
RM million (nominal value, end period)
KhazanahBonds
CagamasBonds
DanahartaBonds
1998: RM157.3 bil
1999: RM201.5 bil
DanamodalBonds
MalaysiaSavingsBonds
Other PrivateDebt
Securities
GovernmentInvestment
Issues
MalaysianGovernmentSecurities
2 Public debt securities refers to Malaysian Government Securities,Government Investment Issues, Khazanah bonds and Malaysia SavingsBonds.
3 Private debt securities refers to Cagamas bonds, Danamodal bonds,Danaharta bonds and other PDS.
4 Listed and unlisted private bonds other than those issued by Cagamas,Danaharta and Danamodal.

improved significantly, rising from 28.9% in 1998 to77.4% in 1999. This development reflects the growingmaturity of the domestic bond market and augurs wellfor the development of a deep and liquid bond market.The ample liquidity situation in the banking system,the decline in interest rates, the improved credit riskprofiles of corporate bonds, the higher yields offeredrelative to short-term interbank money market depositsand the recovery in economic activity, were among thecontributory factors to the higher trading activity.
As in previous years, trading was focused on theover-the-counter segment of the bond market(97.4%), particularly MGS. Trading of MGS washigher at RM63.8 billion (1998: RM33.1 billion) andcontinued to account for the largest share of totaltrading volume. Nevertheless, its share of totaltransactions at 41% was significantly lower than the72.8% recorded in 1998. This decline in the shareof MGS, reflected the significantly higher trading ofthe bonds issued by the special purpose vehicleestablished to recapitalise banking institutions,Danamodal Nasional Berhad (Danamodal). Thetrading volume of Danamodal bonds amounted toRM40.6 billion in 1999 compared with RM476 milliontraded in the last three months of 19985. As a result,its share of total trading volume rose from a mere1% in 1998 to 26.1% in 1999, making it the secondmost actively traded bond after MGS, taking theplace of Khazanah bonds. Danamodal bonds werealso the most liquid instrument in the bond marketin 1999 (liquidity ratio: 369.4%).
The number of ratings of new issues (including short-term debt securities) conducted by the two domesticrating agencies, Rating Agency Malaysia Berhad (RAM)and Malaysia Rating Corporation Berhad (MARC), wassignificantly higher in 1999. During the year, RAMcompleted 46 rating exercises valued at RM35.2 billion(1998: six exercises totalling RM934 million). Of these,42 were long-term issues while four were short-term.Similarly for MARC, new issue ratings numbered 22compared with seven issues in the preceding year, whilethe total value of debt rated was RM8.3 billion (RM2.5billion in 1998). Thirteen of the ratings were long-termissues and nine were short-term issues.
Several measures were introduced during the year,to further develop the ringgit bond market. The keymeasures are contained in the box, Key Capital MarketMeasures in 1999.
Unit T rust Industry
The unit trust industry continued to expand in1999, as reflected in the growth of five indicatorsof the unit trust industry (Table 4.29), namely thenumber of unit trust management companies, numberof funds launched, number of units in circulation,number of accounts, as well as the net asset value(NAV). Contributing to the expansion of the industryin 1999 was the 13.5% increase in the number offunds, with the launching of 12 funds during the year(six and nine funds launched in 1997 and 1998respectively), bringing the number of unit trust fundsto 101. One unit trust management company wasalso established in 1999 (the same number as in1997 and 1998), bringing the number of such
Table 4.28Trading of Ringgit Bonds
1998 1999
% %Share Share
Malaysian GovernmentSecurities 33,085 72.8 63,838 41.0
Government InvestmentIssues 3 0.0 0 0.0
Khazanah Bonds 5,013 11.0 16,098 10.3Danaharta Bonds 15 0.0 9,410 6.0Danamodal Bonds 476 1.0 40,635 26.1Cagamas Bonds 4,463 9.8 12,944 8.3Other PDS (Unlisted) 1,886 4.1 8,856 5.7Other PDS (Listed) 536 1.2 4,094 2.6
Total 45,475 100.0 155,876 100.0
Source: Bond Information & Dissemination System
RM mil RM mil
0
10,000
20,000
30,000
40,000
50,000
60,000
70,000
Graph 4.24Trading of Ringgit Bonds
RM million
OtherPDS
(Unlisted )
KhazanahBonds
CagamasBonds
OtherPDS
(Listed)
GovernmentInvestment
Issues
1998: RM45.5 bil
DanamodalBonds
DanahartaBonds
MalaysianGovernmentSecurities
1999: RM155.9 bil
Source: Bond Information and Dissemination System
5 Danamodal bonds were issued on 21 October 1998.
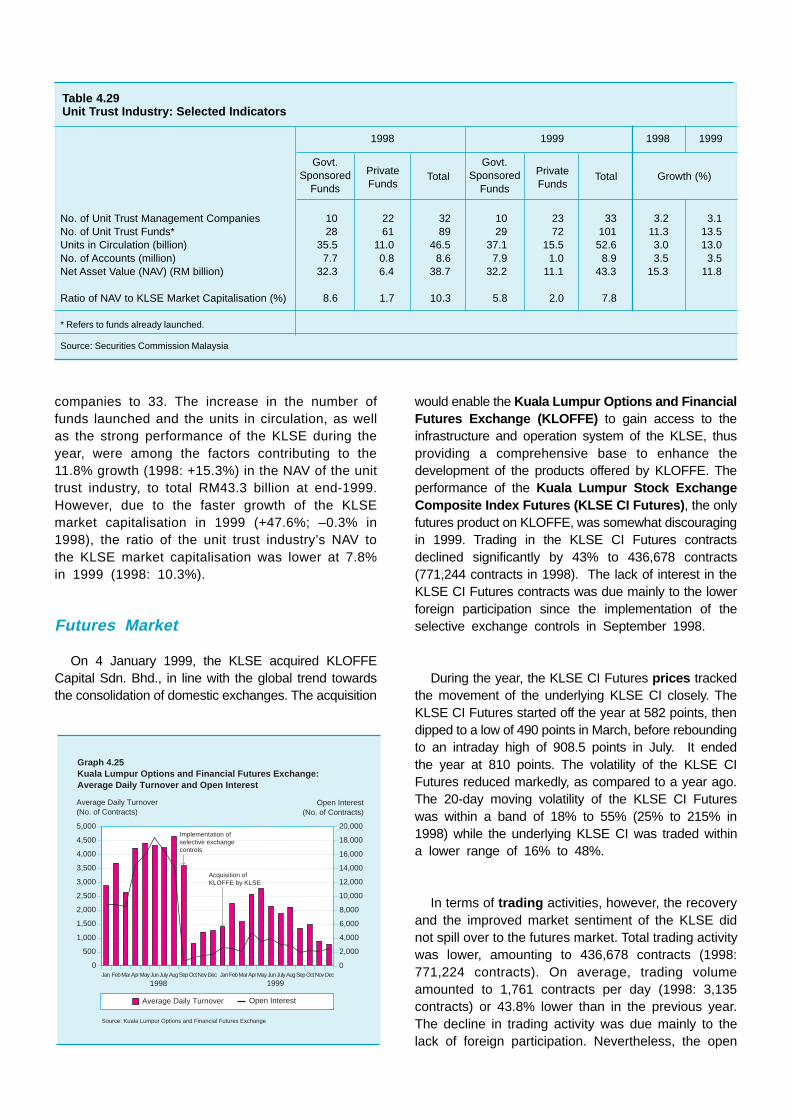
companies to 33. The increase in the number offunds launched and the units in circulation, as wellas the strong performance of the KLSE during theyear, were among the factors contributing to the11.8% growth (1998: +15.3%) in the NAV of the unittrust industry, to total RM43.3 billion at end-1999.However, due to the faster growth of the KLSEmarket capitalisation in 1999 (+47.6%; –0.3% in1998), the ratio of the unit trust industry’s NAV tothe KLSE market capitalisation was lower at 7.8%in 1999 (1998: 10.3%).
Futures Market
On 4 January 1999, the KLSE acquired KLOFFECapital Sdn. Bhd., in line with the global trend towardsthe consolidation of domestic exchanges. The acquisition
would enable the Kuala Lumpur Options and FinancialFutures Exchange (KLOFFE) to gain access to theinfrastructure and operation system of the KLSE, thusproviding a comprehensive base to enhance thedevelopment of the products offered by KLOFFE. Theperformance of the Kuala Lumpur Stock ExchangeComposite Index Futures (KLSE CI Futures) , the onlyfutures product on KLOFFE, was somewhat discouragingin 1999. Trading in the KLSE CI Futures contractsdeclined significantly by 43% to 436,678 contracts(771,244 contracts in 1998). The lack of interest in theKLSE CI Futures contracts was due mainly to the lowerforeign participation since the implementation of theselective exchange controls in September 1998.
During the year, the KLSE CI Futures prices trackedthe movement of the underlying KLSE CI closely. TheKLSE CI Futures started off the year at 582 points, thendipped to a low of 490 points in March, before reboundingto an intraday high of 908.5 points in July. It endedthe year at 810 points. The volatility of the KLSE CIFutures reduced markedly, as compared to a year ago.The 20-day moving volatility of the KLSE CI Futureswas within a band of 18% to 55% (25% to 215% in1998) while the underlying KLSE CI was traded withina lower range of 16% to 48%.
In terms of trading activities, however, the recoveryand the improved market sentiment of the KLSE didnot spill over to the futures market. Total trading activitywas lower, amounting to 436,678 contracts (1998:771,224 contracts). On average, trading volumeamounted to 1,761 contracts per day (1998: 3,135contracts) or 43.8% lower than in the previous year.The decline in trading activity was due mainly to thelack of foreign participation. Nevertheless, the open
0
500
1,000
1,500
2,000
2,500
3,000
3,500
4,000
4,500
5,000
0
2,000
4,000
6,000
8,000
10,000
12,000
14,000
16,000
18,000
20,000
Average Daily Turnover(No. of Contracts)
Open Interest(No. of Contracts)
Graph 4.25Kuala Lumpur Options and Financial Futures Exchange:Average Daily Turnover and Open Interest
Average Daily Turnover Open Interest
Jan Feb Mar Apr May Jun July Aug Sep Oct Nov Dec Jan Feb Mar Apr May Jun July Aug Sep Oct Nov Dec
1998 1999
Source: Kuala Lumpur Options and Financial Futures Exchange
Implementation ofselective exchangecontrols
Acquisition ofKLOFFE by KLSE
Table 4.29Unit Trust Industry: Selected Indicators
1998 1999 1998 1999
No. of Unit Trust Management Companies 10 22 32 10 23 33 3.2 3.1No. of Unit Trust Funds* 28 61 89 29 72 101 11.3 13.5Units in Circulation (billion) 35.5 11.0 46.5 37.1 15.5 52.6 3.0 13.0No. of Accounts (million) 7.7 0.8 8.6 7.9 1.0 8.9 3.5 3.5Net Asset Value (NAV) (RM billion) 32.3 6.4 38.7 32.2 11.1 43.3 15.3 11.8
Ratio of NAV to KLSE Market Capitalisation (%) 8.6 1.7 10.3 5.8 2.0 7.8
* Refers to funds already launched.
Source: Securities Commission Malaysia
PrivateFunds
Govt.Sponsored
FundsGrowth (%)TotalTotal Private
Funds
Govt.Sponsored
Funds

interest, which is the number of unsettled positions,increased from 1,650 contracts at the end of 1998 to2,432 contracts at the end of 1999. The DerivativesLiquidity Ratio (DLR), representing the ratio of theturnover value of the futures contracts to the turnovervalue of the component stocks, stood at 27.9% at theend of the year (24.3% in the previous year). TheDLR of less than 100% implied that investors’ exposuresin the underlying market were not fully covered by itsfutures contracts, leaving room for further improvementin the turnover value of the KLSE CI Futures contracts.
In terms of monthly activity, trading was mostactive in April and May, with the daily trading volumeaveraging 2,570 contracts in April and 2,780 contractsin May. In addition, month-end open interest wasat its highest in April at 4,878 contracts. This wasthe period when the market sentiment in theunderlying KLSE CI turned bullish, responding to aseries of positive news, such as the reduction ofthe BNM intervention rate, the upgrading ofMalaysia’s outlook by international credit ratingagencies and the overall positive sentiment in theregion. In contrast, trading activity declined noticeablyin the last quarter, averaging 879 contracts per dayin November and 767 contracts per day in December.The lower trading activity reflected market concernssurrounding the general elections and the Y2K issue.
Market demography of KLOFFE changed markedlyin 1999. Domestic retailers emerged as the major players,accounting for 51% of the total trade (1998: 33%),followed by local members (26%; 1998: 15%). Thenumber of local members increased in 1999 to 61 (1998:49), reflecting the growing awareness in futures trading.In the past, the market demography of futures trading
had been characterised by the dominance of foreigninstitutions, which accounted for more than 45% of thetotal trade in the period from 1996 to August 1998. In1999, the participation of foreign institutions fellsignificantly to 14% of the total trade (47% in 1998),following their reduced interest in KLOFFE since theselective exchange controls were introduced. However,there was renewed foreign interest in the second halfof 1999 when stock market developments reflected thestronger-than-expected recovery in economic growth.The participation of foreign institutions increased from8% of total trade in the fourth quarter of 1998 to 14%in the third quarter of 1999 and rose further to 18%in the last quarter of 1999. Recognising the need toincrease the participation of domestic institutions so thatKLOFFE would have a more balanced participationamong domestic players, the Futures Industry Act (FIA)was amended to allow domestic fund managers toparticipate in the futures industry. Consequently, theshare of domestic institutions, although small, improvedfrom 1% in 1998 to 4% in 1999.
In 1999, the 3-month Kuala Lumpur InterbankOffered Rate (KLIBOR) futures contract was moreactively traded on the Commodity and MonetaryExchange of Malaysia (COMMEX). KLIBOR futuresrecorded both a higher turnover during the year (dailyaverage of 115 contracts; 102 in 1998) and a recordhigh open interest position at the end of the year(7,107 contracts; 3,092 in 1998).
The higher trading activity was due mainly tothe improved liquidity situation in the underlyingcash market and the revival of the market maker
0
50
100
150
200
250
0
1,000
2,000
3,000
4,000
5,000
6,000
7,000
8,000
9,000
10,000
Average Daily Turnover(No. of Contracts)
Open Interest(No. of Contracts)
Graph 4.27KLIBOR Futures: Average Daily Turnover & Open Interest
Source: Commodity and Monetary Exchange of Malaysia
Average Daily Turnover Open Interest
Jan Feb Mar Apr May Jun July Aug Sep Oct Nov Dec Jan Feb Mar Apr May Jun July Aug Sep Oct Nov Dec1998 1999
Foreign Institutions
Domestic Retail
Local Members
Proprietary
Foreign Retail
Domestic Institutions
0 10 20 30 40 50 60
Graph 4.26Kuala Lumpur Options and Financial Futures Exchange:Market Demography
1998
1999
%
Source: Kuala Lumpur Options and Financial Futures Exchange
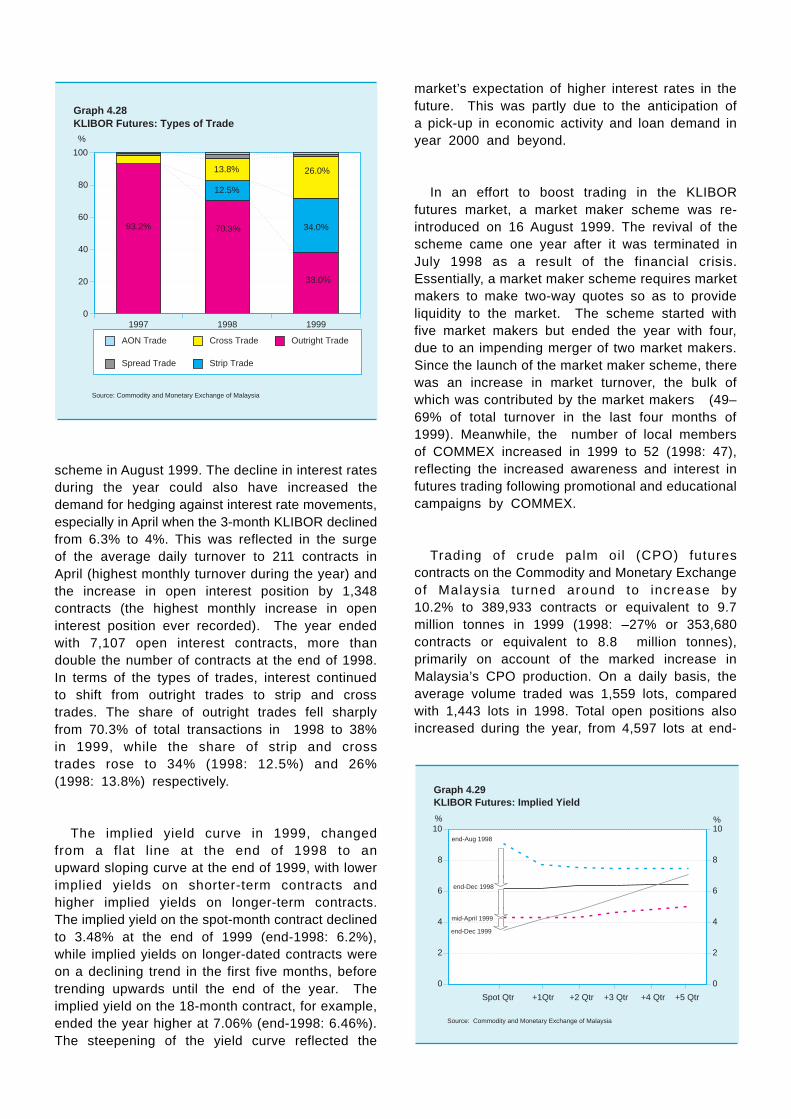
scheme in August 1999. The decline in interest ratesduring the year could also have increased thedemand for hedging against interest rate movements,especially in April when the 3-month KLIBOR declinedfrom 6.3% to 4%. This was reflected in the surgeof the average daily turnover to 211 contracts inApril (highest monthly turnover during the year) andthe increase in open interest position by 1,348contracts (the highest monthly increase in openinterest position ever recorded). The year endedwith 7,107 open interest contracts, more thandouble the number of contracts at the end of 1998.In terms of the types of trades, interest continuedto shift from outright trades to strip and crosstrades. The share of outright trades fell sharplyfrom 70.3% of total transactions in 1998 to 38%in 1999, while the share of strip and crosstrades rose to 34% (1998: 12.5%) and 26%(1998: 13.8%) respectively.
The implied yield curve in 1999, changedfrom a flat line at the end of 1998 to anupward sloping curve at the end of 1999, with lowerimplied yields on shorter-term contracts andhigher implied yields on longer-term contracts.The implied yield on the spot-month contract declinedto 3.48% at the end of 1999 (end-1998: 6.2%),while implied yields on longer-dated contracts wereon a declining trend in the first five months, beforetrending upwards until the end of the year. Theimplied yield on the 18-month contract, for example,ended the year higher at 7.06% (end-1998: 6.46%).The steepening of the yield curve reflected the
market’s expectation of higher interest rates in thefuture. This was partly due to the anticipation ofa pick-up in economic activity and loan demand inyear 2000 and beyond.
In an effort to boost trading in the KLIBORfutures market, a market maker scheme was re-introduced on 16 August 1999. The revival of thescheme came one year after it was terminated inJuly 1998 as a result of the financial crisis.Essentially, a market maker scheme requires marketmakers to make two-way quotes so as to provideliquidity to the market. The scheme started withfive market makers but ended the year with four,due to an impending merger of two market makers.Since the launch of the market maker scheme, therewas an increase in market turnover, the bulk ofwhich was contributed by the market makers (49–69% of total turnover in the last four months of1999). Meanwhile, the number of local membersof COMMEX increased in 1999 to 52 (1998: 47),reflecting the increased awareness and interest infutures trading following promotional and educationalcampaigns by COMMEX.
Trading of crude palm oil (CPO) futurescontracts on the Commodity and Monetary Exchangeof Malaysia turned around to increase by10.2% to 389,933 contracts or equivalent to 9.7million tonnes in 1999 (1998: –27% or 353,680contracts or equivalent to 8.8 million tonnes),primarily on account of the marked increase inMalaysia’s CPO production. On a daily basis, theaverage volume traded was 1,559 lots, comparedwith 1,443 lots in 1998. Total open positions alsoincreased during the year, from 4,597 lots at end-
Graph 4.28KLIBOR Futures: Types of Trade
1997 1998 19990
20
40
60
80
100
Outright Trade
Strip Trade
Cross Trade
Spread Trade
AON Trade
93.2% 70.3%
12.5%
13.8% 26.0%
34.0%
38.0%
%
Source: Commodity and Monetary Exchange of Malaysia
0
2
4
6
8
10
0
2
4
6
8
10% %
Graph 4.29KLIBOR Futures: Implied Yield
end-Aug 1998
end-Dec 1998
mid-April 1999
end-Dec 1999
Spot Qtr +1Qtr +2 Qtr +3 Qtr +4 Qtr +5 Qtr
Source: Commodity and Monetary Exchange of Malaysia
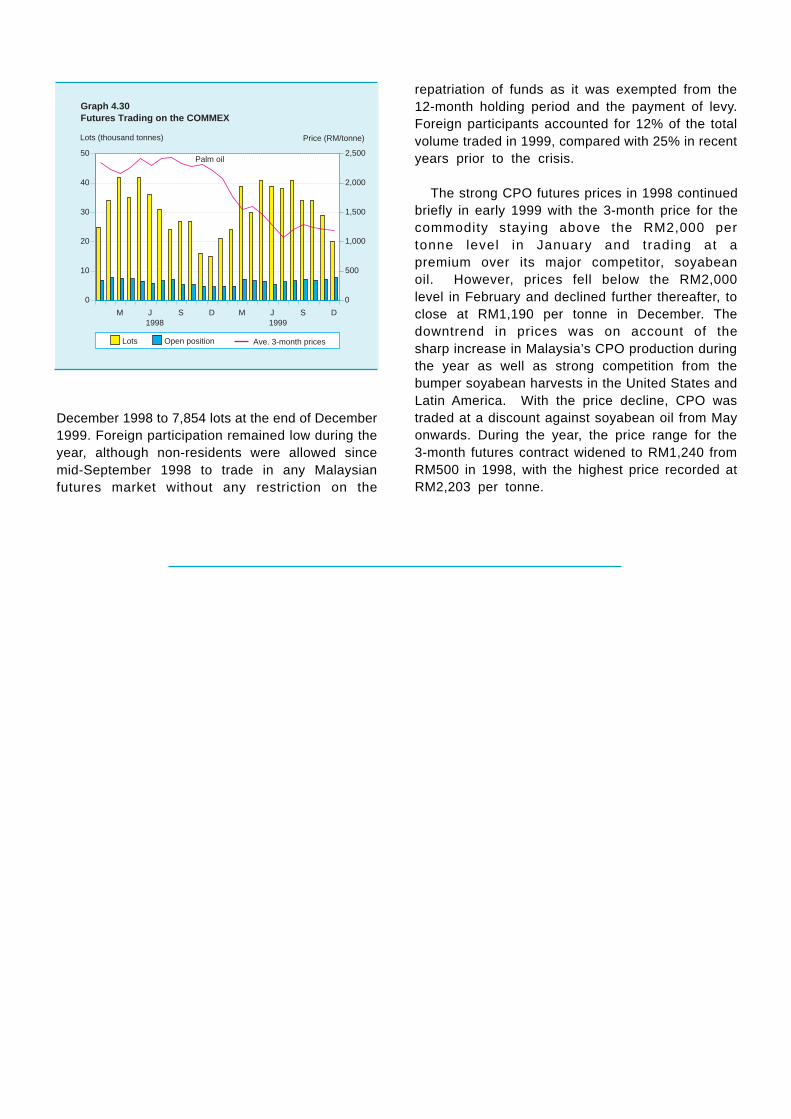
December 1998 to 7,854 lots at the end of December1999. Foreign participation remained low during theyear, although non-residents were allowed sincemid-September 1998 to trade in any Malaysianfutures market without any restriction on the
repatriation of funds as it was exempted from the12-month holding period and the payment of levy.Foreign participants accounted for 12% of the totalvolume traded in 1999, compared with 25% in recentyears prior to the crisis.
The strong CPO futures prices in 1998 continuedbriefly in early 1999 with the 3-month price for thecommodity staying above the RM2,000 pertonne level in January and trading at apremium over its major competitor, soyabeanoil. However, prices fell below the RM2,000level in February and declined further thereafter, toclose at RM1,190 per tonne in December. Thedowntrend in prices was on account of thesharp increase in Malaysia’s CPO production duringthe year as well as strong competition from thebumper soyabean harvests in the United States andLatin America. With the price decline, CPO wastraded at a discount against soyabean oil from Mayonwards. During the year, the price range for the3-month futures contract widened to RM1,240 fromRM500 in 1998, with the highest price recorded atRM2,203 per tonne.
0
10
20
30
40
50
0
500
1,000
1,500
2,000
2,500
Lots Open position Ave. 3-month prices
Lots (thousand tonnes) Price (RM/tonne)
Graph 4.30Futures Trading on the COMMEX
Palm oil
1998 1999M J S D M J S D


