Embed Size (px)
Citation preview

THE FINANCIAL EVALUTATION OF INVESTMENTS: THE TIME VALUE OF MONEY, THE PRESENT VALUE, NPV, IRR
Lesson 9
Castellanza, 7th November 2018
Corporate Finance

Corporate Finance Copyright LIUC
SUMMARY
The investment definition and analysis
Financial value of time
The cash-flow model
The present value notion
Capital budget techniques
2

Corporate Finance Copyright LIUC
3
SUMMARY FROM THE PREVIOUS LECTURES
In the previous lecture it has been analysed how a company
finances its investments if financial flows deriving from the
difference between revenues and costs are not sufficient.
In general a company needs financing sources (debt, equity
and “quasi-equity” products) to cover investments in assets
and working capital needs.
In this lecture we will focus on the investment itself and how
to evaluate if a certain investment can be profitable for the
company and/or for its shareholders.

Corporate Finance Copyright LIUC
4
How can an investment be defined?
An investment is a transfer
of monetary resources over time,
mainly characterized by net outflows in the first stage
and net inflows in the following periods.
THE INVESTMENT: DEFINITION

Corporate Finance Copyright LIUC
5
THE INVESTMENT: STRUCTURE
F(t)
t
Implementation Useful life

Corporate Finance Copyright LIUC
6
We will focus on investment decisions such as:
• increase productive capacity;
• buy or improve plant and machinery (equipment
investments decisions) / rationalize processes (“make or
buy” decisions);
• develop and strengthen products’ and services’ range;
• acquisition strategies.
The objective of the investment, or capital budgeting, decision
is to find real assets which are worth more than they cost.
THE INVESTMENT: MAIN PURPOSES

Corporate Finance Copyright LIUC
7
Investment Opportunities
(real activities)
ENTERPRISE
Investment Opportunities
(financial activities)
Risk/Return Relationship
Risk/Return Relationship
CAPITAL BUDGETING: FORCES AT PLAY
SHARE-HOLDERS

Corporate Finance Copyright LIUC
8
As we have already seen, investments can be financed
through:
Equity (shareholders capital increase)
Shareholders loans
Financial debt: e.g. loans, bonds, others.
The choice among this sources depends on:
Capital supply;
Enterprise conditions;
Economic effects;
Non-economic effects;
Financial flexibility.
HOW TO FINANCE INVESTMENTS

Corporate Finance Copyright LIUC
9
The company has to go through the following stages before
taking an investment decision:
1. Scouting among different investments’ options
(strategic and commercial perspective);
2. Valuation of the selected options from a technical
perspective.
3. Valuation of the projects from a financial point of view;
4. Selection of the most profitable projects.
THE INVESTMENT ANALYSIS: KEY STAGES

Corporate Finance Copyright LIUC
10
To make an efficient valuation and to make the best choice
among the investment opportunities, it is important to have
clear information about:
1. Invested capital;
2. Investment duration;
3. Costs and revenues connected to the investment;
4. Cash flow generated by the investment;
5. Terminal value of the invested capital at the end of the
investment period;
6. Risk related to the investment.
KEY INFORMATION FOR A CONSISTENT VALUATION

Corporate Finance Copyright LIUC
11
INVESTMENTS: FINANCIAL ANALYSIS
The key drivers of the financial analysis are:
risk (connected to every investment)
return (the “result” generated by the investment)
time (the investment duration)
Financial value of time
Cost of capital (fund raising)
Return of capital (investments)

Corporate Finance Copyright LIUC
12
FINANCIAL VALUE OF TIME
Time has a financial value due to:
• risk (it is proportional to the probability that future cash
flows will be effectively collected);
• flexibility (possibility to reinvest present cash flow);
• temporal distribution of value (preference for goods
immedialtely avaiable).
In fact, “a dollar tomorrow is worth less than a dollar today”.

Corporate Finance Copyright LIUC
13
Both the investments are characterized by the same initial
outflow; however, the temporal distribution of the inflows is
clearly different.
This implies that the investments have different values.
CASH FLOW TEMPORAL DISTRIBUTION
F(t)
Time 0 1 2 3 4
F(t)
Time 0 1 2 3 4

Corporate Finance Copyright LIUC
14
The analysis of cash flows
is the driver that allows the company/investor
to valuate the profitability and the suitabilitity
of an investment opportunity.
INVESTMENT DECISION: HOW TO DECIDE

Corporate Finance Copyright LIUC
15
From a financial perspective, it is necessary to take into
account three main drivers to efficiently determine the
value of an investments:
• the cash flow amount;
• the temporal distribution of the cash flows;
• the financial value of time.
KEY DRIVERS FOR A CONSISTENT VALUATION

Corporate Finance Copyright LIUC
16
The significant cash flows to be considered in the analysis
are:
1. Cash flow from operating activities.
2. Cash flow after tax.
3. Cash flow before financial expenses.
4. Incremental cash flow (cash flows resulting from the
investment- the aim is to calculate the investment’s
marginal contribution to the company’s profitability).
CASH FLOWS GENERATED BY INVESTMENTS

Corporate Finance Copyright LIUC
17
RELEVANT CASH FLOWS DETERMINATION
Ebit
+ Depreciation/Amortization
± Balance of source/use of Funds (Etp fund, others)
- Tax
= First Cash flow from current operations
± Changes in Net Working Capital
= Second Cash flow from current operations
- Capital Expenditures
+ Divestments
= Cash flow from operations
± Financing flows
± Dividends & Changes in Equity
± Non recurring/Extraordinary flows
= Cash Balance ( Cash)
Relevant cash flow

Corporate Finance Copyright LIUC
18
GUIDELINES FOR CASH FLOW DETERMINATION
Do not confuse average and marginal returns (focusing only on
marginal returns)
Take into account “collateral” effects
Do not forget to cover the working capital requirement connected
to the investment
Do not consider sunk costs
Analyze opportunity cost
Pay attention on the share-out/division of common cost
Consider the present value of the fiscal benefits connected to
amortization

Corporate Finance Copyright LIUC
19
Present Value (PV) is the value at a given date of a future
amount of money, discounted to reflect the financial value of
time.
Where:
Ft = cash flow generated by the investment
k = discount rate
1/(1 + k)t = discount factor
PV = Ft
(1 + k)t
PRESENT VALUE

Corporate Finance Copyright LIUC
20
R = Net cash flow/ Investment = (F - I) / I
(120 - 100) / 100 = 20%
Considering financial value of time:
R = Discounted cash flow/ Investment = (Fa - I) / I
if k = 8%, (111 - 100) / 100 = 11%
EXAMPLE

Corporate Finance Copyright LIUC
21
F(t)
Time
F0
F1
F2
F3
F4
Discount
Where: Ft = cash flow on a given date t n = number of period k = discount rate 1/(1+k) = discount factor
INVESTMENT PRESENT VALUE
n
tt
t
k
FPV
1 1

Corporate Finance Copyright LIUC
22
If k = 9%,
what is the PV of Euro 374 paid in year 9?
EXERCISE 1

Corporate Finance Copyright LIUC
23
If the PV of Euro 139 is Euro 125,
what is the DISCOUNT FACTOR?
EXERCISE 2

Corporate Finance Copyright LIUC
24
If the 8-year discount factor is 0.285,
what is the PV of 596 received in 8 years?
EXERCISE 3

Corporate Finance Copyright LIUC
25
A project produces the following cash flows:
If k = 15%, what is the project’s PV?
EXERCISE 4
Y F
1 432
2 137
3 797

Corporate Finance Copyright LIUC
26
There are different methods to valuate and to compare
investment’s opportunities.
• The Net Present Value (NPV)
• The Internal Rate of Return (IRR)
• The Pay-Back Period (PBP)
METHODS FOR THE INVESTMENTS VALUATION

Corporate Finance Copyright LIUC
27
THE NET PRESENT VALUE (NPV)
The Net Present Value is the value that an investment adds to a
company, expressed as it is immediately available.
It takes into account not only cash inflows generated by the
investment, but also cash outflows needed to develop the
investment plan.
The NPV is the sum of each cash inflow/outflow discounted
back to its present value (PV).
NPV is the difference between present value and market value
of the investment (usually, represented by F0).

Corporate Finance Copyright LIUC
28
HOW TO ESTIMATE THE NET PRESENT VALUE
1. Estimate of future cash flows of the investment for every
year of the investment project.
2. Estimate of the discount rate.
3. Discount of future cash flows for every year.
4. Sum of discounted cash flows (= Present Value of the
investment).
5. The NPV is simply the PV of future cash inflows minus the
cash outflow needed to carry out the investment project.

Corporate Finance Copyright LIUC
29
THE NET PRESENT VALUE
Considering an investment plan characterized by five cash
inflows and only a single cash outflow at the beginning, the
NPV formula is:
Ft = cash inflows
F0 = cash outflow
k = discount rate
55
4
4
3
3
2
2
1
10
11111 k
F
k
F
k
F
k
F
k
FFNPV
n
tt
t
k
FNPV
0 1

Corporate Finance Copyright LIUC
30
THE NET PRESENT VALUE: PROPERTIES
The NPV allows the company to valuate the added value
generated by the investment plan.
A project is profitable (in a financial point of view) only if its
NPV has a positive value (NPV>0). Comparing investment’s
opportunities, the one with the higher NPV should be
selected.
If a project has positive NPV, it means that it is to generate
more cash inflows than cash outflows.

Corporate Finance Copyright LIUC
31
THE NPV: PROS AND CONS
PROS:
It takes into account financial value of time
It considers both future cash flows and cost of capital (throughout the discount rate)
CONS:
It is based on the “perfect markets” assumption

Corporate Finance Copyright LIUC
32
Project: construction of an office building on a land. The
construction will take 2 years and, when completed, the
building will be sold and will be worth Euro 400.000. The
project produces the following cash flows:
:
If k = 7%, what is the project’s NPV?
EXAMPLE
Period t = 0 t = 1 t = 2
Land -50.000
Construction -100.000 -100.000 -100.000
Payoff +400.000
Total -150.000
-100.000
+300.000

Corporate Finance Copyright LIUC
33
NPV = -150.000 – [100.000/(1+0.07)]+ [300.000/ (1+0.07)2]
NPV = -150.000 – [100.000/(1.07)] + [300.000/(1.07)2]
NPV = -150.000 – [100.000/(1.07)] + [300.000/(1.15)]
NPV = -150.000 – 93.457,94 + 260.869,57 =
=18.573,67
EXAMPLE

Corporate Finance Copyright LIUC
34
THE NET PRESENT VALUE AND THE DISCOUNT RATE
The PV and NPV of an asset vary in inverse proportion to the
discounting rate (k)
F0 2
Y 1 2 3 4 5
CF 0,8 0,8 0,8 0,8 0,8
Discounting rate 20%
Discounting factor 0,833 0,694 0,579 0,482 0,402
0,667 0,556 0,463 0,386 0,322
PV 2,392
NPV 0,392
Discounting rate 30%
Discounting factor 0,769 0,592 0,455 0,350 0,269
0,615 0,473 0,364 0,280 0,215
PV 1,948
NPV 0,052

Corporate Finance Copyright LIUC
35
THE INTERNAL RATE OF RETURN (IRR)
If NPV has always a value, then there must exist a discounting
rate that makes NPV = 0.
The Internal Rate of Return
In other words, it represents the maximum cost of the
fundraising activity (in other words, the maximum sustainable
cost of capital), in order to maintain the project’s profitability.
Basically, an investment whose IRR exceeds its cost of capital
adds value to the company.

Corporate Finance Copyright LIUC
36
THE INTERNAL RATE OF RETURN: FORMULA
IRR: rate of return to project required to obtain an NPV = 0
0
10
n
tt
t
IRR
F

Corporate Finance Copyright LIUC
37
THE INTERNAL RATE OF RETURN: CONSIDERATIONS
1. The IRR does NOT represent the return of the project, but
the return of a combination of investments:
The original project;
The additional initiatives that are possible thanks to the
the re-investment of the additional flows generated.
2. The IRR must be at least equal to the cost of capital;
otherwise the investment is not profitable at all (from a
financial perspective).

Corporate Finance Copyright LIUC
38
THE INTERNAL RATE OF RETURN: CONSIDERATIONS
IRR is used frequently in financial markets because it
immedialtely tells the investor the return to be expected for
a given level of risk.
The investor can compare this expected return with his
required return tate, thereby simplifying the investment
decision.

Corporate Finance Copyright LIUC
39
THE PAYBACK PERIOD (PBP)
The Payback period requires that the initial outlay of a
project should be recovered within a specified period.
The PBP is the length of time required to recover the initial
investment of the project.
It considers the initial investment.
It considers the future cash flows generated by the
investment and the time that those cash flows need to
cover the initial investment.
If PBP is less than the pre-determined cut-off, accept the
project.

Corporate Finance Copyright LIUC
40
Consider Projects A and B:
EXAMPLE – PBP & NPV
Project F0 F1 F2 F3 PBP, Years
NPV at 10%
A -2.000 + 2.000
0 0 1 -182
B -2.000 + 1.000 + 1.000 +5.000 2 +3.492
The NPV rule tells us to reject project A and accept project B.
But if you look at how rapidly each project pays back its initial
investment, with project A you take 1 year to recover the initial
outflow and with project B you take 2 years.

Corporate Finance Copyright LIUC
41
EXAMPLE – PBP & NPV
If the company used the payback rule with a cutoff period of 1
year, it would accept only project A; if it used the payback rule
with a cutoff period of 2 more years, it would accept both A and
B.
Regardless the choice of the cutoff period, the payback rule
gives a different answer from the NPV. WHY? Payback gives
equal weight to all cash flows without considering any risk
rate.
Project F0 F1 F2 F3 PBP, Years
NPV at 10%
C -2.000 + 1.000
-500 +3.000 3 749.8

Corporate Finance Copyright LIUC
42
Consider Projects A, B and C:
EXAMPLE – PBP & NPV
Project F0 F1 F2 F3 PBP, Years
NPV at 10%
A -2.000 + 1.000
+ 1.000 +5.000 2 3.492
B -2.000 0
+ 2.000 +5.000 2 +3.409
C -2.000
+ 1.000
+1.000
+ 100.000
2 74.867
The PB rule says that these projects are all equally attractive. But project A has a higher NPV than project B; and project C has a higher NPV than either A & B.
In order to use the PB rule a firm had to decide on an APPROPRIATE cutoff date and to use in the same time different valuation techniques.
Corporate Finance Copyright LIUC
43
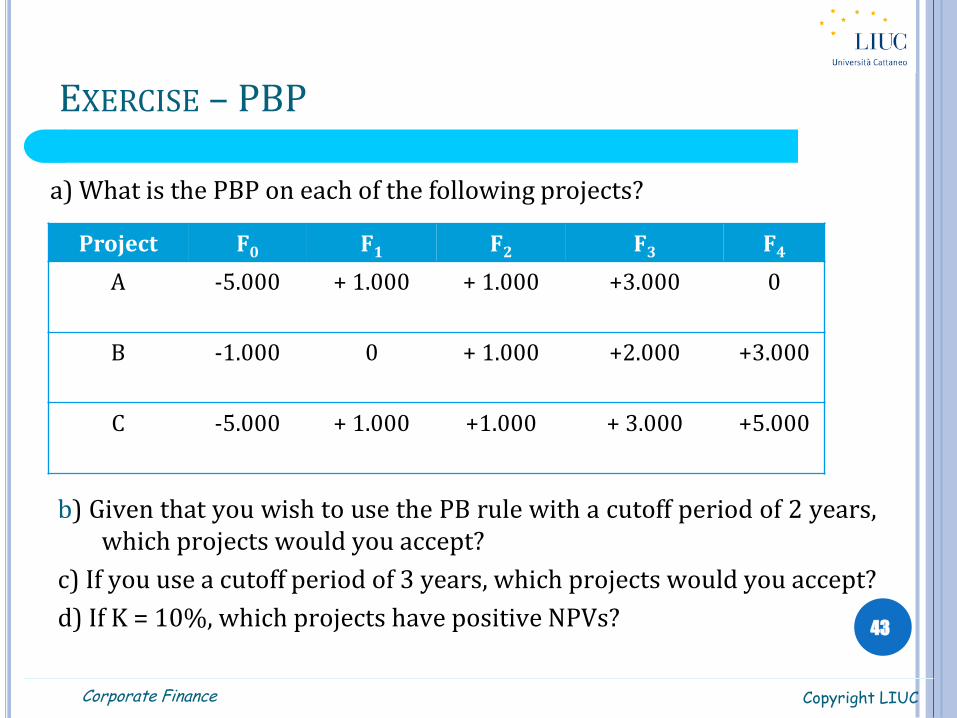
a) What is the PBP on each of the following projects?
EXERCISE – PBP
Project F0 F1 F2 F3 F4
A -5.000 + 1.000
+ 1.000 +3.000 0
B -1.000 0
+ 1.000 +2.000 +3.000
C -5.000
+ 1.000
+1.000
+ 3.000
+5.000
b) Given that you wish to use the PB rule with a cutoff period of 2 years, which projects would you accept?
c) If you use a cutoff period of 3 years, which projects would you accept?
d) If K = 10%, which projects have positive NPVs?

Corporate Finance Copyright LIUC
a) A = 3 years, B = 2 years, C = 3 years
b) B
c) A, B and C
d) B and C (NPV A = -1.010,52, NPV B = 3.378,15, NPV C = 2.404,55)
44
EXERCISE – SOLUTION

Corporate Finance Copyright LIUC
45
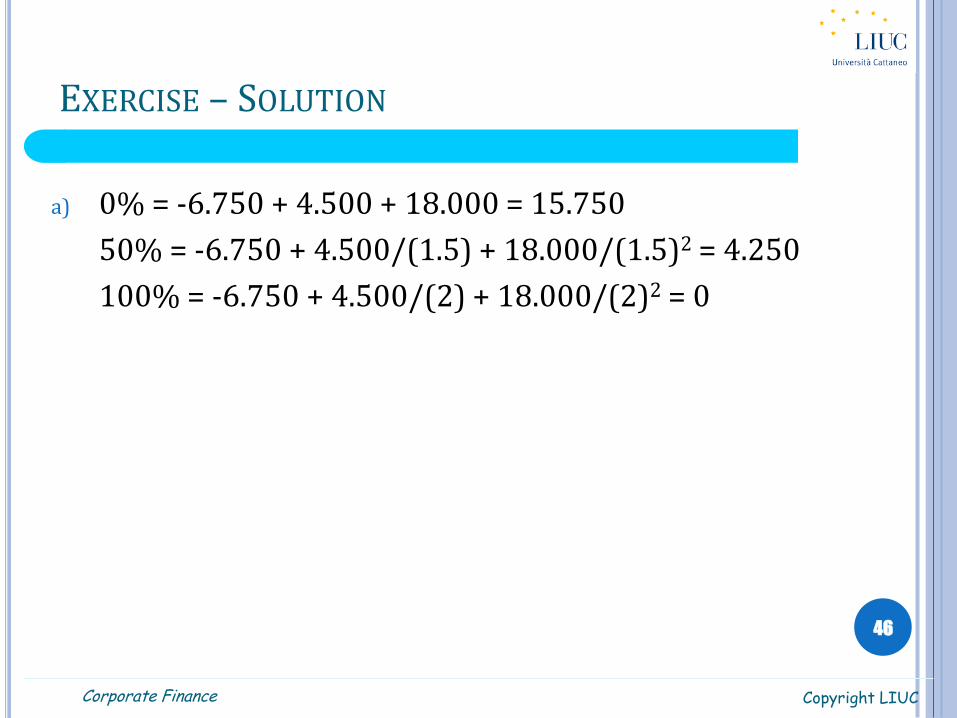
a) Calculate the NPV of the following project for discount rates (K) of 0,
50 and 100 percent:
EXERCISE – NPV
F0 F1 F2
-6.750 + 4.500
+ 18.000
Corporate Finance Copyright LIUC
a) 0% = -6.750 + 4.500 + 18.000 = 15.750
50% = -6.750 + 4.500/(1.5) + 18.000/(1.5)2 = 4.250
100% = -6.750 + 4.500/(2) + 18.000/(2)2 = 0
46
EXERCISE – SOLUTION