Embed Size (px)
Citation preview
Ofgem/Ofgem E-Serve 9 Millbank, London SW1P 3GE www.ofgem.gov.uk
The final report of the Community Energy
Saving Programme (CESP) 2009-2012
Final Report
Contact:
Aileen Duffy
Reference: 65/13
Team:
Energy Efficiency
Publication date: May 2013
Email:
Overview:
This document is the final statutory report on the Community Energy Saving
Programme 2009-2012 (CESP). It provides details on the achievement of the targets
and obligations under the programme, which ended on 31 December 2012.
CESP required certain gas and electricity suppliers and certain electricity generators
to deliver energy saving measures to domestic energy users in specified low income
areas of Great Britain.
Energy companies were required to achieve an overall target of 19.25 million lifetime
tonnes of carbon dioxide (Mt CO2) by 31 December 2012. Energy companies
achieved 16.31 Mt CO2, almost 85% of the overall target.
The final report of the Community Energy Saving Programme (CESP) 2009-2012
2
Context
The government has introduced a range of policies to reduce the United Kingdom’s
greenhouse gas emissions by 80% by 2050. Currently, about 25% of UK emissions
result from energy used to heat and power our homes.
The Community Energy Saving Programme 2009-2012 (CESP) was a policy, set
down in legislation, designed to improve domestic energy efficiency standards in the
most deprived geographical areas across Great Britain. CESP was a separate
programme to the Carbon Emissions Reduction Target (CERT) which made energy
efficiency measures available to all consumers.
The Department of Energy and Climate Change (DECC) was responsible for setting
the overall CESP target and for designing the statutory programme through which
this target was to be achieved. Ofgem was responsible for administering the
programme, on behalf of the Gas and Electricity Markets Authority (‘the Authority’).
The CESP obligation period ran from 1 October 2009 to 31 December 2012.
Ofgem has been required annually to report to the Secretary of State for Energy and
Climate Change on progress of the programme. This final report concludes the
reporting requirements placed upon Ofgem and details the position of CESP at the
closedown of the programme.
Associated documents
The Electricity and Gas (Community Energy Saving Programme) Order 2009
Explanatory Memorandum to the Electricity and Gas (Community Energy
Saving Programme) Order 2009
Community Energy Saving Programme Generator and Supplier Guidance
Community Energy Saving Programme (CESP). Communities: Areas of Low
Income
Community Energy Saving Programme 2009-2012 Annual Report,
at 31 December 2011
Community Energy Saving Programme, half-yearly Update, issue 5,
September 2012
The final report of the Community Energy Saving Programme (CESP) 2009-2012
3
Contents
Executive summary .................................................................. 4
1. Introduction ......................................................................... 6
2. The final CESP position ......................................................... 9 Overall carbon savings ................................................................................ 9 Schemes ................................................................................................. 11 Measures and dwellings ............................................................................ 12 Regional analysis ...................................................................................... 15
Trading and transfers ................................................................................ 15
3. Final energy company achievements .................................. 21 Vertically integrated energy companies ....................................................... 24 Independent generators ............................................................................ 30
4. Carbon savings analysis ..................................................... 34 Unadjusted savings .................................................................................. 34 Individual measure adjustment .................................................................. 37 Whole house bonus .................................................................................. 38 Effectiveness of incentives ......................................................................... 38
5. Monitoring progress ........................................................... 39 Technical monitoring ................................................................................. 39 Audits ..................................................................................................... 40
6. Conclusions ........................................................................ 42 Energy company approaches ..................................................................... 42 Effectiveness of scheme design and delivery of policy intent .......................... 43 Challenges............................................................................................... 44 CESP achievements .................................................................................. 45
Appendices ............................................................................. 46 Appendix 1 - Qualifying actions .................................................................. 47 Appendix 2 - Supplier and generator licences and compliance status .............. 48 Appendix 3 - Individual and whole house bonuses ........................................ 51 Appendix 4 - Glossary ............................................................................... 52 Appendix 5 - The Authority’s powers and duties ........................................... 55
The final report of the Community Energy Saving Programme (CESP) 2009-2012
4
Executive summary
This final report fulfils the Authority’s duty to report to the Secretary of State for
Energy and Climate Change under The Electricity and Gas (Community Energy
Saving Programme) Order 2009. The report details whether the following have been
met:
the overall carbon emissions reduction target;
the supplier and generator carbon emissions reduction targets; and
the supplier and generator carbon emissions reduction obligations.
Energy companies achieved the above by setting up schemes to promote and deliver
energy saving measures to domestic energy users. Carbon savings were awarded for
each measure installed. Incentives were integral to the achievement of carbon
savings; bonus savings were awarded for the installation of specific measures, the
installation of multiple measures to a single property, and the treatment of as many
properties as possible in defined areas.
The licence holders of ten energy companies were obligated under the scheme:
six vertically integrated energy companies1: British Gas, EDF Energy, E.ON,
RWE npower, SSE2, Scottish Power, and
four independent electricity generators: Drax Power, Eggborough Power, GDF
Suez/IPM and Intergen.
Overall position
In parallel with the CESP scheme, the CERT scheme delivered carbon savings to
consumers. Across both schemes more than 99% of the combined carbon savings
were achieved.
The overall CESP target was 19.25 million lifetime tonnes of carbon dioxide (Mt CO2).
By the end of the programme (31 December 2012) energy companies had achieved
16.31 Mt CO2 (84.7%) against the overall target. As a result, this target was not
met.
Energy companies can carry forward excess activity from CESP to the Energy
Companies Obligation (ECO) and this is not taken into consideration here.
Supplier and generator targets
The CESP Order specified half of the overall target should be met by suppliers and
half by generators. The Order allowed for the trading of obligations and, following
some trading of obligations, the final supplier target was 16.63 Mt CO2 and the
generator target was 2.62 Mt CO2.
Suppliers met 92.4% and generators met 36.0% of their respective targets.
Consequently both the supplier and generator targets were not met.
1 These companies have obligated subsidiaries with both supply (gas or electricity) and generation licences 2 Prior to 2010 SSE was Scottish and Southern Energy plc
The final report of the Community Energy Saving Programme (CESP) 2009-2012
5
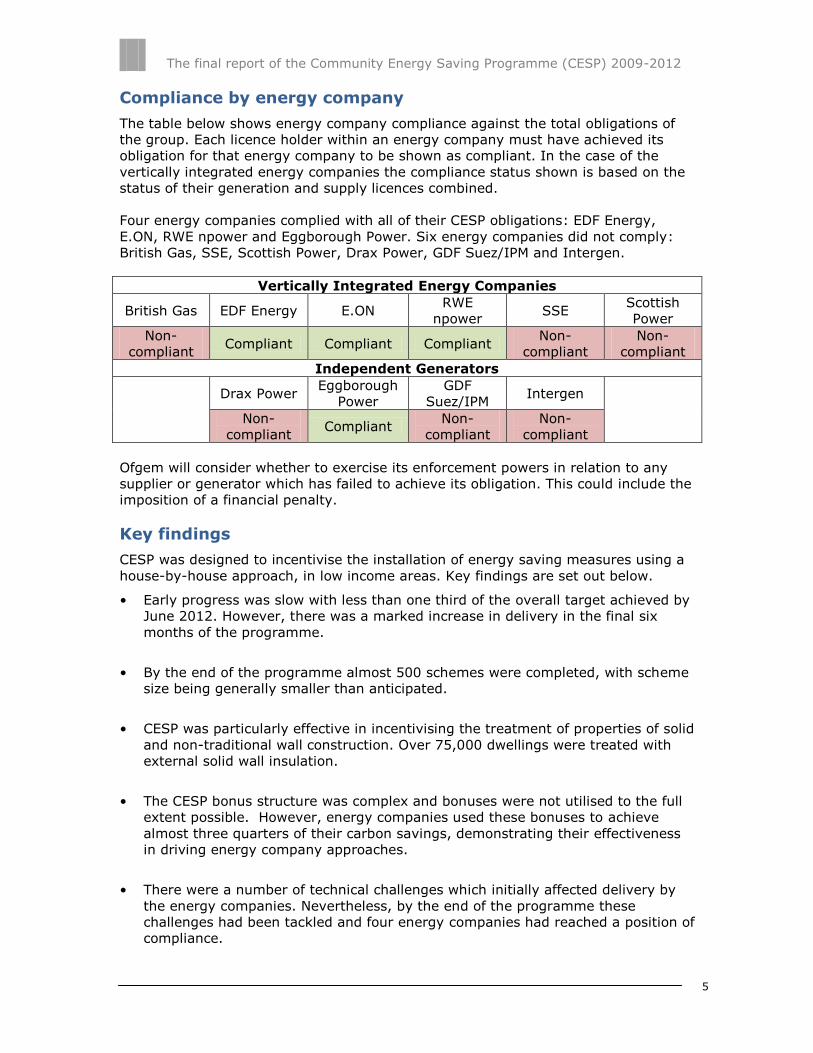
Compliance by energy company
The table below shows energy company compliance against the total obligations of
the group. Each licence holder within an energy company must have achieved its
obligation for that energy company to be shown as compliant. In the case of the
vertically integrated energy companies the compliance status shown is based on the
status of their generation and supply licences combined.
Four energy companies complied with all of their CESP obligations: EDF Energy,
E.ON, RWE npower and Eggborough Power. Six energy companies did not comply:
British Gas, SSE, Scottish Power, Drax Power, GDF Suez/IPM and Intergen.
Vertically Integrated Energy Companies
British Gas EDF Energy E.ON RWE
npower SSE
Scottish
Power
Non-
compliant Compliant Compliant Compliant
Non-
compliant
Non-
compliant
Independent Generators
Drax Power
Eggborough
Power
GDF
Suez/IPM Intergen
Non-
compliant Compliant
Non-
compliant
Non-
compliant
Ofgem will consider whether to exercise its enforcement powers in relation to any
supplier or generator which has failed to achieve its obligation. This could include the
imposition of a financial penalty.
Key findings
CESP was designed to incentivise the installation of energy saving measures using a
house-by-house approach, in low income areas. Key findings are set out below.
• Early progress was slow with less than one third of the overall target achieved by
June 2012. However, there was a marked increase in delivery in the final six
months of the programme.
• By the end of the programme almost 500 schemes were completed, with scheme
size being generally smaller than anticipated.
• CESP was particularly effective in incentivising the treatment of properties of solid
and non-traditional wall construction. Over 75,000 dwellings were treated with
external solid wall insulation.
• The CESP bonus structure was complex and bonuses were not utilised to the full
extent possible. However, energy companies used these bonuses to achieve
almost three quarters of their carbon savings, demonstrating their effectiveness
in driving energy company approaches.
• There were a number of technical challenges which initially affected delivery by
the energy companies. Nevertheless, by the end of the programme these
challenges had been tackled and four energy companies had reached a position of
compliance.
The final report of the Community Energy Saving Programme (CESP) 2009-2012
6
1. Introduction
1.1. The Electricity and Gas (Community Energy Saving Programme) Order 2009
(the Order) was made on 20 July 2009 and came into force on 1 September
2009. The Order has been subject to one amendment, on 21 December 20113.
1.2. The Order set an obligation on certain gas and electricity suppliers and certain
electricity generators to reduce carbon dioxide emissions by promoting a range
of energy efficiency measures (qualifying actions) to domestic energy users.
Appendix 1 sets out these measures.
1.3. The overall target for the Community Energy Saving Programme (CESP) was
set at 19.25 million lifetime tonnes of carbon dioxide (Mt CO2). This comprised
a target of 9.625 Mt CO2 for suppliers and 9.625 Mt CO2 for generators.
Suppliers and generators were to meet their obligations between 1 October
2009 and 31 December 2012. The suppliers and generators obligated under the
Order are set out in Appendix 2. Under the Order, obligations were imposed on
individual licence holders rather than on the parent company of a group of
licence holders. However, for clarity and ease of reporting, the analysis
presented here is aggregated at group level (referred to as an ‘energy
company’).
1.4. The Order required that energy saving measures were delivered in geographical
areas (Lower Super Output Areas in England and Wales, and Data Zones in
Scotland, hereafter referred to as ‘low income areas’) selected using the
Income Domain of the Indices of Multiple Deprivation (IMD) in England,
Scotland and Wales4. In England the lowest 10% of areas ranked in the IMD
qualified and in Scotland and Wales the lowest 15% qualified.
1.5. Energy companies achieved savings against their obligations by setting up
schemes to promote and deliver energy saving measures to domestic energy
users. Almost all CESP measures were delivered through partnerships with
social housing providers (SHPs) or by direct promotion to private households.
CESP was structured to incentivise the energy companies to install particular
measures (eg solid wall insulation), and to undertake as much activity as
possible in each house treated and in each area targeted. This was achieved
using the following incentives:
Individual measure adjustments were applied to solid wall insulation, G-
rated boiler replacements, renewable heat generation technologies and
micro combined heat and power (CHP);
3 The amendment increased the minimum number of domestic customers required to obligate a supplier from 50,000 to 250,000 4 The Index of Multiple Deprivation is a study published by the Department of Communities and Local Government, using several indicators to identify deprived areas in the UK
The final report of the Community Energy Saving Programme (CESP) 2009-2012
7
Whole house bonuses were triggered when two or more measures were
fitted in a single dwelling;
An area bonus was triggered when at least 25% of all dwellings in a low
income area were treated by the same supplier or generator.
Both unadjusted (ie before the application of bonuses) and adjusted carbon
savings are detailed in this document.
1.6. Under certain circumstances suppliers and generators were allowed to trade
their obligations and to transfer completed measures. The information and
analysis presented in this document relates to the post- trades and transfers
position.
1.7. CESP ran in parallel with the Carbon Emissions Reduction Target programme
(CERT) which Ofgem also administered.
1.8. CESP is succeeded by the Gas and Electricity (Energy Companies Obligation)
Order 2012 (the ECO). Certain qualifying actions promoted under CESP, if they
are excess to that energy company’s CESP obligations, can be carried forward
to ECO as excess actions. The carbon savings in this report include excess
activity which energy companies intend to carry forward into ECO. Excess
actions will be finalised in the summer of 2013.
1.9. Previous annual reports were based on provisional data from energy
companies. This report is based on actual determination of carbon savings,
upon which Ofgem has assessed energy companies’ compliance against their
obligations.
1.10. The remaining chapters of this report provide information on specific aspects of
the CESP programme:
Chapter Two outlines the position of CESP based on scheme completion data
submitted by the energy companies for schemes to the end of 2012. It
provides information on the delivery of schemes and measures, and the
overall carbon savings achieved. It also provides a regional breakdown of
delivery and a section illustrating the effect of trades and transfers on
obligations.
Chapter Three outlines the carbon savings achieved and approaches used by
each of the energy companies.
Chapter Four provides an analysis of unadjusted carbon savings, and how
these savings have been increased through bonuses and uplifts. It also
considers the effectiveness of the incentive structure in influencing energy
companies to install particular measures and to achieve multiple installations
in properties.
The final report of the Community Energy Saving Programme (CESP) 2009-2012
8
Chapter Five describes the mechanisms Ofgem put in place to ensure
installed measures met appropriate technical standards, and completed
measures had been reported to Ofgem correctly.
Chapter Six considers the final position achieved by the energy companies,
and discusses the approaches employed and the challenges encountered in
trying to achieve the legislative obligations and targets. It examines the
CESP policy intention, the aspects that were not fully realised and those that
were successful. It also considers how learnings from CESP have helped to
influence the design of future programmes.
1.11. Where numbers provided in the tables do not exactly match those cited in the
text, or numbers do not sum to the totals in tables, it is due to rounding.
The final report of the Community Energy Saving Programme (CESP) 2009-2012
9
2. The final CESP position
Chapter Summary
This chapter outlines the position of CESP based on scheme completion data
submitted by the energy companies for schemes to the end of 2012. It provides
information on the delivery of schemes and measures, and the overall carbon
savings achieved. It also provides a regional breakdown of delivery and a section
illustrating the effect of trades and transfers on obligations.
Overall carbon savings
Carbon savings achieved against overall target
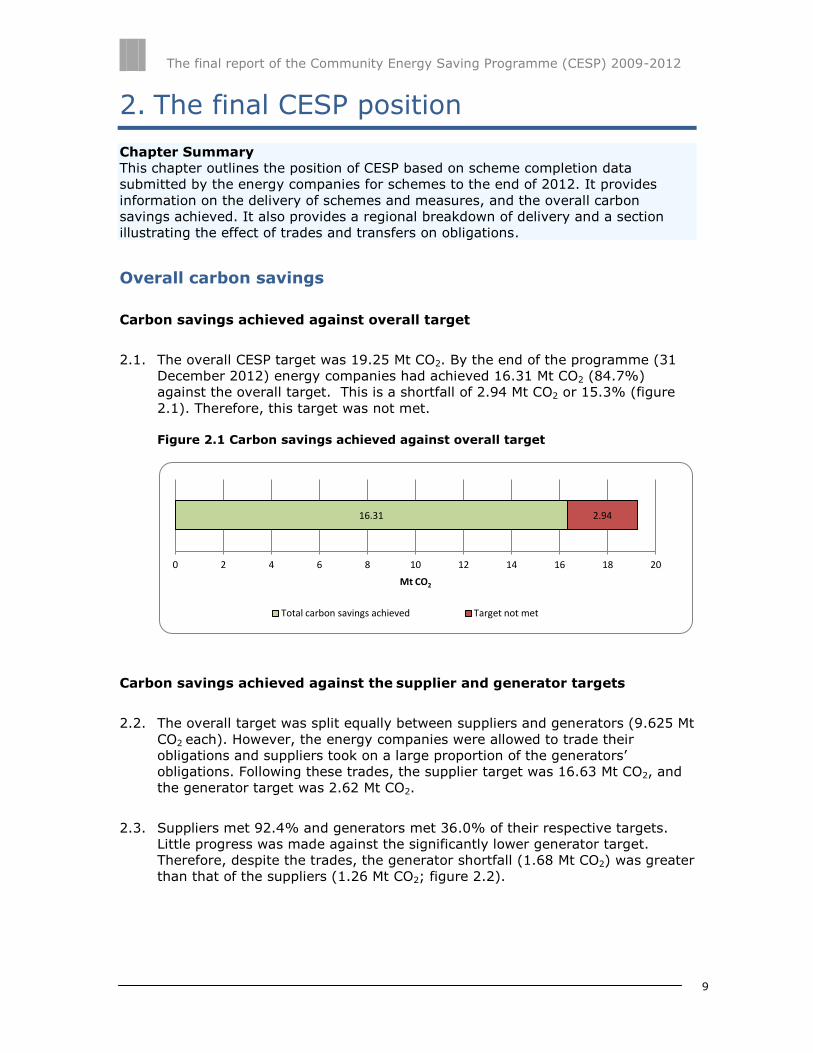
2.1. The overall CESP target was 19.25 Mt CO2. By the end of the programme (31
December 2012) energy companies had achieved 16.31 Mt CO2 (84.7%)
against the overall target. This is a shortfall of 2.94 Mt CO2 or 15.3% (figure
2.1). Therefore, this target was not met.
Figure 2.1 Carbon savings achieved against overall target
Carbon savings achieved against the supplier and generator targets
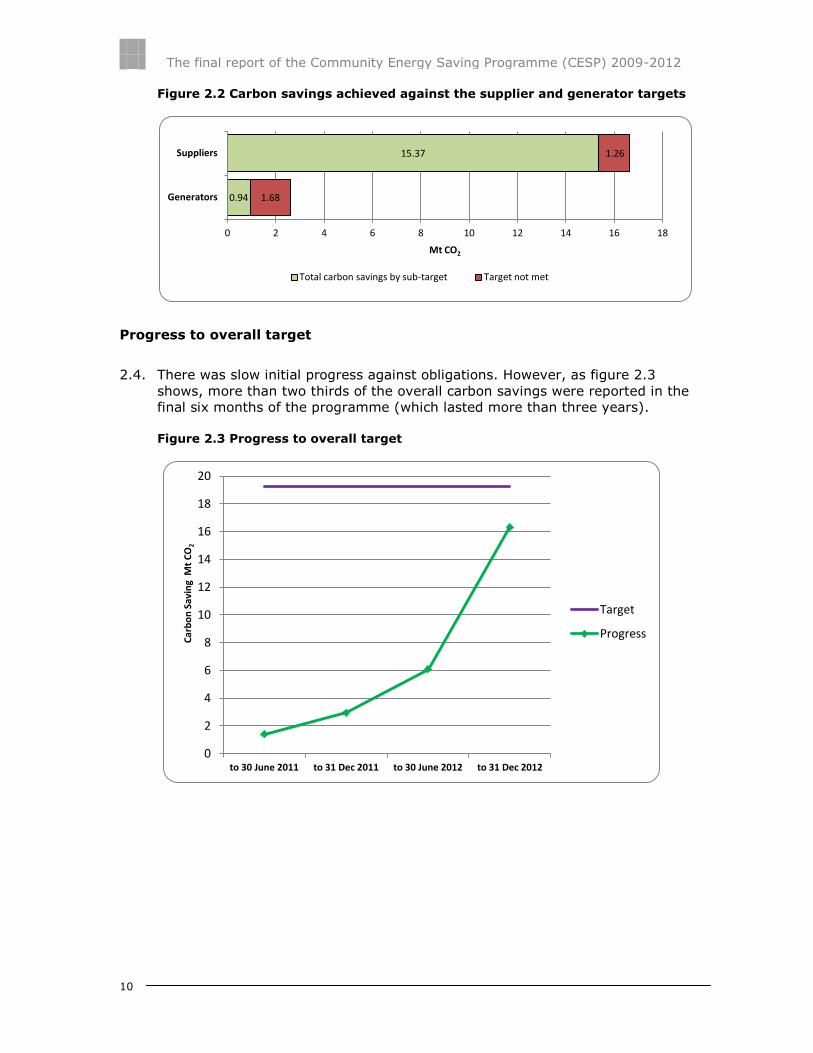
2.2. The overall target was split equally between suppliers and generators (9.625 Mt
CO2 each). However, the energy companies were allowed to trade their
obligations and suppliers took on a large proportion of the generators’
obligations. Following these trades, the supplier target was 16.63 Mt CO2, and
the generator target was 2.62 Mt CO2.
2.3. Suppliers met 92.4% and generators met 36.0% of their respective targets.
Little progress was made against the significantly lower generator target.
Therefore, despite the trades, the generator shortfall (1.68 Mt CO2) was greater
than that of the suppliers (1.26 Mt CO2; figure 2.2).
16.31 2.94
0 2 4 6 8 10 12 14 16 18 20
Mt CO2
Total carbon savings achieved Target not met
The final report of the Community Energy Saving Programme (CESP) 2009-2012
10
Figure 2.2 Carbon savings achieved against the supplier and generator targets
Progress to overall target
2.4. There was slow initial progress against obligations. However, as figure 2.3
shows, more than two thirds of the overall carbon savings were reported in the
final six months of the programme (which lasted more than three years).
Figure 2.3 Progress to overall target
0.94
15.37
1.68
1.26
0 2 4 6 8 10 12 14 16 18
Generators
Suppliers
Mt CO2
Total carbon savings by sub-target Target not met
0
2
4
6
8
10
12
14
16
18
20
to 30 June 2011 to 31 Dec 2011 to 30 June 2012 to 31 Dec 2012
Car
bo
n S
avin
g M
t C
O2
Target
Progress
The final report of the Community Energy Saving Programme (CESP) 2009-2012
11
Schemes
2.5. Energy companies delivered measures through 491 schemes. Individual
schemes were generally smaller than originally anticipated which meant energy
companies had to deliver more schemes to meet their obligations.
2.6. Almost all CESP measures were delivered through partnerships with social
housing providers (SHPs) or by direct promotion to private households (eg
privately owned homes within social housing developments). Activity carried
out in partnership with SHPs was the most popular delivery route but many
schemes covered both delivery routes, often including the private householders
that were located within predominantly social housing areas.
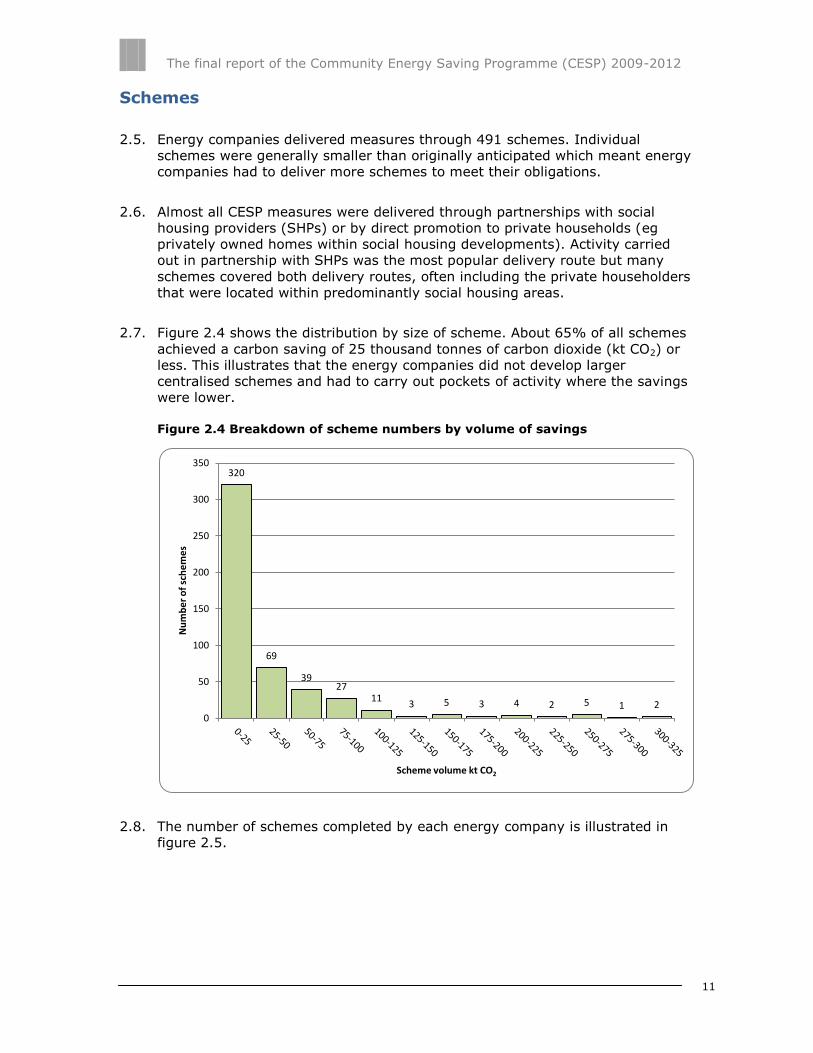
2.7. Figure 2.4 shows the distribution by size of scheme. About 65% of all schemes
achieved a carbon saving of 25 thousand tonnes of carbon dioxide (kt CO2) or
less. This illustrates that the energy companies did not develop larger
centralised schemes and had to carry out pockets of activity where the savings
were lower.
Figure 2.4 Breakdown of scheme numbers by volume of savings
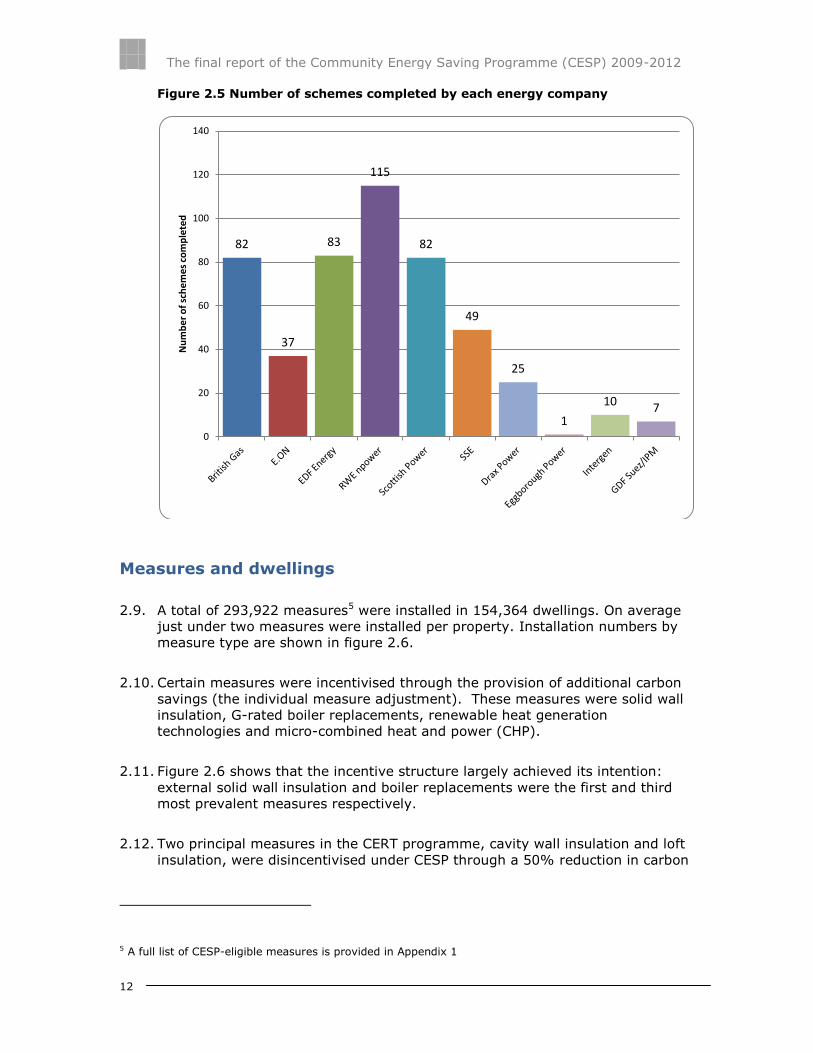
2.8. The number of schemes completed by each energy company is illustrated in
figure 2.5.
320
69
39 27
11 3 5 3 4 2 5 1 2
0
50
100
150
200
250
300
350
Nu
mb
er
of
sch
em
es
Scheme volume kt CO2
The final report of the Community Energy Saving Programme (CESP) 2009-2012
12
Figure 2.5 Number of schemes completed by each energy company
Measures and dwellings
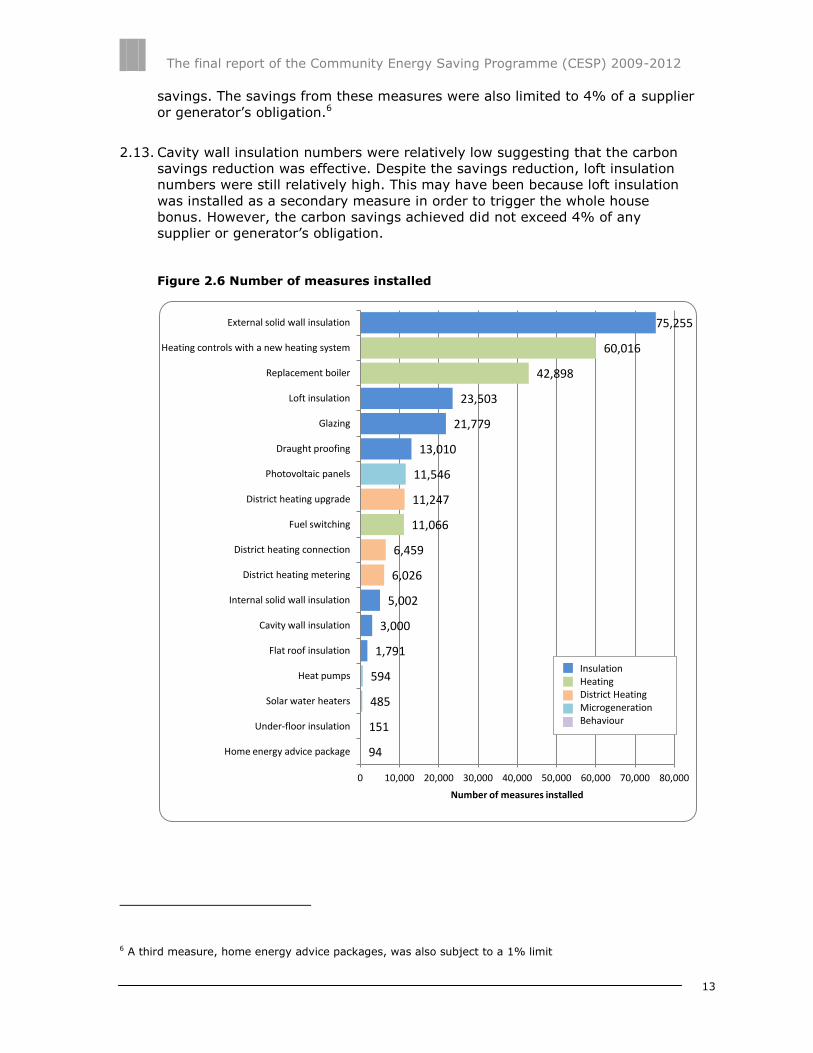
2.9. A total of 293,922 measures5 were installed in 154,364 dwellings. On average
just under two measures were installed per property. Installation numbers by
measure type are shown in figure 2.6.
2.10. Certain measures were incentivised through the provision of additional carbon
savings (the individual measure adjustment). These measures were solid wall
insulation, G-rated boiler replacements, renewable heat generation
technologies and micro-combined heat and power (CHP).
2.11. Figure 2.6 shows that the incentive structure largely achieved its intention:
external solid wall insulation and boiler replacements were the first and third
most prevalent measures respectively.
2.12. Two principal measures in the CERT programme, cavity wall insulation and loft
insulation, were disincentivised under CESP through a 50% reduction in carbon
5 A full list of CESP-eligible measures is provided in Appendix 1
82
37
83
115
82
49
25
1
10 7
0
20
40
60
80
100
120
140
Nu
mb
er
of
sch
em
es
com
ple
ted
The final report of the Community Energy Saving Programme (CESP) 2009-2012
13
savings. The savings from these measures were also limited to 4% of a supplier
or generator’s obligation.6
2.13. Cavity wall insulation numbers were relatively low suggesting that the carbon
savings reduction was effective. Despite the savings reduction, loft insulation
numbers were still relatively high. This may have been because loft insulation
was installed as a secondary measure in order to trigger the whole house
bonus. However, the carbon savings achieved did not exceed 4% of any
supplier or generator’s obligation.
Figure 2.6 Number of measures installed
6 A third measure, home energy advice packages, was also subject to a 1% limit
94
151
485
594
1,791
3,000
5,002
6,026
6,459
11,066
11,247
11,546
13,010
21,779
23,503
42,898
60,016
75,255
Home energy advice package
Under-floor insulation
Solar water heaters
Heat pumps
Flat roof insulation
Cavity wall insulation
Internal solid wall insulation
District heating metering
District heating connection
Fuel switching
District heating upgrade
Photovoltaic panels
Draught proofing
Glazing
Loft insulation
Replacement boiler
Heating controls with a new heating system
External solid wall insulation
0 10,000 20,000 30,000 40,000 50,000 60,000 70,000 80,000
Number of measures installed
Insulation Heating District Heating Microgeneration Behaviour
The final report of the Community Energy Saving Programme (CESP) 2009-2012
14
Bonus structure for multiple installations and area coverage
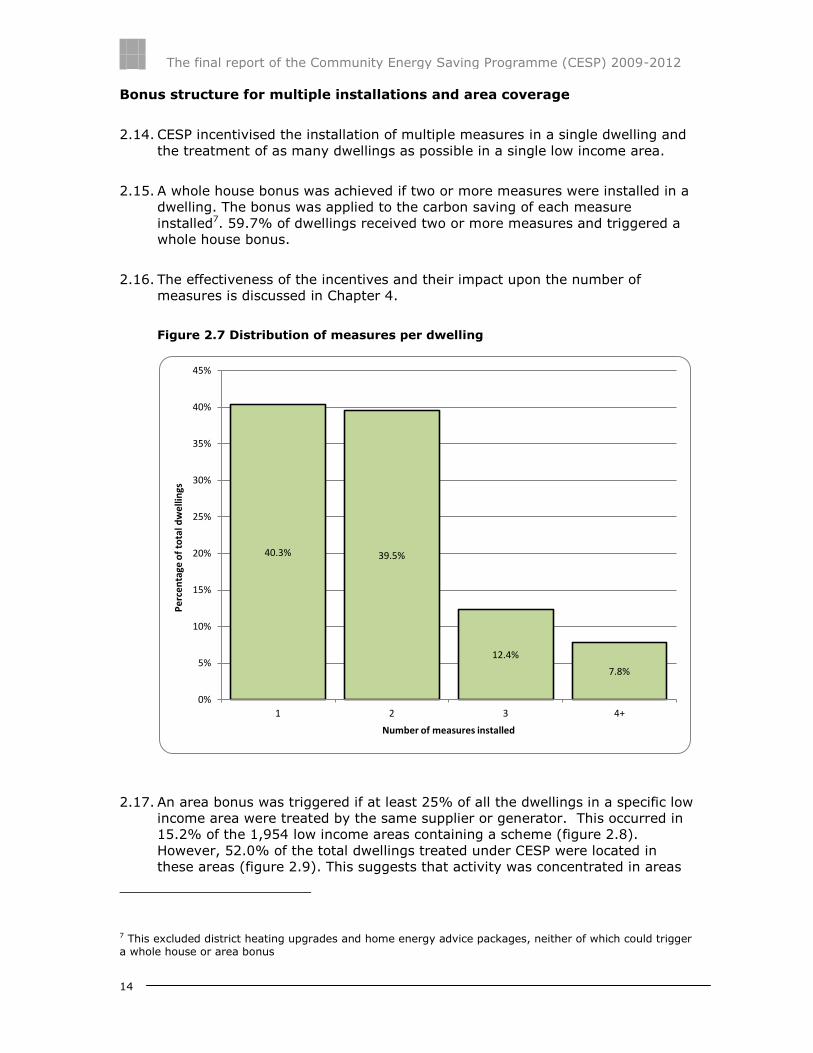
2.14. CESP incentivised the installation of multiple measures in a single dwelling and
the treatment of as many dwellings as possible in a single low income area.
2.15. A whole house bonus was achieved if two or more measures were installed in a
dwelling. The bonus was applied to the carbon saving of each measure
installed7. 59.7% of dwellings received two or more measures and triggered a
whole house bonus.
2.16. The effectiveness of the incentives and their impact upon the number of
measures is discussed in Chapter 4.
Figure 2.7 Distribution of measures per dwelling
2.17. An area bonus was triggered if at least 25% of all the dwellings in a specific low
income area were treated by the same supplier or generator. This occurred in
15.2% of the 1,954 low income areas containing a scheme (figure 2.8).
However, 52.0% of the total dwellings treated under CESP were located in
these areas (figure 2.9). This suggests that activity was concentrated in areas
7 This excluded district heating upgrades and home energy advice packages, neither of which could trigger a whole house or area bonus
40.3% 39.5%
12.4%
7.8%
0%
5%
10%
15%
20%
25%
30%
35%
40%
45%
1 2 3 4+
Pe
rce
nta
ge o
f to
tal d
we
llin
gs
Number of measures installed

The final report of the Community Energy Saving Programme (CESP) 2009-2012
15
where area bonuses could be achieved. The effectiveness of these incentives is
discussed further in Chapter 4.
2.18. In carbon saving terms, 69.2% (11.28 Mt CO2) of all savings arose from areas
with an area bonus (figure 2.10).
Figure 2.8 Percentage of low income areas with area bonus
Figure 2.9 Percentage of dwellings with area bonus
Figure 2.10 Percentage of carbon savings in areas with area bonus
Regional analysis
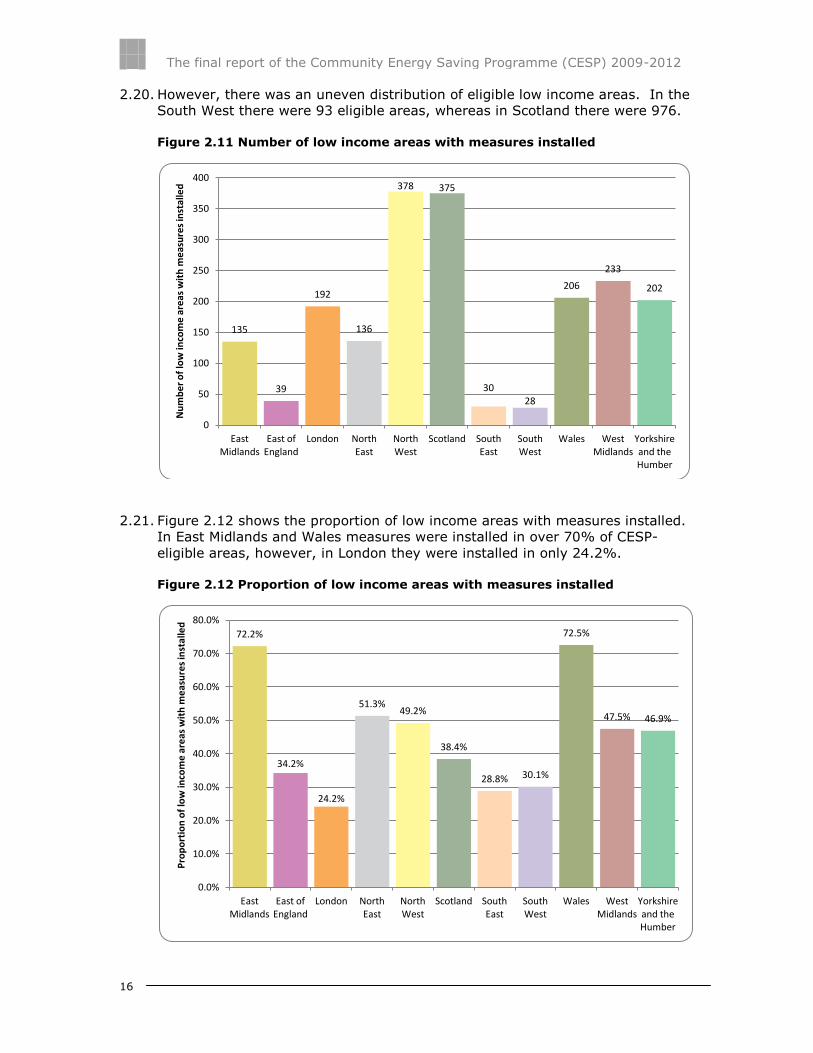
2.19. Measures were installed in 1,954 eligible low income areas, 43.4% of the total.
The number of low income areas with measures installed varied considerably
across the regions (figure 2.11). The highest number of low income areas with
measures installed was in the North West (378) and Scotland (375), whilst the
South West had the fewest (28). The distribution of the number of dwellings
treated broadly mirrors the distribution of the number of low income areas with
measures installed.
15.2% 84.8%
0% 10% 20% 30% 40% 50% 60% 70% 80% 90% 100%
Low income areas with area bonus Low income areas without area bonus
52.0% 48.0%
0% 10% 20% 30% 40% 50% 60% 70% 80% 90% 100%
Dwellings benefitting from area bonus Dwellings not benefitting from area bonus
69.2% 30.8%
0% 10% 20% 30% 40% 50% 60% 70% 80% 90% 100%
Carbon saved in areas with area bonus Carbon saved in areas without area bonus
The final report of the Community Energy Saving Programme (CESP) 2009-2012
16
2.20. However, there was an uneven distribution of eligible low income areas. In the
South West there were 93 eligible areas, whereas in Scotland there were 976.
Figure 2.11 Number of low income areas with measures installed
2.21. Figure 2.12 shows the proportion of low income areas with measures installed.
In East Midlands and Wales measures were installed in over 70% of CESP-
eligible areas, however, in London they were installed in only 24.2%.
Figure 2.12 Proportion of low income areas with measures installed
135
39
192
136
378 375
30 28
206
233
202
0
50
100
150
200
250
300
350
400
East Midlands
East of England
London North East
North West
Scotland South East
South West
Wales West Midlands
Yorkshire and the Humber
Nu
mb
er
of
low
inco
me
are
as w
ith
me
asu
res
inst
alle
d
72.2%
34.2%
24.2%
51.3% 49.2%
38.4%
28.8% 30.1%
72.5%
47.5% 46.9%
0.0%
10.0%
20.0%
30.0%
40.0%
50.0%
60.0%
70.0%
80.0%
East Midlands
East of England
London North East
North West
Scotland South East
South West
Wales West Midlands
Yorkshire and the Humber
Pro
po
rtio
n o
f lo
w in
com
e a
reas
wit
h m
eas
ure
s in
stal
led

The final report of the Community Energy Saving Programme (CESP) 2009-2012
17
Measure types
2.22. In total 293,922 measures were installed under the programme (figure 2.13).
In all regions the majority of installations were either insulation measures (8
regions) or heating measures (3 regions). Microgeneration measures were
installed in all regions but in no region did they amount to more than 10% of
the total measures installed. District heating measures featured in all but 3
regions.
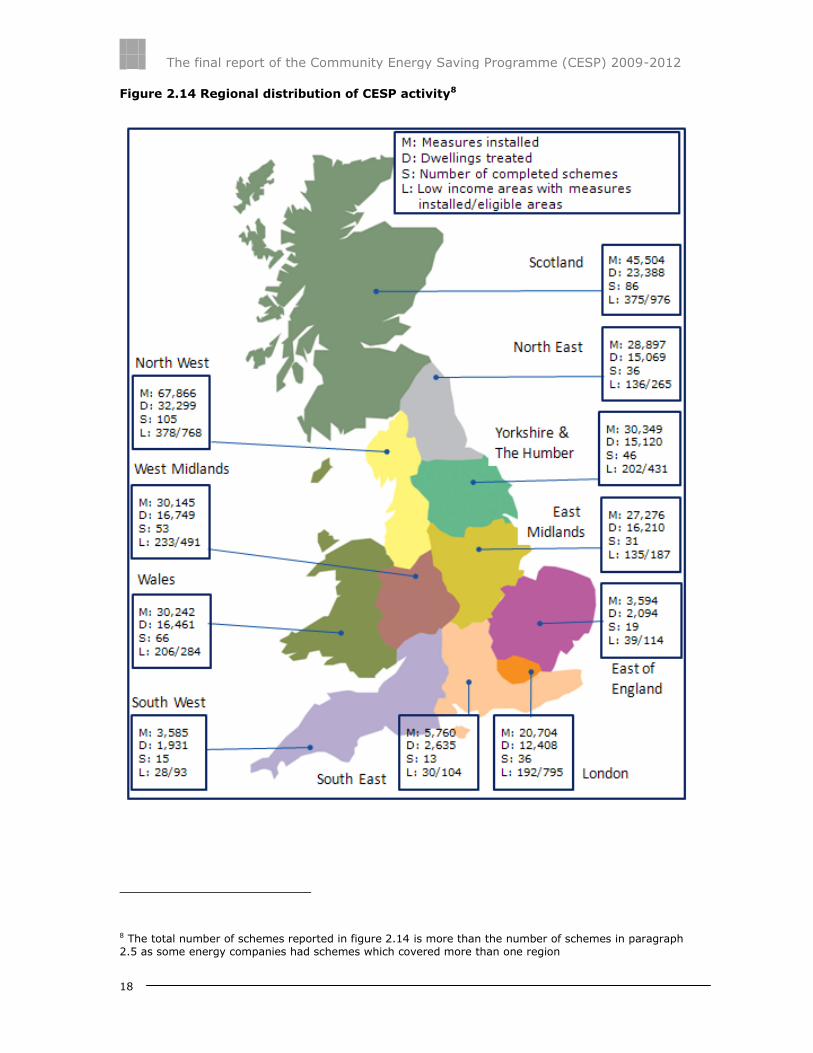
Figure 2.13 Number of measures installed in each region
2.23. The regional distribution of CESP activity in the 11 regions of Great Britain is
summarised in figure 2.14.
27,276
3,594
20,704
28,897
67,866
45,504
5,760
3,585
30,242 30,145 30,349
0
10,000
20,000
30,000
40,000
50,000
60,000
70,000
80,000
East Midlands
East of England
London North East
North West
Scotland South East
South West
Wales West Midlands
Yorkshire and the Humber
Nu
mb
er
of
me
asu
res
inst
alle
d
The final report of the Community Energy Saving Programme (CESP) 2009-2012
18
Figure 2.14 Regional distribution of CESP activity8
8 The total number of schemes reported in figure 2.14 is more than the number of schemes in paragraph 2.5 as some energy companies had schemes which covered more than one region

The final report of the Community Energy Saving Programme (CESP) 2009-2012
19
Trading and transfers
Trades
2.24. Under CESP suppliers and generators could trade up to 100% of their obligation
with any other energy company, subject to Ofgem approval. The deadline for
all applications to trade was 30 September 2012.
2.25. In total, 56 trades were approved. The majority of these trades were between
licence holders from the same group of companies and were for administrative
purposes. Three trades, totalling 2.3 Mt CO2 were inter-group trades.
2.26. All trades flowed from generator to supplier, from supplier to supplier, or from
generator to generator. There were no trades from supplier to generator.
2.27. Figure 2.15 shows the final net position of the suppliers’ and generators’
obligations after the completion of trades.
Figure 2.15 Supplier and generator obligations – effect of trading
9.625
2.618
9.625
16.632
0
2
4
6
8
10
12
14
16
18
20
Before trades After trades
Ob
ligat
ion
Mt
CO
2
Suppliers
Generators

The final report of the Community Energy Saving Programme (CESP) 2009-2012
20
Transfers
2.28. Energy companies were permitted to transfer completed measures, subject to
Ofgem’s approval. The deadline for all transfer applications was 31 December
2012.
2.29. Ofgem received a small number of requests for the transfer of measures,
reflecting that few energy companies had an excess of completed activities
they were able to pass to others. In total Ofgem approved 16 transfers, all of
which were inter-group transfers.

The final report of the Community Energy Saving Programme (CESP) 2009-2012
21
3. Final energy company achievements
Chapter Summary
This chapter outlines the carbon savings achieved by each of the energy companies.
3.1. Figure 3.1 shows energy company compliance against the total obligations of
the group. Each licence holder within an energy company must have achieved
its obligation for that energy company to be shown as compliant. In the case of
the vertically integrated energy companies the compliance status shown is
based on the status of their generation and supply licences combined.
Figure 3.1 Compliance position by energy company
Vertically Integrated Energy Companies
British Gas EDF Energy E.ON RWE npower SSE Scottish
Power
Non-
compliant Compliant Compliant Compliant
Non-
compliant
Non-
compliant
62.4% 133.0% 116.5% 106.8% 90.9% 70.0%
Independent Generators
Drax Power
Eggborough
Power
GDF
Suez/IPM Intergen
Non-
compliant Compliant
Non-
compliant
Non-
compliant
37.1% 100.5% 38.6% 6.5%
3.2. Four energy companies complied with all of their CESP obligations: EDF Energy,
E.ON, RWE npower and Eggborough Power. Six energy companies did not
comply: British Gas, SSE, Scottish Power, Drax Power, GDF Suez/IPM and
Intergen.
3.3. The final compliance position of each obligated supplier and generator is listed
in Appendix 2 of this report.
3.4. Energy companies adopted different approaches towards achieving their CESP
obligations. Figure 3.2 shows how energy companies made use of the available
bonuses in achieving carbon savings. Figure 3.3 summarises the activity that
energy companies promoted.
The final report of the Community Energy Saving Programme (CESP) 2009-2012
22
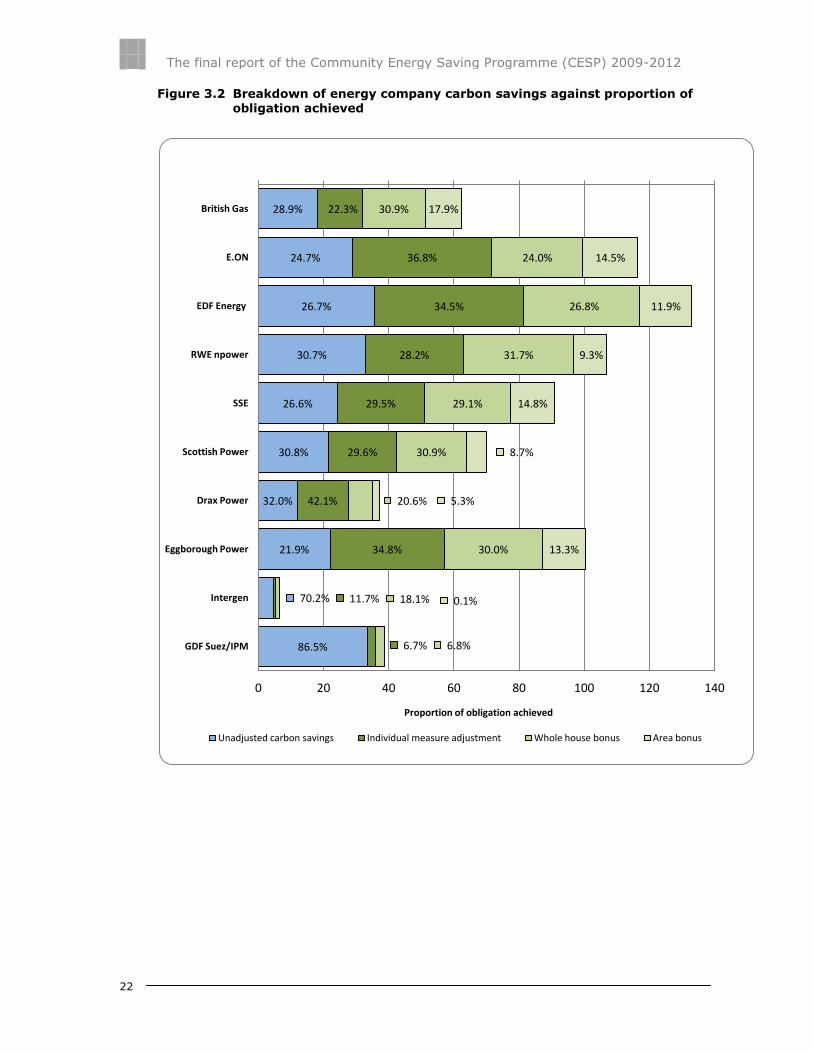
Figure 3.2 Breakdown of energy company carbon savings against proportion of obligation achieved
28.9%
24.7%
26.7%
30.7%
26.6%
30.8%
32.0%
21.9%
70.2%
86.5%
22.3%
36.8%
34.5%
28.2%
29.5%
29.6%
42.1%
34.8%
11.7%
6.7%
30.9%
24.0%
26.8%
31.7%
29.1%
30.9%
20.6%
30.0%
18.1%
6.8%
17.9%
14.5%
11.9%
9.3%
14.8%
8.7%
5.3%
13.3%
0.1%
0 20 40 60 80 100 120 140
British Gas
E.ON
EDF Energy
RWE npower
SSE
Scottish Power
Drax Power
Eggborough Power
Intergen
GDF Suez/IPM
Proportion of obligation achieved
Unadjusted carbon savings Individual measure adjustment Whole house bonus Area bonus
The final report of the Community Energy Saving Programme (CESP) 2009-2012
23
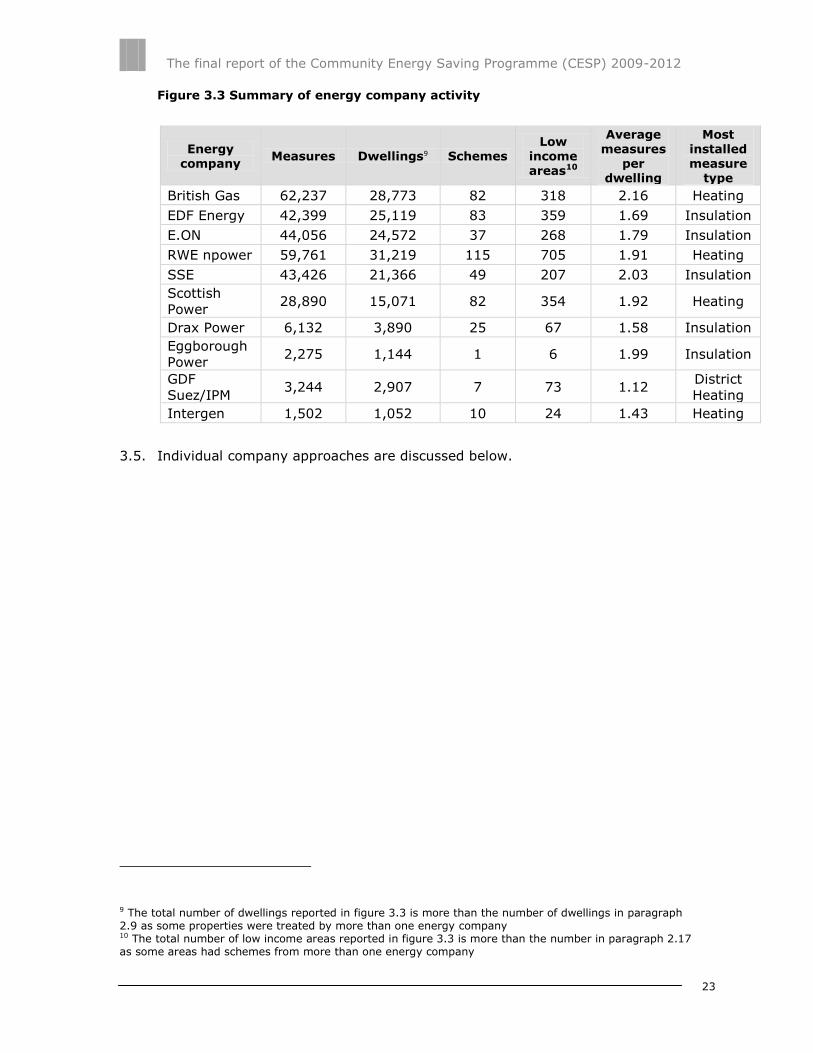
Figure 3.3 Summary of energy company activity
Energy company
Measures Dwellings9 Schemes Low
income areas10
Average measures
per dwelling
Most installed measure
type
British Gas 62,237 28,773 82 318 2.16 Heating
EDF Energy 42,399 25,119 83 359 1.69 Insulation
E.ON 44,056 24,572 37 268 1.79 Insulation
RWE npower 59,761 31,219 115 705 1.91 Heating
SSE 43,426 21,366 49 207 2.03 Insulation
Scottish
Power 28,890 15,071 82 354 1.92 Heating
Drax Power 6,132 3,890 25 67 1.58 Insulation
Eggborough
Power 2,275 1,144 1 6 1.99 Insulation
GDF
Suez/IPM 3,244 2,907 7 73 1.12
District
Heating
Intergen 1,502 1,052 10 24 1.43 Heating
3.5. Individual company approaches are discussed below.
9 The total number of dwellings reported in figure 3.3 is more than the number of dwellings in paragraph 2.9 as some properties were treated by more than one energy company 10 The total number of low income areas reported in figure 3.3 is more than the number in paragraph 2.17 as some areas had schemes from more than one energy company

The final report of the Community Energy Saving Programme (CESP) 2009-2012
24
Vertically integrated energy companies
British Gas
3.6. British Gas completed 82 schemes in 318 low income areas, delivering 62.4%
of its obligations.
3.7. By June 2012 British Gas was the leading energy company with almost half of
its obligations reached. While the other vertically integrated energy companies
achieved at least 70% of their savings in the final six months, British Gas only
achieved 24%.
3.8. British Gas installed 62,237 measures in 28,773 dwellings. This is the
equivalent of 2.16 measures per property, the highest rate of all companies,
suggesting British Gas particularly utilised the whole house bonus.
3.9. Almost 18% (57) of the 318 low income areas British Gas targeted triggered
the area bonus.
3.10. British Gas, like other vertically integrated energy companies, concentrated
mainly on insulation and heating measures. Of the measures British Gas
installed, 44% were heating measures and 42% were insulation measures. It
installed more district heating measures than any other energy company.
Figure 3.4 Number of measures installed by British Gas
27,089
26,406
1,034 7,708
Heating
Insulation
Microgeneration
District Heating

The final report of the Community Energy Saving Programme (CESP) 2009-2012
25
EDF Energy
3.11. EDF Energy completed 83 schemes in 359 low income areas, delivering 133.0%
of its obligations.
3.12. EDF Energy had delivered 37% of its obligations by June 2012, demonstrating
similar progress to the other vertically integrated energy companies. In the
final six months EDF Energy achieved additional savings equivalent to 96% of
its obligations. This reflects a pipeline of works that reached fruition at the end
of the programme.
3.13. EDF Energy installed 42,399 measures in 25,119 dwellings. This is the
equivalent of 1.69 measures per dwelling, the lowest ratio of all the vertically
integrated energy companies.
3.14. EDF Energy delivered schemes to 359 low income areas, with 49 of these areas
triggering the area bonus. The individual measure adjustment accounted for
the majority of EDF Energy’s savings.
3.15. Insulation measures comprised 54% of all measures installed and heating
measures comprised 33%. This followed the trend of heating and insulation
measures being the most popular to install amongst the vertically integrated
energy companies.
Figure 3.5 Number of measures installed by EDF Energy
14,069
22,914
2,491 2,925
Heating
Insulation
Microgeneration
District Heating
The final report of the Community Energy Saving Programme (CESP) 2009-2012
26
E.ON
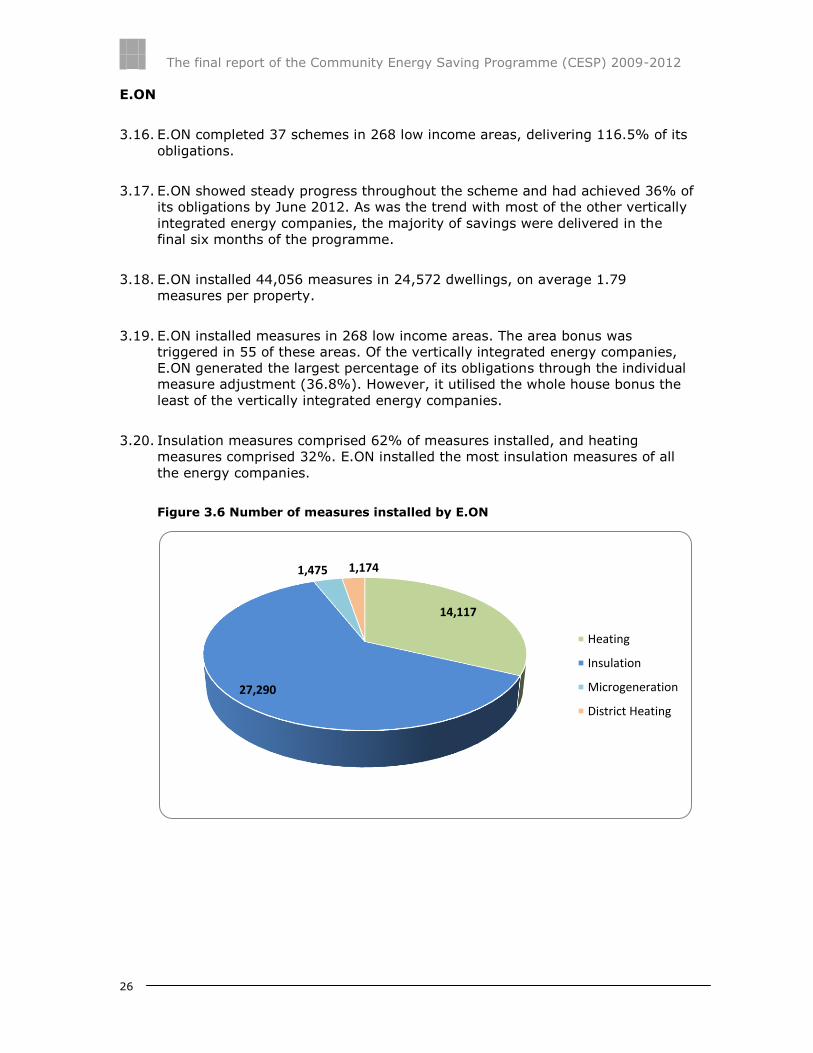
3.16. E.ON completed 37 schemes in 268 low income areas, delivering 116.5% of its
obligations.
3.17. E.ON showed steady progress throughout the scheme and had achieved 36% of
its obligations by June 2012. As was the trend with most of the other vertically
integrated energy companies, the majority of savings were delivered in the
final six months of the programme.
3.18. E.ON installed 44,056 measures in 24,572 dwellings, on average 1.79
measures per property.
3.19. E.ON installed measures in 268 low income areas. The area bonus was
triggered in 55 of these areas. Of the vertically integrated energy companies,
E.ON generated the largest percentage of its obligations through the individual
measure adjustment (36.8%). However, it utilised the whole house bonus the
least of the vertically integrated energy companies.
3.20. Insulation measures comprised 62% of measures installed, and heating
measures comprised 32%. E.ON installed the most insulation measures of all
the energy companies.
Figure 3.6 Number of measures installed by E.ON
14,117
27,290
1,475 1,174
Heating
Insulation
Microgeneration
District Heating

The final report of the Community Energy Saving Programme (CESP) 2009-2012
27
RWE npower
3.21. RWE npower completed 115 schemes in 705 low income areas, nearly twice as
many as any other energy company, and delivered 106.8% of its obligations.
3.22. Of the six vertically integrated energy companies, RWE npower accelerated the
most in the final six months of the programme. With six months remaining,
RWE npower had achieved 15% of its obligations, and by 31 December 2012 it
had delivered 106.8%. This large acceleration in activity, and the significant
number of low income areas targeted, suggests RWE npower took on a large
number of small schemes that could deliver savings in a short timeframe to
achieve its obligations.
3.23. RWE npower installed 59,761 measures in 31,219 dwellings. This is an average
of 1.91 measures per dwelling and is in line with the average across all
companies.
3.24. RWE npower delivered schemes in 705 low income areas. This was the largest
number of areas treated by any energy company and was almost twice as
many as the next highest number treated by an individual energy company. As
a result of spreading their activity across so many low income areas the area
bonus was only triggered in 7% of these areas, although the absolute number
was equivalent to other energy companies.
3.25. Heating measures comprised 45% and insulation measures comprised 41% of
the total measures installed. RWE npower installed the highest number of
microgeneration measures of all the energy companies.
Figure 3.7 Number of measures installed by RWE npower
27,130
24,513
4,471 3,647
Heating
Insulation
Microgeneration
District Heating

The final report of the Community Energy Saving Programme (CESP) 2009-2012
28
SSE
3.26. SSE completed 49 schemes in 207 low income areas, delivering 90.9% of its
obligations.
3.27. SSE’s progress was similar to the majority of energy companies. Having
reached 29% of its obligations by June 2012, a further 62% was delivered in
the final six months of the programme.
3.28. SSE installed 43,426 measures in 21,366 dwellings. This is an average of 2.03
measures per dwelling. SSE and British Gas were the only companies to deliver
an average of more than two measures per dwelling.
3.29. SSE delivered schemes to 207 low income areas, with 56 areas triggering the
area bonus.
3.30. Insulation measures comprised 56% of the total installed measures and
heating measures comprised 33%.
Figure 3.8 Number of measures installed by SSE
14,489
24,489
425
4,023
Heating
Insulation
Microgeneration
District Heating

The final report of the Community Energy Saving Programme (CESP) 2009-2012
29
Scottish Power
3.31. Scottish Power completed 82 schemes in 354 low income areas, delivering
70.0% of its obligations.
3.32. Scottish Power achieved 21% of its obligations by June 2012, with a further
49% delivered in the final six months.
3.33. Scottish Power installed 28,890 measures in 15,071 dwellings. This is an
average of 1.92 measures per property and is broadly in line with the average
across energy companies.
3.34. Scottish Power delivered schemes to 354 low income areas. It triggered the
area bonus in 26 of these areas, the lowest number of all vertically integrated
energy companies.
3.35. Insulation measures comprised 44% of the total measures installed, and
heating measures comprised 45%. Scottish Power was the only energy
company to claim behavioural measures, delivering home energy advice
packages to domestic energy users in 94 dwellings.
Figure 3.9 Number of measures installed by Scottish Power
13,013
12,790
1,768 1,225
94
Heating
Insulation
Microgeneration
District Heating
Behaviour
The final report of the Community Energy Saving Programme (CESP) 2009-2012
30
Independent generators
Drax Power
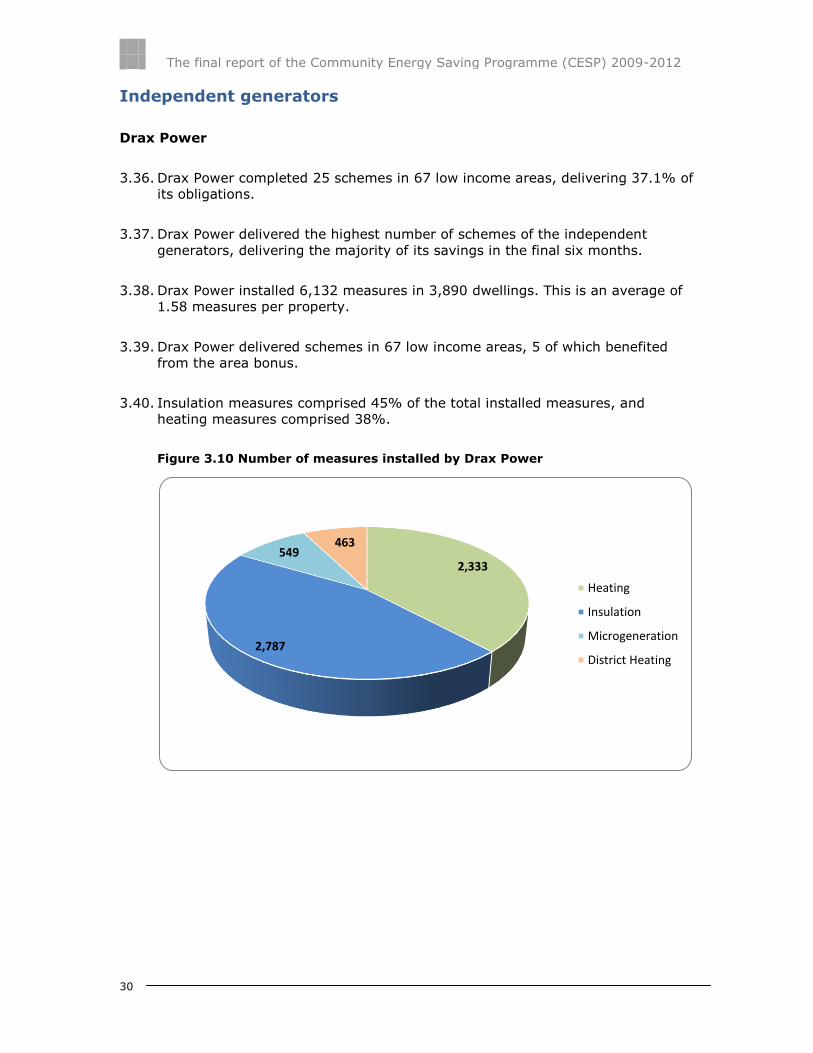
3.36. Drax Power completed 25 schemes in 67 low income areas, delivering 37.1% of
its obligations.
3.37. Drax Power delivered the highest number of schemes of the independent
generators, delivering the majority of its savings in the final six months.
3.38. Drax Power installed 6,132 measures in 3,890 dwellings. This is an average of
1.58 measures per property.
3.39. Drax Power delivered schemes in 67 low income areas, 5 of which benefited
from the area bonus.
3.40. Insulation measures comprised 45% of the total installed measures, and
heating measures comprised 38%.
Figure 3.10 Number of measures installed by Drax Power
2,333
2,787
549 463
Heating
Insulation
Microgeneration
District Heating
The final report of the Community Energy Saving Programme (CESP) 2009-2012
31
Eggborough Power
3.41. Eggborough Power completed just 1 scheme in 6 low income areas, delivering
100.5% of its obligation. Eggborough had not delivered any of its obligation by
December 2011. It was the only independent generator to comply with its
obligation.
3.42. Eggborough Power delivered all of its obligation in the period after 31
December 2011, with the majority delivered in the final six months.
3.43. Eggborough Power installed 2,275 measures in 1,144 dwellings. This is an
average of 1.99 measures per property.
3.44. Eggborough Power delivered schemes to 6 low income areas, with half of these
triggering the area bonus.
3.45. Insulation measures comprised 79% of the total measures installed, and
heating measures comprised the remainder.
Figure 3.11 Number of measures installed by Eggborough Power
488
1,787
Heating
Insulation

The final report of the Community Energy Saving Programme (CESP) 2009-2012
32
GDF Suez/IPM
3.46. GDF Suez/IPM completed 7 schemes in 73 low income areas, delivering 38.6%
of its obligations. The area bonus was not triggered in any of the low income
areas treated.
3.47. GDF Suez/IPM had achieved 5% of its obligations by June 2012 and delivered
the majority of its savings in the final six months.
3.48. GDF Suez/IPM installed 3,244 measures in 2,907 dwellings. This is an average
of 1.12 measures per dwelling. This was the lowest average number of
installations per dwelling by any energy company.
3.49. Unlike all other energy companies, GDF Suez/IPM did not concentrate on
heating or insulation measures. It focussed mainly on district heating, which
comprised 79% of the total measures installed.
Figure 3.12 Number of measures installed by GDF Suez/IPM
392
272 13
2,567
Heating
Insulation
Microgeneration
District Heating
The final report of the Community Energy Saving Programme (CESP) 2009-2012
33
Intergen
3.50. Intergen completed 10 schemes in 24 low income areas, delivering 6.5% of its
obligations.
3.51. Intergen installed 1,502 measures in 1,052 dwellings. This is an average of
1.43 measures per property.
3.52. Intergen delivered schemes in 24 low income areas. Only one area triggered
the area bonus.
3.53. Heating measures comprised 57% of the measures installed and
microgeneration measures comprised 27%.
Figure 3.13 Number of measures installed by Intergen
860
243
399
Heating
Insulation
Microgeneration
The final report of the Community Energy Saving Programme (CESP) 2009-2012
34
4. Carbon savings analysis
Chapter Summary
This chapter provides an analysis of unadjusted carbon savings, and how these
savings have been increased through bonuses and uplifts. It also considers the
effectiveness of the incentive structure in influencing energy companies to install
particular measures and to achieve multiple installations in properties.
4.1. CESP was designed to encourage the installation of a package of energy saving
measures to households in low income areas. It also aimed to promote more
difficult-to-install and innovative measures than those promoted under the
Carbon Emissions Reduction Target programme (CERT).
4.2. To achieve this, incentives were provided for certain activities:
carbon savings adjustments were applied to certain measures, such as solid
wall insulation;
a whole house bonus was awarded to each measure when two or more
measures were installed in a single property; and
an area bonus was awarded when 25% or more of the dwellings in a specific
low income area were treated by the same supplier or generator.
4.3. In order to consider the effectiveness of the measure adjustments and whole
house bonuses, it is necessary to analyse carbon savings pre-adjustment.
Unadjusted savings
4.4. Energy companies achieved 4.62 Mt CO2 in unadjusted savings. This represents
28.3% of total adjusted savings (figure 4.1). This indicates that the incentives
outlined above had a significant impact on energy company approaches.
Figure 4.1 Carbon savings before and after adjustments
4.5. Figure 4.2 shows the unadjusted savings by measure category. Insulation
measures accounted for 56.9% (2,631 kt CO2) of all unadjusted carbon
4.62 11.69
0.00 2.00 4.00 6.00 8.00 10.00 12.00 14.00 16.00 18.00
Carbon Savings Mt CO2
Unadjusted carbon savings Bonuses
The final report of the Community Energy Saving Programme (CESP) 2009-2012
35
savings, with heating measures and district heating contributing 21.0% (970 kt
CO2) and 15.7% (725 kt CO2) respectively. Figure 4.3 shows unadjusted
savings by individual measure type.
Figure 4.2 Unadjusted carbon savings (kt CO2) by measure category
<1
725
970
2,631
296 Behaviour
District Heating
Heating
Insulation
Microgeneration
The final report of the Community Energy Saving Programme (CESP) 2009-2012
36
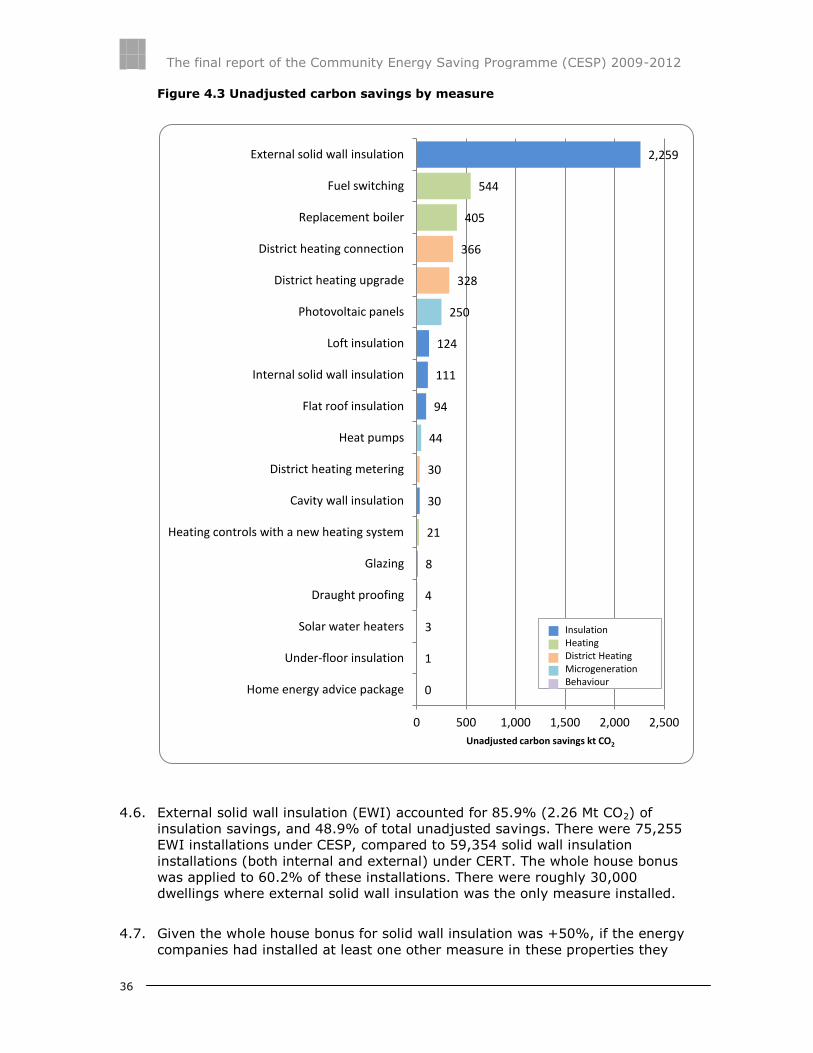
Figure 4.3 Unadjusted carbon savings by measure
4.6. External solid wall insulation (EWI) accounted for 85.9% (2.26 Mt CO2) of
insulation savings, and 48.9% of total unadjusted savings. There were 75,255
EWI installations under CESP, compared to 59,354 solid wall insulation
installations (both internal and external) under CERT. The whole house bonus
was applied to 60.2% of these installations. There were roughly 30,000
dwellings where external solid wall insulation was the only measure installed.
4.7. Given the whole house bonus for solid wall insulation was +50%, if the energy
companies had installed at least one other measure in these properties they
0
1
3
4
8
21
30
30
44
94
111
124
250
328
366
405
544
2,259
0 500 1,000 1,500 2,000 2,500
Home energy advice package
Under-floor insulation
Solar water heaters
Draught proofing
Glazing
Heating controls with a new heating system
Cavity wall insulation
District heating metering
Heat pumps
Flat roof insulation
Internal solid wall insulation
Loft insulation
Photovoltaic panels
District heating upgrade
District heating connection
Replacement boiler
Fuel switching
External solid wall insulation
Unadjusted carbon savings kt CO2
Insulation Heating District Heating Microgeneration Behaviour
The final report of the Community Energy Saving Programme (CESP) 2009-2012
37
would have made significant additions to their overall savings and, in some
cases, significant inroads into their non-compliant position.
4.8. Fuel switching accounted for 56.1% (0.54 Mt CO2) of all heating savings, and
11.8% of total unadjusted savings. Replacement boilers accounted for 41.7%
(0.40 Mt CO2) of heating savings, and 8.8% of total unadjusted savings.
4.9. Connections to a district heating system provided 50.5% (0.37 Mt CO2) of
district heating savings. There were 6,459 district heating connections under
CESP, compared to 1,349 under CERT. The whole house bonus was applied to
5,996 (92.8%) of these installations.
4.10. Photovoltaic panels accounted for 84.1% (0.25 Mt CO2) of microgeneration
savings.
4.11. The impact of measure adjustments and the whole house bonus on unadjusted
savings is analysed below. The analysis shows which incentives were most
effective in driving energy company behaviour.
Individual measure adjustment
4.12. The individual measure adjustment was applied to four measure types: solid
wall insulation, G-rated boiler replacements, renewable heat generation
technologies and micro CHP. Two principal measures in the CERT programme,
cavity wall insulation and loft insulation, were disincentivised in CESP through a
negative adjustment.
4.13. For solid wall insulation the adjustment was set at +200%. This adjustment
was clearly effective in promoting the installation of external solid wall
insulation. There were significantly fewer installations of internal solid wall
insulation. This may have been due to the disruption to the householder
associated with these installations.
4.14. The individual measure adjustment was also effective in promoting the
replacement of G-rated boilers (+50%). This measure was generally coupled
with the installation of heating controls, as together these two measures would
have triggered the whole house bonus.
4.15. Conversely, the +50% adjustment for renewable heat technologies and micro
CHP was not effective in promoting these measures. This may be a reflection of
the lack of penetration of these technologies in general.
4.16. Cavity wall insulation received a negative measure adjustment of -50%.
Installation numbers were low, suggesting the adjustment was effective.
4.17. Loft insulation was installed in large numbers despite having a negative
measure adjustment (-50%) applied. This may have been as a result of the
whole house bonus, discussed below. Loft insulation could be installed in
conjunction with solid wall insulation, unlike (in most cases) cavity wall
insulation.

The final report of the Community Energy Saving Programme (CESP) 2009-2012
38
4.18. The carbon savings for loft insulation are relatively low compared with solid
wall insulation and hence, despite the number of loft insulation jobs being
about a third of the number of external solid wall insulation jobs, the
unadjusted carbon savings achieved is about a twentieth.
Whole house bonus
4.19. The whole house bonus was triggered in 59.7% of the dwellings treated.
However, in only 20.2% of dwellings were three or more measures installed.
4.20. The whole house bonus triggered by one measure was applied to all other
measures installed in the same property. Given the way the incentive
accelerated it is surprising so many dwellings received only two measures.
4.21. Four of the six most installed measures (heating controls, draught proofing,
double glazing and loft insulation) achieved relatively low savings when
installed on their own. Their ability to trigger the whole house bonus (+10% for
each measure) may have been the motivation for their installation.
4.22. The whole house bonuses applicable to solid wall insulation (+50%) and
replacement of G-rated boilers (+40%) will have reinforced the incentive
provided by the individual measure adjustment for these measures.
4.23. Fuel switching and district heating connections were promoted in relatively high
numbers, suggesting the whole house bonus of +40% was effective.
Conversely, a similar bonus for biomass boilers was not sufficient to incentivise
a significant number of installations.
Effectiveness of incentives
4.24. That 71.7% of the overall savings were achieved through bonuses clearly
demonstrates the effectiveness in driving energy company approaches.
However, as shown above, these incentives were not equally attractive across
measure types. Moreover, the whole house bonus could have been utilised to a
greater extent, by application to more dwellings, and through the installation of
more measures per dwelling.
4.25. Furthermore, as seen in Chapter 2, although nearly two thirds of all carbon
savings arose from low income areas where an area bonus was triggered, in
fact only 15% of the 1,954 areas targeted under CESP attracted the area
bonus. Further concentration of activities in specific areas would have allowed
the companies to take further advantage of this bonus.

The final report of the Community Energy Saving Programme (CESP) 2009-2012
39
5. Monitoring progress
Chapter Summary
This chapter describes the mechanisms put in place to ensure installed measures met
appropriate technical standards, and that completed measures had been reported to
Ofgem correctly.
Technical monitoring
5.1. Technical monitoring was a key control in CESP to ensure measures installed
met the relevant quality standards and carbon savings claimed by energy
companies could be fully achieved.
5.2. Energy companies were required to undertake monitoring on at least 5% of
each measure installed using a suitably qualified monitoring agent. Only
professionally installed insulation and heating measures required technical
monitoring. The monitoring sample was selected in a random manner.
5.3. To maintain consistency, properties were inspected using standard technical
monitoring questions developed by Ofgem to ensure compliance with CESP
legislation and guidance. These questions were also used in the Carbon
Emissions Reduction Target (CERT) scheme. The questions covered a range of
topics for each measure type and failures could relate to customer satisfaction,
health and safety, legal or building regulations, as well as carbon savings
achieved.
5.4. Energy companies were required to report a summary of their technical
monitoring results at scheme closure. These results have been aggregated per
measure type and can be found in figure 5.111.
11 Technical monitoring of microgeneration measures was achieved through the Microgeneration Certification Scheme (MCS). The technical monitoring questions for district heating, included in the CESP Guidance, were answered through the feasibility studies and field trials completed by the energy companies
The final report of the Community Energy Saving Programme (CESP) 2009-2012
40
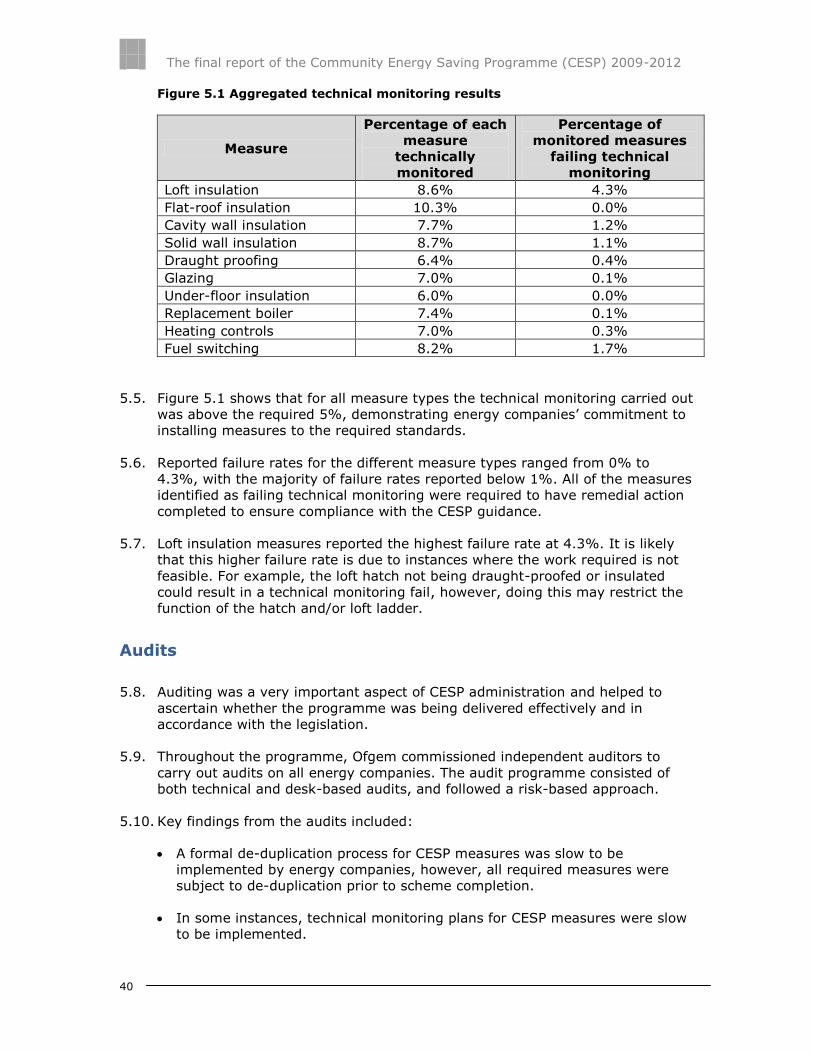
Figure 5.1 Aggregated technical monitoring results
Measure
Percentage of each
measure
technically
monitored
Percentage of
monitored measures
failing technical
monitoring
Loft insulation 8.6% 4.3%
Flat-roof insulation 10.3% 0.0%
Cavity wall insulation 7.7% 1.2%
Solid wall insulation 8.7% 1.1%
Draught proofing 6.4% 0.4%
Glazing 7.0% 0.1%
Under-floor insulation 6.0% 0.0%
Replacement boiler 7.4% 0.1%
Heating controls 7.0% 0.3%
Fuel switching 8.2% 1.7%
5.5. Figure 5.1 shows that for all measure types the technical monitoring carried out
was above the required 5%, demonstrating energy companies’ commitment to
installing measures to the required standards.
5.6. Reported failure rates for the different measure types ranged from 0% to
4.3%, with the majority of failure rates reported below 1%. All of the measures
identified as failing technical monitoring were required to have remedial action
completed to ensure compliance with the CESP guidance.
5.7. Loft insulation measures reported the highest failure rate at 4.3%. It is likely
that this higher failure rate is due to instances where the work required is not
feasible. For example, the loft hatch not being draught-proofed or insulated
could result in a technical monitoring fail, however, doing this may restrict the
function of the hatch and/or loft ladder.
Audits
5.8. Auditing was a very important aspect of CESP administration and helped to
ascertain whether the programme was being delivered effectively and in
accordance with the legislation.
5.9. Throughout the programme, Ofgem commissioned independent auditors to
carry out audits on all energy companies. The audit programme consisted of
both technical and desk-based audits, and followed a risk-based approach.
5.10. Key findings from the audits included:
A formal de-duplication process for CESP measures was slow to be
implemented by energy companies, however, all required measures were
subject to de-duplication prior to scheme completion.
In some instances, technical monitoring plans for CESP measures were slow
to be implemented.
The final report of the Community Energy Saving Programme (CESP) 2009-2012
41
Recommendations were made to some energy companies, based on the
findings from the audits, to improve or formalise the management of their
third party contractors.
Energy companies had a mixture of automatic and manual processes for
managing their CESP obligations.
In addition, a number of improvements were recommended to energy
companies’ internal processes for managing CESP.
5.11. Ofgem shared the audit findings with energy companies to ensure that
recommendations raised by auditors were implemented effectively.
5.12. The results of the audit programme provided assurance that:
Measures being delivered were as claimed and to sufficient standard;
Energy companies had adequate processes in place for reporting to Ofgem;
Energy companies had adequate processes in place for managing third party
contractors;
Energy companies had adequate processes in place for de-duplication of
measures between CESP and other energy efficiency schemes.
The final report of the Community Energy Saving Programme (CESP) 2009-2012
42
6. Conclusions
Chapter Summary
This chapter considers the final position achieved by the energy companies, and
discusses the approaches employed and the challenges encountered in trying to
achieve the legislative obligations and targets. It examines the CESP policy intention,
the aspects that were not fully realised and those that were successful. It also
considers how learnings from CESP have helped to influence the design of future
programmes.
6.1. Of the overall CESP target, 84.7% was achieved. Of the ten energy companies
obligated under CESP, only four met all of their obligations.
6.2. As shown in Chapter 3, all energy companies, with the exception of British Gas,
made slow initial progress against their obligations. The main activity took
place in 2012, particularly in the final six months of the programme. Despite
strong efforts, this late surge in activity was not sufficient for the majority of
energy companies to meet their obligations. Some non-compliant energy
companies have taken steps to mitigate their shortfall after the end of the
obligation period.
Energy company approaches
6.3. Each of the four companies who met all of their obligations (E.ON, EDF Energy,
RWE npower and Eggborough Power) made slow starts. Of particular note are
RWE npower and EDF Energy. RWE npower had achieved only 15% of its
obligations with six months remaining yet managed to deliver 106.8% of its
obligations by 31 December 2012, while EDF Energy achieved savings
equivalent to 96% of its obligations in the final six months.
6.4. Eggborough delivered the majority of work in the latter stages of the
programme. Eggborough experienced a delayed start in activity, having been
divested by EDF Energy. Despite this, it delivered just over 100% of its
obligation, achieved through one individual scheme. This scheme was focussed
on insulation measures, heavily utilising the individual measure adjustment and
whole house bonus.
6.5. It is difficult to draw strong conclusions on what was a ‘successful’ approach for
achieving obligations. As shown in Chapter 3, there was considerable variation
across both compliant and non-compliant energy companies in the ratio of
measures, dwellings, schemes and low income areas treated. For instance,
E.ON and EDF Energy both met their obligations and treated a similar number
of dwellings during the programme but EDF Energy delivered well over twice as
many schemes.
6.6. The key correlation across the energy companies who met their obligations
relates to bonuses. As illustrated in figure 3.2, three of these four energy
companies (E.ON, EDF Energy, and Eggborough Power) delivered a lower
proportion of their obligations through unadjusted savings. They tended to
utilise the individual measure adjustment to a greater extent than the other six

The final report of the Community Energy Saving Programme (CESP) 2009-2012
43
companies. The significant increase to savings that this adjustment could offer
for certain measures, and the fact that it was the initial savings multiplier
before the whole house and area bonuses were applied, may have caused this
approach to be particularly successful.
6.7. As discussed above, Eggborough Power achieved its obligation through the
delivery of one scheme. It was the only generator to meet its obligations. Given
that CESP was the first programme under which generators were obligated,
most used the strategy of trading their obligations to vertically integrated
energy companies and employing third parties to deliver their activity.
Effectiveness of scheme design and delivery of policy intent
6.8. The bonus structure of CESP was designed to incentivise the installation of
certain measures using a house by house, street by street approach. The
bonuses can clearly be seen to have driven the activity and approaches of the
energy companies, with 71.7% of all savings achieved coming from such
bonuses.
6.9. CESP was particularly effective in incentivising the treatment of properties of
solid wall and non-traditional construction (which can be of poor quality and
energy performance). External solid wall insulation was installed in large
volumes (75,255 measures). The individual measure adjustment of +200%
may have been the driver for this. The substantial costs involved in improving
such homes and the (often property-specific) technical complexities involved in
their treatment meant that such properties, although constituting a relatively
large proportion of the housing stock of Great Britain, were often not targeted
under previous energy efficiency programmes. CESP, through its bonus
structure, was effective in addressing this issue.
6.10. The structure of CESP also provided effective incentives for the installation of
district heating measures. The number of measures, and (unadjusted) carbon
savings achieved by those measures, far exceeded those in other government
energy efficiency programmes. Therefore, CESP drove an expansion in district
heating uptake that would not have been achieved otherwise.
6.11. However, not all bonuses were utilised to the extent that was hoped and
ultimately this may have been a factor in the failure of some energy companies
to meet their obligations.
6.12. The whole house bonus was effective in that 59.7% of dwellings received more
than one measure. However, it is notable that almost 30,000 external solid wall
installations were not accompanied by a second measure. Furthermore, the
increase in savings available from installing more than two measures was not
as effective, with only 20.2% of dwellings receiving three or more measures.
The average number of measures installed per dwelling was just under two,
and there was little variation from this average by any energy company.
6.13. The area bonus, intended to promote high penetration in areas of low income,
does not appear to have delivered the desired patterns of activity. The bonus
was only triggered in 15.2% of eligible low income areas, much lower than
intended. However, this did encompass 52.0% of all dwellings treated and
The final report of the Community Energy Saving Programme (CESP) 2009-2012
44
69.2% of all carbon savings were achieved in areas where the area bonus was
triggered.
6.14. A number of factors may have inhibited the utilisation of this bonus. For
example, the boundaries of low income areas were often not in line with those
of communities and estates. An estate treated under a CESP scheme could
straddle multiple areas of low income. Therefore, a supplier or generator could
treat a large number of dwellings in a particular locality yet fail to trigger the
area bonus in any overlapping low income area. In addition, the number of
social housing providers (SHPs) operating in an individual low income area may
have been a deterrent for the treatment of the number of dwellings necessary
to trigger the area bonus, due to complexities in setting up multiple contracts
and commercial arrangements.
Challenges
6.15. There were several challenges, both administrative and technical, that initially
affected the progress of the energy companies.
6.16. The scoring of activity under CESP made it difficult for energy companies to
accurately gauge the level of activity required to meet their obligations. Any
change to a scheme could have an impact on eventual scheme carbon savings.
For example, the discovery that a property had a different construction type
than expected could impact on savings, especially if it was reclassified from
solid wall insulation (with a +200% measure adjustment) to cavity wall
insulation (with a -50% measure reduction).
6.17. By the end of the programme almost 500 schemes were completed. These
schemes varied significantly in scale but each required similar administrative
effort. Whilst, on occasion, the energy companies were able to utilise
economies of scale associated with larger schemes, the general picture was
that schemes were smaller than anticipated.
6.18. Given that CESP was designed to promote the installation of specific measures
in hard-to-treat properties, it was inevitable that some technical difficulties
would arise. However, the number and complexity of technical issues
encountered was unanticipated. These issues included:
Clarifying how the suitability of solid wall insulation systems could be
demonstrated;
Formulating the criteria required to be met for energy companies to claim
solid wall insulation as a means of insulating hard-to-treat cavities;
Establishing what starting U-values to use for the wide variety of
construction types in the score calculations;
Determining how to calculate the savings for partial or ‘non-standard’
measure installations, where the unadjusted score was recalculated based
on the proportion of the depth or area treated;
The final report of the Community Energy Saving Programme (CESP) 2009-2012
45
Calculating bespoke scores and assessing technical specifications for district
heating connections and upgrades.
6.19. Ofgem, DECC and the energy companies worked closely together to tackle the
technical issues encountered and to try to reach robust and agreeable
solutions. In order to facilitate this, a Technical Working Group was set up by
Ofgem in 2011. This group resolved many of the technical issues encountered
under CESP, and the Ofgem Centre of Technical Excellence (established in mid-
2012) continued to build on this work throughout the remainder of the
programme. This partly reflects why energy companies were able to accelerate
progress in the final six months.
6.20. During the final year, Ofgem undertook a number of activities designed to aid
and encourage delivery by energy companies. These included:
Requiring energy companies to report progress on a monthly basis from
January 2012 onwards, including forecasts of final position;
Holding monthly meetings with energy companies to resolve issues and
highlight problems promptly;
Issuing open letters from September 2012 indicating our approach to
enforcement for energy companies who do not meet their obligations.
CESP achievements
6.21. Although energy companies did not meet the overall CESP target, the shortfall
of 15.3% was less than may have been predicted in June 2012, when only
31.6% of the overall target had been met. The challenges described above
certainly affected delivery. That four energy companies met all of their
obligations shows that compliance was possible, given an appropriate strategy.
6.22. The measures installed by energy companies delivered real carbon savings to
154,364 dwellings in low income areas. The majority of these properties were
hard-to-treat and therefore may not have received measures under a less
targeted energy efficiency scheme (such as CERT). In this respect, CESP can be
considered a success.
6.23. CESP was an innovative programme which trialled a number of policy features,
such as the bonus system and the focus on certain deprived areas. The
relative effectiveness of these policies and lessons learned have influenced the
design of the successor programme to CESP, the Energy Companies Obligation
(ECO).
The final report of the Community Energy Saving Programme (CESP) 2009-2012
46
Appendices
Index
Appendix Name of Appendix Page
number
1 Qualifying actions 47
2 Supplier and generator licences and
compliance status 48
3 Individual and whole house bonuses 51
4 Glossary 52
5 The Authority’s powers and duties 55
The final report of the Community Energy Saving Programme (CESP) 2009-2012
47
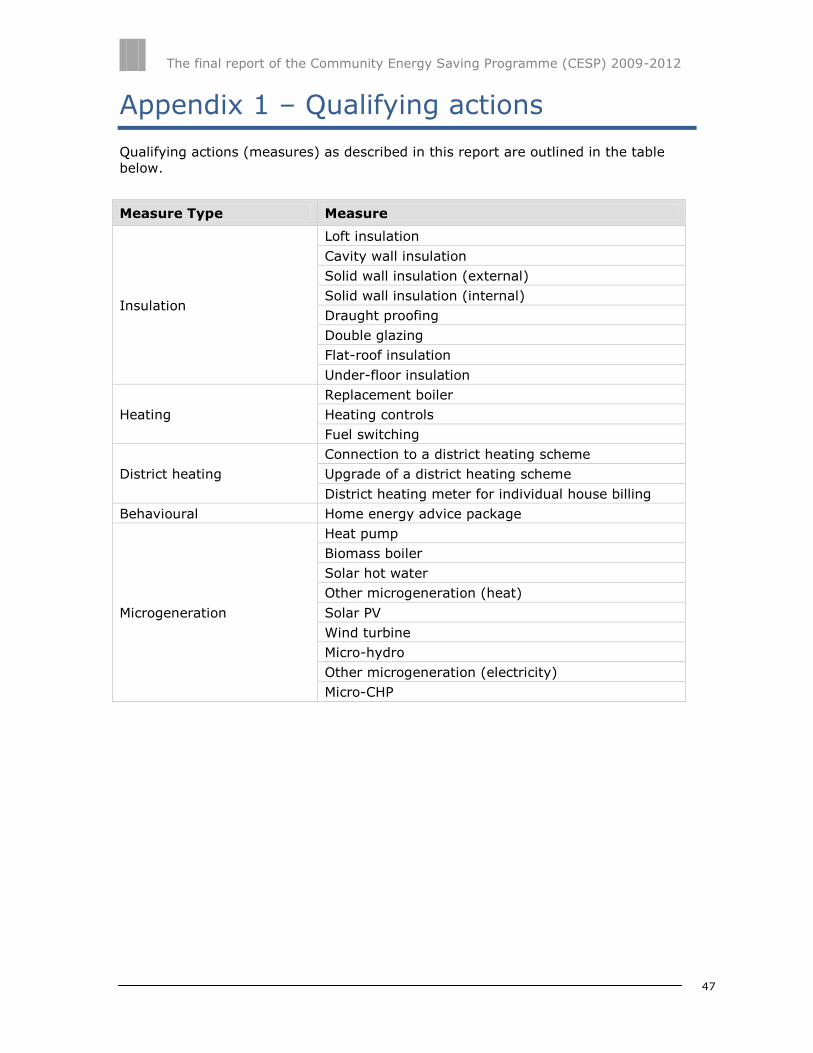
Appendix 1 – Qualifying actions
Qualifying actions (measures) as described in this report are outlined in the table
below.
Measure Type Measure
Insulation
Loft insulation
Cavity wall insulation
Solid wall insulation (external)
Solid wall insulation (internal)
Draught proofing
Double glazing
Flat-roof insulation
Under-floor insulation
Heating
Replacement boiler
Heating controls
Fuel switching
District heating
Connection to a district heating scheme
Upgrade of a district heating scheme
District heating meter for individual house billing
Behavioural Home energy advice package
Microgeneration
Heat pump
Biomass boiler
Solar hot water
Other microgeneration (heat)
Solar PV
Wind turbine
Micro-hydro
Other microgeneration (electricity)
Micro-CHP
The final report of the Community Energy Saving Programme (CESP) 2009-2012
48
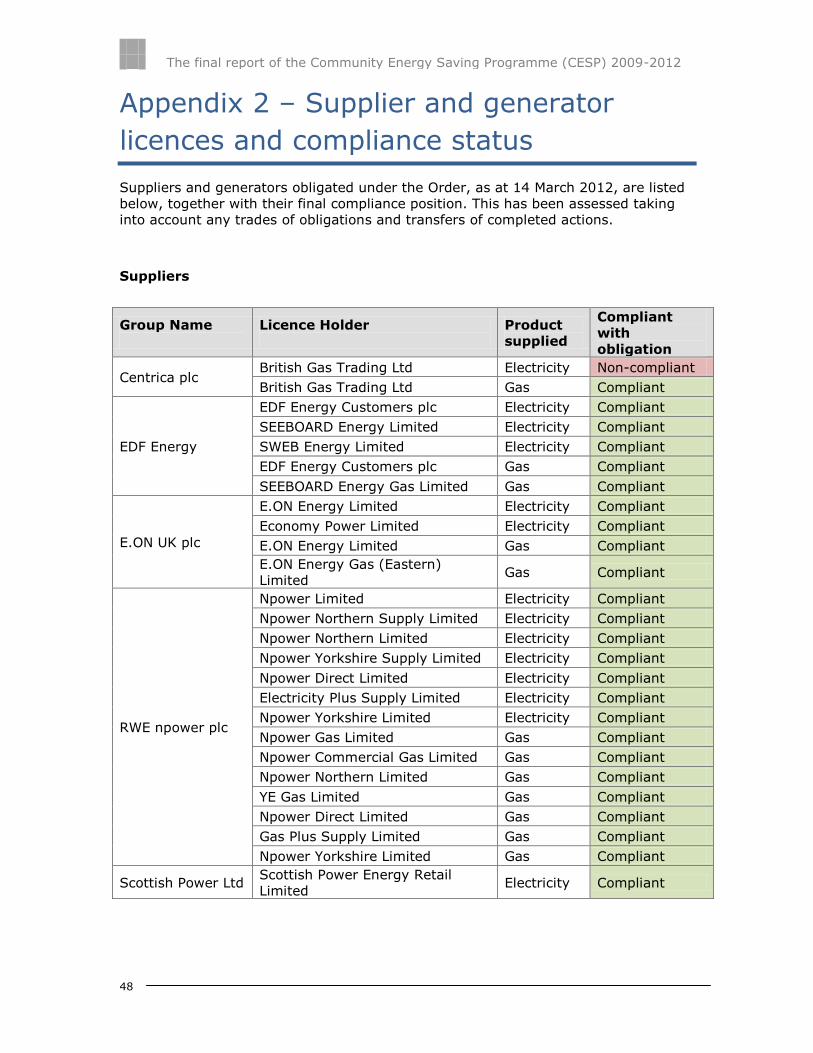
Appendix 2 – Supplier and generator
licences and compliance status
Suppliers and generators obligated under the Order, as at 14 March 2012, are listed
below, together with their final compliance position. This has been assessed taking
into account any trades of obligations and transfers of completed actions.
Suppliers
Group Name
Licence Holder
Product
supplied
Compliant
with
obligation
Centrica plc British Gas Trading Ltd Electricity Non-compliant
British Gas Trading Ltd Gas Compliant
EDF Energy
EDF Energy Customers plc Electricity Compliant
SEEBOARD Energy Limited Electricity Compliant
SWEB Energy Limited Electricity Compliant
EDF Energy Customers plc Gas Compliant
SEEBOARD Energy Gas Limited Gas Compliant
E.ON UK plc
E.ON Energy Limited Electricity Compliant
Economy Power Limited Electricity Compliant
E.ON Energy Limited Gas Compliant
E.ON Energy Gas (Eastern)
Limited Gas Compliant
RWE npower plc
Npower Limited Electricity Compliant
Npower Northern Supply Limited Electricity Compliant
Npower Northern Limited Electricity Compliant
Npower Yorkshire Supply Limited Electricity Compliant
Npower Direct Limited Electricity Compliant
Electricity Plus Supply Limited Electricity Compliant
Npower Yorkshire Limited Electricity Compliant
Npower Gas Limited Gas Compliant
Npower Commercial Gas Limited Gas Compliant
Npower Northern Limited Gas Compliant
YE Gas Limited Gas Compliant
Npower Direct Limited Gas Compliant
Gas Plus Supply Limited Gas Compliant
Npower Yorkshire Limited Gas Compliant
Scottish Power Ltd Scottish Power Energy Retail
Limited Electricity Compliant
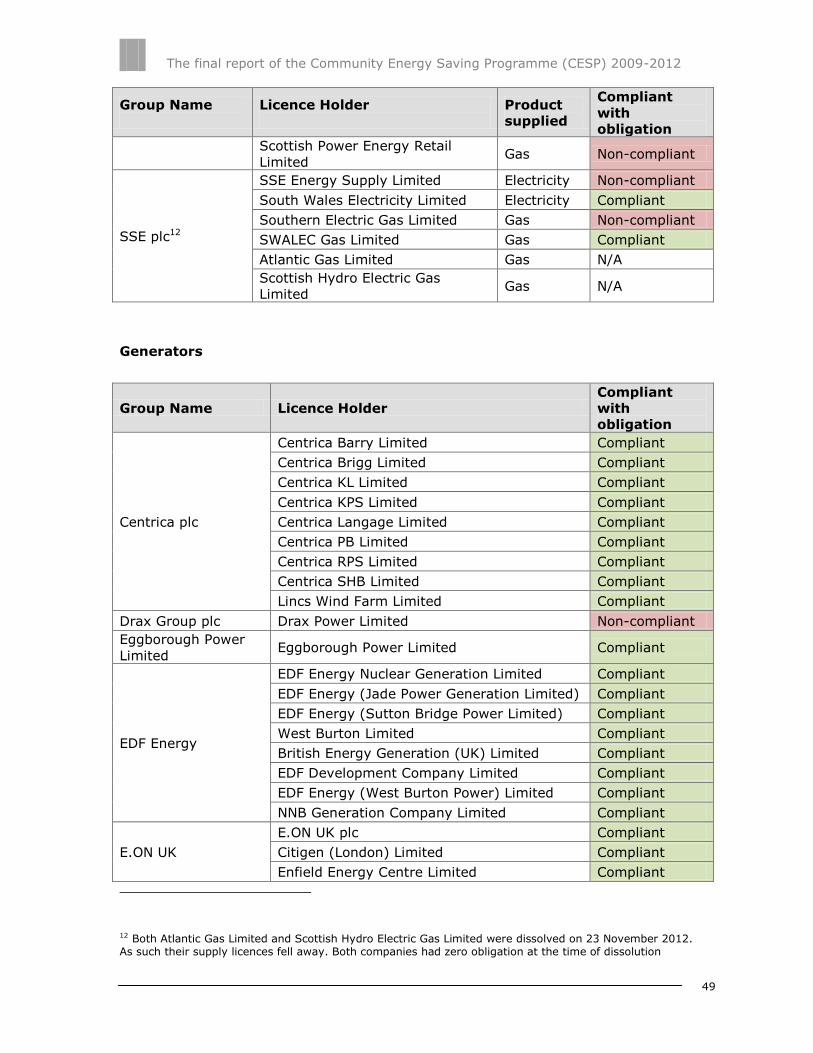
The final report of the Community Energy Saving Programme (CESP) 2009-2012
49
Group Name
Licence Holder
Product
supplied
Compliant
with
obligation
Scottish Power Energy Retail
Limited Gas Non-compliant
SSE plc12
SSE Energy Supply Limited Electricity Non-compliant
South Wales Electricity Limited Electricity Compliant
Southern Electric Gas Limited Gas Non-compliant
SWALEC Gas Limited Gas Compliant
Atlantic Gas Limited Gas N/A
Scottish Hydro Electric Gas
Limited Gas N/A
Generators
Group Name Licence Holder
Compliant
with
obligation
Centrica plc
Centrica Barry Limited Compliant
Centrica Brigg Limited Compliant
Centrica KL Limited Compliant
Centrica KPS Limited Compliant
Centrica Langage Limited Compliant
Centrica PB Limited Compliant
Centrica RPS Limited Compliant
Centrica SHB Limited Compliant
Lincs Wind Farm Limited Compliant
Drax Group plc Drax Power Limited Non-compliant
Eggborough Power
Limited Eggborough Power Limited Compliant
EDF Energy
EDF Energy Nuclear Generation Limited Compliant
EDF Energy (Jade Power Generation Limited) Compliant
EDF Energy (Sutton Bridge Power Limited) Compliant
West Burton Limited Compliant
British Energy Generation (UK) Limited Compliant
EDF Development Company Limited Compliant
EDF Energy (West Burton Power) Limited Compliant
NNB Generation Company Limited Compliant
E.ON UK
E.ON UK plc Compliant
Citigen (London) Limited Compliant
Enfield Energy Centre Limited Compliant
12 Both Atlantic Gas Limited and Scottish Hydro Electric Gas Limited were dissolved on 23 November 2012. As such their supply licences fell away. Both companies had zero obligation at the time of dissolution
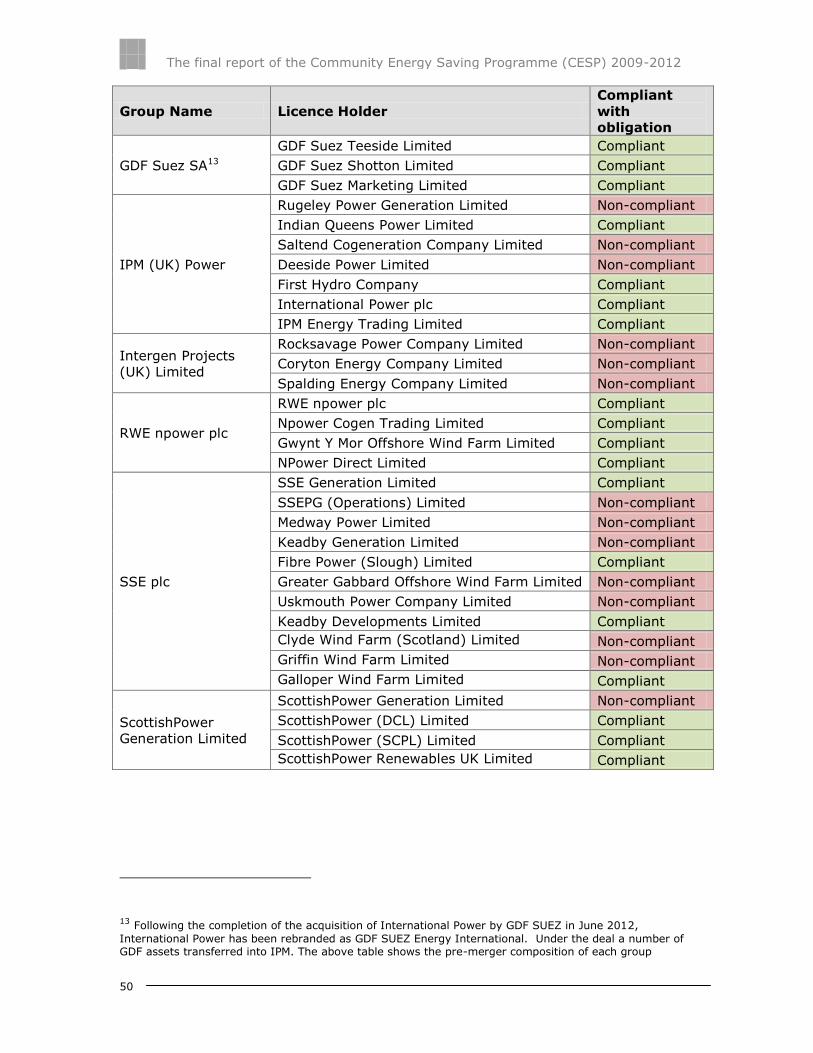
The final report of the Community Energy Saving Programme (CESP) 2009-2012
50
Group Name Licence Holder
Compliant
with
obligation
GDF Suez SA13
GDF Suez Teeside Limited Compliant
GDF Suez Shotton Limited Compliant
GDF Suez Marketing Limited Compliant
IPM (UK) Power
Rugeley Power Generation Limited Non-compliant
Indian Queens Power Limited Compliant
Saltend Cogeneration Company Limited Non-compliant
Deeside Power Limited Non-compliant
First Hydro Company Compliant
International Power plc Compliant
IPM Energy Trading Limited Compliant
Intergen Projects
(UK) Limited
Rocksavage Power Company Limited Non-compliant
Coryton Energy Company Limited Non-compliant
Spalding Energy Company Limited Non-compliant
RWE npower plc
RWE npower plc Compliant
Npower Cogen Trading Limited Compliant
Gwynt Y Mor Offshore Wind Farm Limited Compliant
NPower Direct Limited Compliant
SSE plc
SSE Generation Limited Compliant
SSEPG (Operations) Limited Non-compliant
Medway Power Limited Non-compliant
Keadby Generation Limited Non-compliant
Fibre Power (Slough) Limited Compliant
Greater Gabbard Offshore Wind Farm Limited Non-compliant
Uskmouth Power Company Limited Non-compliant
Keadby Developments Limited Compliant
Clyde Wind Farm (Scotland) Limited Non-compliant
Griffin Wind Farm Limited Non-compliant
Galloper Wind Farm Limited Compliant
ScottishPower
Generation Limited
ScottishPower Generation Limited Non-compliant
ScottishPower (DCL) Limited Compliant
ScottishPower (SCPL) Limited Compliant
ScottishPower Renewables UK Limited Compliant
13 Following the completion of the acquisition of International Power by GDF SUEZ in June 2012,
International Power has been rebranded as GDF SUEZ Energy International. Under the deal a number of GDF assets transferred into IPM. The above table shows the pre-merger composition of each group
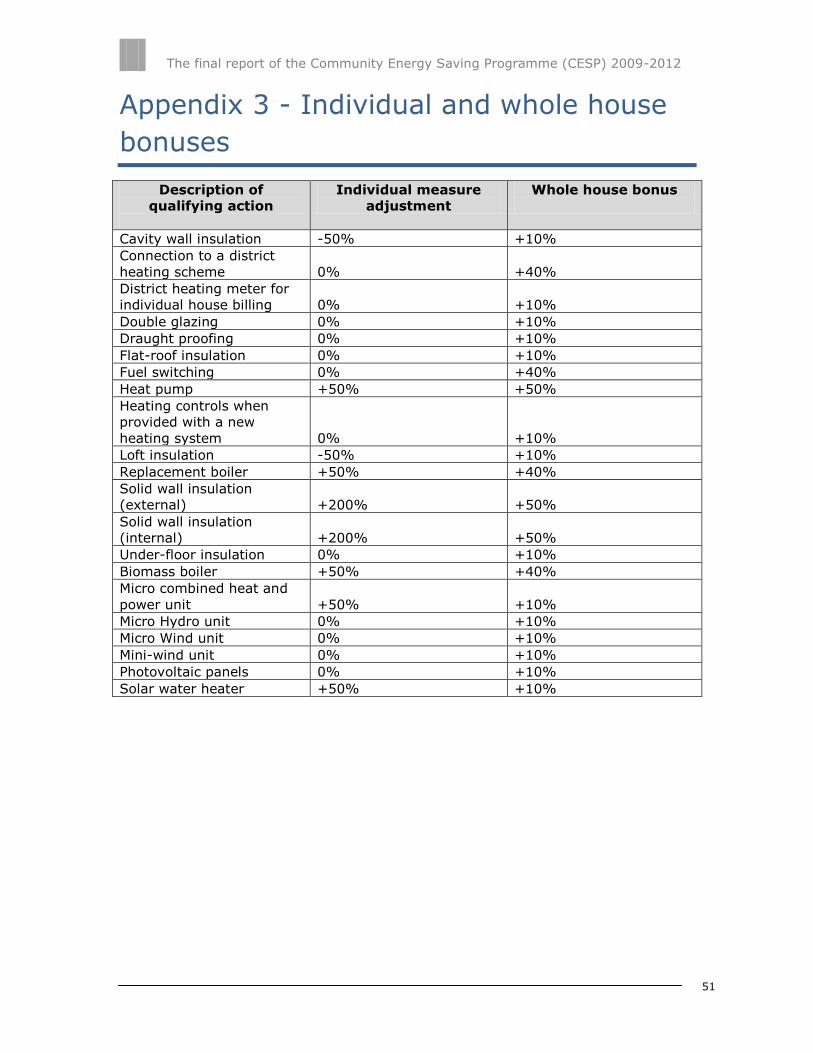
The final report of the Community Energy Saving Programme (CESP) 2009-2012
51
Appendix 3 - Individual and whole house
bonuses
Description of
qualifying action
Individual measure
adjustment
Whole house bonus
Cavity wall insulation -50% +10%
Connection to a district
heating scheme 0% +40%
District heating meter for
individual house billing 0% +10%
Double glazing 0% +10%
Draught proofing 0% +10%
Flat-roof insulation 0% +10%
Fuel switching 0% +40%
Heat pump +50% +50%
Heating controls when
provided with a new
heating system 0% +10%
Loft insulation -50% +10%
Replacement boiler +50% +40%
Solid wall insulation
(external) +200% +50%
Solid wall insulation
(internal) +200% +50%
Under-floor insulation 0% +10%
Biomass boiler +50% +40%
Micro combined heat and
power unit +50% +10%
Micro Hydro unit 0% +10%
Micro Wind unit 0% +10%
Mini-wind unit 0% +10%
Photovoltaic panels 0% +10%
Solar water heater +50% +10%

The final report of the Community Energy Saving Programme (CESP) 2009-2012
52
Appendix 4 - Glossary
A
Adjusted CO2 savings
Carbon dioxide reduction arising from qualifying actions as determined by applying
the appropriate carbon coefficient values as set out in Schedule 3 of the Order and
subsequently adjusted as described in articles 24 and 25 of the Order (adjustments
and bonuses)
Achieved savings
Achieved carbon savings were calculated based on the CESP carbon saving score and
lifetime of the measure. Achieved carbon savings were used to meet energy
companies’ obligations
C
CERT
Carbon Emissions Reduction Target (CERT) 2008- 2012
CESP
Community Energy Saving Programme (CESP) 2009 - 2012
CHP
Combined heat and power
CO2
Carbon dioxide
D
Data Zone
The equivalent in Scotland of a Lower Super Output Area in England and Wales
DECC
Department of Energy and Climate Change
De-duplication A process carried out by energy companies to ensure that each measure that was
professionally installed was only counted once
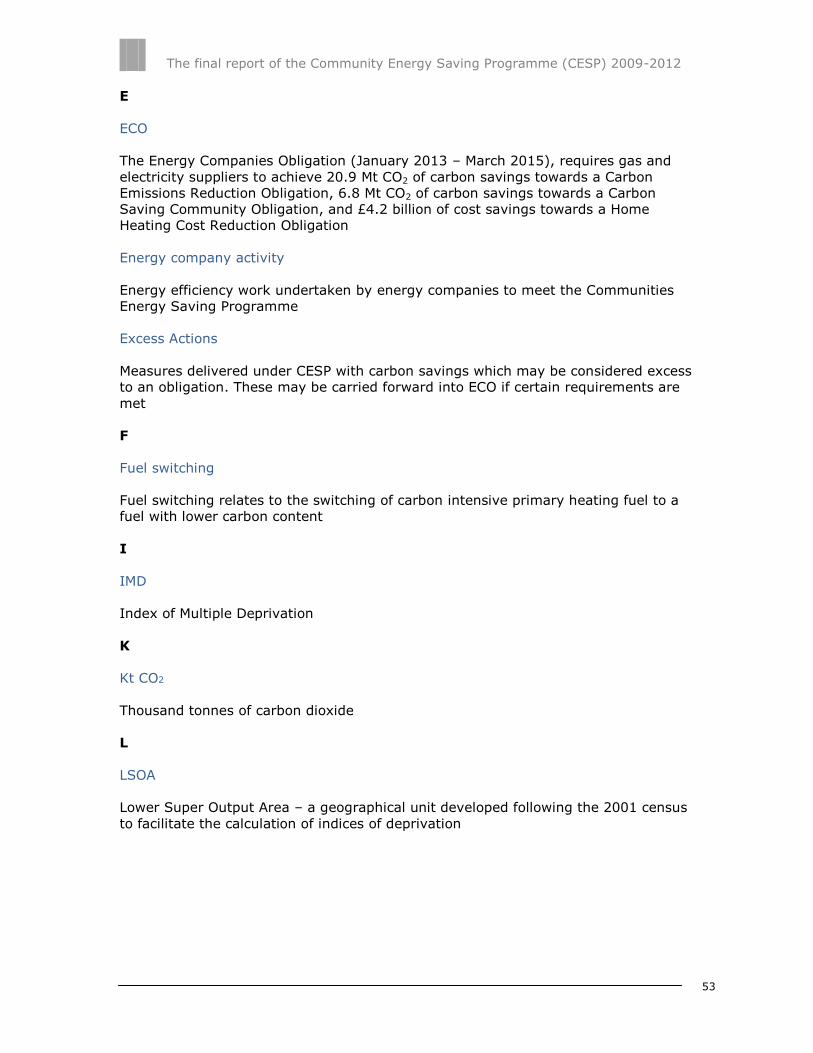
The final report of the Community Energy Saving Programme (CESP) 2009-2012
53
E
ECO
The Energy Companies Obligation (January 2013 – March 2015), requires gas and
electricity suppliers to achieve 20.9 Mt CO2 of carbon savings towards a Carbon
Emissions Reduction Obligation, 6.8 Mt CO2 of carbon savings towards a Carbon
Saving Community Obligation, and £4.2 billion of cost savings towards a Home
Heating Cost Reduction Obligation
Energy company activity
Energy efficiency work undertaken by energy companies to meet the Communities
Energy Saving Programme
Excess Actions
Measures delivered under CESP with carbon savings which may be considered excess
to an obligation. These may be carried forward into ECO if certain requirements are
met
F
Fuel switching
Fuel switching relates to the switching of carbon intensive primary heating fuel to a
fuel with lower carbon content
I
IMD
Index of Multiple Deprivation
K
Kt CO2
Thousand tonnes of carbon dioxide
L
LSOA
Lower Super Output Area – a geographical unit developed following the 2001 census
to facilitate the calculation of indices of deprivation
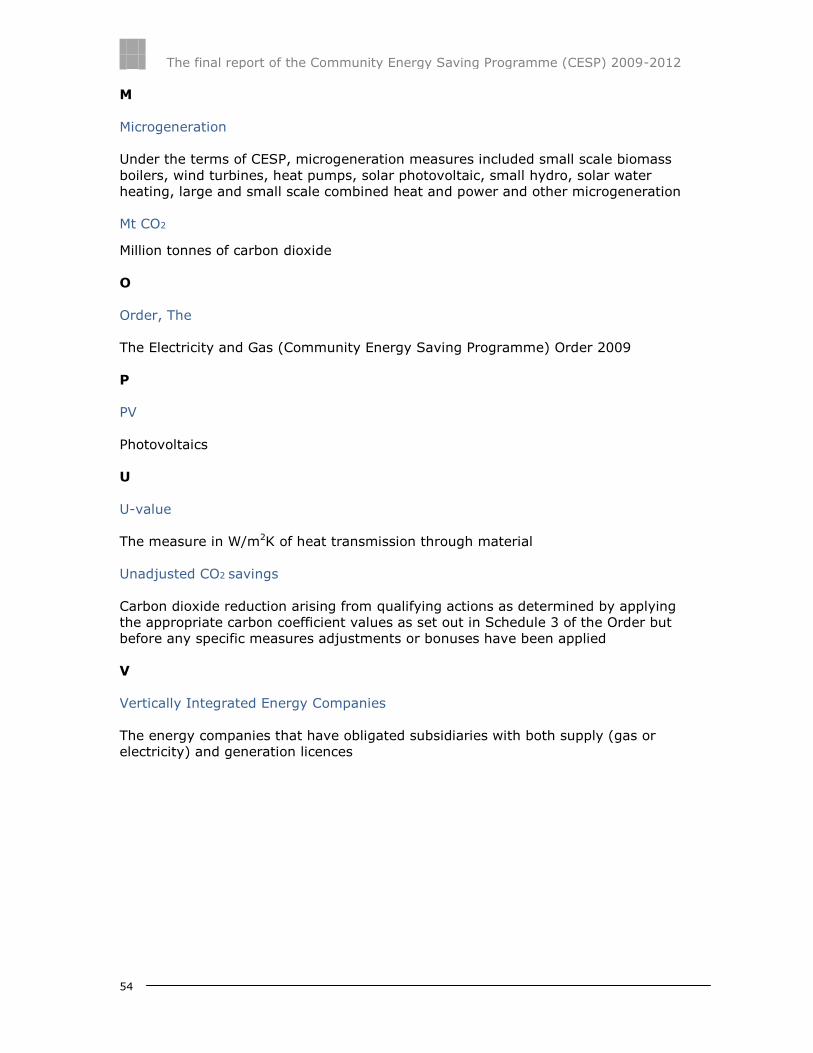
The final report of the Community Energy Saving Programme (CESP) 2009-2012
54
M
Microgeneration
Under the terms of CESP, microgeneration measures included small scale biomass
boilers, wind turbines, heat pumps, solar photovoltaic, small hydro, solar water
heating, large and small scale combined heat and power and other microgeneration
Mt CO2
Million tonnes of carbon dioxide
O
Order, The
The Electricity and Gas (Community Energy Saving Programme) Order 2009
P
PV
Photovoltaics
U
U-value
The measure in W/m2K of heat transmission through material
Unadjusted CO2 savings
Carbon dioxide reduction arising from qualifying actions as determined by applying
the appropriate carbon coefficient values as set out in Schedule 3 of the Order but
before any specific measures adjustments or bonuses have been applied
V
Vertically Integrated Energy Companies
The energy companies that have obligated subsidiaries with both supply (gas or
electricity) and generation licences

The final report of the Community Energy Saving Programme (CESP) 2009-2012
55
Appendix 5 – The Authority’s powers and
duties
1.1 Ofgem is the Office of Gas and Electricity Markets which supports the Gas and
Electricity Markets Authority (‘the Authority’), the regulator of the gas and
electricity industries in Great Britain. This appendix summarises the primary
powers and duties of the Authority. It is not comprehensive and is not a
substitute to reference to the relevant legal instruments (including, but not
limited to, those referred to below).
1.2 The Authority's powers and duties are largely provided for in statute (such as
the Gas Act 1986, the Electricity Act 1989, the Utilities Act 2000, the
Competition Act 1998, the Enterprise Act 2002, the Energy Acts of 2004,
2008 and 2010 and the Energy Bill 2012) as well as arising from directly
effective European Community legislation.
1.3 References to the Gas Act and the Electricity Act in this appendix are to Part 1
of those Acts.14 Duties and functions relating to gas are set out in the Gas Act
and those relating to electricity are set out in the Electricity Act. This appendix
must be read accordingly.15
1.4 The Authority’s principal objective is to protect the interests of existing and
future consumers in relation to gas conveyed through pipes and electricity
conveyed by distribution or transmission systems. The interests of such
consumers are their interests taken as a whole, including their interests in the
reduction of greenhouse gases and in the security of the supply of gas and
electricity to them.
1.5 The Authority is generally required to carry out its functions in the manner it
considers is best calculated to further the principal objective, wherever
appropriate by promoting effective competition between persons engaged in,
or commercial activities connected with,
the shipping, transportation or supply of gas conveyed through pipes;
the generation, transmission, distribution or supply of electricity;
the provision or use of electricity interconnectors.
1.6 Before deciding to carry out its functions in a particular manner with a view to
promoting competition, the Authority will have to consider the extent to which
the interests of consumers would be protected by that manner of carrying out
those functions and whether there is any other manner (whether or not it
would promote competition) in which the Authority could carry out those
functions which would better protect those interests.
14 Entitled “Gas Supply” and “Electricity Supply” respectively 15 However, in exercising a function under the Electricity Act the Authority may have regard to the interests of consumers in relation to gas conveyed through pipes and vice versa in the case of it exercising a function under the Gas Act
The final report of the Community Energy Saving Programme (CESP) 2009-2012
56
1.7 In performing these duties, the Authority must have regard to:
the need to secure that, so far as it is economical to meet them, all
reasonable demands in Great Britain for gas conveyed through pipes are
met;
the need to secure that all reasonable demands for electricity are met;
the need to secure that licence holders are able to finance the activities
which are the subject of obligations on them16; and
the need to contribute to the achievement of sustainable development.
1.8 In performing these duties, the Authority must have regard to the interests of
individuals who are disabled or chronically sick, of pensionable age, with low
incomes, or residing in rural areas.17
1.9 Subject to the above, the Authority is required to carry out the functions
referred to in the manner which it considers is best calculated to:
promote efficiency and economy on the part of those licensed18 under the
relevant Act and the efficient use of gas conveyed through pipes and
electricity conveyed by distribution systems or transmission systems;
protect the public from dangers arising from the conveyance of gas through
pipes or the use of gas conveyed through pipes and from the generation,
transmission, distribution or supply of electricity; and
secure a diverse and viable long-term energy supply,
and shall, in carrying out those functions, have regard to the effect on the
environment.
1.10 In carrying out these functions the Authority must also have regard to:
the principles under which regulatory activities should be transparent,
accountable, proportionate, consistent and targeted only at cases in which
action is needed and any other principles that appear to it to represent the
best regulatory practice; and
certain statutory guidance on social and environmental matters issued by
the Secretary of State.
1.11 The Authority may, in carrying out a function under the Gas Act and the
Electricity Act, have regard to any interests of consumers in relation to
communications services and electronic communications apparatus or to
water or sewerage services (within the meaning of the Water Industry Act
1991), which are affected by the carrying out of that function.
16 Under the Gas Act and the Utilities Act, in the case of Gas Act functions, or the Electricity Act, the Utilities Act and certain parts of the Energy Acts in the case of Electricity Act functions 17 The Authority may have regard to other descriptions of consumers 18 Or persons authorised by exemptions to carry on any activity
The final report of the Community Energy Saving Programme (CESP) 2009-2012
57
1.12 The Authority has powers under the Competition Act to investigate suspected
anti-competitive activity and take action for breaches of the prohibitions in the
legislation in respect of the gas and electricity sectors in Great Britain and is a
designated National Competition Authority under the EC Modernisation
Regulation19 and therefore part of the European Competition Network. The
Authority also has concurrent powers with the Office of Fair Trading in respect
of market investigation references to the Competition Commission.
19 Council Regulation (EC) 1/2003