Embed Size (px)
Citation preview

The Final Quality Gate:Software Release Readiness
Nancy Kastl, CSQAKaslen Group, Inc.(630) [email protected]

Kaslen Group is a Chicago-based consulting firm established in 1996
Specializing in project, process, and quality management
Expert staff and practical, proven solutions
1
Aligning Capabilities with Business Priorities
Project Management Business Analysis Process Re-engineering Quality Assurance Internal Controls and Audit Software Testing Measurement
Staffing ServicesProcess SolutionsProject SolutionsStrategic Planning Quality Management Process ManagementMeasurement SurveysAssessmentsTesting
Program Management Office Project ManagementProject Health Checks TestingIV&VProject Certification

2
Software Engineering & Quality Gates Dichotomy
Governance View - gates to measure progress (time, cost, and quality)- independent assessment (project health check)
Software Engineering View - the best method to build software
SOFTWARE DELIVERYINITIATION OPERATIONS
GO LIVEDECISION
AGILEWATERFALL
RADRUP ITERATIVE
INCREMENTAL EXTREMEPROGRAMMING
PROTOTYPING
COTS
Quality Management View - ways to prevent and find defects (QA/QC)

Time runs out
Based on testing defect reporting
Project manager says the project is ready
Developer moves the change into production
User acceptance testing or pilot is completed
Change Review Board
Factual, risk-based readiness determined by all stakeholders
3
Final Quality Gate: How is the GO LIVE decision made?

4
Case Study #1: Financial Services Firm
• Change Review Board – Operations
• Project Manager explains plans to go live
• Change Review Board questions project manager
• Eleventh hour surprises cause project delays
Go Live Decision Process (Current State)
• Too many highly visible production problems
• CIO wanted a better way to determine readiness
Trigger for Change

Case Study #2: Printing Company
• Project Manager reviews open defects with Client Services
• Disagreement on severity of defects and client impact
• Client Services feels unprepared to support the release in the field and at the Help Desk
• Project manager under pressure to get the release in
Go Live Decision Process (Current State)
• Go live meetings are battle grounds dreaded by participants
• VP Client Services wanted objective decision making
Trigger for Change
5

Managing the risk of applications and technology changes (hardware and infrastructure) impacting business stability
Ensuring compliance to regulatory requirements, Sarbanes-Oxley, HIPA, security/privacy, etc.
Ensuring governance and control through risk-based internal standards
Achieving stakeholders’ participation throughout projects to avoid eleventh hour surprises
Making a factual, risk-based readiness decision to ‘go live’from all stakeholders’ viewpoints
6
Common Challenges

Inability to quantify the risk and impact of open defects on customers
Inability to quantify the cumulative effect of open defects on customers
Insufficient customer representation in the ‘go live’ decision
Pressure to meet a project’s target date takes priority over readiness
Participants do not feel that they can cast a vote honestly due to pressures
Lack of responsibility and accountability for the ‘go live’ decision
Lack of objective criteria used to evaluate readiness
Lack of consistency in the process for determining readiness
7
Final Gate Gap Analysis
8
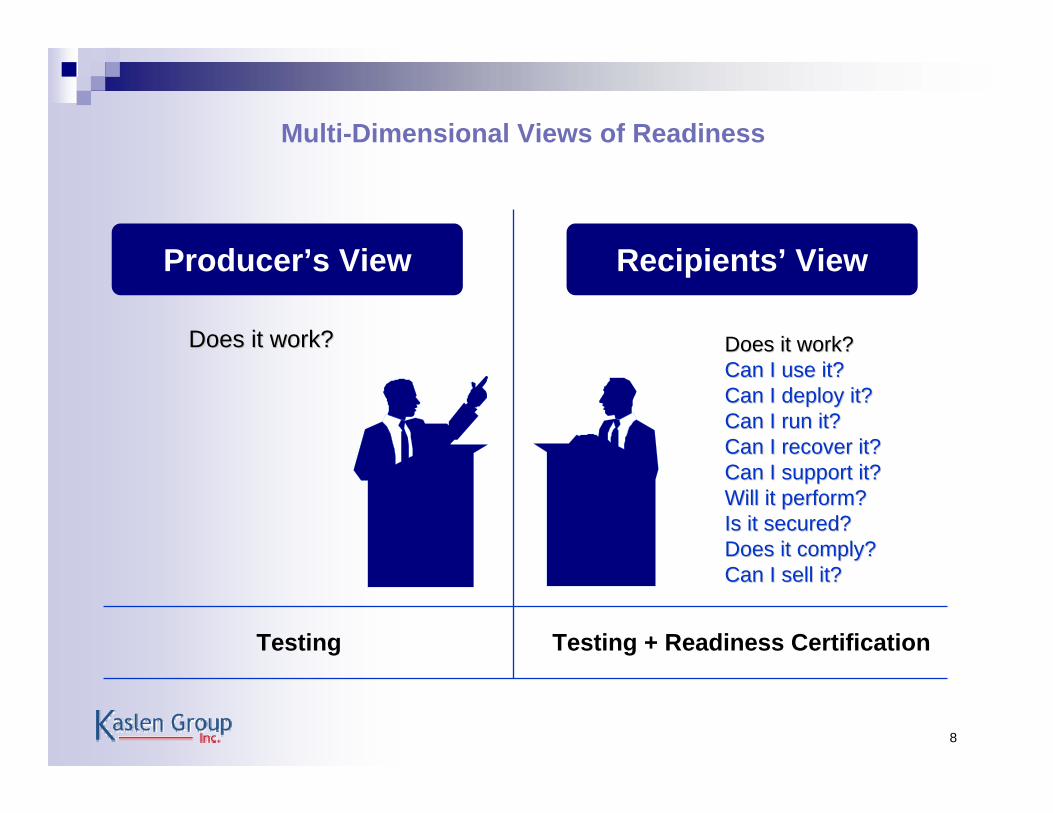
Multi-Dimensional Views of Readiness
Does it work?Does it work? Does it work?Does it work?Can I use it?Can I use it?Can I deploy it?Can I deploy it?Can I run it?Can I run it?Can I recover it?Can I recover it?Can I support it?Can I support it?Will it perform?Will it perform?Is it secured?Is it secured?Does it comply?Does it comply?Can I sell it?Can I sell it?
Producer’s View Recipients’ View
Testing Testing + Readiness Certification
9
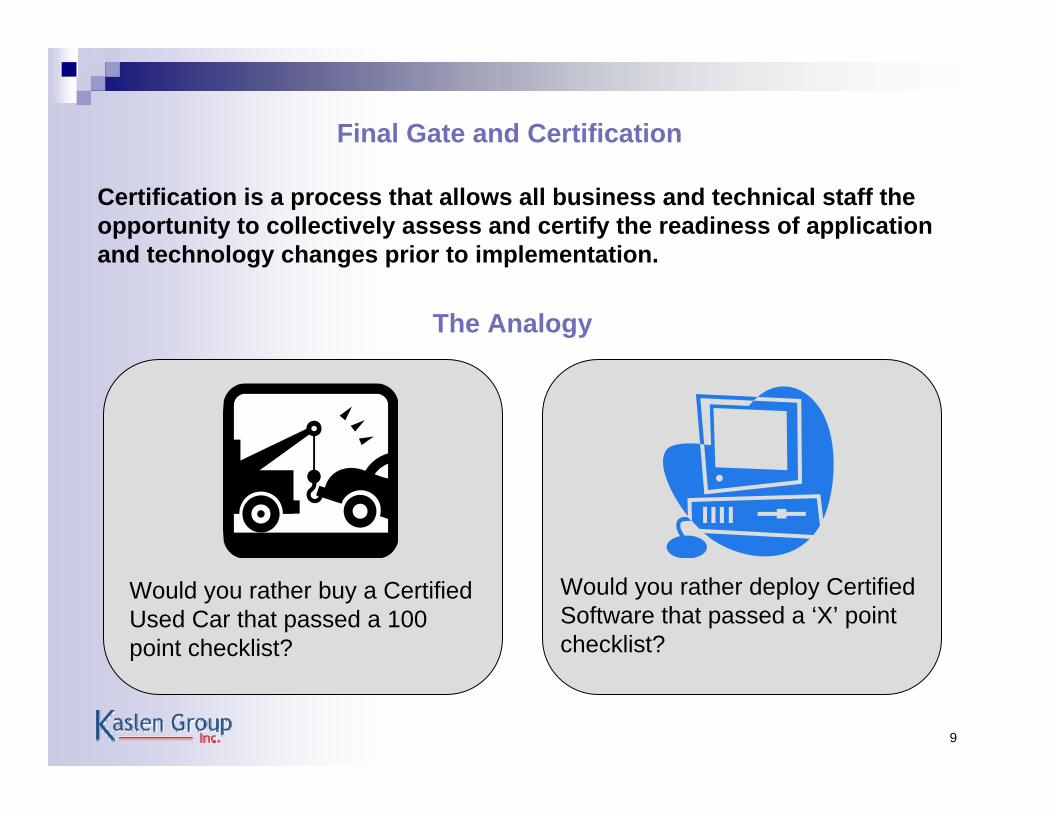
Final Gate and Certification
Certification is a process that allows all business and technical staff the opportunity to collectively assess and certify the readiness of application and technology changes prior to implementation.
Would you rather buy a Certified Used Car that passed a 100 point checklist?
Would you rather deploy Certified Software that passed a ‘X’ point checklist?
The Analogy

10
Business Stakeholders’ Readiness Criteria
External CustomersExternal CustomersInternal Business UnitsInternal Business UnitsFinance/AccountingFinance/AccountingMarketingMarketingProduct DevelopmentProduct DevelopmentOperationsOperationsHuman ResourceHuman ResourceAudit/ComplianceAudit/ComplianceLegalLegal
Business RequirementsFunctions and FeaturesExternal InterfacesInternal InterfacesBusiness WorkflowsProcessing DeadlinesApplication AvailabilityOn-line Response TimeUser DocumentationInformation AccessTrainingPilot ResultsLegal RequirementsSOX/COBITBusiness ResumptionData RetentionData ConversionBalancing and ControlsEtc…..
A checklist of readiness criteria addresses the business stakeholders’ view of readiness
Sign-off status on readinesscriteria drives decision makingat the final gate

Technology Stakeholders’ Readiness Criteria
IT OperationsIT OperationsNetwork and CommunicationsNetwork and CommunicationsServers AdministrationServers AdministrationHelp DeskHelp DeskSecurity AdministrationSecurity AdministrationSystems AdministrationSystems AdministrationSystems SoftwareSystems SoftwareDatabase AdministrationDatabase AdministrationDisaster Recovery CoordinatorDisaster Recovery CoordinatorApplication Maintenance/SupportApplication Maintenance/SupportProgram Management OfficeProgram Management OfficeTestingTestingProcess/Standards (SEPG)Process/Standards (SEPG)
Processing Flow & ScheduleOnsite/Offsite Backup/RecoveryInput/Output HandlingTrainingImplementation SupportProduction Set-UpProduction Migration PlanContingency PlanData Center StandardsOn-line Response TimeData Transfer PerformanceDesktop & Server CompatibilityComputer & Network CapacityComputer EfficiencyApplication DocumentationProgramming StandardsProcess StandardsSecurityEtc.
A checklist of readiness criteria includes the IT stakeholders’ viewof readiness
All IT organizations have a voice at the final gate based on criteria sign-off.
11

Readiness Certification Checklist
BusinessBusinessStakeholdersStakeholders
TechnologyTechnologyStakeholdersStakeholders
Purpose: Establishes overall criteria for evaluating software quality, customer, deployment, compliance, operations, security, and support readiness. Relevant readiness criteria for a project are selected and used for the final ‘go live’ decision.
12
ID CertifiableItem
Sign-Off Criteria Deliverable/Evidence
DeliveredBy
Readiness Criteria Certification Status
Internal Needs &Internal Needs &StandardsStandards
Industry Industry StandardsStandards
Certification Checklist can range from 40 to 100 certifiable items based on the company’s size, complexity, and level of detail desired.
Weight ScoreCertifiedBy

Readiness criteria are in the words of the business and technology stakeholders. They own the criteria and have ‘buy-in’ for project participation.
Readiness criteria provide knowledge transfer from the stakeholders to the project team in specialty domains.
Single repository of all internally defined standards, compliance requirements, and readiness needs.
Checklist can incorporate external industry risk-based standards.
Deliverables/evidence associated with readiness criteria will- reinforce the SDLC, if a formal methodology exists- reinforce the need for a SDLC, if one does not exist
Checklist approach assists with project chartering and estimating as a reminder of potential stakeholders and deliverables to be included.
Value of the Readiness Certification Checklist
13

Readiness Criteria Examples
QA/Testing Existing Functionality Regression Tests
Category CertifiableItem
CertifyingOrganization
Sign-OffCriteria *
Deliverable/Evidence
Product
Product
Customer
Product
Customer
Still works
DatabaseAdministration
Business Unit
Business Unit
Business Unit
On-LineResponse Time
Open Product Defects
Notification
Business Workflows
Response timemeets SLA
Customer impact &workarounds known
Accurate, clear,complete, timely
Modified or in place
Performance Tests
Product Defect List
Change Bulletin
Business ProcessDocumentation
Deployment Unit Roll-Out Plan Documented, understood, ready
Roll-Out PlanDeployment
Deployment Deployment Unit Deployment SupportCoverage
Staff available andprepared
Staffing Schedule
* Abbreviated version of actual criteria for example purposes
14
Support MaintenanceTeam
Code Lock Down Code underversion control
Change Mgt Audit

Readiness Criteria Examples
Help Desk Technical Briefing Release Documentation
Category CertifiableItem
CertifyingOrganization
Sign-OffCriteria *
Deliverable/Evidence
Operations
Security
Support
Operations
Data CenterOperations
Network Operations
Network Support
Backups
Network Capacity
Firewall Access
Backup capabilitiesIn place
Network bandwidthhandles workload
In place
Backup Tests
Load Tests
IP Addresses
Business Unit User Participation ParticipationOccurred in SDLC
Formal ApprovalsSOX Compliance
CMMICompliance
SQA Team Software EngineeringStandards Standards followed SQA Audits
SOAEnterpriseArchitecture Services Services are
fit for re-useServices ReviewAgainst Standards
* Abbreviated version of actual criteria for example purposes
15
Accurate, clear,complete, timely
Security Security Admin. Information AccessAuthorization
Access established Access verified

16
Readiness Scoring and Status Alternatives
ReadinessCriteria
Certification Scoring
Weighted Score
Score:3 = Certified2 = Conditionally Certified1 = Not certified
3
2
1
0 Weight:3 = High Risk2 = Medium Risk1 = Low Risk
A
B
C
D
WeightedGoal
1
3
3
2
3
6
3
0
3
9
9
6
18 33Total
54%% Goal
Total #Criteria
# NotCertified
# ConditionallyCertified
# Certified
# Not Scored
5 1 1 1 2
E 2 3 6 6
Status withoutScoring
Weight Score

17
Project Governance and Tracking Readiness
Certification Scorecard provides stakeholders continuous insight into the status of projects’ readiness. It is used for making the ‘go live’ decision along with supporting detailed information on the readiness criteria.
Readiness Certification Scorecard
# Certified
#Not
Certified
# Conditionally
Certified
ProjectTargetDate
Project TotalCertifiable
Items
Project A
Project B
Project C
Project D
30
10
15
55
Go LiveDecision
Date
#Not
Scored
%Goal
1 2 15 12
0 0 0 10 100%
0 0 10 5 77%
65%
0 1 4 50 96%mm / dd mm / dd
mm / ddmm / dd
mm / dd mm / dd
mm / ddmm / dd
Are these projects ready to go live?

18
Readiness Certification Process
DetermineCertifiableProjects
DetermineDetermineCertifiableCertifiableProjectsProjects
SelectReadiness
Criteria
SelectSelectReadinessReadiness
CriteriaCriteria
ReviewScorecardReviewReview
ScorecardScorecardHold
Go LiveMeeting
Hold Hold Go LiveGo LiveMeetingMeeting
ExamineReadinessEvidence
ExamineExamineReadinessReadinessEvidenceEvidence
Sign-offSignSign--offoff
Initiation Assessment
Decision
Beginning of project
ResolveIssues
ResolveResolveIssuesIssues
Throughout the project
Follow-upConditional
Criteria
FollowFollow--upupConditionalConditional
CriteriaCriteria
HoldLessonsLearned
HoldHoldLessonsLessonsLearnedLearned
Closure
Final Quality Gate After Release

19
Key Roles and Responsibilities
• Commit stakeholders (business and technology) to perform their role as a certifier and hold them accountable to performing their roles
Project Sponsor(s)
• Uses the Certification Checklist to identify relevant certifiable items and stakeholders for the project
• Makes deliverables and evidence required for sign-off available to stakeholders as part of the project’s activities
• Drives obtaining sign-off and resolution of issues preventing sign-off
• Resolves conditional readiness items prior to closing the project
Project Manager

20
Key Roles
• Agree to relevant readiness criteria for the project
• Perform their assessment and report results in a timely manner
Stakeholders (Certifiers)
• Use the Certification Scorecard and supporting information to make their decision objectively
• Do not bypass the process
Go Live Decision Makers

21
Tool Support
Makes the process easy to use
Eliminates perception of extra paperwork
Ease of selecting relevant readiness criteria from certification checklist and scoring
Centralized database of all readiness status and scoring across projects
Up-to-date ‘real time’ information onreadiness and issues preventing sign-off
Historical audit trail for compliance
Build or buy tool to support certification,as well as other quality gates(e.g. Calibra Project Intelligence)

22
Critical Success FactorsSecure senior leadership sponsorship
Create a custom certification checklist that fits your company
Tap industry standards for readiness criteria and standards to raise your organization’s capabilities(e.g. CMMI, COBIT, IEEE, ISO, PMBOK)
Fit the certification process to your project life cycle(s)
Engage your business and technology stakeholders in defining the checklist and process for ownership
Make the process flexible to expand to all types of projects andnot just software releases
Begin using readiness certification on upcoming projects; Avoid retrofitting to current projects or running pilots

23
Results and Benefits
Succeeding Together!Succeeding Together!
Reduced Number ofProduction Problems
Increased Satisfactionwith Implementations
Improved Company-WideCommunication & Teamwork
Multi-Dimensional QualityAwareness & Accountability
Governance& Compliance
Risk & Fact-BasedDecision Making

Industry Results of Implementing Processes & Controls
$1 spent on appraisal costs will reduce failure costs threefold; and each dollar spent on preventive costs will reduce failure costs tenfold. (COQ)
Performance Category Median Number ofData Points Low High
Cost
Schedule
Productivity
Quality
Customer Satisfaction
Return on Investment
20%
37%
62%
50%
14%
4.7 : 1
21
19
17
20
6
16
3%
2%
9%
7%
-4%
2 : 1
87%
90%
255%
132%
44%
27.7 : 1
http://www.sei.cmu.edu/cmmi/results.html
24Kaslen Group
Inc.