Embed Size (px)
Citation preview

Accelerating Sustainable Manufacturing
Copyright ©2009 SEMATECH, Inc. SEMATECH, and the SEMATECH logo are registered servicemarks of SEMATECH, Inc. International SEMATECH Manufacturing Initiative, ISMI, Advanced Materials Research Center and AMRC are servicemarks of SEMATECH, Inc. All other servicemarks and trademarks are the property of their respective owners.
The Feasibility of Alternative and Renewable Energy in the Semiconductor Industry
January 28, 2010
Mike Frisch, Ph.D., P.E.ESH Project [email protected]

Slide 2
• Technologies
• Survey of ISMI member companies
• Economic comparisons of power generating technologies
• Incentives
• Member company site economic analysis
• Other renewable energy options (green power, RECs)
• Conclusions/What’s next?
OutlineOutline

Slide 3
• More fuel-efficient, less polluting than conventional technologies
• Can operate on natural gas, biomass, liquid fuels, coal, and hydrogen
• Investigated combined heat and power (CHP) and fuel cell technologies
Alternative TechnologiesAlternative Technologies

Slide 4
• Cogeneration - electricity and heat from power plant
• Trigeneration - electricity, heat, and chilled water from power plant
• Generation cost tied directly to energy prices
• Both are proven technologies used by several member companies
• System sizes of 1 to 50 MW
Combined Heat and PowerCombined Heat and Power

Slide 5
CHP - Gas Turbine or Engine With Heat Recovery Unit
CHP - Gas Turbine or Engine With Heat Recovery Unit
Source: EPA Combined Heat and Power Partnership Program

Slide 6
CHP - Steam Boiler With Steam Turbine CHP - Steam Boiler With Steam Turbine
Source: EPA Combined Heat and Power Partnership Program

Slide 7
Absorption ChillerAbsorption Chiller
• Uses waste heat to generate chilled water
Source: Johnson Controls, Inc. - Used with permission.

Slide 8
Historical CHP Capacity and Growth Needed to Achieve 20% of GenerationHistorical CHP Capacity and Growth
Needed to Achieve 20% of Generation
Source: Combined Heat and Power – Effective Energy Solutions for a Sustainable Future, © U.S. Department of Energy, Office of Energy Efficiency and Renewable Energy Industrial Technologies Program, 2008.

Slide 9
CHP Share of Total National Power Production
CHP Share of Total National Power Production
Source: Combined Heat and Power: Evaluating the benefits of greater global investment © Organisation for Economic Co-operation and Development/International Energy Agency, 2008.

Slide 10
• Electricity and heat from hydrogen or methane from fossil or renewable sources, e.g., anaerobic digesters or landfills
• Very efficient, low emissions
• Proven, but expensive technology
• Cost varies with energy prices
• Readily installed at member company sites
• System sizes of 10 kW to 5+ MW
Fuel CellsFuel Cells
Photo Courtesy of U.S. Department of Energy/National Renewable Energy Laboratory; Credit: City of Tulare, 2008.

Slide 11
World Annual and Cumulative Fuel Cell MWe Installed
World Annual and Cumulative Fuel Cell MWe Installed
Source: Large Stationary Survey, 2008 © Fuel Cell Today, 2008.

Slide 12
• Non-polluting
• No fuel cost
• Success depends on location
• Investigated– Solar photovoltaic (PV)– Concentrating solar power (CSP)– Solar thermal (hot water)– Wind– Biomass– Geothermal– Hydrokinetic
Renewable TechnologiesRenewable Technologies

Slide 13
• Multiple types types– Silicon substrate (Si)– Thin film (TF)– Concentrating solar cells – relatively new
• Si and TF are proven technologies, enjoying rapid efficiency improvements and generous incentives
• Readily installed at member company sites
• System sizes 1 kW to 100+ MW
Solar PhotovoltaicSolar Photovoltaic
Photo Courtesy of 1house at a time, 2008. Photo Courtesy of U.S. DOE/NREL; Credit: Beck Energy, 2005
Photo Courtesy of SolFocus Inc., 2009

Slide 14
Solar Resources in the U.S. and GermanySolar Resources in the U.S. and Germany
Source: Photovoltaic Solar Resource: United States and Germany © U.S. DOE/NREL, 2008.

Slide 15
Solar Resources in the WorldSolar Resources in the World
Source: Taken from energy [r]evolution, A Sustainable Global Energy Outlook, report -global energy scenario by European Renewable Energy Council and Greenpeace. www.energyblueprint.info/, 2008.

Slide 16
Solar PV, Existing World Capacity, 1995-2008
Solar PV, Existing World Capacity, 1995-2008
Gig
awat
ts

Slide 17
• Four types (clockwise from top)
– Linear Fresnel Reflector (not pictured)
– Central Receiver– Parabolic Dish– Parabolic Trough
• In early stages of commercialization
• System sizes 100 kW to 100 GW
Concentrating Solar PowerConcentrating Solar Power
Photo Courtesy of U.S. DOE/NREL; Credit: Sandia National Laboratories, 1989
Photo Courtesy of U.S. DOE/NREL; Credit: Sandia National
Laboratories, 2000
Photo Courtesy of U.S. DOE/NREL; Credit:
Gretz, Warren, 1991

Slide 18
Types of CSP SystemsTypes of CSP Systems
Source: Concentrating Solar Power Global Outlook 09: Why Renewable Energy is Hot, Greenpeace International, SolarPACES, and ESTELA, 2009.

Slide 19
CSP – Parabolic Trough Process Flow Diagram
CSP – Parabolic Trough Process Flow Diagram
Source: Concentrating Solar Power Commercial Application Study: Reducing Water Consumption of Concentrating Solar Power Electricity Generation, U.S. Department of Energy, 2008.

Slide 20
CSP Capacity – Spain and World, 2007-2009
CSP Capacity – Spain and World, 2007-2009
Source: Data taken from Concentrating Solar Power Global Outlook 09: Why Renewable Energy is Hot, Greenpeace International, SolarPACES, and ESTELA, 2009.

Slide 21
100 GW? Really?100 GW? Really?
• DESERTEC - EUMENA Concept– Network of renewable energy installations designed to provide
power to Europe, The Middle East, and North Africa– Water desalination and transport– http://www.desertec.org/fileadmin/do wnloads/DESERTEC-
WhiteBook_en_small.pdf

Slide 22
• Hot water or process heat– Open loop– Closed loop
• Well developed, efficient, and cost-effective
• Readily installed at member company sites
• System sizes 2 kW to 2+ MW
Solar ThermalSolar Thermal
Photo Courtesy of U.S. DOE/NREL; Credit: Spink, Todd, 2001
Source: National Renewable Energy Laboratory
Evacuated Tube Hot Water Collector Installed by The Solar Guys, Australia

Slide 23
Annual Installed Capacity of Flat-plate and Evacuated Tube Collectors from 1999 to 2007
Annual Installed Capacity of Flat-plate and Evacuated Tube Collectors from 1999 to 2007
Source: IEA Solar Heating and Cooling Programme, Solar Heat Worldwide, 2009 edition, www.iea-shc.org.
Slide 24
• From large (7 MW) to small (3 kW) turbines
• Proven and cost-effective technology
• Small turbines may be suitable for member company sites
• System sizes 3 kW to 500+ MW
WindWind
100 kW Turbine 1.5 MW TurbinesOffshore Wind Farm
Photo Courtesy of U.S. DOE/NREL; Credit: Spink, Todd, 2008
Photo Courtesy of The Virginian-Pilot; Credit: Harper, Scott, 2009
Photo Courtesy of Northern Power Systems, 2009

Slide 25
U.S. Wind Capacity, 1999-2009U.S. Wind Capacity, 1999-2009
Source: AWEA 2nd Quarter 2009 Market Report, American Wind Energy Association, 2009.

Slide 26
Global Wind Capacity, 1996-2008Global Wind Capacity, 1996-2008
Source: Global Wind 2008 Report, Global Wind Energy Council, 2009.

Slide 27
• Burn as fuel to generate electricity and heat
• Often combined with alternative and conventional power generating systems
• Proven and cost-effective technologies
• More suitable for utilities
• System sizes 10 to 100+ MW
BiomassBiomass
Photo Courtesy of U.S. DOE/NREL; Credit: Gretz, Warren, 1997

Slide 28
Biomass and Other Renewables –Global Capacity
Biomass and Other Renewables –Global Capacity
Source: Annual Energy Review 2008, Energy Information Administration, 2009.

Slide 29
• Power from hot underground formations
• Proven and cost-effective technology
• Member company sites not located on such formations
• System sizes 1 MW to 50+ MW
GeothermalGeothermal
Source: Geothermal Education Office, Tiburon,
California, 2000.

Slide 30
World Geothermal InvestmentWorld Geothermal Investment
Source: 13.1. Global Geothermal: A Snapshot and Look Forward, Proceedings from World Bank’s GeoFund –IGA International Geothermal Workshop, with permission from New Energy Finance, 2009.

Slide 31
Global Geothermal CapacityGlobal Geothermal Capacity
Source: Data Taken From Renewable Energy-geothermal: Cumulative installed geothermal power capacity, British Petroleum and International Geothermal Association, 2008.

Slide 32
• Types– Elevated storage – hydroelectric dams– Wave power– Tidal power
• Wave and tidal power still under development
• Not suitable for member company sites
• System sizes 100 kW to 20+ GW
HydrokineticHydrokinetic
Pelamis Wave Energy Converter
Verdant Power
Turbines
Photo Courtesy of Wikipedia Commons Public Domain; Credit: unknown, 2008 Photo Courtesy of Verdant Power Inc., 2009

Slide 33
Global Hydroelectric Output, 1983-2008Global Hydroelectric Output, 1983-2008
Source: BP Statistical Review of World Energy 2009, BP p.l.c., 2009.

Slide 34
Applicability to Member Company SitesApplicability to Member Company Sites
• Technology robust and readily installed at member company sites– Solar PV – Silicon & Thin Film (10 to 1000 kW)– Solar Thermal – (80 to 1000 kW)– Small Wind (10 to 100 kW)– Fuel Cells (10 kW to 10 MW)– Combined Heat & Power (Cogen/Trigen) (1 to 20 MW)
• Not applicable to most member company sites– CSP – Early stages of commercialization– Onshore Wind – Difficult to permit, limited sites– Offshore Wind – Limited access– Geothermal – Limited access– Hydroelectric – Limited access– Biomass & Conventional Technologies (Coal, IGCC, CT, CCGT,
nuclear) – Fuel handling and permitting difficulties

Slide 35
Survey of ISMI Member CompaniesSurvey of ISMI Member Companies
• Responses– 12 of 16 member companies responded
– 19 responses received
– 28 sites reported
• AE/RE Installations– 5 member companies have no installations
– 7 member companies have a total of 12 installations
• Installed - Solar Photovoltaic (PV), Solar Thermal, Geothermal, Cogeneration, Trigeneration, NaS Batteries
• Not Installed - Wind, Biomass, Hydrokinetic and Fuel Cells
• 10 of 19 Respondents (7 of 12 member companies) Prefer Solar PV

Slide 36
Existing Alternative Energy/Renewable Energy Installations at Member Company Sites
Existing Alternative Energy/Renewable Energy Installations at Member Company Sites
0
1
2
3
4
5
Solar-PV Combined Heat &Power
Geothermal(Cooling)
Solar Thermal NaS Battery
Nu
mb
er o
f M
C In
stal
lati
on
s
% of total site power0.04
0.01
conf
conf
0.22
conf 30
50
20
100
92
conf

Slide 37
Alternative Energy/Renewable Energy Installations Under Evaluation
Alternative Energy/Renewable Energy Installations Under Evaluation
0
1
2
3
4
5
Solar-PV CombinedHeat &Power
Wind Geothermal(Cooling)
Fuel Cell BiomassBoilers
All Forms
Inst
alla
tio
ns
Un
der
Eva
luat
ion
by
MC
s

Slide 38
Alternative Energy/Renewable Energy Installation Technology Preference
Alternative Energy/Renewable Energy Installation Technology Preference
0
1
2
3
4
5
6
7
8
9
10
11
Solar-PV Not Specified Combined Heat& Power
Geothermal(Cooling)
Solar Thermal Wind
AE
/RE
Inst
alla
tio
n T
ech
no
log
y P
refe
ren
ce

Slide 39
Member Company Maximum Payback Time on Energy Projects
Member Company Maximum Payback Time on Energy Projects
20
10
54
32 2 2
1
0
5
10
15
20
25
Individual Member Company Responses
MC
Max
imu
m P
ayb
ack
Tim
e o
n E
ner
gy
Pro
ject
s (Y
ears
)
3 Additional Responses:N/A
No ResponseNPV to alternatives or close

Slide 40
Economic Comparisons of Power Generating TechnologiesEconomic Comparisons of Power Generating Technologies
• Installed Capital Costs– Reported in $/kW of nameplate capacity– Does not take into account capacity factor or fuel costs– Shows initial investment cost, but poor indicator of overall cost of
producing electricity
• Levelized Cost of Electricity– Ratio of total costs to power generated over the plant lifetime– Reported in $/MWhr– Includes capital, installation, fixed and variable operating and
maintenance, insurance, and financing costs– Accounts for capacity factor– Reported with and without incentives– Cost of carbon emissions not included– Best measure of cost of electricity, especially for new generation

Slide 41
Installed Capital Costs for Renewable, Alternative, and Conventional Sources of Electricity, United States
(Sources: CPUC, PACE Global Energy Services, NREL, Lazard, National Fuel Cell Research Center, DOE, ExxonMobil, USEPA, AWEA, CanWEA)
0
1000
2000
3000
4000
5000
6000
7000
Solar P
V - Silic
on
Solar P
V - Thin
Film
Solar T
herm
al (T
roug
h)
Small
Wind
(< 1
00 kW
)Ons
hore
Wind
Offsho
re W
indBiom
ass
Geoth
erm
alHyd
roele
ctric
Fuel C
ell (M
C, PA, S
O)
Combin
ed H
eat &
Pow
er (<
5 M
W)
Combin
ed H
eat &
Pow
er (>
5 M
W)
Coal
Inte
grat
ed G
asific
ation
Com
b. C
ycle
Gas T
urbin
e (P
eakin
g)
Comb.
Cyc
le Gas
Tur
bine
Nuclea
r
Technology
Cap
ital
Co
st (
US
$/kW
, nam
epla
te) Renewable Alternative Conventional

Slide 42
Levelized Cost of Electricity for Renewable, Alternative, and Conventional Sources – No Incentives
(Sources: World Economic Forum, REN21, CPUC, Lazard, CEC, Photon Consulting)
0
50
100
150
200
250
300
350
400
450
500
Solar P
V - Silic
on
Solar P
V - Thin
Film
Solar T
herm
al (T
roug
h)
Small
Wind
(< 1
00 kW
)Ons
hore
Wind
Offsho
re W
indBiom
ass
Geoth
erm
alHyd
roele
ctric
Fuel C
ell (M
C, PA, S
O)
Combin
ed H
eat &
Pow
er (<
5 M
W)
Combin
ed H
eat &
Pow
er (>
5 M
W)
Coal
Inte
grat
ed G
asific
ation
Com
b. C
ycle
Gas T
urbin
e (P
eakin
g)
Comb.
Cyc
le Gas
Tur
bine
Nuclea
r
Technology
Lev
eliz
ed C
ost
of
Ele
ctri
city
(U
S$/
MW
hr) Renewable Alternative Conventional

Slide 43
Levelized Cost of Electricity for Renewable, Alternative, and Conventional Sources – With Incentives
(Sources: CPUC, Lazard, NREL, CEC)
0
50
100
150
200
250
300
350
400
Solar P
V - Silic
on
Solar P
V - Thin
Film
Solar T
herm
al (T
roug
h)
Small
Wind
(< 1
00 kW
)Ons
hore
Wind
Offsho
re W
indBiom
ass
Geoth
erm
alHyd
roele
ctric
Fuel C
ell (M
C, PA, S
O)
Combin
ed H
eat &
Pow
er (<
5 M
W)
Combin
ed H
eat &
Pow
er (>
5 M
W)
Coal
Inte
grat
ed G
asific
ation
Com
b. C
ycle
Gas T
urbin
e (P
eakin
g)
Comb.
Cyc
le Gas
Tur
bine
Nuclea
r
Technology
Lev
eliz
ed C
ost
of
Ele
ctri
city
(U
S$/
MW
hr)
Renewable Alternative Conventional

Slide 44
IncentivesIncentives
– Incentives are financial tools used by governments, utilities, and other entities to subsidize and encourage the adoption of alternative and renewable technologies.
– Many types• Feed In Tariff (FIT) – payment per kWhr generated to a renewable energy
producer. The cost is usually distributed over all electricity users.• Investment Tax Credit (ITC) – reduction in tax, usually a percentage of
installed capital cost. Now available in the U.S. as a grant.• Depreciation Deduction (D) – allowing depreciation of installed capital to be
deducted from taxes. U.S. uses Modified Accelerated Cost Recovery System (MACRS) plus bonus depreciation (60, 16, 10, 6, 6, 2% over years one through six).
• Production Incentive (PI) – payment per kWhr generated, which is in addition to the value of the electricity on the open market. Usually offered by states, local utilities, or other entities.
• Rebate (R) – payment per kW installed. In U.S. is offered by state governments and local utilities.

Slide 45
Available Incentives – by CountryAvailable Incentives – by Country
ITCITCITCITCITCITCITCITCITCJapan
FITFITFITFITFITFITItaly
FITFITFITIsrael
ITC/DDITC/DDITC/DDITC/DDITC/DDITC/DDITC/DDITC/DDITC/DDU.S.
FITTaiwan
FITFITFITFITFITScotland
Singapore
DDDDDDDDDDMalaysia
FITFITITC/FITKorea
FITITCITC/FITFITITCFITFITIreland
FITFITFITFITFITFITGermany
FITFITChina
FITFITFITAustria
HydroGeothermalBiomassWindSolar
ThermalCSPSolar PVCHPFuel CellsCountry
FIT = Feed in TariffITC = Investment Tax Credit or Grant
DD = Depreciation Deduction

Slide 46
Available Incentives – by U.S. StateAvailable Incentives – by U.S. State
RRNew York
ITCITCITCITCITC/PINew Mex.
R/PIITCR/PIMass.
PIPIWash.
Virginia
FITFITFITITC/RITC/R/FIT/PIVermont
FITFITFITFITITC/PIFITPI/RUtah
RTexas
R/PIPIFIT/PI/ROregon
PIPIPIR/PIRPIR/PIPIPIMaine
PIPIIdaho
FITFITFIT/RRFITFIT/RRCalifornia
ITCITC/PIITCITC/RArizona
HydroGeothermalBiomassWindSolar
ThermalCSPSolar PVCHPFuel CellsState
FIT = Feed in TariffITC = Investment Tax Credit or Grant
PI = Production IncentiveR = State or Local Rebate

Slide 47
Member Company Site Economic AnalysisMember Company Site Economic Analysis
• Analyzed solar PV – Si, solar thermal, small wind, fuel cell, and combined heat & power
• Simple payback period– Based on U.S. capital, installation, and O&M costs– Incentives included for each location– Industrial electricity rates for each location– Natural gas cost = 8.00 US$/million BTU
• Sites with a payback > 50 years are not shown
• Conversion efficiency, manufacturing costs, incentives, regulations, and fuel and electricity costs are rapidly changing, so these analyses must be updated frequently.

Slide 48
ISMI Member Company LocationsISMI Member Company Locations

Slide 49
Economic Analysis of 19.5 to 50 kW (DC) Solar PV-Si Roof-Mounted System
(based on U.S. installed cost 103K to 265K USD, systems sized to maximize incentives)
0
5
10
15
20
25
30
35
40
45
Austin
East F
ishkil
l
Yorkto
wn Heig
hts
Hudso
nCha
ndler
Essex
Junc
tion
Hwasun
gGihe
ung
Rosev
illeRio
Ranch
oSan
ta C
lara
Arlingt
onDall
asKiry
at G
atHou
ston
Sherm
anAve
zzan
oTuc
son
Freibu
rgFre
ising
Camas
Dresd
en
Regen
sbur
gLe
hiVilla
chCor
vallis
Hillsbo
ro
South
Por
tland
Beijing
Boise
Nampa
Japa
nM
anas
sas
Shang
hai
SW Ja
pan
Singap
ore
Leixl
ipKuli
m
Facility/Fab Location
Sim
ple
Pay
bac
k P
erio
d (
Yea
rs)

Slide 50
Economic Analysis of 350 kW (DC) Solar PV-Si Roof-Mounted System
(based on U.S. installed cost 1.941 million USD)
0
5
10
15
20
25
30
35
40
45
50
Giheun
gHwas
ung
Essex
Junc
tion
Avezz
ano
Tucso
nRio
Ranch
oHud
son
Santa
Clar
aFre
iburg
Freisi
ngRos
eville
Kiryat
Gat
Dresd
en
Regen
sbur
gCha
ndler
Villach
East F
ishkil
l
Yorkto
wn Heig
hts
Arlingt
onDall
asShe
rman
South
Por
tland
Housto
nBeij
ingBois
eNam
paM
anas
sas
Shang
hai
Japa
n (1
)Le
hiAus
tinJa
pan
(2)
Camas
Corva
llisHills
boro
Singap
ore
Kulim
Leixl
ip
Facility/Fab Location
Sim
ple
Pay
bac
k P
erio
d (
year
s)

Slide 51
Comparison of 19.5-50 kW to 350 kW Systems(Solar PV-Si, Roof-Mounted)
0
5
10
15
20
25
30
35
40
45
50
Austin
East F
ishkil
l
Yorkto
wn Heig
hts
Hudso
nCha
ndler
Essex
Junc
tion
Hwasun
gGihe
ung
Rosev
illeRio
Ranch
oSan
ta C
lara
Arlingt
onDall
asKiry
at G
atHou
ston
Sherm
anAve
zzan
oTuc
son
Freibu
rgFre
ising
Camas
Dresd
en
Regen
sbur
gLe
hiVilla
chCor
vallis
Hillsbo
ro
South
Por
tland
Beijing
Boise
Nampa
Japa
nM
anas
sas
Shang
hai
SW Ja
pan
Singap
ore
Leixl
ipKuli
m
Facility/Fab Location
Sim
ple
Pay
bac
k P
erio
d (
Yea
rs) 19.5 - 50 kW
350 kW
Slide 52
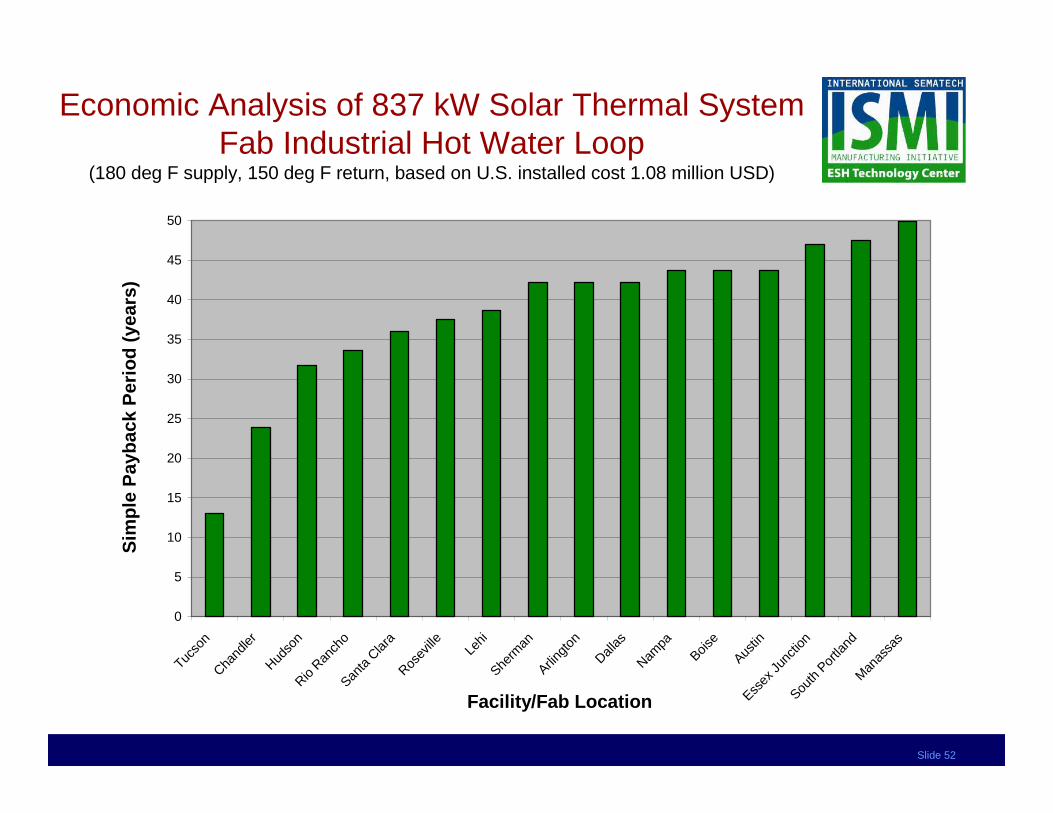
Economic Analysis of 837 kW Solar Thermal System Fab Industrial Hot Water Loop
(180 deg F supply, 150 deg F return, based on U.S. installed cost 1.08 million USD)
0
5
10
15
20
25
30
35
40
45
50
Tucso
nCha
ndler
Hudso
nRio
Ranch
oSan
ta C
lara
Rosev
ille Lehi
Sherm
anArlin
gton
Dallas
Nampa
Boise
Austin
Essex
Junc
tion
South
Por
tland
Man
assa
s
Facility/Fab Location
Sim
ple
Pay
bac
k P
erio
d (
year
s)

Slide 53
Economic Analysis of 80 kW Solar Thermal System Facility Domestic Usage
(120 deg F supply, based on U.S. installed cost 160K USD)
0
5
10
15
20
25
30
35
40
45
50
Hudso
nCha
ndler
Tucso
nSan
ta C
lara
Rosev
ille Lehi
Rio Ran
cho
Essex
Junc
tion
Arlingt
onDall
asShe
rman
Boise
Nampa
Austin
South
Por
tland
Man
assa
sHou
ston
East F
ishkil
l
Yorkto
wn Heig
htsCor
vallis
Camas
Hillsbo
roJa
pan
(1)
Kulim
Giheun
gHwas
ung
Kiryat
Gat
Japa
n (2
)Sing
apor
eBeij
ing
Facility/Fab Location
Sim
ple
Pay
bac
k P
erio
d (
year
s)

Slide 54
Economic Analysis of 100 kW (DC) Wind Turbine System
(based on U.S. installed cost 386K USD)
0
5
10
15
20
25
30
35
40
45
50
Green
ock (
prop
osed
)Tat
eyam
aHud
son
Avezz
ano
Arlingt
onDall
asShe
rman
Essex
Junc
tion
Leixl
ip
Yorkto
wn Heig
hts
Japa
n (G
roup
1)
South
Por
tland
Housto
nM
anas
sas
Austin
Japa
n (G
roup
2)
Kiryat
Gat
Nampa
Boise
Shang
hai
East F
ishkil
lBeij
ingCam
asRio
Ranch
oHills
boro
Corva
llis
Facility/Fab Location
Sim
ple
Pay
bac
k P
erio
d (
year
s)

Slide 55
Economic Analysis of 1 MW Fuel Cell System(based on U.S. installed cost 4.1 million USD)
0
5
10
15
20
25
30
Korea Avezzano Leixlip Greenock (proposed) Villach
Facility/Fab Location
Sim
ple
Pay
bac
k P
erio
d (
Yea
rs)
0
0.05
0.1
0.15
0.2
0.25
Ind
ustrial E
lectricity Rate ($/kW
hr)
Simple Payback Period (Years)
Industrial Electricity Rate (USD/kWhr)

Slide 56
Economic Analysis of 10 MWCombined Heat and Power System
(based on U.S. installed cost 12 million USD)
0
2
4
6
8
10
12
Avezz
ano
Leixl
ip
Green
ock (
prop
osed
)
Japa
n
Villach
Hudso
n
New Y
ork
Singap
ore
South
Por
tland
Califo
rnia
Essex
Junc
tion
Kiryat
Gat
Germ
any
Facility/Fab Location
Sim
ple
Pay
bac
k P
erio
d (
Yea
rs)
0
0.05
0.1
0.15
0.2
0.25
Ind
ustrial E
lectricity Rate (U
SD
/kWh
r)
Simple Payback Period (Years)
Industrial Electricity Rate (USD/kWhr)

Slide 57
10 MW Combined Heat and Power SystemImpact of Natural Gas Price(based on U.S. installed cost 12 million USD)
0.00
2.00
4.00
6.00
8.00
10.00
12.00
14.00
16.00
18.00
Avezz
ano
Leixl
ip
Green
ock (
prop
osed
)Ja
pan
Villach
Hudso
nNew
Yor
kSing
apor
e
South
Por
tland
Califo
rnia
Essex
Junc
tion
Kiryat
Gat
Germ
any
Texas
(non
-Aus
tin)
Man
assa
sAriz
ona
Kulim
Rio Ran
cho
Austin
Korea
Camas
Hsinch
uId
aho
Lehi
Orego
nChin
a
Facility/Fab Location
Sim
ple
Pay
bac
k P
erio
d (
Yea
rs)
3.5 USD/mil BTU
8 USD/mil BTU
13 USD/mil BTU

Slide 58
Member Company Locations with < 5-yr Payback 19.5-50 kW Solar - PV
Member Company Locations with < 5-yr Payback 19.5-50 kW Solar - PV
Austin
Rio Rancho
Chandler
Hwasung
Gihueng
East Fishkill
Yorktown Heights
Hudson
Roseville
Essex Junction

Slide 59
Member Company Locations with < 5-yr Payback 350 kW Solar - PV
Member Company Locations with < 5-yr Payback 350 kW Solar - PV
Hwasung
Gihueng
Essex Junction

Slide 60
Member Company Locations with < 5-yr Payback 80 kW Solar Thermal - Domestic
Member Company Locations with < 5-yr Payback 80 kW Solar Thermal - Domestic
Chandler
Hudson

Slide 61
Member Company Locations with < 5-yr Payback 100 kW Wind Turbine
Member Company Locations with < 5-yr Payback 100 kW Wind Turbine
Greenock

Slide 62
Member Company Locations with < 5-yr Payback 1 MW Fuel Cell
Member Company Locations with < 5-yr Payback 1 MW Fuel Cell
Hwasung
Gihueng
Avezzano

Slide 63
Member Company Locations with < 5-yr Payback 10 MW CHP
(Nat. Gas Cost = 8 USD/million BTU)
Member Company Locations with < 5-yr Payback 10 MW CHP
(Nat. Gas Cost = 8 USD/million BTU)
Avezzano
Villach
East Fishkill
Leixlip
Greenock
Japan
Singapore
Yorktown Heights
Hudson

Slide 64
Summary of AE/RE Technologies at Member Company Sites (< 5-yr Payback)
Summary of AE/RE Technologies at Member Company Sites (< 5-yr Payback)
Solar PV - small Solar (350 kW) Wind (100 kW)Solar Thermal Fuel Cell CHP

Slide 65
Other Renewable Energy Options (1)Other Renewable Energy Options (1)
Green Power – renewable power available from local utilities– A way to support the renewable energy
industry and reduce environmental impact
– Available to most member company sites– In some cases, can select technology
(solar, wind, biomass, geothermal, hydrokinetic) to support preferred or lower impact technology
– Cost premium of 0.5 to 10 U.S. cents/kWhr
– Hedge against rising electricity costs– Six of ten member companies with sites
in the U.S. purchase green power
City CountryGreen Power
Available?Austria YesChina Trial BasisGermany YesIreland Yes but not certifiedIsrael NoItaly YesJapan YesKorea NoMalaysia NoScotland Yes but not certifiedSingapore Yes but not certifiedTaiwan No
Arlington US YesAustin US Yes but not certifiedBoise US YesCamas US YesChandler US YesCorvallis US YesDallas US YesEast Fishkill US YesEssex Junction US Yes but not certifiedHillsboro US YesHouston US YesHudson US YesLehi US YesManassas US YesNampa US YesRio Rancho US YesRoseville US Yes but not certifiedSanta Clara US YesSherman US YesSouth Portland US NoTucson US YesYorktown Heights US Yes

Slide 66
Other Renewable Energy Options (2)Other Renewable Energy Options (2)
• Renewable Energy Certificate (REC) – “represents the property rights to the environmental, social, and other nonpower qualities of renewable electricity generation. A REC, and its associated attributes and benefits, can be sold separately from the underlying physical electricity associated with a renewable-based generation source” EPA, 2009– 1 REC = 1 MWhr– Available to all member companies, only 1 of 14 purchases RECs– Can get them from any source and apply them to any facility– Prices can vary from $5 to $90 and depend on many factors– Another way to support the renewable energy industry and reduce
environmental impact
Green Power vs. RECs vs. AE/RE Installations?

Slide 67
ConclusionsConclusions
• Technologies readily installed at member company sites include solar PV, solar thermal, small wind, fuel cells, and CHP.
• Rapidly declining costs and generous incentives currently give some technologies at some sites payback periods of 1 to 5 years, which fit within most member company requirements.
• The most promising AE technology is CHP, which can generate 100% of facility power usage.
• The most promising RE technology is Solar-PV, but most power used at a facility will still come from the grid.

Slide 68
What’s Next?What’s Next?
• Increased deployment of technologies will continue to bring downcosts and increase conversion efficiencies.
• Carbon cap & trade regulations and tight fuel supplies will increase conventional electricity costs.
• Governments and utilities will scale back incentives for technologies that reach price parity in order to encourage manufacturers to continue cost reduction and efficiency improvement.
• For many technologies, price parity without incentives will be reached within 5 to 10 years.

Slide 69
Thank You !!Thank You !!


![[PPT]Chapter 18 Renewable Energy 18-1 Renewable …environmentalscienceclass.weebly.com/.../ch_18_notes.ppt · Web viewChapter 18 Renewable Energy 18-1 Renewable Energy Today Renewable](https://img.dokumen.tips/doc/110x75/5b029fb97f8b9a6a2e900bdf/pptchapter-18-renewable-energy-18-1-renewable-envir-viewchapter-18-renewable.jpg)