Embed Size (px)
Citation preview
23/ The UK Oracle User Group Journal / Issue 24 Winter 2005 Oracle Scene
The IT Architecture PapersIT groups have a pressing need to identify
those things worthy of their attention.
Many of our clients have asked us, What
do I need to know about and manage on
behalf of my client?
This question led us to think about how
we structured and presented our work. We
wanted a framework we could use in our
assignments and share with our clients.
In this series of papers, we have presented an
Information Technology (IT) Architecture
framework that encourages a minimalist
approach to IT Architecture by exploring a
number of extreme points of view.
We used the metaphors of cathedral and
shanty towns to discuss the extremes of
perfection and chaos in IT systems—in
other words, the extremes of architecture.
We implied a comparison between
building and town planning, activities
undertaken by humankind for several
millennia, and software systems
development, something that has only
been performed for the last few decades.
We delved into the differences between
human activity systems and software
systems, and classified both types of system
into a hierarchy of sub-systems. We noted
that, although the hierarchy is a convenient
way of classifying systems, the true nature
of business and software systems is to be
independent and overlapping.
This led to the notion of interoperability
as one of the key architectural issues,
‘…the ability of a system to successfully
interact with other, specified systems.’ [1]
We also referred to a formal definition of
IT architecture found in legislation passed
by the US Congress; the Information
Technology Management Reform Act of
1996 also known as the Clinger-Cohen Act.
‘An integrated framework for evolving
or maintaining existing information
technology and acquiring new
information technology to achieve the
agency’s strategic goals and information
resource management goals.’
We described an IT architecture
framework as a matrix of ‘system types’ as
rows and ‘architectural views’ as columns.
This was used to organise and group the
18 architectural elements that constitute
the framework.
The complete framework uses a single,
uncluttered diagram shown in Figure 1.
This approach reflects our belief that the
framework is simple to describe and easy
to recall. However, the diagram is not
trivial; the 18 different elements taken
together, fully define an IT architecture.
In the third article in this series, we
described how the framework could be
applied by grouping various elements into
defined areas of the framework. The
groupings were used to broadly
demonstrate the responsibility and
disciplines required of the people in the
organisation. The previous article explored
the relationship between the framework
and the concepts behind business planning.
The Extreme ArchitectureFramework and the UMLIn our discussion of the architecture
framework we have shown how the
framework can be used to classify the 18
architectural elements. We also described
how the architectural elements could be
described, using a variety of different
types of content. The content includes an
assessment of the current state of an
element; the vision for its future state;
potential risks and rewards associated
with the element; strategies to avoid risks
and realise rewards, or a fundamental
governing principles associated with the
element.
business and management
The eXtreme Architecture Process:Amplifying the UMLBy Phil Robinson, Lonsdale Systems, & Floris Gout, Independent Consultant
Fig. 1: Extreme Architecture Framework

24 Oracle Scene Issue 24 Winter 2005 / The UK Oracle User Group Journal /
The UML can be used to model systems
from two different perspectives:
• the structural perspective that
describes the relationship of individual
system elements to each other and how
they are organised into a system; and
• the behavioural perspective that
describes how individual system
elements interact with each other in
order to achieve the goals of the system.
The two perspectives are reflected in the
UML’s classification of diagrams. This is
shown in Figure 3 and Figure 4 below.
Structure diagrams show the static
structure of system elements [4].
Behaviour diagrams show the dynamic
behaviour of system elements [4].
Customising the UMLClassifying UML diagrams into structural
and behavioural categories is a useful way
to organise the UML’s specification.
However, the specification also states:
‘…this taxonomy provides a logical
organization for the various major kinds
of diagrams. However, it does not
preclude the mixing different kinds of
diagram types … the boundaries between
the various kinds of diagram types are not
strictly enforced... ’[4]
What this means, is that UML elements can
actually be combined on a single diagram in
any way that makes sense and does not
In this article, we are going to focus on
how the eighteen architectural elements
can be described using UML models.
The history and development of the UML is
well documented elsewhere so we shall not
repeat it here. Those seeking a good basic
introduction will find Martin Fowler’s book
The UML Distilled useful [2].
The starting point for our understanding
of how the UML can be used to model
architectural content is a statement in the
OMG’s UML Infrastructure Specification
Version 2.0:
‘the UML is a visual language for
specifying, constructing and documenting
the artefacts of systems’ [3].
Since the rows of our framework represent
different system types, the UML is perfect
for modelling our architectural elements.
The quote above also states that the UML
is a visual language. In common with all
languages, the UML has an underlying
vocabulary. In the case of the UML, its
vocabulary has been chosen so that the
language is suitable for describing systems
and the elements that they are composed
from. Because the UML is a visual
language, each of the system elements
has a unique graphical symbol.
Some examples of the UML’s vocabulary
and its graphical symbols are shown in
Figure 2 below.
Fig. 2: Examples of UML
Graphical Symbols
Fig. 3: Taxonomy of Structure Diagrams
Fig. 4: Taxonomy of Behaviour Diagrams
25/ The UK Oracle User Group Journal / Issue 24 Winter 2005 Oracle Scene
violate the underlying semantics of the
UML. For example, it is perfectly valid to
draw a single UML diagram that includes
both activities and use cases. The diagram
would be a useful way to depict a workflow.
In addition to allowing the creation of
custom diagrams, the UML has a number
of built-in features that allow the UML to
be customised by refining and extending
its vocabulary of system elements. The
main mechanisms for extending the UML
are:
• Stereotypes
• Tags
• Profiles.
Stereotypes allow users of the UML to
create their own, specialised versions of
the standard UML elements. Using
stereotypes, customised dialects of the
UML can be created. For example, the
UML symbols shown in Figure 2 include
an <<artifact>> stereotype element. This
element can be used to represent a system
development artefact such as a plan,
model, or specification. In addition to
allowing users of the UML to create their
own stereotypes, the UML includes a
number of pre-defined stereotypes.
Tags allow users of the UML to define
additional properties for the system
elements. For example, a UML Actor
element can be used to represent the user
of a software application. The following
UML tags might be added to an Actor
{department =Finance}, {minimum
experience=2 years} and {skill level=High}.
Profiles can be used to create customised
palettes of UML symbols. Profiles define
a consistent set of stereotype UML
elements (with tags if required) that can be
applied to a particular problem domain.
For example, there is a data modelling
profile for the UML that defines an
appropriate set of stereotypes for tables,
primary keys and foreign keys.
Modelling ArchitectureElements With the UMLWe will now take a brief tour of the UML
and describe how it can be used to model
each of the framework elements.
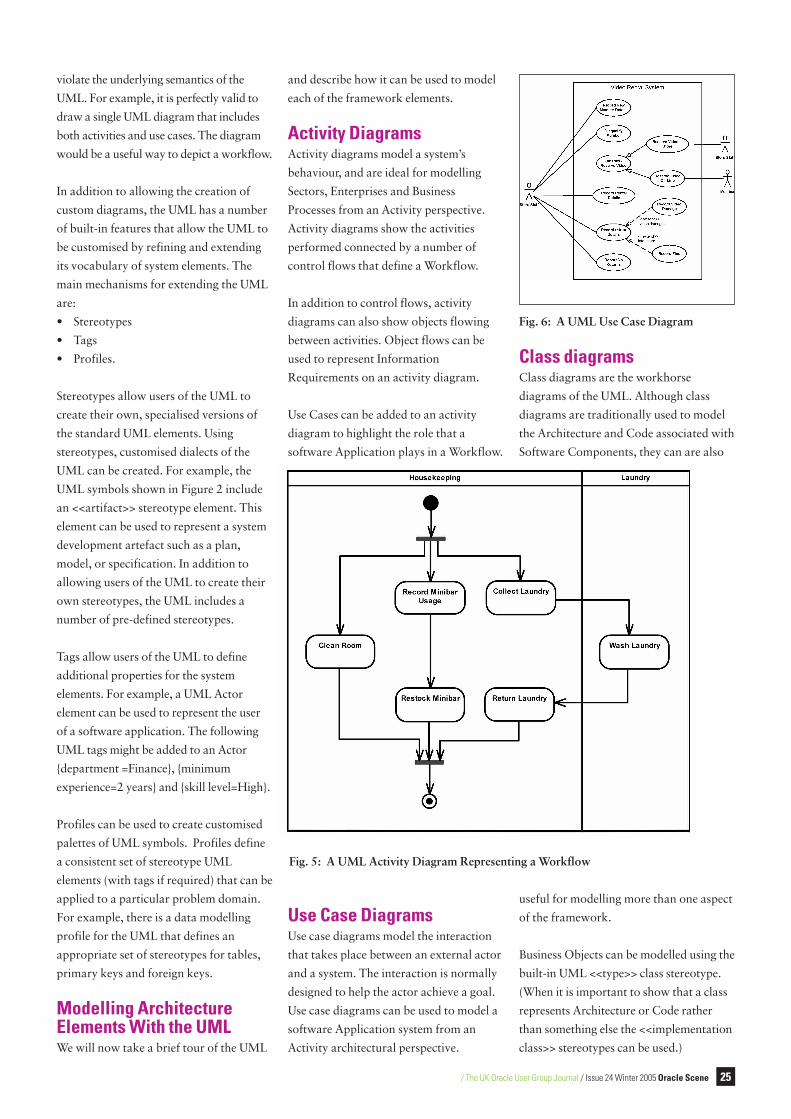
Activity DiagramsActivity diagrams model a system’s
behaviour, and are ideal for modelling
Sectors, Enterprises and Business
Processes from an Activity perspective.
Activity diagrams show the activities
performed connected by a number of
control flows that define a Workflow.
In addition to control flows, activity
diagrams can also show objects flowing
between activities. Object flows can be
used to represent Information
Requirements on an activity diagram.
Use Cases can be added to an activity
diagram to highlight the role that a
software Application plays in a Workflow.
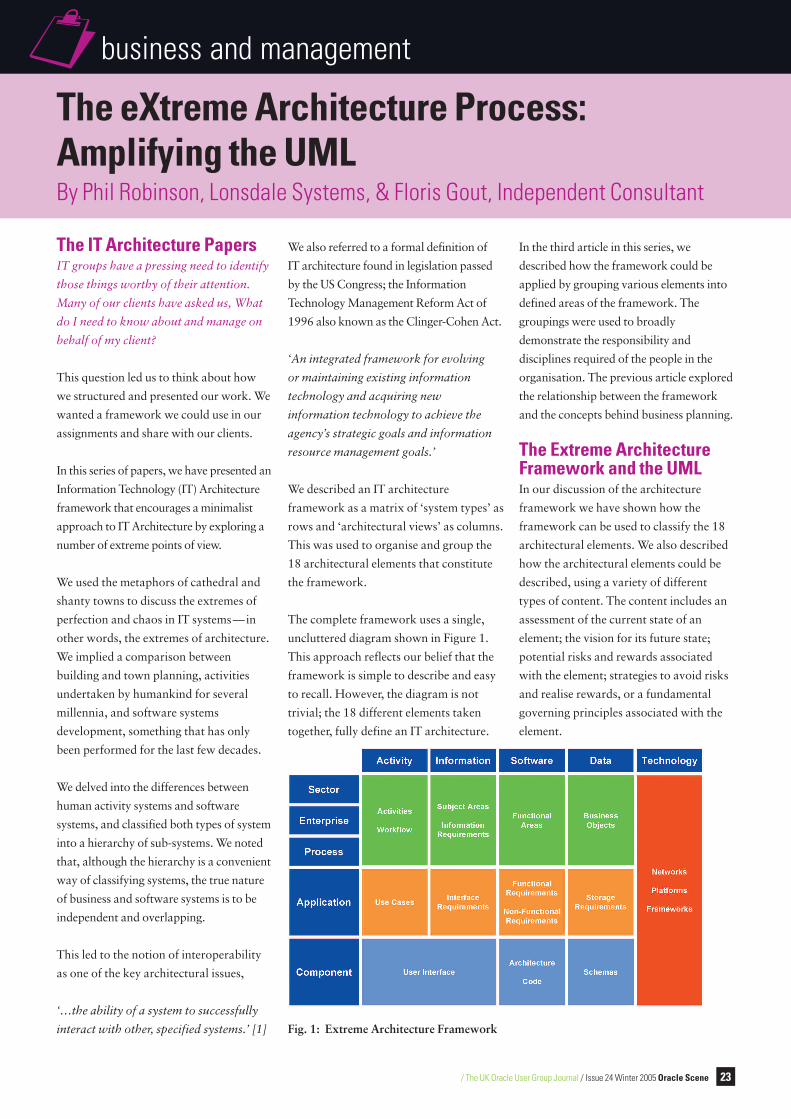
Use Case DiagramsUse case diagrams model the interaction
that takes place between an external actor
and a system. The interaction is normally
designed to help the actor achieve a goal.
Use case diagrams can be used to model a
software Application system from an
Activity architectural perspective.
Class diagramsClass diagrams are the workhorse
diagrams of the UML. Although class
diagrams are traditionally used to model
the Architecture and Code associated with
Software Components, they can are also
useful for modelling more than one aspect
of the framework.
Business Objects can be modelled using the
built-in UML <<type>> class stereotype.
(When it is important to show that a class
represents Architecture or Code rather
than something else the <<implementation
class>> stereotypes can be used.)
Fig. 5: A UML Activity Diagram Representing a Workflow
Fig. 6: A UML Use Case Diagram

26 Oracle Scene Issue 24 Winter 2005 / The UK Oracle User Group Journal /
Interface Requirements can be modelled
using the <<interface>> and <<signal>>
class stereotypes.
Storage Requirements can be modelled by
adding a persistence tag to a class. The
persistence tag describes what happens to
attribute values when Application fails, or
is powered down. The tag has two values:
• {persistence=transient} means that the
values of the attributes are lost; and
• {persistence=persistent} means that the
values of the attributes are retained.
When combined with the data modelling
profile, which defines <<table>>, <<pk>>
and <<fk>> stereotypes, class diagrams
can be used to model database Schemas.
Object diagramsObject diagrams are close cousins to class
diagrams. Class diagrams represent
system elements as abstract classes, while
object diagrams show the individual
objects belonging to the classes. Since an
object can represent almost anything, this
makes object diagrams one of the most
versatile of all of the UML diagrams.
This versatility is reflected in the ways in
which we can use object diagrams to
model the framework elements.
In addition to showing Information
Requirements as flows on activity
diagrams, the structural aspects of
Information Requirements can be modelled
with <<information requirement>>
stereotype objects on object diagrams.
Functional Requirements and Non-
Functional Requirements can also be
modelled using the appropriate stereotype
objects: <<functional requirement >> and
<<non-functional requirement >>.
User Interfaces can be modelled using
stereotype objects such as <<window>>,
<<dialogue>> <<report>> or <<button>>
to represent the visual components of the
user interface.
Package DiagramsPackages are used to organise and group
the other elements of the UML. Package
diagrams can show both the contents of
packages, and the relationship between
packages.
Stereotype packages <<subject area>> and
<<functional area>> can be used to
represent Subject Areas and Functional
Areas. Entire software Applications can
be represented using an <<application>>
stereotype package.
Package diagrams can also be used to
describe the overall Architecture of a
software Application.
Fig. 7: A UML Class Diagram
Fig. 8: A UML Object Diagram Used to Represent Information Requirements

27/ The UK Oracle User Group Journal / Issue 24 Winter 2005 Oracle Scene
Sequence diagramsSequence diagrams model the interactions
that take place between the internal
components of a system. While sequence
diagrams can be used to model any of the
systems represented by the rows of the
framework, their traditional use is to
model the interaction between software
Components.
Component diagramsComponent diagrams are used to model
the deployment of Components. They can
also be used to model the architectural
aspects of an Application. Frequently, the
architecture of an Application is based on
a Framework such as J2EE or .Net.
Stereotype components such as <<entity
bean>> or <<session bean>> can be used
to represent elements of the Framework.
Fig. 9: A UML Package Diagram Representing Functional Areas
Fig. 10: A UML Sequence Diagram Representing the Realisation of a Use Case

28 Oracle Scene Issue 24 Winter 2005 / The UK Oracle User Group Journal /
Deployment DiagramsDeployment diagrams are used to model
processing nodes. In terms of our
framework, these are the Platforms and
Networks. Deployment nodes can be
stereotypes such as <<router>>,
<<switch>> or <<server>>. The UML also
permits a specific visual icon to be
associated with stereotypes. This means
that the familiar symbols found on
network diagrams can be used without
stepping outside of the UML.
It is also possible to show how
Components are deployed onto
processing nodes by including them
within the node symbol.
ConclusionThe Extreme Architecture Framework
does not define a vocabulary for
describing architectural elements. This is
left to the user of the framework. A
variety of approaches can be used,
depending on the modelling paradigm or
standard that best suits the user of the
framework.
In this paper we have shown how the
UML is a good choice as a visual language
for modelling the architectural elements.
About the AuthorsPhil Robinson and Floris Gout have
consulted for a number of organisations
and across a range of industry sectors.
They have worked together on various IT-
related planning projects. This series of
papers represents a major collaborative
effort, that organises not just the ideas of
the two authors, but also the many
inspiring people they have worked with.
Fig. 11: A UML Deployment Diagram Representing Platforms, Networks and Components
www.ukoug.org