Embed Size (px)
Citation preview

THE EXPRESSIVE POWER OF
PROGRAMMING LANGUAGES IN ARCHITECTURE
Maria João de Maya Gomes Cunha e Sammer
Thesis to obtain the Master of Science Degree in
ARCHITECTURE
Supervisor: Prof. Dr. António Paulo Teles de Menezes Correia Leitão
Co-supervisor: Prof. Dr. Miguel José Das Neves Pires Amado
EXAMINATION COMMITTEE
Chairperson: Prof. Dr. Manuel de Arriaga Brito Correia Guedes
Supervisor: Prof. Dr. António Paulo Teles de Menezes Correia Leitão
Member of the Committee: Prof. Dr. Francisco Manuel Caldeira Pinto Teixeira Bastos
May 2019


Declaração
Venho por este meio declarar que este documento é um trabalho original da minha autoria e que cumpre
todos os requerimentos do Código de Conduta e Boas Práticas da Universidade de Lisboa.
Declaration
I hereby declare that this document is an original work of my own authorship and that it fulfills all the
requirements of the Code of Conduct and Good Practices of the Universidade de Lisboa.


i
Agradecimentos
Dedico este trabalho à minha mãe, para quem também vai o primeiro e mais especial agradecimento. Pelo
teu apoio incondicional, pela tua força e motivação constantes, por todos os apertões e abanões que me
impediram de algum dia sequer pensar em desistir. A tudo te devo. Obrigada, mãe.
Agradeço também à minha irmã Constança, ao meu irmão Zé Maria e à minha família por serem a
segunda frente nesta batalha. Não vos sei dizer quantas foram as vezes que me ajudaram sem saberem.
Obrigada, família.
Um especial, ainda que insuficiente, agradecimento ao professor António Menezes Leitão. Primeiro,
pelo convite para integrar a sua equipa quando eu não sabia para que lado me virar. Segundo, por me ter
confiado um desafio que me fez sair da minha zona de conforto e evoluir enquanto aluna, investigadora e
pessoa. E, por fim, pelo seu apoio incondicional, persistência, paciência e dedicação. Esta tese começou
por ser um acaso e, agora que terminou, digo que foi um acaso feliz. E muito lhe devo. Obrigada, professor.
Agradeço também professor Miguel Amado pela sua coorientação e por me ter guiado numa melhor
contextualização deste trabalho.
A todos os meus mais queridos amigos que se importaram, interessaram e implicaram neste processo
com compreensão, carinho e muito apoio e força, obrigada. Bárbara, Constança, Gil, Pedro, obrigada.
E, finalmente, gostava de agradecer ao grupo de investigação ADA por ter tornado esta experiência
académica obrigatória em algo mais leve do que o peso que lhe tinha atribuído inicialmente. Pelos
conselhos, apoio, ajuda, boa disposição e muita (muita) paciência. Por se terem tornado num novo grupo
de amigos, bons amigos, com alguns dos quais pude partilhar aventuras maiores nos entretantos. Aos que
já foram embora, aos que sempre ficaram e aos que chegaram entretanto. Obrigada, ADA.
Esta tese foi suportada parcialmente por fundos nacionais através da Fundação para a Ciência e a
Tecnologia (FCT), UID/CEC/50021/2019, e pelo projeto Khepri, PTDC/ART-DAQ/31061/2017.
Contributions
During the development of this thesis, two scientific papers were published:
• Sammer, M., Leitão, A., & Caetano, I. (2019). From Visual Input to Visual Output in Textual
Programming. Intelligent & Informed: Proceedings of the 24th International Conference of the
Association for Computer-Aided Architectural Design Research in Asia (CAADRIA), Wellington,
New Zealand, pp. 645-654.
Best Paper Award CAADRIA 2019
• Sammer, M., & Leitão, A. (2019). Visual Input Mechanisms in Textual Programming for
Architecture. Architecture in the Age of the 4th Revolution: Proceedings of the 37th International
Conference on Education and research in Computer Aided Architectural Design in Europe
(eCAADe), Porto, Portugal, to appear.

ii
Abstract
We are living in an era where Architecture is caught between arts and technicalities, creativity and physics,
between hand-drawing and computing.
Algorithmic Design (AD), i.e., the use of algorithms to produce designs, is no longer a novelty in
the architectural practice. This has led to several international debates and even generated divergences
between professionals but, nonetheless, it is something that has already been built in Architecture, showing
clear evidence of rapid development.
Around the world, architectural studios have already adopted algorithmic and parametric approaches
to create three-dimensional virtual models of their projects, either generated in Computer-Aided Design
(CAD) tools, Building Information Modeling (BIM) tools, or both. Many of them even use this
methodology to assess these models through computational analysis, using a wide range of software that
covers different fields: thermal, structural, lighting, acoustics, among others.
AD requires programming, which can be achieved in two different ways, namely, using a Visual
Programming Language (VPL) or a Textual Programming Language (TPL). Despite being recognized as
more difficult to use and maintain for complex programs, VPLs are the clear preference of the majority of
architects that are also AD practitioners.
Nevertheless, an in-depth understanding of this phenomenon is missing. While it is true that VPLs,
such as Grasshopper, are more intuitive, faster to use, and easier to structure and learn, it is also true that
the expressive power of their abstractions is limiting, and the languages do not scale with the complexity
of the projects. On the other hand, TPLs, such as Python, are more demanding in terms of learning and
practice but have more expressive power, flexibility, and efficiency, also enabling a better collaboration
between different parts implicated in the writing of the same script.
It is this deeper and more complete understanding of the expressive power of programming
languages used in architecture that we propose to accomplish with the development of this thesis.
Keywords: Algorithmic Design, Programming Languages, Textual Programming Languages, Visual
Programming Languages, Grasshopper, Python.

iii
Resumo
Vivemos presentemente numa época em que a Arquitetura se equilibra entre a arte e a técnica, a criatividade
e as leis da física, entre o desenho num papel e o desenho num computador.
O recurso ao Design Algorítmico (DA), i.e., o uso de algoritmos para produzir modelos, já não é
uma novidade na prática da Arquitetura. Esta situação tem vindo a promover inúmeros debates
internacionais e inclusivamente a gerar divergências entre profissionais, mas, ainda assim, é algo que já se
instalou na prática da disciplina e que mostra claros indícios de um rápido desenvolvimento.
Muitos ateliers de arquitetura em todo o mundo já adotaram abordagens algorítmicas e paramétricas
para criar modelos virtuais tridimensionais dos seus projetos, gerados em ferramentas de CAD (Computer-
Aided Design), em ferramentas de BIM (Building Information Modeling) ou em ambas. Ademais, muitos
deles recorrem a esta metodologia para avaliar estes modelos através de análises computacionais, usando
um vasto leque de software disponível que cobre diferentes áreas: térmica, estrutural, iluminação, acústica,
entre outras.
O DA requer programação, que pode ser concretizada de duas formas distintas, nomeadamente,
usando uma Linguagem de Programação Visual (LPV) ou uma Linguagem de Programação Textual (LPT).
Apesar de serem reconhecidas como mais difíceis de utilizar e manter para programas complexos, as LPVs
são claramente a preferência da maioria dos arquitetos que são também profissionais de DA.
Apesar disso, falta correntemente uma compreensão mais aprofundada deste fenómeno. Enquanto é
verdade que as LPVs, como o Grasshopper, são mais intuitivas, mais rápidas de se usar e mais fáceis de
aprender, também é verdade que o poder expressivo das suas abstrações é limitativo, pelo que as linguagens
não escalam com a complexidade dos programas que definem. Por outro lado, as LPTs, como o Python,
são mais exigentes no que toca à aprendizagem e prática, mas têm um maior poder expressivo, flexibilidade
e eficiência, permitindo ainda uma melhor colaboração entre as diferentes partes implicadas na escrita de
um mesmo programa.
É este entendimento mais aprofundado sobre o poder expressivo das linguagens de programação
usadas em Arquitectura que propomos adquirir com o desenvolvimento desta tese.
Palavras-chave: Design Algorítmico, Linguagens de Programação, Linguagens de Programação Textual,
Linguagens de Programação Visual, Grasshopper, Python.

iv
Contents
List of Figures . . . . . . . . . . . . . . . . . . . . . . . . . . . . . . . . . . . . . . . . . . . . . . . . . . . . . . . . . . . . . . . . . . . . . . . . . . . . . page vi
List of Tables and Charts . . . . . . . . . . . . . . . . . . . . . . . . . . . . . . . . . . . . . . . . . . . . . . . . . . . . . . . . . . . . . . . . . . . . page xv
Abbreviations . . . . . . . . . . . . . . . . . . . . . . . . . . . . . . . . . . . . . . . . . . . . . . . . . . . . . . . . . . . . . . . . . . . . . . . . . . . . page xvi
Glossary of Terms . . . . . . . . . . . . . . . . . . . . . . . . . . . . . . . . . . . . . . . . . . . . . . . . . . . . . . . . . . . . . . . . . . . . . . . . page xvii
1. Introduction . . . . . . . . . . . . . . . . . . . . . . . . . . . . . . . . . . . . . . . . . . . . . . . . . . . . . . . . . . . . . . . . . . . . . . . . . . . . page 1
1.1. Framework . . . . . . . . . . . . . . . . . . . . . . . . . . . . . . . . . . . . . . . . . . . . . . . . . . . . . . . . . . . . . . . . . . . . page 1
1.2. Motivation . . . . . . . . . . . . . . . . . . . . . . . . . . . . . . . . . . . . . . . . . . . . . . . . . . . . . . . . . . . . . . . . . . . . page 4
1.3. Objectives . . . . . . . . . . . . . . . . . . . . . . . . . . . . . . . . . . . . . . . . . . . . . . . . . . . . . . . . . . . . . . . . . . . . . page 4
1.4. Methodology . . . . . . . . . . . . . . . . . . . . . . . . . . . . . . . . . . . . . . . . . . . . . . . . . . . . . . . . . . . . . . . . . . . page 5
1.5. Structure . . . . . . . . . . . . . . . . . . . . . . . . . . . . . . . . . . . . . . . . . . . . . . . . . . . . . . . . . . . . . . . . . . . . . . page 6
2. State-of-the-Art . . . . . . . . . . . . . . . . . . . . . . . . . . . . . . . . . . . . . . . . . . . . . . . . . . . . . . . . . . . . . . . . . . . . . . . . . page 9
2.1. Representation Methods . . . . . . . . . . . . . . . . . . . . . . . . . . . . . . . . . . . . . . . . . . . . . . . . . . . . . . . . . . page 9
2.2. Algorithmic Design in Architecture . . . . . . . . . . . . . . . . . . . . . . . . . . . . . . . . . . . . . . . . . . . . . . . . page 15
2.3. Programming Languages . . . . . . . . . . . . . . . . . . . . . . . . . . . . . . . . . . . . . . . . . . . . . . . . . . . . . . . . . page 17
2.3.1. Visual Programming Languages . . . . . . . . . . . . . . . . . . . . . . . . . . . . . . . . . . . . . . . . . page 18
2.3.1.1. Grasshopper . . . . . . . . . . . . . . . . . . . . . . . . . . . . . . . . . . . . . . . . . . . . . . . . page 19
2.3.1.2. Dynamo . . . . . . . . . . . . . . . . . . . . . . . . . . . . . . . . . . . . . . . . . . . . . . . . . . . page 19
2.3.2. Textual Programming Languages . . . . . . . . . . . . . . . . . . . . . . . . . . . . . . . . . . . . . . . . . page 20
2.3.2.1. Python . . . . . . . . . . . . . . . . . . . . . . . . . . . . . . . . . . . . . . . . . . . . . . . . . . . . page 20
2.3.2.2. Julia . . . . . . . . . . . . . . . . . . . . . . . . . . . . . . . . . . . . . . . . . . . . . . . . . . . . . . page 21
2.4. Tools, Libraries, and Programming Environments . . . . . . . . . . . . . . . . . . . . . . . . . . . . . . . . . . . . . page 21
2.4.1. Grasshopper Plug-ins . . . . . . . . . . . . . . . . . . . . . . . . . . . . . . . . . . . . . . . . . . . . . . . . . . page 21
2.4.2. Rosetta . . . . . . . . . . . . . . . . . . . . . . . . . . . . . . . . . . . . . . . . . . . . . . . . . . . . . . . . . . . . . page 22
2.4.3. Khepri . . . . . . . . . . . . . . . . . . . . . . . . . . . . . . . . . . . . . . . . . . . . . . . . . . . . . . . . . . . . . . page 23
2.5. Programming Languages Applied to Architecture . . . . . . . . . . . . . . . . . . . . . . . . . . . . . . . . . . . . . page 23
2.5.1. NBBJ . . . . . . . . . . . . . . . . . . . . . . . . . . . . . . . . . . . . . . . . . . . . . . . . . . . . . . . . . . . . . . page 27
2.5.2. Zaha Hadid Architects . . . . . . . . . . . . . . . . . . . . . . . . . . . . . . . . . . . . . . . . . . . . . . . . . page 28
2.5.3. Gehry and Associates . . . . . . . . . . . . . . . . . . . . . . . . . . . . . . . . . . . . . . . . . . . . . . . . . . page 29
2.5.4. Foster + Partners . . . . . . . . . . . . . . . . . . . . . . . . . . . . . . . . . . . . . . . . . . . . . . . . . . . . . page 30
2.5.5. UNStudio . . . . . . . . . . . . . . . . . . . . . . . . . . . . . . . . . . . . . . . . . . . . . . . . . . . . . . . . . . . page 31
3. Characterization of Programming Languages in Architecture . . . . . . . . . . . . . . . . . . . . . . . . . . . . . . . . . . page 33
3.1. Computational Power . . . . . . . . . . . . . . . . . . . . . . . . . . . . . . . . . . . . . . . . . . . . . . . . . . . . . . . . . . . page 33
3.2. Performance . . . . . . . . . . . . . . . . . . . . . . . . . . . . . . . . . . . . . . . . . . . . . . . . . . . . . . . . . . . . . . . . . . page 33
3.3. Expressive Power . . . . . . . . . . . . . . . . . . . . . . . . . . . . . . . . . . . . . . . . . . . . . . . . . . . . . . . . . . . . . . page 34
3.4. User Interface Features . . . . . . . . . . . . . . . . . . . . . . . . . . . . . . . . . . . . . . . . . . . . . . . . . . . . . . . . . . page 35
3.5. Limit of Complexity . . . . . . . . . . . . . . . . . . . . . . . . . . . . . . . . . . . . . . . . . . . . . . . . . . . . . . . . . . . . page 36
4. Comparative Study between a VPL and a TPL . . . . . . . . . . . . . . . . . . . . . . . . . . . . . . . . . . . . . . . . . . . . . . page 37
4.1. Theoretical Comparison . . . . . . . . . . . . . . . . . . . . . . . . . . . . . . . . . . . . . . . . . . . . . . . . . . . . . . . . . page 37
4.1.1. Abstraction Mechanisms . . . . . . . . . . . . . . . . . . . . . . . . . . . . . . . . . . . . . . . . . . . . . . . page 37
4.1.2. Number Sliders and Boolean Toggles . . . . . . . . . . . . . . . . . . . . . . . . . . . . . . . . . . . . . page 38
4.1.3. Immediate Feedback . . . . . . . . . . . . . . . . . . . . . . . . . . . . . . . . . . . . . . . . . . . . . . . . . . page 38
v
4.1.4. Traceability . . . . . . . . . . . . . . . . . . . . . . . . . . . . . . . . . . . . . . . . . . . . . . . . . . . . . . . . . . page 39
4.1.5. Recursion. . . . . . . . . . . . . . . . . . . . . . . . . . . . . . . . . . . . . . . . . . . . . . . . . . . . . . . . . . . page 39
4.1.6. Visual Input Mechanisms . . . . . . . . . . . . . . . . . . . . . . . . . . . . . . . . . . . . . . . . . . . . . . . page 40
4.1.7. Textual Programming . . . . . . . . . . . . . . . . . . . . . . . . . . . . . . . . . . . . . . . . . . . . . . . . . . page 40
4.1.8. Portability . . . . . . . . . . . . . . . . . . . . . . . . . . . . . . . . . . . . . . . . . . . . . . . . . . . . . . . . . . . page 41
4.1.9. Conclusions . . . . . . . . . . . . . . . . . . . . . . . . . . . . . . . . . . . . . . . . . . . . . . . . . . . . . . . . . page 41
4.2. Practical Comparison . . . . . . . . . . . . . . . . . . . . . . . . . . . . . . . . . . . . . . . . . . . . . . . . . . . . . . . . . . . page 42
4.2.1. Series . . . . . . . . . . . . . . . . . . . . . . . . . . . . . . . . . . . . . . . . . . . . . . . . . . . . . . . . . . . . . . page 43
4.2.2. Cross Reference . . . . . . . . . . . . . . . . . . . . . . . . . . . . . . . . . . . . . . . . . . . . . . . . . . . . . . page 44
4.2.3. Mapping and Remapping . . . . . . . . . . . . . . . . . . . . . . . . . . . . . . . . . . . . . . . . . . . . . . . page 45
4.2.4. Cull Pattern . . . . . . . . . . . . . . . . . . . . . . . . . . . . . . . . . . . . . . . . . . . . . . . . . . . . . . . . . . page 46
4.2.5. Basic 3D Geometry and Boolean Operations . . . . . . . . . . . . . . . . . . . . . . . . . . . . . . . . page 46
4.2.6. Visual Input Mechanisms . . . . . . . . . . . . . . . . . . . . . . . . . . . . . . . . . . . . . . . . . . . . . . . page 47
4.2.7. Attractor Mechanisms . . . . . . . . . . . . . . . . . . . . . . . . . . . . . . . . . . . . . . . . . . . . . . . . . page 48
4.2.8. Spaceframes . . . . . . . . . . . . . . . . . . . . . . . . . . . . . . . . . . . . . . . . . . . . . . . . . . . . . . . . . page 49
4.2.9. Paneling . . . . . . . . . . . . . . . . . . . . . . . . . . . . . . . . . . . . . . . . . . . . . . . . . . . . . . . . . . . . page 51
4.2.10. Brick Wall . . . . . . . . . . . . . . . . . . . . . . . . . . . . . . . . . . . . . . . . . . . . . . . . . . . . . . . . . . page 53
4.2.11. Pixel Mapping . . . . . . . . . . . . . . . . . . . . . . . . . . . . . . . . . . . . . . . . . . . . . . . . . . . . . . page 54
4.2.12. BIM Paradigm . . . . . . . . . . . . . . . . . . . . . . . . . . . . . . . . . . . . . . . . . . . . . . . . . . . . . . page 56
4.2.13. Analysis Tools and Plug-ins . . . . . . . . . . . . . . . . . . . . . . . . . . . . . . . . . . . . . . . . . . . . page 57
4.2.14. Conclusions . . . . . . . . . . . . . . . . . . . . . . . . . . . . . . . . . . . . . . . . . . . . . . . . . . . . . . . . page 58
5. Guidelines . . . . . . . . . . . . . . . . . . . . . . . . . . . . . . . . . . . . . . . . . . . . . . . . . . . . . . . . . . . . . . . . . . . . . . . . . . . . . page 63
5.1. Guidelines for choosing what approach to use . . . . . . . . . . . . . . . . . . . . . . . . . . . . . . . . . . . . . . . . page 63
5.2. Guidelines for future implementations in VPLs and TPLs . . . . . . . . . . . . . . . . . . . . . . . . . . . . . . . page 68
6. Conclusion . . . . . . . . . . . . . . . . . . . . . . . . . . . . . . . . . . . . . . . . . . . . . . . . . . . . . . . . . . . . . . . . . . . . . . . . . . . . . page 71
6.1 Reflections . . . . . . . . . . . . . . . . . . . . . . . . . . . . . . . . . . . . . . . . . . . . . . . . . . . . . . . . . . . . . . . . . . . . page 71
6.2. Future Work . . . . . . . . . . . . . . . . . . . . . . . . . . . . . . . . . . . . . . . . . . . . . . . . . . . . . . . . . . . . . . . . . . page 79
References . . . . . . . . . . . . . . . . . . . . . . . . . . . . . . . . . . . . . . . . . . . . . . . . . . . . . . . . . . . . . . . . . . . . . . . . . . . . . . . page 83

vi
List of Figures
1. INTRODUCTION
Figure 1.1. Hand-drawing (above) and technical drawing (below) of Swimming Pools in Leça da Palmeira by
Álvaro Siza Vieira, Portugal, 1967.
Source: https://portuguesearchitectures.wordpress.com/2014/05/20/piscinas-de-leca-de-palmeira-alvaro-siza-vieira/
1
Figure 1.2. Digital environment of a CAD tool, AutoCAD.
Source: Castelo Branco, 2017.
1
Figure 1.3. Digital environment of a BIM tool, ArchiCAD.
Source: Castelo Branco, 2017.
1
Figure 1.4. Façade of the MCM Building by The_System Lab, Seoul, Republic of Korea, unknown date.
Source: https://curlytraveller.com/2014/05/a-walk-through-trendy-garuso-gil.html
2
Figure 1.5. Phoenix International Media Center by BIAD UFo, Beijing, China, 2016.
Source: https://biad-ufo.divisare.pro/projects/275852-phoenix-international-media-center
2
Figure 1.6. Proposal for the Port Authority Bus Terminal by Archilier Architecture, New York City, USA, 2016.
Source: http://archilier.com/projects/port-authority-bus-terminal/
2
Figure 1.7. Serpentine Pavilion by BIG Architecture, London, United Kingdom, 2016.
Source: https://big.dk/#projects-serp
2
Figure 1.8. Projects modeled in Grasshopper (left), a VPL for Rhino, and in Dynamo (right) a VPL for Revit.
Source (left): Frame from an online tutorial at: https://www.youtube.com/watch?v=oCfpy8gdATo
Source (right): http://buildz.blogspot.com/2013/06/dynamo-update-040.html
3
Figure 1.9. Portion of a complex project modeled in Grasshopper.
Source: http://rhinocentre.blogspot.com/
3
Figure 1.10. Project modeled in Python, a TPL, and visualized in AutoCAD.
Source: own authorship.
3
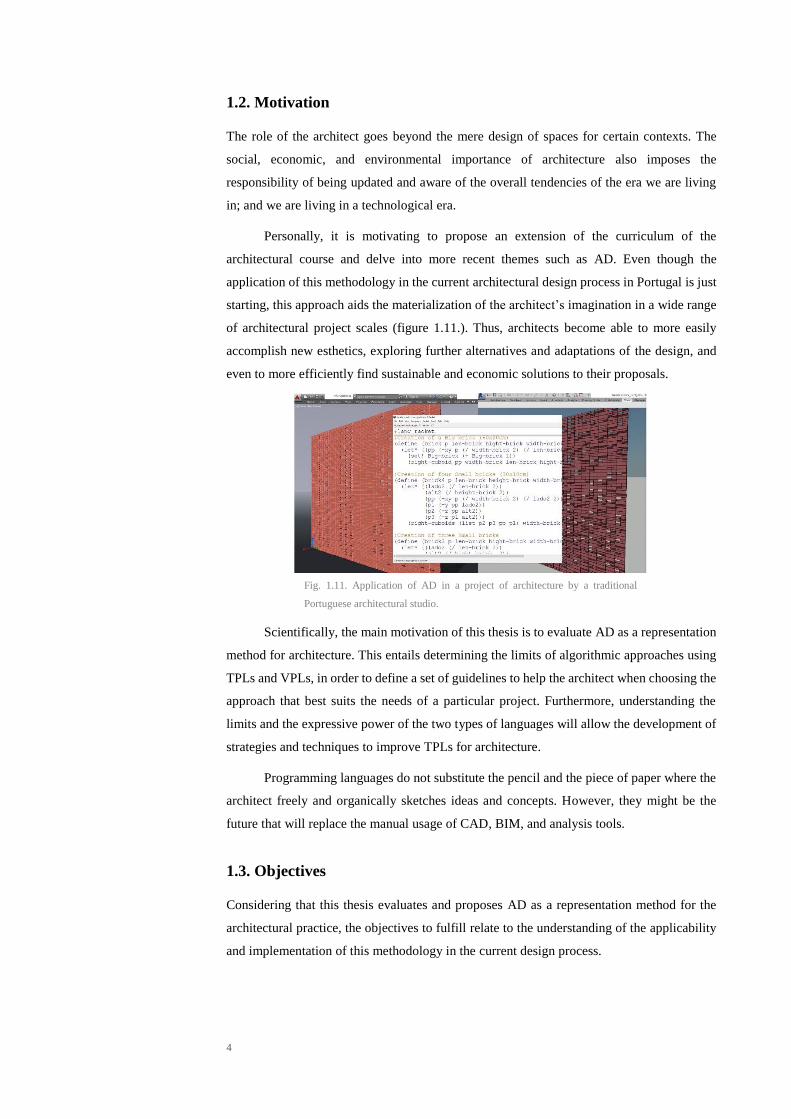
Figure 1.11. Application of AD in a project of architecture by a traditional Portuguese architectural studio.
Source: Caetano & Leitão, 2017.
4
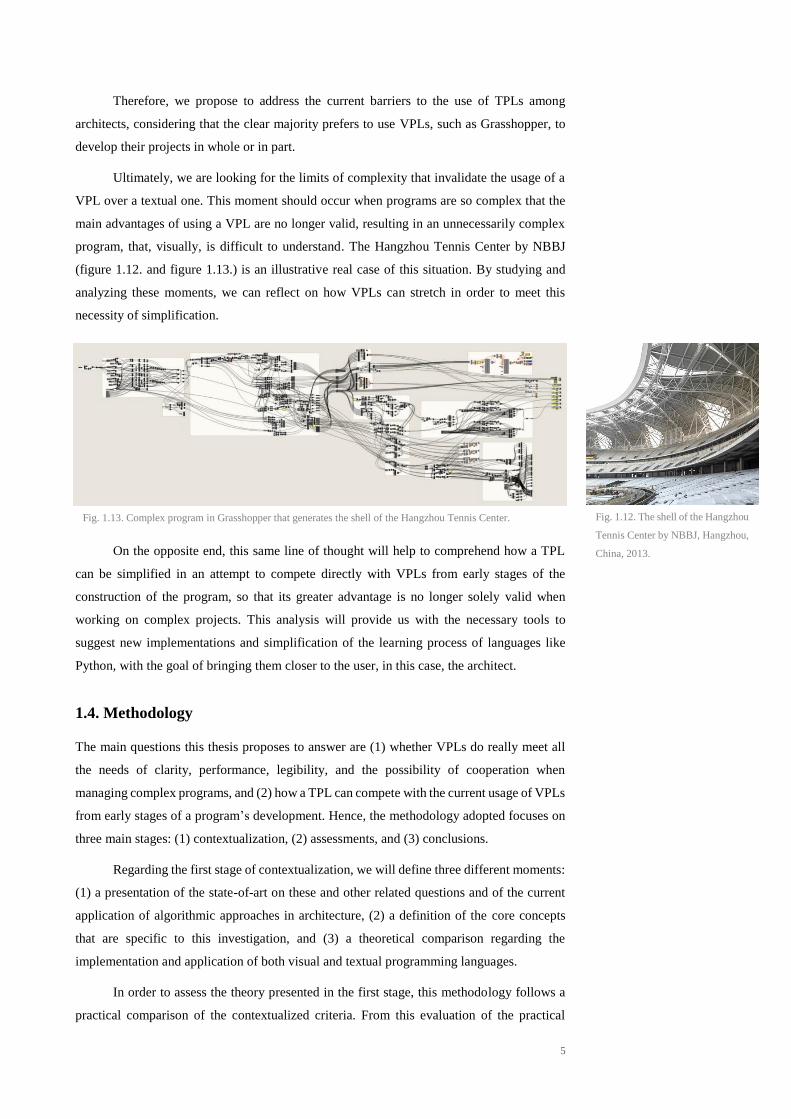
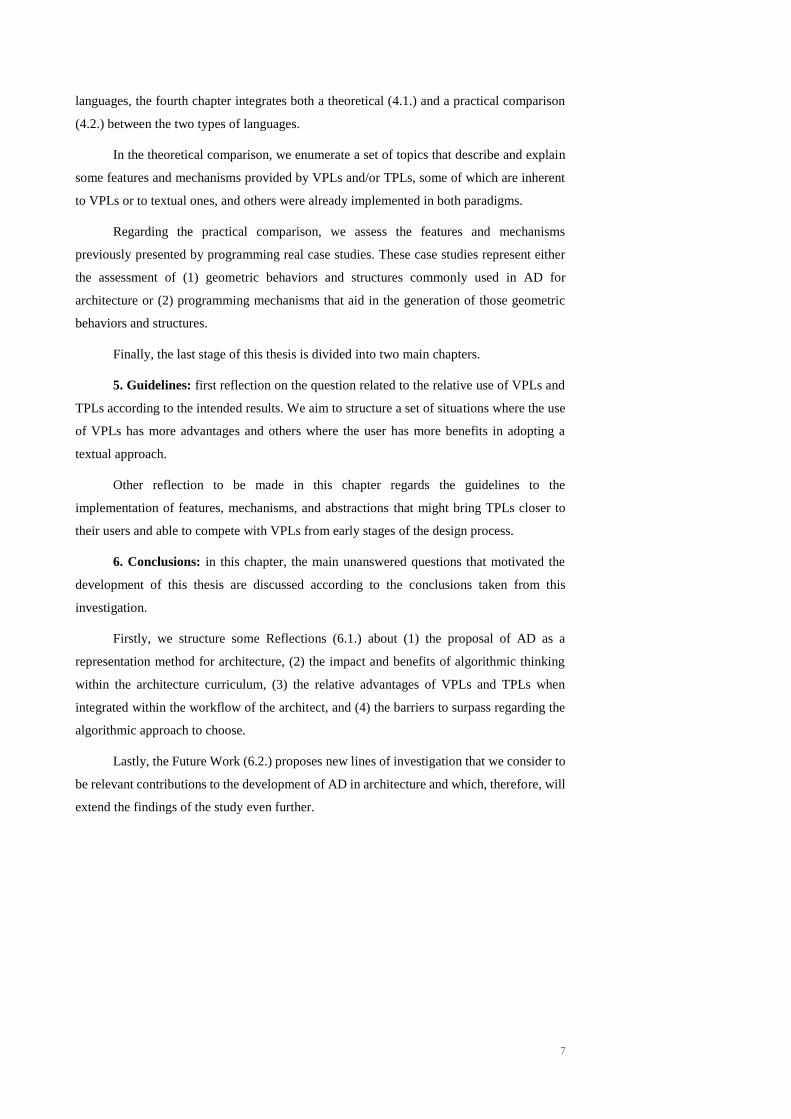
Figure 1.12. The shell of the Hangzhou Tennis Center by NBBJ, Hangzhou, China, 2013.
Source: https://www.arch2o.com/case-study-computational-design-hangzhou-tennis-center/
5
Figure 1.13. Complex program in Grasshopper that generates the shell of the Hangzhou Tennis Center.
Source: Miller, 2011.
5
2. STATE-OF-THE-ART
Figure 2.1. Plan of a temple in the Gudea Diorite Sculpture, Mesopotamian period, 2120 b. C., Louvre Museum,
Paris, France.
Source: https://arthistoryproject.com/timeline/the-ancient-world/mesopotamia/gudea-diorite-sculpture/
9
Figure 2.2. Plan of an ancient Roman City.
Source: https://isabelceron.wordpress.com/2011/10/08/equity-in-the-city-1-three-lessons-from-the-ancient-roman-metropolis/
9

vii
Figure 2.3. The frontispiece of the second edition of the De Architectura Libri Decem edited by Perrault,
published in 1684.
Source: http://architectura.cesr.univ-tours.fr/Traite/Notice/B250566101_11604.asp
9
Figure 2.4. Illustration of the Doric Order of the 1684 edition of Vitruvius’ De Architectura.
Source: http://architectura.cesr.univ-tours.fr/Traite/Notice/B250566101_11604.asp
10
Figure 2.5. Borromini (17th century, Rome) where the narrowing of the floor, ceiling, and lateral walls give the
perspectival illusion of a longer corridor.
Source: http://www.didatticarte.it/Blog/?p=2144
10
Figure 2.6. Antoni Gaudí’s hanging chain models, 1889.
Source: http://dataphys.org/list/gaudis-hanging-chain-models/
10
Figure 2.7. Model and plans of Moretti’s parametric stadium, from the 1960 Parametric Architecture exhibition at
12th Milan Triennial.
Source: Davis, 2013.
11
Figure 2.8. Ivan Sutherland demonstrating the use of Sketchpad.
Source: http://history-computer.com/ModernComputer/Software/Sketchpad.html
11
Figure 2.9. Before (above) and after (below) applying design constraints to a graphical object in Sketchpad.
Source: http://www.madlab.cc/after-50-years-of-computer-aided-design/
11
Figure 2.10. The first version of AutoCAD released in 1982.
Source: https://www.archdaily.co/co/02-135981/autocad-cumple-30-anos-en-el-mercado
12
Figure 2.11. Illustration of a Constructive Solid Modeling process.
Source: https://fr.m.wikipedia.org/wiki/Fichier:Csg_tree.png
12
Figure 2.12. Coordinated views in current Revit, a BIM tool for architecture.
Source: https://www.cadstudio.cz/revitlt
12
Figure 2.13. ArchiCAD 2 version, released in 1986.
Source: https://blog.graphisoftus.com/archicad-user/project-migration-and-old-versions-of-archicad
13
Figure 2.14. Typical model in an early Pro/ENGINEER version.
Source: Weisberg, 2008.
13
Figure 2.15. Technical rendered section modeled in Revit.
Source: http://revit-detail.blogspot.com/2010/04/051-concrete-cast-insitu-element.html
13
Figure 2.16. Visualization of the structural analysis of a building.
Source: https://agetintopc.com/pt/autodesk-robot-structural-analysis-pro-2014-free-download/
14
Figure 2.17. Render of the interior of Morpheus Hotel, programmed in Grasshopper (left), and a recent picture of
the built result (right).
Source (left): http://www.macaubusiness.com/macau-interview-melco-morpheus-a-new-era-for-macau-belongs-the-city/
Source (right): http://www.zaha-hadid.com/architecture/city-of-dreams-hotel-tower-cotai-macau/
14
Figure 2.18. 3D rendered section of the Elbphilharmonie by Herzog & de Meuron, Hamburg, Germany, 2016.
Source: https://www.wallpaper.com/architecture/elbphilharmonie-concert-hall-herzog-and-de-meuron-opens-in-hamburg
14

viii
Figure 2.19. Design process – from sketches and physical models to computational analysis, rendering, and
construction – of the Swiss Re by Foster and Partners, London, UK, 2004.
Source (hand-drawing): https://en.wikiarquitectura.com/building/30-st-mary-axe-the-gherkin/
Source (physical models, analysis): https://www.archdaily.com/447205/the-gherkin-how-london-s-famous-tower-leveraged-risk-
and-became-an-icon-part-2
Source (render): http://davidhannafordmitchell.tumblr.com/
Source (photograph): https://mattjohnsonarchitecture.wordpress.com/2014/09/25/passive-and-active-design-in-the-swiss-re-
tower/
15
Figure 2.20. Exercise of surface mapping developed by students using a textual approach to AD.
Source: Leitão, 2013.
16
Figure 2.21. Design process and materialization of a student’s project on Islamic patterns using a visual approach
to AD.
Source: Agirbas, 2017.
16
Figure 2.22. Parametric model of Kartal-Pendik Masterplan by Zaha Hadid Architects, Istanbul, Turkey, 2006.
Source: Schumacher, 2009.
17
Figure 2.23. Images of an IBM 704 mainframe computer created in 1954.
Source: https://en.wikipedia.org/wiki/IBM_704
18
Figure 2.24. Different groups at the NATO Software Engineering Conference, Garmisch, Germany, 7th-11th of
October of 1968.
Source: http://homepages.cs.ncl.ac.uk/brian.randell/NATO/N1968/index.html
18
Figure 2.25. Programming environment using a VPL.
Source: own authorship.
18
Figure 2.26. Work environment using Grasshopper associated with Rhino.
Source: https://www.arch2o.com/10-parametric-plugins-every-architect-should-know/
19
Figure 2.27. Work environment using Dynamo associated with Revit.
Source: http://www.theprovingground.org/2013/07/autodesk-edu-videos-computational.html
20
Figure 2.28. Programming environment using Python, a TPL, associated with AutoCAD.
Source: own authorship.
20
Figure 2.29. Plug-ins for Grasshopper that connect it to analysis tools (left) and modeling tools (right).
Source: own authorship.
21
Figure 2.30. Structural analysis using Karamba3D.
Source: https://www.food4rhino.com/app/karamba3d
21
Figure 2.31. Wind analysis using SWIFT.
Source: https://www.food4rhino.com/app/swift
21
Figure 2.32. Front-ends (on the left) and back-ends (on the right) of Rosetta.
Source: own authorship.
22
Figure 2.33. Visualization of a light analysis using Rosetta’s back-end to connect with Radiance, in Rhino (top)
and AutoCAD (bottom).
Source: Leitão, Castelo Branco, & Cardoso, 2017.
22
Figure 2.34. Light analysis using the Diva-for-Rhino plug-in for Grasshopper (left) and using Rosetta’s back-end
connection with Radiance (right).
Source: Leitão, Castelo Branco, & Cardoso, 2017.
23

ix
Figure 2.35. Use of the results of the light analysis to inform the design.
Source: Castelo Branco & Leitão, 2017.
23
Figure 2.36. Design process of the dome of the Reichstag, the New German Parliament, by Foster and Partners,
Berlin, Germany, 1999.
Source: https://blog.quintinlake.com/tag/berlin/
23
Figure 2.37. Design variations of the elements of a façade.
Source: Cardoso, 2017.
24
Figure 2.38. Traceability in Grasshopper.
Source: own authorship.
25
Figure 2.39. Immediate feedback in Grasshopper.
Source: own authorship.
25
Figure 2.40. Color mapping in Grasshopper using visual gradients.
Source: https://softlabnyc.com/2015/01/01/color-mapping/
25
Figure 2.41. Grasshopper program with medium complexity.
Source: Frame from an online tutorial at: https://www.youtube.com/watch?v=03R1vXfIZF4
25
Figure 2.42. Luna Moth editing interface.
Source: Alfaiate & Leitão, 2017.
25
Figure 2.43. Luna Moth’s click and dragging feature to vary the value of the parameters.
Source: Alfaiate & Leitão, 2017.
26
Figure 2.44. Bi-directional traceability: select a geometry in the tool and is highlighted the part of code that
generates it (right); select a part of the code and it is highlighted the geometry it generates (left).
Source: Alfaiate & Leitão, 2017.
26
Figure 2.45. Rainier Square Tower by NBBJ, Seattle, USA, under construction.
Source: http://www.nbbj.com/work/rainier-square/
27
Figure 2.46. Reinvention of Rupp Arena by NBBJ, KY, USA, unknown date.
Source: http://www.nbbj.com/work/rupp-arena-reinvention/
27
Figure 2.47. Xiamen Eton Center, Xiamen, China, under construction.
Source: http://www.nbbj.com/work/xiamen-eton-center/
27
Figure 2.48. Hangzhou Tennis Center by NBBJ, Hangzhou, China, 2013.
Source: Miller, 2011.
27
Figure 2.49. Using Kangaroo physics engine to visualize gravity loading on the truss centerline model of the
Hangzhou Tennis Center.
Source: Miller, 2011.
28
Figure 2.50. Compilation of the workflow using an AD approach in the Hangzhou Tennis Center.
Source: Miller, 2011.
28
Figure 2.51. Galaxy SOHO by Zaha Hadid Architects, Beijing, China, 2012.
Source: http://www.zaha-hadid.com/architecture/galaxy-soho/
28
Figure 2.52. Szervita Square Tower by Zaha Hadid Architects, Budapest, Hungary, to be confirmed.
Source: http://www.zaha-hadid.com/architecture/szervita-square-tower/
28

x
Figure 2.53. Heydar Aliyev Center by Zaha Hadid Architects, Baku, Azerbaijan, 2012.
Source: http://www.zaha-hadid.com/architecture/heydar-aliyev-centre/
28
Figure 2.54. Morpheus Hotel by Zaha Hadid Architects, City of Dreams, Macau, 2018.
Source: https://www.archdaily.com/896433/morpheus-hotel-zaha-hadid-architects
29
Figure 2.55. Different façade typologies: flat (white), single-curved (red) and free-form (blue and pink).
Source: Van der Heijden, 2017.
29
Figure 2.56. Slide of the webinar demonstrating the complexity of the Grasshopper program that modeled
Morpheus Hotel, illustrating Ramon’s statement “scale is an issue”.
Source: Van der Heijden, 2017.
29
Figure 2.57. The Barcelona Fish sculpture (or El Peix) by Gehry and Associates, Barcelona, Spain, 1992.
Source: https://barcelonalowdown.com/frank-gehrys-golden-fish-sculpture/
29
Figure 2.58. Guggenheim Bilbao by Gehry and Associates, Bilbao, Spain, 1997.
Source: http://www.the-art-minute.com/pure-freedom/
30
Figure 2.59. Walt Disney Concert Hall by Gehry and Associates, Los Angeles, USA, 2003.
Source: https://www.expedia.com/Walt-Disney-Concert-Hall-Los-Angeles.d6068477.Vacation-Attraction
30
Figure 2.60. Drawing of Guggenheim Bilbao by Frank Gehry, design sketch of the riverfront elevation, 1991.
Exposed at LACMA, LA.
Source: http://www.lacma.org/gehry#highlights
30
Figure 2.61. The Millennium Tower by Foster and Partners, Tokyo, Japan, unbuilt.
Source: https://www.e-architect.co.uk/tokyo/millennium-tower-tokyo
30
Figure 2.62. Greater London Authority (City Hall) by Foster and Partners, London, UK, 2002.
Source: https://en.wikiarquitectura.com/building/city-hall/
31
Figure 2.63. Headquarters of Swiss RE (the Gherkin) by Foster and Partners, London, UK, 2004.
Source: https://londontopia.net/site-news/featured/30-st-mary-axe-10-interesting-facts-figures-gherkin/
31
Figure 2.64. Raffles City Hangzhou by UNStudio, Hangzhou, China, 2017.
Source: https://www.archdaily.com/879869/raffles-city-hangzhou-unstudio?ad_medium=gallery
31
Figure 2.65. Lane 189 by UNStudio, Shanghai, China, 2016.
Source: https://www.archdaily.com.br/br/875786/lane-189-unstudio?ad_medium=gallery
31
Figure 2.66. Westfield White City by UNStudio, London, UK, 2018.
Source: https://www.unstudio.com/en/page/10708/westfield-white-city
31
Figure 2.67. Design process of a façade system using PLs. Left: scripted closed polysurface. Middle: Grasshopper
program. Right: documentation generated in Revit.
Source: Miller, 2018.
32
Figure 2.68. Wasl Tower by UNStudio, Dubai, UAE, under construction.
Source: https://www.wernersobek.de/en/projects/focus-en/structures/2020t-dubai-tower/
32
Figure 2.69. Part of the Wasl Tower project modeled in Dynamo.
Source: Miller, 2018
32
Figure 2.70. Result of custom scripting components that highlight the variation of elements of the façade.
Source: Miller, 2018
32

xi
3. CHARACTERIZATION OF PROGRAMMING LANGUAGES
Figure 3.1. Simple program in a VPL, Grasshopper.
Source: own authorship.
34
Figure 3.2. Complex program in a VPL, Grasshopper.
Source: https://discourse.mcneel.com/t/whats-your-largest-grasshopper-script/60594/2
34
Figure 3.3. Simple program in a TPL, Python.
Source: own authorship.
35
Figure 3.4. Part of a complex program in a TPL, Python.
Source: own authorship.
35
Figure 3.5. Grasshopper’s visual user interface.
Source own authorship.
35
Figure 3.6. Khepri’s textual user interface.
Source: own authorship.
35
4. COMPARATIVE STUDY BETWEEN A VPL AND A TPL
Figure 4.1. Number slider and Boolean toggle in Dynamo (above) and in Grasshopper (below).
Source: own authorship.
38
Figure 4.2. Control flow in Rosetta.
Source: Leitão, Lopes, & Santos, 2014.
39
Figure 4.3. Error in Grasshopper when connecting the output of a component as its input.
Source: own authorship.
39
Figure 4.4. Möbius flowchart (above) and procedure (below).
Source: Janssen, Pung, & Chen, 2019.
41
Figure 4.5. Series component in Grasshopper.
Source: own authorship.
43
Figure 4.6. Cross Reference component in Grasshopper.
Source: own authorship.
44
Figure 4.7. Square of boxes.
Source: own authorship.
44
Figure 4.8. Grasshopper program that generates a grid of cubes equally spaced between them.
Source: Tedeschi, 2014.
44
Figure 4.9. Cube of boxes.
Source: own authorship.
45
Figure 4.10. Grasshopper program that generates a cube of cubes equally spaced between them.
Source: own authorship.
45
Figure 4.11. Remap Numbers or ReMap component in Grasshopper.
Source: own authorship.
45

xii
Figure 4.12. Illustration of the remap mechanism: (A) min_domain, (B) max_domain, (C), min_codomain, and
(D) min_codomain.
Source: own authorship.
45
Figure 4.13. Cull Pattern component in Grasshopper.
Source: own authorship.
46
Figure 4.14. Solids resultant of the implementation of geometric functions in Khepri.
Source: own authorship.
47
Figure 4.15. Three versions of the same Grasshopper program, only varying the geometry being imported into the
Geometry component.
Source: own authorship.
48
Figure 4.16. Nanjing International Youth Cultural Centre by Zaha Hadid Architects, Nanjing, China, 2018.
Source: http://www.zaha-hadid.com/architecture/nanjing-culture-conference-centre/
48
Figure 4.17. Messe Basel Exhibition Hall by Herzog & de Meuron, Basel, Switzerland, 2013.
Source: https://www.designboom.com/architecture/herzog-de-meuron-mch-messe-basel-hall/
48
Figure 4.18. MCM M:AZIT Store by THE SYSTEM_LAB, Seoul, South Korea, unknown date.
Source: https://www.imgrumweb.com/hashtag/TheSystemLab
48
Figure 4.19. Point attractor influencing the radii of a grid of circles.
Source: own authorship.
48
Figure 4.20. Grasshopper program of an attractor point.
Source: Tedeschi, 2014.
48
Figure 4.21. Façade of the Quality Hotel Friends by Karolina Keyzer and Wingårdhs, Solna, Sweden, 2013.
Source: https://www.archdaily.com/550536/quality-hotel-friends-karolina-keyzer-wingardhs
49
Figure 4.22. Different natures of visual inputs: one point, multiple points, or a curve.
Source: own authorship.
49
Figure 4.23. Space frame of Heydar Aliyev Center by Zaha Hadid Architects, Baku, Azerbaijan, 2012.
Source: https://www.masterbuilder.co.in/analysis-space-frame-structure/
49
Figure 4.24. Joe & Rika Mansueto Library by Murphy/Jahn, Chicago, USA, 2011.
Source: https://www.archdaily.com/143532/joe-and-rika-mansueto-library-murphy-jahn?ad_medium=gallery
50
Figure 4.25. Biosphere, Museum of the Environment by Buckminster Fuller, Montreal, Canada, 1967.
Source: https://www.ledevoir.com/culture/532673/la-biosphere-l-experience-d-une-sphere-sans-cesse-renouvelee
50
Figure 4.26. Grasshopper program of a space frame.
Source: https://www.youtube.com/watch?v=qNJ9FWrl-Wk
50
Figure 4.27. Spaceframe generated in Khepri.
Source: own authorship.
50
Figure 4.28. The BAD café by Nudes, Mumbai, India, 2015.
Source: https://www.archdaily.com.br/br/803978/the-bad-cafe-nudes?ad_medium=gallery
51
Figure 4.29. Soumaya Museum by FR-EE Fernando Romero Enterprise, Mexico City, Mexico, 2011.
Source: https://www.archdaily.com/452226/museo-soumaya-fr-ee-fernando-romero-enterprise?ad_medium=gallery
51

xiii
Figure 4.30. South Australian Health and Medical Research Institute by Woods Bagot, Adelaide, Australia, 2013.
Source: https://garciatamjidi.com/ajax/blog/349
51
Figure 4.31. Proposal for a Sustainable Transit Station by Erik Giudice Architecture, Jönköping, Sweden,
unknown date.
Source: https://www.archdaily.com/795601/erik-giudice-architecture-releases-proposal-for-sustainable-transit-station-inspired-
by-matchsticks?ad_medium=gallery
51
Figure 4.32. Grasshopper program of a paneling and morphing mechanism.
Source: Tedeschi, 2014.
51
Figure 4.33. Unit (above) and result of paneling and morphing over an imported surface (below).
Source: own authorship.
52
Figure 4.34. Façade of a Retail Store for Regal Shoes by Nudes, Assam, India, unknown date.
Source: https://www.facebook.com/inonesskin/photos/pcb.1823734907735804/1823734614402500/?type=3&theater
52
Figure 4.35. Geometry generated by the textual program created to resemble the façade of Regal Shoes.
Source: own authorship.
52
Figure 4.36. Mesquita Bait Ur Rouf by Marina Tabassum, Dhaka, Bangladesh, 2012.
Source: http://www.arquitecturaviva.com/es/Info/News/Details/9229
53
Figure 4.37. Terra Cotta Studio by Tropical Space, Quảng Nam, Vietnam, 2016.
Source: https://www.archdaily.com.br/br/792742/terra-cotta-studio-tropical-space?ad_medium=gallery
53
Figure 4.38. Brick Cave by H&P Architects, Đông Anh, Vietnam, 2017.
Source: https://www.archdaily.mx/mx/893082/cueva-de-ladrillos-h-and-p-architects
53
Figure 4.39. Grasshopper program of a simple brick wall (online tutorial), importing a curve as visual input.
Source: https://www.youtube.com/watch?v=a_8Ba8NjNWE
53
Figure 4.40. Brick wall generated by the Grasshopper program.
Source: own authorship.
53
Figure 4.41. Floating bricks appear when the curvature is too tight.
Source: own authorship.
53
Figure 4.42. Brick wall with a sharp curvature generated by the textual program.
Source: own authorship.
54
Figure 4.43. Winery Gantenbein by Gramazio & Kohler and Bearth & Deplazes Architekten, Fläsch, Switzerland,
2006.
Source: https://www.archdaily.com/260612/winery-gantenbein-gramazio-kohler-bearth-deplazes-
architekten?ad_medium=gallery
54
Figure 4.44. The MaoHaus by AntiStatics Architecture, Beijing, China, 2017.
Source: https://www.archdaily.com/886282/the-maohaus-antistatics-architecture
54
Figure 4.45. Swanston Square apartment building (Barak Building) by ARM Architecture, Melbourne, Australia,
2015.
Source: https://www.amusingplanet.com/2017/06/the-melbourne-building-with-face.html
54
Figure 4.46. Interior of Raiffeisen Bank by Studio NAU, Zurich, Germany, 2011.
Source: https://freshome.com/2011/05/05/an-original-bank-design-raiffeisen-office-in-zurich-by-nau/
55

xiv
Figure 4.47. Grasshopper program adapted from Tedeschi’s version of a pixel mapping mechanism.
Source: own authorship.
55
Figure 4.48. Pixel mapping result, using an image of Le Corbusier.
Source: own authorship.
55
Figure 4.49. Grasshopper program developed from an online tutorial.
Source: https://www.youtube.com/watch?v=ytxldTviqKc
55
Figure 4.50. Pixel mapping result, using an image of Le Corbusier’s Modulor.
Source: own authorship.
55
Figure 4.51. BIM model generated by Khepri in Revit, using a predefined family of circular windows.
Source: Sammer, Leitão, & Caetano, 2019.
57
Figure 4.52. Analysis generated directly and by hand in DIVA for Rhino, a lighting analysis tool.
Source: Leitão, Castelo Branco, & Cardoso, 2017.
57
Figure 4.53. Ladybug for Grasshopper to perform radiation analysis, using the “black box” components
predefined within the plug-in.
Source: https://www.food4rhino.com/app/ladybug-tools
58
Figure 4.54. Analysis generated by connecting a textual program directly with an analysis tool.
Source: Leitão, Castelo Branco, & Cardoso, 2017.
58
5. GUIDELINES
Figure 5.1. 2D drawing created using a CAD tool.
Source: https://forums.autodesk.com/t5/autocad-forum/autocad-2016-round-corners-become-right-angles/td-p/5929363
64
Figure 5.2. 3D model created using a BIM tool.
Source:
https://www.google.com/url?sa=i&source=images&cd=&ved=2ahUKEwjO5J22i6_iAhWhxoUKHd3uA6cQjRx6BAgBEAU&u
rl=http%3A%2F%2Fejobnet.info%2F%3Fk%3DAbonnement%2B%25C3%25A0%2BRevit%2BLT%2B%2BAcheter%2Ble%2
Blogiciel%2BRevit%2BLT%2B2019&psig=AOvVaw1KqdA1FtwSJP_O92ocITj8&ust=1558612800858661
64
Figure 5.3. Visual program that generates the envelope of the Hangzhou Tennis Center.
Source: Miller, 2011.
66
Figure 5.4. Component highlighted in red with error message in Grasshopper.
Source: own authorship.
69
Figure 5.5. Different types of documentation in Grasshopper: locally, with the mouse over an input/output (left);
or internally, by selecting the option Help (right).
Source: own authorship.
70
Figure 5.6. Searching mechanisms showing the available functions in Khepri.
Source: own authorship.
70
Figure 5.7. Typing mechanisms automatically showing the parameters of a function in Khepri.
Source: own authorship.
70

xv
List of Tables and Charts
Table 1. Analysis plug-ins for Grasshopper.
Source: own authorship.
22
Table 2. VPLs and TPLs applied to AD and the correspondent modeling tools.
Source: own authorship.
26
Chart 1. Relation of the complexity of a project to the approach chosen and the tools used.
Source: own authorship.
67
Chart 2. Integration of the third dimension of Analysis to the approaches and tools indicated in chart 1.
Source: own authorship.
67
Table 3. Advantages of the AD approach.
Source: own authorship.
73
Table 4. Advantages of creating programs with a VPL, Grasshopper, and a TPL within Khepri.
Source: own authorship.
75
Table 5. Disadvantages of creating programs with a VPL, Grasshopper, and a TPL within Khepri.
Source: own authorship.
75

xvi
Abbreviations
2D – Two-dimensional
3D – Three-dimensional
AD – Algorithmic Design
BDS – Building Description System
BIM – Building Information Modeling
BRep – Boundary Representation
CAAD – Computer-Aided Architectural Design
CAD – Computer-Aided Design
CD – Computational Design
CSG – Constructive Solid Geometry
GD – Generative Design
IDE – Integrated Development Environment
PD – Parametric Design
PL – Programming Language
TPL – Textual Programming Language
VPL – Visual Programming Language

xvii
Glossary of Terms
Algorithm – instructions translated through a set of rules that, in this context, are given to the computer to
process and perform a desired task.
Algorithmic Design – methodology that allows the construction of a design through algorithmic
descriptions, i.e., resorting to a group of instructions, rules, and constraints that the computer can process
to generate geometry.
Building Information Modeling Tools – group of computational tools that are conceived for modeling
3D elements in a digital environment. These elements are geometrical entities to which quantitative and
qualitative information is associated, being classified according to families (e.g., walls, slabs, windows,
doors, etc.). Examples of BIM tools for architecture are Revit and ArchiCAD.
Computer Aided Design Tools – group of computational tools that allows the modeling of 2D and 3D
geometry in a digital environment. They work with geometric objects such as lines, arcs, circles, and
polygons (in 2D), and boxes, cylinders, pyramids, and spheres (in 3D), supporting a set of commands that
manipulates this geometry. Examples of CAD tools for architecture are AutoCAD and Rhinoceros 3D.
Parameter / Variable – quantifiable value that can vary within the algorithm. When this value is changed,
the algorithm generates a different result.
Parametric Design – methodology that allows the manipulation of a design or parts of that design through
the attribution of variable parameters. These parameters can, therefore, be changed, thus generating a new
version of the design, maintaining the same rules and constraints of the implemented algorithm.
Parametric Model – algorithm that generates virtual models in a visualization tool, consisting of geometry,
attributes, and relationships. This parametric model resorts to functions and variable parameters (Heidari et
al., 2018).
Program – formal description of an algorithm. It must be built using a programming language that,
according to its structure, syntax, and semantics, feeds unambiguous information to the computer that then
processes the instructions structured in the program.
Programming Language – formal language that a computer can understand and process unambiguously;
a programming language can support different programming paradigms; however, it must obey to a rigid
structure, syntax, and semantics.

xviii

1
1. Introduction
This research is contextualized within the current methodologies to the architectural practice,
namely the use of computational approaches, such as Algorithmic Design (AD). Thus, this
thesis proposes AD as a representation method for architecture, whose implementation will
be studied considering the present context, in order to study future implications of its
application and implementation in the workflow of architects.
1.1. Framework
From the birth of the discipline itself, architecture has used different tools and methodologies
to be represented, explained, and sold throughout History.
Drawings and sketches are primary examples that have always been the base of the
expression of intentions, as architects use them to illustrate their visions, to sell their
concepts, and even to communicate with other professionals during later stages of the
construction of the project.
Nowadays, the architectural process still leans on these drawings and sketches to
create the initial concept, to structure constraints, to study dynamics, and to build up ideas.
However, these ideas, typically expressed in sketches, start as organic and flexible entities,
which are later consolidated in the technical drawings and models (figure 1.1.).
Due to all the technicalities associated with the process of building an architectural
project, architecture has always been influenced by new technologies and developments in
the fields of engineering. The discipline needs to deal with structure, lighting, acoustics,
drainage, and ventilation, among others, and the architect becomes the maestro of such an
orchestra. More recently, another paradigm started influencing architecture, having the
ability to connect every single one of the mentioned contributions: computation.
Computers are part of the common practice of architecture nowadays, as when
mentioning technical drawings, one is usually referring to documents digitally produced by
Computer-Aided Design (CAD) and Building Information Modeling (BIM) tools (figure 1.2.
and figure 1.3.). They are very useful for the construction processes, becoming the base to
other specialties’ technical documents, as well as for the construction of three-dimensional
models. These digital models can later be used either for their geometry – to showcase the
overall look of the project and even to produce virtual images, or to be assessed through
computational analysis tools, being analyzed according to their performance and behavior
towards different factors, such as lighting, acoustics, or structure.
Furthermore, computation opened a wider door for other possibilities that emerge
from the fields of programming, introducing a core concept: Algorithmic Design (AD). This
new methodology offers an alternative approach to the direct manual manipulation of the
envisioned geometry in the modeling tool. Instead of resorting to the factory-set features and
Fig. 1.1. Hand-drawing (above) and
technical drawing (below) of
Swimming Pools in Leça da
Palmeira by Álvaro Siza Vieira,
Portugal, 1967.
Fig. 1.2. Digital environment of a
CAD tool, AutoCAD.
Fig. 1.3. Digital environment of a
BIM tool, ArchiCAD.

2
commands of CAD and BIM tools to create a digital representation of the project, the
architect builds a program, an algorithm, to instruct the computer to perform the same tasks.
This program is a set of instructions, rules, and constraints that translate geometry
with relationships and attributes, which can also benefit from parametric reasoning and
mechanisms. Therefore, the AD approach is often merged with Parametric Design (PD)
methodologies, that allow the manipulation of a design or parts of that design through the
attribution of variable parameters inside the geometric relationships described in the
algorithm. Thus, the created program becomes a parametric model, since it generates
geometry with intrinsic relationships and variable quantities: by changing the values of the
parameters, a new version of the model is generated, maintaining the same constraints and
relationships defined. So, the question is, why are these algorithmic approaches more
advantageous than manual ones?
The manual manipulation of complex geometries in a modeling tool requires the
architect to undertake meticulous and time-consuming tasks, since each element of the
project has to be modeled individually. This demands careful attention to detail, since the
relationships between the different elements also have to be established manually. Any
alterations required to the final design will also have to be executed by hand. Thus, the
manual approach has a high cost of change: if there are geometric relations between the
manipulated elements, e.g., tangencies, uniform distribution, proportion, etc., and one of the
parts involved has to be altered, all the geometrically dependent parts must also be changed
according to these relations. Moreover, if the project includes geometries that depend on
repetition, patterns, mathematical relationships, or even randomness, modeling by hand
becomes tedious, extremely time-consuming, and error-prone, having severe consequences
in the cost of the project.
Therefore, the AD and PD approaches propose a solution to the conventional design
process, overcoming these limitations. The parametricism they lean upon means that
architects can consolidate the sketched idea into a shape without losing its flexibility: they
decide the parameters, their constraints, and how much they can vary. Hence, the cost of
change reduces drastically, since, in order to perform an alteration to the design, architects
simply need to give alternative values to the parameters they chose and generate a variation
of the previous design that still presents the same geometrical relationships and constraints
established in the program. Therefore, it allows for an easier and more efficient exploration
of design alternatives.
When applying these design methodologies, architects are able to extend the limits of
what is viably reproducible by hand on a computer, materializing more easily the full extent
of their imagination. Algorithmic thinking is a powerful skill that enables the architect to
explore and develop new esthetics, technical solutions, and formal alternatives to a design,
besides offering many advantages when envisioning and conceiving projects with great
Fig. 1.4. Façade of the MCM
Building by The_System Lab,
Seoul, Republic of Korea, unknown
date.
Fig. 1.5. Phoenix International
Media Center by BIAD UFo,
Beijing, China, 2016.
Fig. 1.6. Proposal for the Port
Authority Bus Terminal by
Archilier Architecture, New York
City, USA, 2016.
Fig. 1.7. Serpentine Pavilion by BIG
Architecture, London, United
Kingdom, 2016.

3
complexity, accuracy, or repetitive patterns (figure 1.4., figure 1.5., figure 1.6., and figure
1.7.).
In AD, the Programming Languages (PLs) that are used to build programs can either
be visual, textual, or both. The tendency in the present day regarding the architectural practice
is to use more intuitive environments to program, particularly using Visual Programming
Languages (VPLs), such as Grasshopper or Dynamo (figure 1.8.).
VPLs are more natural for beginners and, therefore, easier to learn. Furthermore, they
are equipped with user-friendly features, such as (1) immediate feedback, to visualize in real-
time what is being generated while the program is being developed; (2) traceability, to
highlight in the modeling tool the geometry generated by a selected part of the program; (3)
insertion of visual graphs and gradients inside the program; (4) customization of several
features, such as color, style, and name of the icons; and (5) visual input mechanisms, to
import geometry previously created in the modeling tool; among others. Despite these
advantages, there is a serious handicap that appears whenever the program reaches a certain
level of complexity: it becomes hard to understand (figure 1.9.) and, therefore, difficult to
maintain and extend, and some of these features simply stop working.
However, there are practitioners who believe that the expressive power of Textual
Programming Languages (TPLs), such as Python (figure 1.10.), prevails over the struggles
of using VPLs in complex projects. The main obstacle to the use of TPLs is in the more
demanding learning process. However, if these difficulties can be overcome by simpler
implementations and a more user-friendly learning structure, the inherent advantages of the
mastery of a TPL are believed to be rewarding regarding the ease with which complex
projects can be built, changed, and maintained.
Fig. 1.8. Projects modeled in Grasshopper (left), a VPL for Rhino, and in Dynamo (right) a VPL for Revit.
Fig. 1.9. Portion of a complex project
modeled in Grasshopper.
Fig. 1.10. Program modeled in Python, a TPL, and
visualized in AutoCAD.
4
1.2. Motivation
The role of the architect goes beyond the mere design of spaces for certain contexts. The
social, economic, and environmental importance of architecture also imposes the
responsibility of being updated and aware of the overall tendencies of the era we are living
in; and we are living in a technological era.
Personally, it is motivating to propose an extension of the curriculum of the
architectural course and delve into more recent themes such as AD. Even though the
application of this methodology in the current architectural design process in Portugal is just
starting, this approach aids the materialization of the architect’s imagination in a wide range
of architectural project scales (figure 1.11.). Thus, architects become able to more easily
accomplish new esthetics, exploring further alternatives and adaptations of the design, and
even to more efficiently find sustainable and economic solutions to their proposals.
Scientifically, the main motivation of this thesis is to evaluate AD as a representation
method for architecture. This entails determining the limits of algorithmic approaches using
TPLs and VPLs, in order to define a set of guidelines to help the architect when choosing the
approach that best suits the needs of a particular project. Furthermore, understanding the
limits and the expressive power of the two types of languages will allow the development of
strategies and techniques to improve TPLs for architecture.
Programming languages do not substitute the pencil and the piece of paper where the
architect freely and organically sketches ideas and concepts. However, they might be the
future that will replace the manual usage of CAD, BIM, and analysis tools.
1.3. Objectives
Considering that this thesis evaluates and proposes AD as a representation method for the
architectural practice, the objectives to fulfill relate to the understanding of the applicability
and implementation of this methodology in the current design process.
Fig. 1.11. Application of AD in a project of architecture by a traditional
Portuguese architectural studio.
5
Therefore, we propose to address the current barriers to the use of TPLs among
architects, considering that the clear majority prefers to use VPLs, such as Grasshopper, to
develop their projects in whole or in part.
Ultimately, we are looking for the limits of complexity that invalidate the usage of a
VPL over a textual one. This moment should occur when programs are so complex that the
main advantages of using a VPL are no longer valid, resulting in an unnecessarily complex
program, that, visually, is difficult to understand. The Hangzhou Tennis Center by NBBJ
(figure 1.12. and figure 1.13.) is an illustrative real case of this situation. By studying and
analyzing these moments, we can reflect on how VPLs can stretch in order to meet this
necessity of simplification.
On the opposite end, this same line of thought will help to comprehend how a TPL
can be simplified in an attempt to compete directly with VPLs from early stages of the
construction of the program, so that its greater advantage is no longer solely valid when
working on complex projects. This analysis will provide us with the necessary tools to
suggest new implementations and simplification of the learning process of languages like
Python, with the goal of bringing them closer to the user, in this case, the architect.
1.4. Methodology
The main questions this thesis proposes to answer are (1) whether VPLs do really meet all
the needs of clarity, performance, legibility, and the possibility of cooperation when
managing complex programs, and (2) how a TPL can compete with the current usage of VPLs
from early stages of a program’s development. Hence, the methodology adopted focuses on
three main stages: (1) contextualization, (2) assessments, and (3) conclusions.
Regarding the first stage of contextualization, we will define three different moments:
(1) a presentation of the state-of-art on these and other related questions and of the current
application of algorithmic approaches in architecture, (2) a definition of the core concepts
that are specific to this investigation, and (3) a theoretical comparison regarding the
implementation and application of both visual and textual programming languages.
In order to assess the theory presented in the first stage, this methodology follows a
practical comparison of the contextualized criteria. From this evaluation of the practical
Fig. 1.12. The shell of the Hangzhou
Tennis Center by NBBJ, Hangzhou,
China, 2013.
Fig. 1.13. Complex program in Grasshopper that generates the shell of the Hangzhou Tennis Center.

6
application and implementation of VPLs and TPLs, the third and final stage will focus on
structuring guidelines and strategies (1) to establish the relative advantages of visual and
textual approaches for different scales of complexity and (2) to propose further
implementations that can counteract the existing tendency and bring textual languages closer
to their users, competing with visual languages from the early stages of the development of
AD programs.
1.5. Structure
This thesis is structured in three main sections: (1) a contextualization section, where the
information needed to the understanding of the work development is provided, (2) a
development section, where the criteria presented are assessed in both theory and practice,
and (3) a reflection section, where the guidelines, the proposed strategies, and the conclusions
about the work developed are structured.
The contextualization section is divided into three chapters:
1. Introduction: general contextualization of the research through the description of
the Framework (1.1.), Motivation (1.2.), Objectives (1.3.), Methodology (1.4.), and Structure
(1.5.), previously presented.
2. State-of-the-Art: overall contextualization of the work related to the theme of this
investigation, namely regarding the evolution of Representation Methods (2.1.) until the
present day; the definition and application of Algorithmic Design (AD) in today’s
architecture (2.2.); the evolution of PLs until their current application in the architecture
realm (2.3.), including a review on the types of PLs and the description of some representative
examples; a revision on the main and most used tools, libraries, and plug-ins available for
AD (2.4); and a summary of the main PLs used specifically in the practice of architecture
(2.5), identifying some of the architectural studios in the world that are currently using them
to generate their projects through AD.
3. Characterization of Programming Languages for Architecture: introduction
and definition of the core concepts that are specific to the development of this investigation,
such as Computational Power (3.1.), Performance and Efficiency (3.2.), Expressive Power
(3.3.), User Interface Features (3.4.), and Limit of Complexity (3.5).
Those concepts constitute the criteria to classify PLs, relating to their appeal in terms
of performance and ease of use. This contextualization represents the first step in the
understanding of both the tendency of using VPLs over TPLs and of the potentialities and
advantages of the textual approach over the visual one.
The assessment of the developed work is contemplated in the fourth chapter:
4. Comparative Study between VPLs and TPLs: in order to address the main
questions of this investigation regarding the relative use of visual and textual programming
7
languages, the fourth chapter integrates both a theoretical (4.1.) and a practical comparison
(4.2.) between the two types of languages.
In the theoretical comparison, we enumerate a set of topics that describe and explain
some features and mechanisms provided by VPLs and/or TPLs, some of which are inherent
to VPLs or to textual ones, and others were already implemented in both paradigms.
Regarding the practical comparison, we assess the features and mechanisms
previously presented by programming real case studies. These case studies represent either
the assessment of (1) geometric behaviors and structures commonly used in AD for
architecture or (2) programming mechanisms that aid in the generation of those geometric
behaviors and structures.
Finally, the last stage of this thesis is divided into two main chapters.
5. Guidelines: first reflection on the question related to the relative use of VPLs and
TPLs according to the intended results. We aim to structure a set of situations where the use
of VPLs has more advantages and others where the user has more benefits in adopting a
textual approach.
Other reflection to be made in this chapter regards the guidelines to the
implementation of features, mechanisms, and abstractions that might bring TPLs closer to
their users and able to compete with VPLs from early stages of the design process.
6. Conclusions: in this chapter, the main unanswered questions that motivated the
development of this thesis are discussed according to the conclusions taken from this
investigation.
Firstly, we structure some Reflections (6.1.) about (1) the proposal of AD as a
representation method for architecture, (2) the impact and benefits of algorithmic thinking
within the architecture curriculum, (3) the relative advantages of VPLs and TPLs when
integrated within the workflow of the architect, and (4) the barriers to surpass regarding the
algorithmic approach to choose.
Lastly, the Future Work (6.2.) proposes new lines of investigation that we consider to
be relevant contributions to the development of AD in architecture and which, therefore, will
extend the findings of the study even further.

8

9
2. State-of-the-Art
To better contextualize this research, it is crucial to understand the origin and consequent
evolution of some of the main concepts of the investigation.
Therefore, the description of the current practice of architecture and its more recent
methodologies and approaches should be explained as the result of a continuous development
of the ways architects use to express ideas and concepts from the earliest times of mankind.
2.1. Representation Methods
Since the birth of mankind as a collective species, communication has been the key to its
survival and development. Alongside with the first sounds and gestures, drawings were made
inside caves to express reality, to communicate intentions, or even to tell stories. Millenniums
after the Neanderthal period, at the time of the first civilizations, drawings were still part of
the report of people’s daily lives and past stories, plans and projects for the future. The
Egyptians are an illustrative example, with a complex legacy of hand-painted drawings on
monuments’ walls, also using a language expressed through icons – the hieroglyphs. Some
believe that the first references of architectural drawings were from the period of ancient
civilizations. The Gudea Statue (figure 2.1.) exposed at the Louvre Museum in Paris, from
the Mesopotamian period (4000 years ago), is holding an architectural plan, thus constituting
one of the most iconic examples of that (Pilsitz, 2017).
We came a long way since the Ancient era, and, up to the present day, our knowledge
has been developing exponentially; and so have the methods and techniques we use to express
ourselves. Nevertheless, it becomes clear that, throughout all these centuries of evolution, the
expression of architectural thoughts and ideas has always been made through visual methods:
drawings, plans, sections, schemes, and physical models, among others. Acknowledging this,
Austin and Qattan (2016) refer to architects as “visual thinkers”, since architecture is
predominantly represented through visual communication.
The Greek and Roman antiquity brought different contributions to the evolution of
representation methods in architecture, culminating with some of the first urban drawings,
such as the plans of Roman cities (figure 2.2.). Moreover, regarding the systematization of
architectural projects, a novelty emerged. During the 1st century b.C. lived a man that is now
unmistakably recognized as one of the first theorists of architecture. Marcus Vitruvius Pollio,
or Vitruvius for short, was a man of multiple facets, whose most prominent achievement was
undoubtedly his multi-volume treatise: De Architectura Libri Decem (figure 2.3.), his only
work to survive to the present day. In the set of ten books, he studied the architecture of the
Greco-Roman period and rationalized the used system of proportions and ratios. This
systematization, however, was explained solely using textual descriptions and did not include
drawings to illustrate them. Thus, this was the first example in architecture where language
in the textual form was the only representation method used to illustrate an idea. Nonetheless,
Fig. 2.1. Plan of a temple in the
Gudea Diorite Sculpture,
Mesopotamian period, 2120 b. C.,
Louvre Museum, Paris, France.
Fig. 2.2. Plan of an ancient Roman
City.
Fig. 2.3. The frontispiece of the
second edition of the De
Architectura Libri Decem edited by
Perrault, published in 1684.

10
later on, this factor represented an obstacle, since the Latin used by Vitruvius proved to be
incoherent and difficult to decipher.
During the Medieval period, one can observe considerable progress in the techniques
of orthographic projections, such as plans and elevations, but it is not until the Renaissance
that the representation methods in architecture witnessed a great development: the discovery
of perspective. Furthermore, after the assimilation of the historical and architectural
importance of the legacy of the Antiquity – not only of the ancient buildings but also of
Vitruvius’ treatise – humanists based new manifestos on the study and translation of De
Architectura. The first printed editions already comprised drawings and schemes to better
illustrate the explained concepts and ideas (figure 2.4.). Authors such as Alberti (1404–1472),
Serlio (1475–1554), Vignola (1507–1573), and Palladio (1508 –1580) interpreted, drew, and
proposed new ways of building the Modern era, using the teachings of Vitruvius to base new
visions built upon the critical sense of their own time. In their treatises and manifestos,
drawings were a critical contribution to the understanding of the described solutions.
Furthermore, the perspectival drawing allowed for a better comprehension of some
abstractions often represented in orthographic projections, such as plans and sections. For the
first time, drawings incorporated the third dimension in the paper, a concept that came to
have implications in the materialization of the architectural principles of the following period,
the Baroque. The Baroque period was also characterized by the materialization and
manipulation of perspective in the built space, reflected in a sophisticated complexity and
optical illusion effects, such as the Borromini’s Spada Palace (figure 2.5.).
Even though they have certain limitations, “drawings have been the stable medium of
architecture over centuries and this was possible as the architect relied on typology”
(Tedeschi, 2014, p. 18), i.e., the use of typological solutions that were already preconceived
and well proven to work. Up until this time in the History of Architecture, drawings were not
only a medium of communication but also a system in which architects relied on in order to
explore their designs within a set of formal structural constraints, an approach described as
form-making. However, in the late 19th century, this idea started being questioned and
replaced by a new way of thinking: a form-finding approach – a forward process to find an
optimal geometric solution that is statically in equilibrium within a design loading
(Adriaenssens, Veenendaal, & Williams, 2014). Some of the pioneers of this time, such as
Antoni Gaudi (1852–1926) and Frei Otto (1925–2015), have rejected typology and looked to
self-information processes in nature as a way to organize buildings. For instances, Gaudi
shaped the design of his buildings according to the application of the force of gravity, one of
nature’s parametric inputs (Heidari, et al., 2018) (figure 2.6.). Therefore, since “the form
could not descend from proven solutions, the traditional drawing could not be used as a tool
to predict design outcomes” (Tedeschi, 2014, p. 18). In return, physical models became
crucial to the design investigation of architects and engineers that believed in this approach.
Fig. 2.6. Antoni Gaudí’s hanging
chain models, 1889.
Fig. 2.5. Section and plan of the
corridor of Spada Palace by
Francesco Borromini (17th century,
Rome) where the narrowing of the
floor, ceiling and lateral walls give
the perspectival illusion of a longer
corridor.
Fig. 2.4. Illustration of the Doric
Order of the 1684 edition of
Vitruvius’ De Architectura.

11
Nowadays, architects continue to explore different approaches and techniques that
improve their communication in terms of efficiency, effectiveness, clarity, appeal, and
realism, and computers commonly play an important role in this process. Visual
representations have been used for centuries, “executable visual representations, however,
have only arisen with the advent of the computer” (Menzies, 2002, p. 94). Some decades ago,
after the time when hand-drawings and physical models were the only methods of visual
communication available for architects, visual representations conquered a new dimension:
they became digital. Therefore, the following evolution of representation and computational
methods aided to build Algorithmic Design (AD) as we know today, an approach to design
where geometry is represented by rules and constraints set within an algorithm.
Parametric Architecture was firstly defined by the Italian architect Luigi Moretti
(1907 - 1973), in 1939, by the original expression Architettura Parametrica (Bucci &
Mulazzani, 2000). He studied the relationships between dimensions dependent upon the
various parameters (Moretti, 1971), that would become the basis to a new architectural
language, nowadays known as algorithmic design. Moretti truly challenged the standards of
conventional architectural practices of his time by suggesting that computers were the
engines of a new architecture, without which it would be impossible to process the parameters
and their relationships. Some of his work was exposed during the 12th Milan Triennial in
1960, such as his proposal for a parametric stadium (figure 2.7.).
Even though the theory behind this new idea was the product of an intersection
between architecture and mathematics, its implementation would have to rely on
technological developments in the field of computation. Therefore, Moretti’s proposal can
be considered ahead of its time, not only because of the innovation of the concept, but also
because of the lack of technological developments at the time to put it into practice.
Parametric architecture would only have its true application fifty years later.
The seed of computation for architecture was planted in 1939, but it was only in the
60s that its implementation first started to blossom through the development of computational
tools for the architectural practice. As reported in Brad Myers’ paper A Brief History of
Human-Computer Interaction Technology (1998), in 1963, the predecessor of modern
Computer-Aided Design (CAD) tools was publicly demonstrated: Sketchpad, by Ivan
Sutherland (figure 2.8.). The now ubiquitous direct manipulation interface, where visible
objects on the screen are directly manipulated with a pointing device, was demonstrated in
his doctoral thesis using a light pen to support the manipulation of objects, including grabbing
and moving them, changing size, and establishing constraints (Myers, 1998) (figure 2.9.).
Therefore, Sketchpad was the first direct transition of the traditional drawing board of
a conventional architectural studio to a digital environment, using a light pen and commands
to match the pencil, rubber, and ruler. Nevertheless, the application of such tools was not
received immediately in the architectural common practice, even though its promising
Fig. 2.8. Ivan Sutherland
demonstrating the use of Sketchpad.
Fig. 2.7. Model and plans of
Moretti’s parametric stadium, from
the 1960 Parametric Architecture
exhibition at 12th Milan Triennial.
Fig. 2.9. Before (above) and after
(below) applying design constraints
to a graphical object in Sketchpad.

12
potentialities were sufficient to trigger the development of more sophisticated tools within
the same paradigm.
The principles of digitalization of the drawing board proposed by Sutherland were
later incorporated into commercially successful software available for architecture, such as
AutoCAD (1982) (figure 2.10.). During this process, the wall separating the practice of
architecture from that exclusive to the computer scientists began to narrow with the
introduction of the possibility of working with programming languages in the construction
of programs within a modeling tool. Autodesk, the company that developed AutoCAD, made
available in 1986 one of the first programming languages for architecture, AutoLisp. On the
one hand, AutoCAD, through the digitalization of the drawing board, met the needs of the
architect to both accelerate repetitive tasks and manage multiple design layers (Tedeschi,
2014) and, by making geometric models seemingly easy to change, it even aided to reduce
the working hours that the architect spent on manually changing or creating new
representations (Davis, 2013). On the other hand, AutoLisp allowed the extension of the
tool, enabling automation and mechanization in order to reduce the time and effort architects
spent when reproducing their ideas in a digital environment. However, even though the
language was created to be applied to the architectural process of conceiving technical
documentation in AutoCAD, it was still not suitable for architects, since it was difficult to
learn and apply for those unfamiliar with programming and untrained to think
algorithmically.
A parallel event with critical impact in the evolution of representation methods in
architecture was the beginning of the development of today’s Building Information Modeling
(BIM) tools, whose conceptual underpinnings go back to the earliest days of computing
(Quirk, 2012). Douglas C. Engelbart was a pioneer in the understanding of BIM principles
and the first author to predict this new approach to computational processes in architecture
in his book Augment of Human Intellect: A Conceptual Framework (1962). He described the
work method of a future architect designing a building in a computer as focused on an object-
based design, with the ability to store objects and their associated information in a relational
database and the possibility of parametrically modifying them (Engelbart, 1962). After the
invention of Sutherland’s Sketchpad, “many other researchers started conceptualizing a
‘futuristic’ design paradigm that revolved around the three-dimensional design approach and
object-orientation” (Sawhney, Singh, & Ahuja, 2017, p. 5), with the appearance and
improvement of solid modeling programs in the computational representation of geometry.
The following decades of the 1970s and 1980s were also marked by the development
of two fundamental methods to display and record shape information: (1) Constructive Solid
Geometry (CSG), a system used in solid modeling that allows to build solid objects from
other solids by combining, intersecting, or subtracting them (figure 2.11.), and (2) Boundary
Representation (BRep), a method where solids are represented as a collection of connected
surfaces, defined by their limits.
Fig. 2.11. Illustration of a
Constructive Solid Modeling
process.
Fig. 2.10. The first version of
AutoCAD released in 1982.
Fig. 2.12. Coordinated views in
current Revit, a BIM tool for
architecture.

13
Along with these methods, the implementation of libraries of objects was a crucial
contribution to the development of BIM tools. The first software to describe these individual
library elements that could be retrieved and added to a model was Building Description
System (BDS), designed in 1974, the first project to succeed in creating a building database
(Sawhney, Singh, & Ahuja, 2017). BDS already resorted to a user graphical interface,
different orthographic and in perspective viewports (figure 2.12), and a sortable database
from where the user could retrieve information stored by categories, i.e., attributes such as
materials and suppliers. The following researches and developments on the subject led to the
first version of a BIM tool for architecture, ArchiCAD, in 1984 (figure 2.13.).
The next progression in the History of Computer Science that had direct implications
in the development of AD as we know today was the introduction of Pro/ENGINEER
software, also in 1987, developed by Samuel Geisberg (figure 2.14.). It was the first
mainstream system that fully implemented the concepts of Sketchpad that, besides the digital
manipulation of geometry using a light pen to “draw” in a computer, also allowed the
implementation of geometric relationships between the drawn elements. These geometric
relationships were communicated to the computer through a specific type of computer
program, nowadays known as parametric model (Davis, 2013). Therefore, Pro/ENGINEER
represented the first implementation of concepts such as parametric architecture and
parametricism, previously presented by Moretti and intended in Sutherland’s studies.
Sutherland originally aimed to make computers accessible to new classes of users,
namely artists and draughtsmen, without losing the power of abstraction that is critical to
programmers (Sutherland, 2003). Therefore, Pro/ENGINEER allowed users to associate and
control tridimensional parametric components by user input constraints (Tedeschi, 2014) and
answered to the need of many designers to build more sophisticated programs in order to
manage increasingly complex projects.
Even though this technological development did not admit a fluid and organic work
method as intuitive and natural as a hand-drawing, it allowed greater efficiency and flexibility
in the architect’s workflow dynamics in phases following the conceptual sketches. It not only
formalized the architect’s ideas with greater accuracy and efficiency but also gave him an
extension of the design spectrum to explore with the new tools available. Actually,
Sutherland stated that “it is only worthwhile to make drawings on the computer if you get
something more out of the drawing than just a drawing” (Sutherland, 2003, p. 110).
Nowadays, computation and programming became the paradigm that enabled
architecture to evolve and develop more sophisticated and efficient approaches to visual
communication. On the one hand, hand-drawn documentation has already been extended to
the digital realm: (1) three-dimensional models can be used to capture videos and rendered
images with the use of textures and light; (2) BIM tools create realistic building relationships
with the use of families associated with technical information that also permit to easily obtain
technical sections (figure. 2.15.), maps of quantities, interactive schedules, and budgets; and
Fig. 2.14. Typical model in an early
Pro/ENGINEER version.
Fig. 2.15. Technical rendered
section modeled in Revit.
Fig. 2.13. ArchiCAD 2 version,
released in 1986.
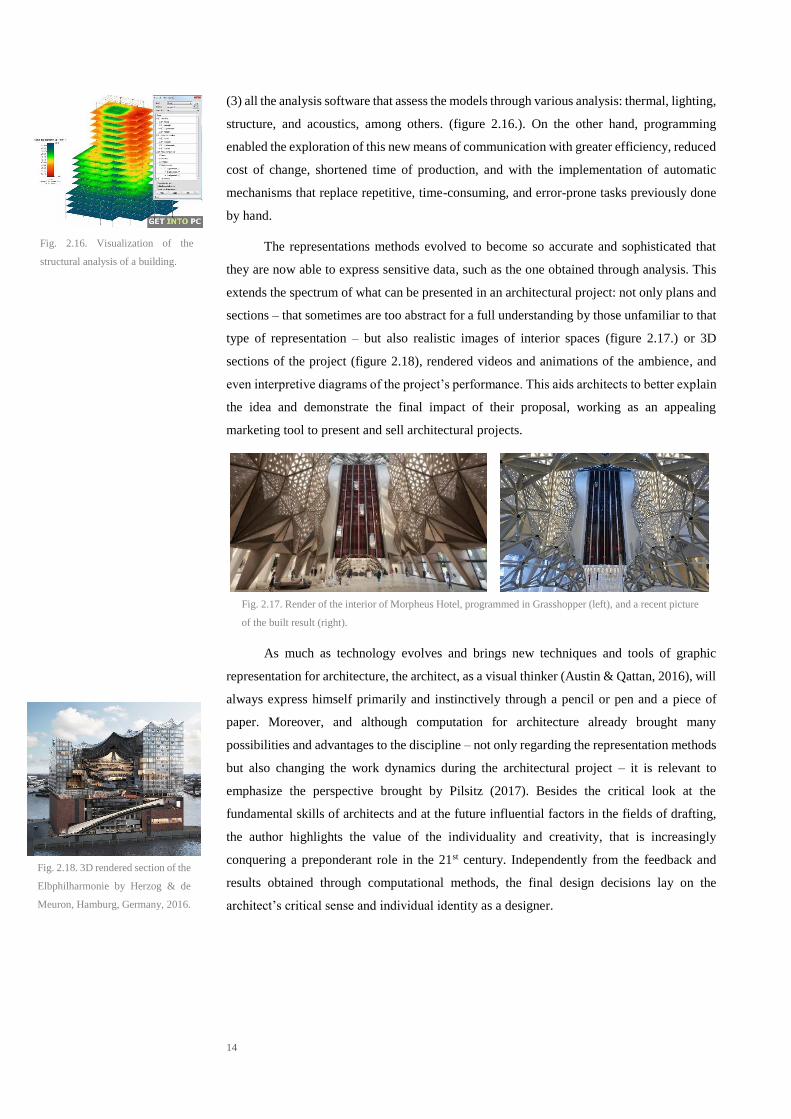
14
(3) all the analysis software that assess the models through various analysis: thermal, lighting,
structure, and acoustics, among others. (figure 2.16.). On the other hand, programming
enabled the exploration of this new means of communication with greater efficiency, reduced
cost of change, shortened time of production, and with the implementation of automatic
mechanisms that replace repetitive, time-consuming, and error-prone tasks previously done
by hand.
The representations methods evolved to become so accurate and sophisticated that
they are now able to express sensitive data, such as the one obtained through analysis. This
extends the spectrum of what can be presented in an architectural project: not only plans and
sections – that sometimes are too abstract for a full understanding by those unfamiliar to that
type of representation – but also realistic images of interior spaces (figure 2.17.) or 3D
sections of the project (figure 2.18), rendered videos and animations of the ambience, and
even interpretive diagrams of the project’s performance. This aids architects to better explain
the idea and demonstrate the final impact of their proposal, working as an appealing
marketing tool to present and sell architectural projects.
As much as technology evolves and brings new techniques and tools of graphic
representation for architecture, the architect, as a visual thinker (Austin & Qattan, 2016), will
always express himself primarily and instinctively through a pencil or pen and a piece of
paper. Moreover, and although computation for architecture already brought many
possibilities and advantages to the discipline – not only regarding the representation methods
but also changing the work dynamics during the architectural project – it is relevant to
emphasize the perspective brought by Pilsitz (2017). Besides the critical look at the
fundamental skills of architects and at the future influential factors in the fields of drafting,
the author highlights the value of the individuality and creativity, that is increasingly
conquering a preponderant role in the 21st century. Independently from the feedback and
results obtained through computational methods, the final design decisions lay on the
architect’s critical sense and individual identity as a designer.
Fig. 2.17. Render of the interior of Morpheus Hotel, programmed in Grasshopper (left), and a recent picture
of the built result (right).
Fig. 2.18. 3D rendered section of the
Elbphilharmonie by Herzog & de
Meuron, Hamburg, Germany, 2016.
Fig. 2.16. Visualization of the
structural analysis of a building.

15
2.2. Algorithmic Design in Architecture
We are presently witnessing a paradigm shift in the realm of architecture with the integration
of approaches, such as AD, in the architect's workflow. This section aims to contextualize
the integration of the algorithmic approach in the current architectural practice.
As the art and science of idealizing and conceiving spaces, architecture is inseparable
from the social, technological, environmental, and scientific context of the era in which it is
inserted. During the last decades, technological developments in the fields of computer
science have come to assist and facilitate the practice of architecture. The rapid and
increasing extension of computational approaches to architecture has been empowered by the
reciprocal fecundation between architectural theories and all the possibilities and
potentialities provided by digital technologies (Fusero et al., 2013). In addition to the new
digital tools commonly available, computation also allowed the extension of the creative
spectrum of the architect, with the introduction of algorithmic and parametric thinking.
This new architectural reasoning constitutes a shift from the more traditional
architectural practices, a phenomenon that is the subject of Terzidis paper Algorithmic
Design: A Paradigm Shift? (2004). As with any other radical paradigmatic change in science
or arts, controversy always emerges.
The main controversy that has been arising is related to more than only formal
materialization of ideas or styles. Regarding computational thinking in architecture, the main
question is related to the ethics of the design process: the value of the fluidity of a hand-
drawn idea entirely conceived in the architect’s mind against the uncreative and insensitive
automatism of designs generated by computers. Irrespective of all the opportunities
guaranteed by the algorithmic process and thinking – concretized through the new tools and
parametric methodologies developed – the creative solutions generated through
computational methods are still the object of great criticism (Castellano, 2011). In the same
paper mentioned above, Terzidis makes a strong statement that might clarify the misguided
interpretation that computers can substitute the architect, saying that “computational formal
explorations do not intend to eradicate human imagination but rather extend its potential
limitations” (Terzidis, 2004, p. 206). He goes even further by believing that computation is
not a substitute for human creativity but offers the means to explore, experiment, and invest
in an alternative realm (figure 2.19.). Furthermore, the ultimate design decision is always up
to the architect. Regardless of all the possible design variations, alternatives, and new
possibilities presented by a computed generation of form, architects ultimately still lean on
their critical sense, sensibility, and creativity to build their idea.
The power of applying computer science methodologies to architecture is in
conquering not only new tools, that allow a more efficient and rigorous workflow, but also
extending the creative reasoning with algorithmic thinking. In other words, architects become
Fig. 2.19. Design process – from
sketches and physical models to
computational analysis, rendering,
and construction – of the Swiss Re
by Foster and Partners, London,
UK, 2004.

16
able to allow their imagination to go even further, based on their capabilities in mastering
new approaches like algorithmic design.
As previously defined, Algorithmic Design (AD) is an alternative approach to the
manual manipulation of geometry in a modeling tool, as the architect uses algorithms,
implemented through programming languages, to create that geometry in a digital
environment (Leitão, Lopes & Santos, 2014). This allows the user to transcend factory-set
limitations of the currently used 3D software (Terzidis, 2004) such as CAD and BIM tools,
as well as to overcome the challenges of normal mouse-based approaches when modeling
complex geometries (Castelo Branco & Leitão, 2017). In sum, the architect builds the
program that generates the geometry in the used tool, instead of generating the geometry by
hand.
Mastering AD requires an extension of the conventional architectural reasoning, as
architects should learn to think parametrically, focusing on new concerns such as the logical
sequence of formulas, parameters, and geometric relationships that explain and translate the
idea of their design. The rethinking of the structure of the architectural curriculum to include
the development of programming skills and parametric reasoning, in order to meet the
demands of the discipline nowadays, have been proposed by some authors (Leitão, 2013 –
figure 2.20.; Agirbas, 2017 – figure 2.21.). Moreover, assuming that programming should be
taught, other authors already discussed the best approaches and strategies (Eid & Milham,
2012; Ivanović et al., 2015). Nevertheless, some of the proposed questions remain
unanswered.
The methodology that is being suggested is that architects should learn how to use
programming languages to program and explore variations of their own projects, instead of
delegating this task to programmers. The rationale behind this proposal lies in the fact that
when external programmers - who are completely dissociated either from the principles of
the project or from the architectural reasoning - translate a project through an algorithmic
description, they are not predicting which possible parameters or variations go according to
the architect's idea, which can result in a program of a parametric model that is not changeable
within the appropriate variables. On the other hand, if architects, the holders of all the ideas
and concepts associated with a project, are in charge of programming its materialization
through AD, they can test and explore the limits of their own imagination and can even find
solutions that fit the context and concept even better than their initial idea.
“To be original and to be in control, the designer has to understand, if not originate,
his own algorithm, and know how to drive it” (Aish, 2005, p. 12). Authors such as Robert
Aish believe that architects should acquire programming skills inside the architectural
paradigm, i.e., without becoming necessarily software engineers. In his paper From Intuition
to Precision (2005), he explains that the algorithmic thought allows architects and designers
to embed their design logic within “an interactive design system which is driven by the
designer’s hand and evaluated by the designer’s eye” (Aish, 2005, p. 12). Once again it is
Fig. 2.21. Design process and
materialization of a student’s
project on Islamic patterns using a
visual approach to AD.
Fig. 2.20. Exercise of surface
mapping developed by students
using a textual approach to AD.

17
emphasized the importance of the architect’s critical sense and ability to make decisions
according to his professional and personal beliefs, contributing to humanize a process that
has been increasingly relying on machines to be executed.
The impact of technological evolution on the discipline of architecture has been so
preponderant that it has generated great controversy regarding the paradigm of the
contemporary era. Patrik Schumacher has strongly contributed to the proliferation of these
beliefs through manifestos that announced the emergence of a new architectural style: the
Parametricism (Schumacher, 2008). The partner at Zaha Hadid Architects is also the author
of Parametricism as a Style – Parametricist Manifesto (2008) and Parametricism - A New
Global Style for Architecture and Urban Design (2009) (figure 2.22.), where he claims that
“architecture finds itself at a midpoint of an ongoing cycle of innovative adaptation” (2008,
p. 1). For the author, Parametricism defines this moment in the History of Architecture, that
he describes as the architectural style that achieved an extensive supremacy within the
contemporary architectural avant-garde (Schumacher, 2008) and that can be understood as a
research program based upon the parametric paradigm. These statements are controversial,
paradigmatic, and have created strong divergencies between other professionals.
Even though manifestos such as Schumacher’s do address the powerful attributes and
benefits of computational design (Castellano, 2011), many authors still go against the
presented principles and ideas. However, the main tendency among AD practitioners is to
assume that “Parametricism or not, clearly we are on the cusp of an extraordinary shift in
creative potential and priorities and with-it architectural practice” (Burry, 2011).
In addition to the controversy surrounding these logistical issues about the role of
programming in architecture and the extension of the architect's curriculum to include
algorithmic and programming skills, other AD-related questions focus more on the
implementation of this methodology for architecture: if architects should learn to program,
what programming language should they use? The following sections contemplate an
introduction to the concept of programming languages as well as a review on the two most
relevant types of PLs for the understanding of this study.
2.3. Programming Languages
Programming Languages (PLs) are used to translate the intentions of the user into instructions
that the computer can understand and process, being a formal medium to express ideas and
not solely a means to get a computer to perform operations (Leitão & Santos, 2011). There
are many types of programming languages, as some are developed for specific applications
and others have the flexibility to serve various purposes.
The History of PLs is very recent when compared to other fields and, when referring
to PLs applied to architecture, one can say that their history is still blossoming. Arguably,
this history starts with the invention of Fortran.
Fig. 2.22. Parametric model of
Kartal-Pendik Masterplan by Zaha
Hadid Architects, Istanbul, Turkey,
2006.

18
Fortran was developed by IBM and had its first appearance in 1957 (figure 2.23.),
being the first widely known and used programming language (Wirth, 2008; Sammet, 1972).
The 1950s were very important for the dissemination of computers, that became available to
institutions and universities, as well as to the recognition of a new profession: programmers.
It was in this context that several companies started hiring the so-called programmers, who
had the skills to communicate with the machines through programming, a complex, creative
task that required human inventiveness to produce efficient programs (Backus, 1981).
Programming languages were, thus, created to facilitate this programming process.
The first computers required a level of programming that made it clear to be a very
demanding task. Part of the solution was to create more tools, implement automation, and
develop better programming languages. The 1960s was also the period when the discipline
of computer science was born.
One major milestone in the History of PLs, that also enabled the distinction of this
new discipline, were the 1968 and 1969 conferences sponsored by NATO1 (figure 2.24.).
These conferences provided a strong baseline to understand the current state of the practice
of software engineering (Boehm, 2006), besides representing the first time practical issues
regarding the struggles of the new discipline were discussed (Wirth, 2008). The well-known
term “software crisis” was born inside these discussions to refer to all the issues exposed
(O’Regan, 2012).
Even though PLs have been created to be used in countless different applications and
fields, in the architectural practice, the use of programming languages is limited, as they need
to interact with digital modeling tools such as CAD and BIM tools. Usually, these tools offer
specific programming environments and languages, e.g., AutoLISP for AutoCAD,
RhinoScrip for Rhino, Grasshopper for Rhino, and Dynamo for Revit.
As already mentioned, in AD, the implementation of the algorithms can be done
through two main types of languages: Visual Programming Languages (VPLs) and Textual
Programming Languages (TPLs).
The following sections will describe these concepts in more detail.
2.3.1. Visual Programming Languages
Visual programming languages (figure 2.25.) use icons and connections to feed
information and instructions to the computer, structuring diagrams of blocks connected by
wires (Schaefer, 2011). According to Noone and Mooney (2018), a VPL is any programming
language that allows users to manipulate the underlying code graphically, thus specifying the
execution of a program without textual scripting (Menzies, 2002). In a VPL, programs consist
of icons that can be manipulated interactively and according to some spatial grammar (Myers,
1 NATO - North Atlantic Treaty Organization.
Fig. 2.24. Different groups at the
NATO Software Engineering
Conference, Garmisch, Germany,
7th-11th of October of 1968.
Fig. 2.25. Programming
environment using a VPL.
Fig. 2.23. Images of an IBM 704
mainframe computer, in 1957.

19
1990), i.e. iconic elements of data – that can contain either values, functions, or geometry,
for example – related between each other through output-input relations.
In the following sections, we describe two relevant VPLs.
2.3.1.1. Grasshopper
Grasshopper is described as a VPL because it meets the specifications of a language
that allows the construction of programs through icons (called components) and connections
(called wires). These components represent programming abstractions, such as functions,
parameters, or even geometry (Ferreira & Leitão, 2015), being organized in a series of menus
from where they can be dragged into the work environment (figure 2.26.). Hence, the created
program represents a data flow graph that consists of the connection between these
components where the information flows into and out (Payne & Issa, 2009).
Unlike RhinoScript, a TPL for Rhino, Grasshopper requires no deep knowledge of
programming or scripting, but still allows designers to build from simple geometry to the
awe-inspiring (Davidson, 2018). Nonetheless, it is possible to extend the functionalities of
Grasshopper with the introduction of written code, using TPLs such as Python, C#, and
VB.NET.
2.3.1.2. Dynamo
Dynamo, just like Grasshopper, is a VPL. The main difference is in the application it
is associated with, since Grasshopper is a VPL for a CAD tool (incorporated in Rhino), and
Dynamo enables the user to write visual programs generated in Revit, a BIM tool (figure
2.27.). Therefore, besides all the modeling features, it also includes icons (called nodes) that
import to the work environment the families of objects available in Revit.
Dynamo also supports the use of code blocks, i.e., nodes in which it is possible to
write small scripts using TPLs such as Python. These code blocks enable the creation of small
algorithms that introduce more complex functionalities, extending the features of the
available factory-set nodes (Ferreira & Leitão, 2015).
Fig. 2.26. Work environment using Grasshopper associated with Rhino.

20
Autodesk released an online manual about Dynamo (2018), where its application is
described as a visual programming tool that aims to be accessible to both non-programmers
and programmers alike. It gives users the ability to visually script behavior, to define custom
pieces of logic, and to script using various TPLs (Autodesk, 2018).
2.3.2. Textual Programming Languages
Contrarily to VPLs, textual programming languages, as the name suggests, belong to
the category of programming languages that use written text to build programs, using a one-
dimensional stream of characters (Brown & Kimura, 1994). These programs structure a script
of written instructions and descriptions that the computer understands and processes
unequivocally (figure 2.28.). Just like any other language in the world, textual programming
languages also obey specific syntax and semantics.
In the following sections, we describe two relevant TPLs.
2.3.2.1. Python
Python is a textual programming language easy to understand due to its resemblance
to mathematics, extendibility, and user-friendliness (Payne, 2010). It was created in 1991 and
has been used successfully in thousands of real-world business applications around the world,
including many large and mission-critical systems and companies, such as Google, NASA,
Wikipedia, Facebook, and Yahoo (Python Software Foundation, 2001).
Fig. 2.28. Programming environment using Python, a TPL, associated with AutoCAD.
Fig. 2.27. Work environment using Dynamo associated with Revit.

21
Being considered suitable for beginners or even non-programmers, the language is
currently benefiting from a considerable momentum in the AD community, particularly
because it is one of the scripting languages of Rhino (Leitão & Proença, 2014), providing
predefined functions with the possibility of programming user-defined ones.
2.3.2.2. Julia
Julia is a high-level, high-performance dynamic language used for numerical
computing (Julia, 2018). It is also a TPL, with a very intuitive syntax for non-programmers
due to its resemblance to mathematics. In addition, it allows the effortless creation of built-
in and user-defined functions.
Even though the number of users of this language is lower than Python’s, Julia’s
community of developers is contributing with several external packages at a rapid pace (Julia,
2018), developing the language’s functionalities and applications.
2.4. Tools, Libraries, and Programming Environments
Some of the best known visual and textual programming languages can be extended to
connect to other computational tools and libraries in order to enlarge the spectrum of
application of AD, for instances, with computational analysis. The following sections present
some of these tools and libraries applied to the PLs they work within.
2.4.1. Grasshopper Plug-ins
Grasshopper allows the improvement and extension of its abstractions and application
through external contributions. Some of these contributions, the plug-ins, provide new
abstractions to extend the available set, while others extend the applicability of the language
by allowing the connection with other modeling and analysis tools (figure 2.29.).
Grasshopper’s plug-ins are organized in an online library, and they can cover different
fields such as manipulation of geometry, automation processes, or even different kinds of
building analysis. Some of the most well-known are Diva-for-Rhino, Ladybug, Geco,
Karamba3D (figure 2.30.), and SWIFT (figure 2.31.). The following table presents some of
the plug-ins available in Grasshopper, associated with the type of analysis they perform.
Fig. 2.29. Plug-ins for Grasshopper that connect it to analysis tools (left) and modeling tools (right).
Fig. 2.30. Structural analysis using
Karamba3D.
Fig. 2.31. Wind analysis using
SWIFT.
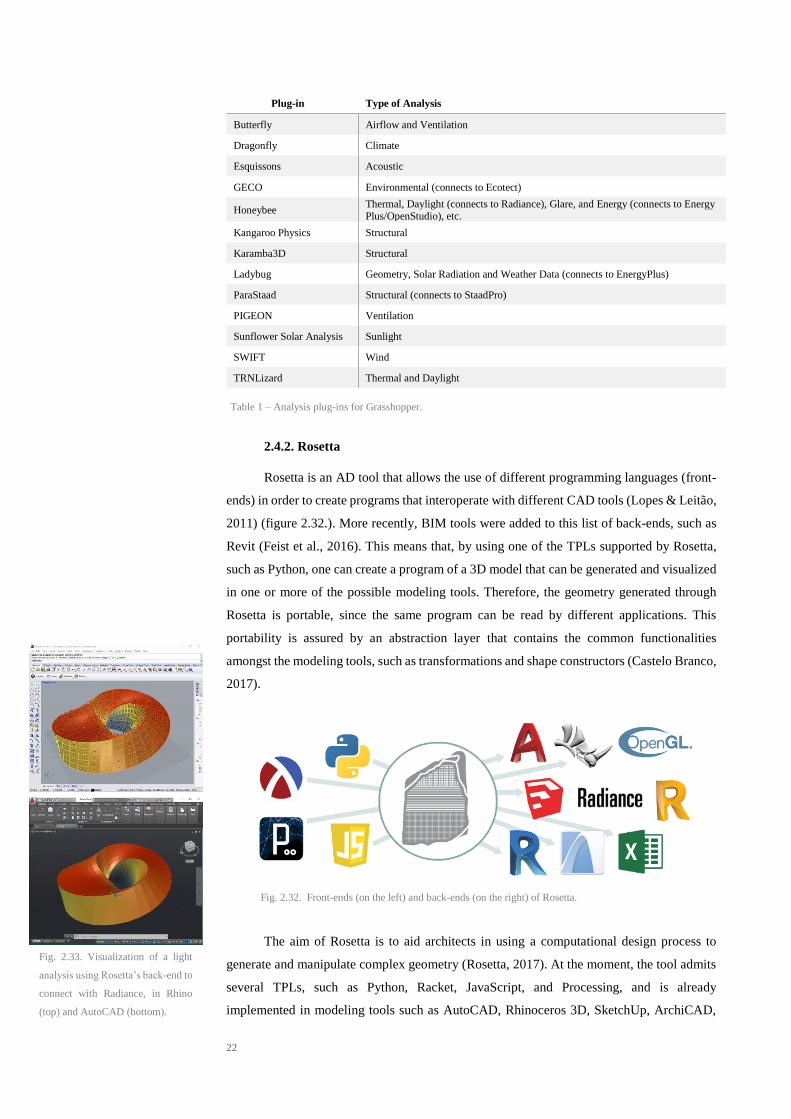
22
Plug-in Type of Analysis
Butterfly Airflow and Ventilation
Dragonfly Climate
Esquissons Acoustic
GECO Environmental (connects to Ecotect)
Honeybee Thermal, Daylight (connects to Radiance), Glare, and Energy (connects to Energy Plus/OpenStudio), etc.
Kangaroo Physics Structural
Karamba3D Structural
Ladybug Geometry, Solar Radiation and Weather Data (connects to EnergyPlus)
ParaStaad Structural (connects to StaadPro)
PIGEON Ventilation
Sunflower Solar Analysis Sunlight
SWIFT Wind
TRNLizard Thermal and Daylight
2.4.2. Rosetta
Rosetta is an AD tool that allows the use of different programming languages (front-
ends) in order to create programs that interoperate with different CAD tools (Lopes & Leitão,
2011) (figure 2.32.). More recently, BIM tools were added to this list of back-ends, such as
Revit (Feist et al., 2016). This means that, by using one of the TPLs supported by Rosetta,
such as Python, one can create a program of a 3D model that can be generated and visualized
in one or more of the possible modeling tools. Therefore, the geometry generated through
Rosetta is portable, since the same program can be read by different applications. This
portability is assured by an abstraction layer that contains the common functionalities
amongst the modeling tools, such as transformations and shape constructors (Castelo Branco,
2017).
The aim of Rosetta is to aid architects in using a computational design process to
generate and manipulate complex geometry (Rosetta, 2017). At the moment, the tool admits
several TPLs, such as Python, Racket, JavaScript, and Processing, and is already
implemented in modeling tools such as AutoCAD, Rhinoceros 3D, SketchUp, ArchiCAD,
Table 1 – Analysis plug-ins for Grasshopper.
Fig. 2.33. Visualization of a light
analysis using Rosetta’s back-end to
connect with Radiance, in Rhino
(top) and AutoCAD (bottom).
Fig. 2.32. Front-ends (on the left) and back-ends (on the right) of Rosetta.

23
and Revit (figure 2.33.). Besides modeling tools, Rosetta was extended to interact directly
with some analysis tools, namely Radiance – for thermal and light analyses (Leitão, Castelo
Branco, & Cardoso, 2017), and Robot – for structural analysis (Aguiar, Cardoso, & Leitão,
2017).
This integration brings many advantages, such as the ability to extract from a single
program the information needed for more than one analysis tool – avoiding the time-
consuming task of creating a specific analysis model for each analysis needed. Furthermore,
the direct articulation between tool and program guarantees that there is no loss of
information (figure 2.34.), which reduces errors of misinterpretation of the analyzed model,
also avoiding the generation of unreliable information.
After receiving these results, the architect becomes able to make more informed
decisions when adjusting the design to have better performances (figure 2.35.), a process that
can also be automatized using optimization algorithms. Optimization within this
methodology includes the automated generation of the same model, only varying a specific
parameter or group of parameters – within a range of values given by the architect – and the
immediate assessment of each one.
2.4.3. Khepri
Khepri is an algorithmic design tool whose development was based on Rosetta,
revising the way users interact with it (Algorithmic Design for Architecture, 2018). It also
allows the creation and manipulation of geometric data in CAD and BIM tools through a
program written in a TPL, Julia.
Khepri is still in early development, constituting the base of an ongoing project with
the ultimate goal of surpassing Rosetta’s features and implementing new methodologies to
bring the tool closer to the user, in this case, the architect. Moreover, the tool is also
expanding for the analysis realm, as it is being developed with new implementations for
different analysis tools.
Currently, Khepri allows a model to be generated in AutoCAD, Rhino, and Revit and
assessed through Robot, a structural analysis tool, and Radiance, a lighting analysis tool.
2.5. Programming Languages Applied to Architecture
A programming language is more than just a means for instructing a computer to perform
tasks: it is a formal medium for expressing ideas (Abelson & Sussman, 1996), just like a
drawing. In architecture, PLs allow the implementation of algorithms in order to take
advantage of computers and generate the intended design in a modeling tool (Leitão &
Proença, 2014). Nevertheless, it is difficult to create an architectural project using AD
methodologies without resorting to drawings as the first approach to the design (figure 2.36.).
Fig. 2.34. Light analysis using the
Diva-for-Rhino plug-in for
Grasshopper (left) and using
Rosetta’s back-end connection with
Radiance (right).
Fig. 2.35. Use of the results of the
light analysis to inform the design.
Fig. 2.36. Design process of the
dome of the Reichstag, the New
German Parliament, by Foster and
Partners, Berlin, Germany, 1999.

24
Both drawing and programming are tools to materialize an idea, and architects choose
the one that best fits their needs according to the stage of development of a project. After the
first conceptual phase of drawings and sketches, instead of manually modeling the project in
CAD and BIM tools, the algorithmic approach is an answer for a more efficient way of
working, since it enables architects to structure parametrically their idea, to explore design
variations (figure 2.37.), and to avoid time-consuming and error-prone tasks. What remains
to be answered is which programming languages best suit the field of architecture.
Even though some publications mention that, as demonstrated in several comparative
studies on VPLs and TPLs, there is no compelling evidence regarding their relative
advantages (Menzies, 2002), nowadays, there is an overwhelming tendency for the use of
VPLs over the use of TPLs among architects. One possible explanation is the visual nature
of the discipline that leads architecture to gravitate towards more visual ways of
programming, in which designers are given visual feedback to help understand what a
program does (Austin & Qattan, 2016). Grasshopper is the most deserving representative of
its group, featuring several mechanisms that are undeniably user-friendly. Clarisse and Chang
also concluded that visual programming environments use information in a format closer to
the user’s mental representations of problems, besides allowing data to be processed in a
similar manner that objects are manipulated in the real world (1986). Furthermore, Menzies
mentions the work of Hirakawa and Ichikawa (2002) to transmit the advantage of using visual
expressions as a means of communication, since it circumvents the need of learning
computer-specific concepts, managing a user-friendly computer environment that non-
specialists can easily use.
Another reason for VPLs’ success is in the notorious time and care invested in the
development of the current VPLs for architecture, as well as in the intention and target to
whom they were created, e.g., Grasshopper, for example, was specifically developed inside
a CAD tool to offer architects a more approachable alternative to RhinoScript. Other authors
such as Boeykens and Neuckermans defended that programming should take part of the
architect’s curriculum, albeit not necessarily by writing code (2009), proposing VPLs as a
solution.
This overall propensity can also be associated with the fact that the first TPLs that
were made available for AD, such as AutoLISP, were not adapted to less experienced users.
However, modern TPLs already provide a variety of linguistic features that are designed to
surpass the limitations of traditional TPLs, becoming hypothetical competitors to VPLs
(Leitão, Santos & Lopes, 2012).
As mentioned previously, Grasshopper provides a series of features that make it very
appealing for beginner programmers: interactive sliders; immediate feedback (figure 2.38.);
traceability - that enables the user to select a component from the program and see what it
generates in the CAD tool (figure 2.39.); an interactive environment; color paneling;
Fig. 2.37. Design variations of the
elements of a façade.

25
organizational features; and components with visual graphs and gradients (figure 2.40.),
among others.
Nonetheless, most of these characteristics fail when the project becomes complex.
Besides, if outsider practitioners try to read a Grasshopper program with some degree of
complexity, they most certainly will struggle to understand it (figure 2.41.). Moreover, its
simplicity does not include sophisticated abstractions, which usually leads to the overuse of
copy and paste mechanisms, introducing redundancy. In turn, “redundancy leads to
maintenance problems because modifications in duplicated components must be manually
propagated to all instances” (Leitão, Santos & Lopes, 2012, p. 143), resulting in small-sized
programs that usually are not developed in detail for later phases of the projects.
Albeit programs created in Grasshopper do achieve interesting aesthetic results, their
explanatory power is limited, as the program that is being illustrated rapidly becomes too
large and confusing (Leitão, Lopes & Santos, 2014). This happens not only due to the features
of the programming language – and the visual illegibility of countless boxes connected with
wires – but also because of the structuring and organizational mechanisms, that are not
intuitive or easy to use.
One answer to this problem might be in using a TPL for AD. In Schaefer (2011)
testimony, he described the use of a VPL to create a program as a trial-error process. He
confessed that he only believed he had found a solid response to his intentions when he used
an icon that allowed the insertion of textual code, a process that, ultimately, he described as
“cheating” (Schaefer, 2011). This comes to support other lines of thoughts such as Austin
and Qattan (2016) that determine that if architects want to deal with complex algorithms,
they need to move past visual programming and immerse in core programming fundamentals.
AD is reaching a point where the programs are increasingly more complex, being
important to start developing good tools for both program documentation and comprehension
(Leitão, Lopes & Santos, 2014). Luckily, some TPLs already have a considerable application
in AD, being available in several generative design tools, such as Python for RhinoPython
and Rosetta, and Julia for Khepri.
In order to combine the advantages of VPLs and TPLs, a lot of effort has been made
towards the implementation of visual features in environments that use textual programming.
Rosetta, for instance, has already implemented features like sliders to easily vary the
parameters. Furthermore, it already surpassed the capabilities of the current VPLs for
Fig. 2.39. Traceability in
Grasshopper.
Fig. 2.38. Immediate feedback in Grasshopper.
Fig. 2.42. Luna Moth editing
interface.
Fig. 2.41. Grasshopper program
with medium complexity.
Fig. 2.40. Color mapping in
Grasshopper using visual gradients.

26
architecture, by extending the spectrum of front-ends and back-ends in a single tool, making
it easier for the architect that solely needs to master one TPL to produce geometries in more
than one CAD or BIM tool. Another example is Luna Moth (figure 2.42.), an Integrated
Development Environment (IDE) for AD that is available on the web, demonstrating the
relationship between a program and its results (Alfaiate & Leitão, 2017). The visualization
of this relationship is accomplished through user-interaction mechanisms similar to number
sliders (figure 2.43), immediate feedback, and traceability (figure 2.44.).
Even though TPLs are less used by architects, there are more languages within the
textual paradigm that have application in AD that VPLs developed to support the algorithmic
approach to architecture. The following table enumerates and associates the most used
programming languages for AD with the modeling tools they are used in.
Textual Programming Language Modeling Tool
Racket AutoCAD, Rhino, Revit, ArchiCAD, SketchUp (*)
Python AutoCAD, Rhino, Revit, ArchiCAD, SketchUp (*)
JavaScript AutoCAD, Rhino, Revit, ArchiCAD, SketchUp (*)
Processing AutoCAD, Rhino, Revit, ArchiCAD, SketchUp (*)
AutoLisp AutoCAD, Rhino, Revit, ArchiCAD, SketchUp (*)
Julia AutoCAD, Rhino, Revit (**)
RhinoPython Rhinoceros 3D
RevitPython Revit
VisualBasic.NET AutoCAD (plug-in), Revit, Rhinoceros
Ruby SketchUp
C# Revit (plug-in), AutoCAD
C++ ArchiCAD
GDL ArchiCAD
Mel Maya
MAXscript 3ds Max
(*) using Rosetta or (**) Khepri
In addition to the more restricted number of visual languages with application in AD,
each VPL available has a limited range of application, since they were created to operate in
one modeling tool alone. Nevertheless, some languages like Grasshopper already made
available plug-ins that allow the connection of the created program to visualization and
generation in BIM tools, e.g. the Rhino-Grasshopper-ArchiCAD toolset enables the direct
communication to generate BIM models through Grasshopper’s visual scripting interface.
Nonetheless, this answer to these limitations might not be sufficient to increase the
advantages of the use of VPLs for complex programs.
Visual Programming Language Modeling Tool
Grasshopper Rhino
Dynamo Revit
GenerativeComponents Microstation
Table 2 – VPLs and TPLs applied to AD and the correspondent modeling tools.
Fig. 2.43. Luna Moth’s click and
dragging feature to vary the value of
the parameters.
Fig. 2.44. Bi-directional
traceability: select a geometry in the
tool and is highlighted the part of
code that generates it (right); select
a part of the code and it is
highlighted the geometry it
generates (left).

27
On the other hand, AD tools such as Khepri do offer true opportunities in facilitating
the programming process for architects. Regardless of the initial time taken to learn and
master a textual language, this effort is quickly offset by the features of these tools. In
addition, Khepri is in current development in an effort to connect to more visualization and
analysis tools, enabling a safer and more lossless information transfer and ensuring reliable
information to improve the project’s performance.
Nowadays, sounding references in contemporaneous architecture have been
challenging themselves to build and think increasingly complex projects. Worldwide famous
architectural studios such as NBBJ, Zaha Hadid Architects, Gehry and Associates, Herzog &
the Meuron, and Foster + Partners are just some of the names that have created great buildings
with complex geometry and optimized performances. These studios have already
incorporated algorithmic methodologies in their design processes, since they recognize that
the answer for the increasing demands for formal innovation and performance-driven systems
could not be in conventional work methods and tools such as BIM packages (Miller, 2011).
The use of AD undoubtedly brings advantages to the design process. Within the
context of an architectural studio, one of the biggest advantages of AD is in facilitating
collaboration between different parties involved in the construction of the same program.
This possibility becomes crucial in a world emerged in an era of internationalization, in which
is valued not only the contributions of professionals from various fields, but also the ability
to efficiently communicate between different parts of the world.
The following sections present some architectural studios that incorporate AD in their
practices, as well as some of the projects that benefited from this approach.
2.5.1. NBBJ
NBBJ is an innovative architecture firm with an international team that also includes
professionals of different areas besides architecture, contributing to a varied, complete, and
more informed work dynamic.
NBBJ signed many known projects of large scale and impact, such as Rainier Square
Tower (figure 2.45.), the reinvention of Rupp Arena (figure 2.46.), and the Xiamen Eton
Center (figure 2.47.). The Hangzhou Tennis Center (figure 2.48.) is one of the most
significant parametric buildings in the world and has already been documented, discussed,
and the subject of studies, such as The Hangzhou Tennis Center - A Case Study in Integrated
Parametric Design (2011), by Nathan Miller. As the name suggests, the author approaches
the design methodology applied to the design process of the shell of one of the stadiums
inside the sports complex, explaining that an integrated parametric system was created to
conceptualize, document, and simulate the complex geometric systems (Miller, 2011).
The project not only benefited from algorithmic approaches in the conception of the
formal behavior of its shell, but also in the assessment of the structural performance through
Fig. 2.46. Reinvention of Rupp
Arena by NBBJ, KY, USA,
unknown date.
Fig. 2.47. Xiamen Eton Center by
NBBJ, Xiamen, China, under
construction.
Fig. 2.45. Rainier Square Tower by
NBBJ, Seattle, USA, under
Fig. 2.48. Hangzhou Tennis Center
by NBBJ, Hangzhou, China, 2013.

28
structural simulation tools (figure 2.49.). The studio chose to work with Grasshopper and
Rhino within the AD methodology (figure 2.50), recognizing the necessity of designers to
search for novel processes that are able to extend and overcome the limitations of the standard
tools available for architects.
Therefore, a parametric algorithm was created and expanded to include some
integrated capabilities, such as the definition and control of the variables of the design, the
efficient test of alternatives, and the production of analysis-ready structural models (Miller,
2011). NBBJ also mention the importance of cost control and minimization of waste,
something that could only be accomplished with such efficiency through AD (NBBJ, 2018).
Moreover, one of the biggest challenges of coordinating projects with international teams is
in the collaboration process, a difficulty that was also answered through the algorithmic
methodology, since working with PLs allowed the creation of algorithms to coordinate
information within the team of collaborators and external documentation tools.
2.5.2. Zaha Hadid Architects
Zaha Hadid Architects (ZHA) is one of the most recognizable architectural studios
worldwide due to the impact, innovation, and audacity of their creations. The type of projects
they design, in most of the cases, truly benefits from algorithmic approaches, since they are
characterized by their organicity, patterns, receptiveness, scale, and complexity. Examples of
that are the projects of Galaxy SOHO (figure 2.51.), the proposal for the Szervita Square
Tower (figure 2.52.), and the Heydar Aliyev Center (figure 2.53.).
The Morpheus Hotel (figure 2.54.) was the subject of multiple discussions,
publications, and seminars due to the innovation within the used AD approach. The greater
interest in this project is in the modeling of the façade that has three different behaviors: flat,
single-curve, and free-form (Heijden, 2017, Feb. 8, figure 2.55.). Therefore, it was imperative
to have a close collaboration with structural engineers and other specialists in order to
accomplish a design that would not be disassociated from the architect's idea, but rather meet
all feasibility and safety requirements.
The team presented the design process in the webinar The Morpheus Hotel: from
Design to Production (2017), involving speakers from both the architecture studio and the
Fig. 2.51. Galaxy SOHO by Zaha
Hadid Architects, Beijing, China,
2012.
Fig. 2.53. Heydar Aliyev Center by
Zaha Hadid Architects, Baku,
Azerbaijan, 2012.
Fig. 2.52. Szervita Square Tower by
Zaha Hadid Architects, Budapest,
Hungary, to be confirmed.
Fig. 2.49. Using Kangaroo physics
engine to visualize gravity loading
on the truss centerline model of the
Hangzhou Tennis Center.
Fig. 2.50. Compilation of the workflow using an AD approach in the Hangzhou Tennis Center.

29
façade consultants. One of the most interesting testimonials on the subject was Ramon Van
der Heijden’s, a computational design specialist at the façade consultants Front Inc. that also
worked in this project. During his participation in the webinar, Ramon puts into perspective
the limitations of Grasshopper, saying that, even though the tool is pretty good in processing
complex geometry, “scale becomes an issue” (Heijden, 2017, Feb. 8; figure 2.56.) when there
is the need to work with models with the complexity of the Morpheus Hotel. The alternative
he introduces to the problem of large Grasshopper programs is dissection: the program
becomes simpler with the use of modulation tools, such as clusters, that group large portions
of the program into components. Thus, the program becomes a set of components, so that the
whole model is a giant network linking smaller models. This facilitates collaborative work,
as was imperative for the development of this particular project.
Besides being applied to the virtual generation of the model, the AD approach also
aided the fabrication phase, since the programs created in Grasshopper were used in the
conception of the pieces that structured the façade. The final 3D model represents a set of
inputs that not only generates the final design but also, and simultaneously, generates the
fabrication data, producing automatically hundreds of thousands of fabrication drawings.
This is one example of an architectural project where, in the words of one of the
webinar’s speakers, Miron Mutyaba, senior designer at ZHA, “the use of parametric tools
became an absolute necessity”, since the “manual modeling was not an option” (Heijden,
2017, Feb. 8). This same line of thought is shared by Heijden, who stated that “traditional
BIM is not a viable option”.
Even though the Morpheus Hotel was programmed using Grasshopper, a VPL, the
fabrication phase required the use of textual programs, in order to ensure that the documents
fabricated would result in the correct parts.
2.5.3. Gehry and Associates
Frank Gehry (1929 - ) is mostly known for “using bewildering postmodern shapes to
challenge the modern architectural design paradigm by snubbing the doctrine of ‘form
Fig. 2.54. Morpheus Hotel by Zaha
Hadid Architects, City of Dreams,
Macau, 2018.
Fig. 2.55. Different façade
typologies: flat (white), single-
curved (red) and free-form (blue and
pink).
Fig. 2.56. Grasshopper program that modeled Morpheus Hotel, illustrating Ramon’s
statement “scale is an issue”.
Fig. 2.57. The Barcelona Fish
sculpture (or El Peix) by Gehry and
Associates, Barcelona, Spain, 1992.

30
follows function’” (Wu et al., 2016). He is considered one of the most influential architects
of the 21st century for inventing a new language, as he could not prescind the computer to
design his buildings (Bennis, 2003).
It is mainly on this matter that the studio Gehry and Associates stands out, also
introducing a name that was crucial for the introduction of parametric modeling to the
architecture industry: Rick Smith. Smith was a CAD technician that worked with CATIA2 in
the aerospace industry. According to Daniel Davis (2013), he was hired in 1991 by Frank
Gehry to help in the design of the sculpture El Peix for the 1992 Barcelona Olympics (figure
2.57.) using CATIA, which represented one of the first applications of software of this caliber
in the architectural practice.
This partnership between Gehry and Smith ended up lasting over a decade, with the
employment of parametric modeling in the design process of the studio, including other
prominent works, such as the Guggenheim Bilbao (figure 2.58.) and the and the Walt Disney
Concert Hall (figure 2.59.) (Davis, 2013). The collaboration was so successful that led to the
foundation of Gehry Technology in 2001, where the developed work included not only the
generation of parametric models of the architectural projects of Gehry and Associates, but
also in the development of CATIA in order to be more easily used by architects.
Frank Gehry is undoubtedly recognized by his close interest in computational
processes that aid to develop an architectural project. However, and above all else, he is
passionate for his drawings (figure 2.60.) and physical models. In fact, every building
imagined by the architect is firstly sketched in the paper, with “a sense of off-hand
improvisation, of intuitive spontaneity” (Knight, 2012, Sep. 7).
2.5.4. Foster + Partners
Norman Foster (1935 - ) is a prominent architect known for his innovative structural
designs that also saw in computation for architecture a way to extend the expression of his
intentions and the materialization of his ideas. In some of his research, he states that
“computer screens have already replaced the traditional drawing board and some of the most
fundamental aspects of our profession are changing as a result of this technology” (Foster,
2003, p. 1). Foster is also known for his environmental awareness, defending the fast
development of these digital tools to allow the execution of many concepts and ideas
previously explored that were not possible to accomplish before.
Furthermore, Foster (2003) refers to the proposed project of the Millennium Tower
(figure 2.61.) to explain the integration of computational methodologies in architecture to
develop more sustainable projects. The creation of a virtually self-sufficient and self-
sustaining building could be a utopia a few years ago, although the architect believes that, in
the present day, all technological means are available to build projects alike.
2 CATIA – Computer-Aided Three-Dimensional Interactive Application.
Fig. 2.58. Guggenheim Bilbao by
Gehry and Associates, Bilbao,
Spain, 1997.
Fig. 2.59. Walt Disney Concert Hall
by Gehry and Associates, Los
Angeles, USA, 2003.
Fig. 2.61. The Millennium Tower
by Foster and Partners, Tokyo,
Japan, unbuilt.
Fig. 2.60. Drawing of Guggenheim
Bilbao by Frank Gehry, design
sketch of the riverfront elevation,
1991. Exposed at LACMA, LA.

31
Another example mentioned by the author is the headquarters building for the Greater
London Authority, also known as City Hall (figure 2.62.). The shape of the building was also
generated as a result of digital analysis with the aim to reduce the energy needs of the building
(Foster, 2003), and manipulated to obtain an optimum performance by reducing the façade
area exposed to direct sunlight.
Foster emphasizes that the technological and computational developments applied to
architecture allowed greater efficiency in obtaining optimum results regarding the
performance and sustainability of large buildings. Another exemplary building is the
headquarters of Swiss Re (figure 2.63.). Foster + Partners counted with the collaboration of
ARUP to develop the structure, that explained that 3D computer modeling was used
extensively in the dimensioning of the steel frame structure, allowing the architect to
coordinate this design process (ARUP, 2018). Moreover, the use of computation facilitated
the transition from the drawing board to the fabrication phase, simplifying the process of
obtaining crucial technical information to build the project. Furthermore, Foster refers to
parametric modeling as the technique that enables that efficiency, since any element of the
design can be amended and automatically regenerate the model according to those changes.
2.5.5. UNStudio
UNStudio is an international architectural firm that is currently based both in Europe
and Asia. They are known for their organic and large-scale projects, whose development also
relies on programming approaches. Examples of that are the Raffles City Hangzhou (figure
2.64), Lane 189 (figure 2.65), and the Westfield White City (figure 2.66.).
There are already several studies and publications authored by some members of
UNStudio regarding their project methodologies, being one of the most recent the
international presentation of Harlem Miller (2018) about knowledge sharing and the
education of future generations of architects concerning the world of computation and
programming for architecture. The paper describes the formats used to share and acquire
knowledge within the firm, mentioning several courses in software workflow, parametric
design and scripting, and geometry rationalization (Miller, 2018). Additionally, UNStudio
provides custom tooling to their team of architects and other specialists, where PLs such as
Grasshopper (figure 2.67.), Dynamo (figure 2.68.), and Python are used to generate
customized tools that are distributed within the office to perform specific tasks.
Therefore, the choice of the software and other modeling and programming tools is
key to establish the workflow of a project, being one of the priorities at the beginning of its
development. This is well illustrated with the case study of the Wasl Tower (figure 2.69.),
which primary objective was to simplify both digital and manufacturing workflows and,
therefore, achieve a greater design quality, work efficiency, and coordination between project
phases and teams (Miller, 2018).
Fig. 2.65. Lane 189 by UNStudio,
Shanghai, China, 2016.
Fig. 2.63. Headquarters of Swiss Re
(the Gherkin) by Foster and
Partners, London, UK, 2004.
Fig. 2.64. Raffles City Hangzhou by
UNStudio, Hangzhou, China, 2017.
Fig. 2.66. Westfield White City by
UNStudio, London, UK, 2018.
Fig. 2.62. Greater London Authority
(City Hall) by Foster and Partners,
London, UK, 2002.

32
The project of the Wasl Tower was developed using different modeling and
programming tools: (1) the base geometry was modeled using the native design software of
the studio, Rhino, that would then be used to (2) feed secondary geometry rationalization
plug-ins in Grasshopper to finally (3) be pipelined into documentation tools such as Revit.
For projects such as the Wasl Tower, whose façade is composed by a repetitive
element that suffers a transformation, it is crucial that not only repetitive tasks are automated,
but also that it becomes possible to assess the generated geometry in order to get information
on its performance and feasibility (figure 2.70.).
UNStudio has shown in their built projects, proposals, and international publications
that they not only rely on computational and programming methodologies to develop their
workflow dynamics within the architectural studio, but they also emphasize the importance
of developing and transmitting this new technological knowledge to the new generations of
architects to come. This reinforces the preponderant role of programming approaches and
tools to develop more reliable and ambitious projects, with better performances and built
results.
Fig. 2.69. Wasl Tower by
UNStudio, Dubai, UAE, under
construction.
Fig. 2.68. Part of the Wasl Tower
project modeled in Dynamo.
Fig. 2.70. Result of custom scripting components that highlight the variation of elements of the
façade.
Fig. 2.67. Design process of a façade system using PLs. Left: scripted closed polysurface. Middle:
Grasshopper program. Right: documentation generated in Revit.

33
3. Characterization of Programming Languages in
Architecture
In order to better comprehend the specific criteria that we will assess to compare the current
use and application of VPLs and TPLs for architecture, we will first contextualize the
classification of programming languages in general.
To do so, we will introduce and define four main concepts that characterize PLs and
that are related to their appeal in terms of performance and ease of use in architecture: (1)
computational power, (2) performance and efficiency, (3) expressive power, and (4) user
interface features. Moreover, there is a fifth aspect in the process of programming geometry,
whose analysis depends on all the criteria mentioned before: the (5) limit of complexity that
is supported by the program, while maintaining all the features and mechanisms provided by
the language.
3.1. Computational Power
The computational power of a programming language is the measurement of the complexity
of the problems that can be described using that language (Leitão & Proença, 2014).
Logically, if the programming language handles the generation of an extremely
complex program, it is characterized by high computational power. However, it has already
been proven that most PLs are Turing-complete, being built and maintained to deliver full
computational power, which means that all of them should be able to solve all the problems
that they are instructed to solve.
Therefore, computational power, even though is an aspect that is included in the
characterization of a programming language, it is not a differentiator, as opposed to other
characteristics, such as performance and expressive power.
3.2. Performance
Even though PLs are expected to have the same computational power, since they all must be
able to process instructions of all levels of complexity, what may differ between them is the
time they take to perform that same instructions, i.e., its efficiency.
Performance defines the efficiency with which PLs compute an instruction. The faster
the language can process the information given in order to solve a problem, the better its
performance is. Thus, if two programming languages compute the same program at different
speeds, they have different performance levels.
Therefore, we can also relate the performance level of a PL to its appeal, since it is
preferable to choose a faster language to compute a given instruction.

34
3.3. Expressive Power
The expressive power of a programming language, as the name suggests, reflects the ability
and ease of expressing ideas using that PL. In other words, it can be understood as a
measurement of the breadth of ideas that can be described in that language (Leitão & Proença,
2014). Hence, it is dependent on the features of the language in terms of the abstraction
mechanisms it provides to define those ideas through algorithmic descriptions, being also
related to the human effort that is needed to describe them (Leitão & Proença, 2014).
These abstraction mechanisms provided by some PLs help to reduce the complexity
of the defined ideas, supporting the creation of concepts by solely focusing on a single type
of property of the things that are perceived (Nederveen, Bakkeren, & Luiten, 1993). For
instances, potentiation is an abstraction of a succession of multiplications, representing a set
of operations in one single and simple expression.
An important example of an abstraction mechanism, usually associated to TPLs, are
higher-order functions, which allow to only implement the part of a certain computation that
is common, leaving the variable parts of that computation to be implemented as functions
that are inputted as parameters of the abstraction. In other words, higher-order functions are
functions that receive other functions as arguments or return functions as a result.
In VPLs such as Grasshopper, the abstractions provided by the language are visually
represented and manipulated through boxes and connections between them (figure 3.1. and
figure 3.2.). The lack of flexibility in building algorithms through these abstractions is a
disadvantage of VPLs, since the user can only use the predefined abstractions, that are not
editable. This limitation can be surpassed by more experienced users through the use of
textual programming inside the visual program.
In sum, the more mechanisms a language provides, the easier it is for the user to
implement complex ideas in a program and, thus, the greater is its expressive power.
Fig. 3.2. Complex program in a VPL,
Grasshopper.
Fig. 3.1. Simple program in a VPL, Grasshopper.

35
The following sections of this thesis will reflect and demonstrate the practical
meaning of the expressive power of a language by comparing the intuitive abstractions
available in VPLs for architecture with the flexibility of programming mechanisms of TPLs
that allow the architect to create those abstractions from scratch (figure 3.3. and figure 3.4.).
3.4. User Interface Features
As architects, we value an intuitive and appealing work environment. The user interface is
the digital environment in which we work with certain software or computational tools, i.e.,
the communication area between the user and the computer. This feature is completely
different in VPLs and TPLs, since VPLs benefit from a graphical user interface, while TPLs
offer a textual user interface.
In VPLs such as Grasshopper, the visual user interface works with a drag-and-drop
system of visual elements and connections (figure 3.5.). The programming environment
represents a canvas where the architect freely distributes the icons, taking advantage of
several features to organize the program, such as alignment and grouping mechanisms;
customizable features, such as names and colors; and the visualization features for the
representation of the icons and their connections.
Regarding TPLs, the user interface offers fewer appealing features, being also more
constraint to the strict syntax of the used language (figure 3.6.). Nevertheless, it aids the
architect by recognizing the structure of what is being typed and anticipating and identifying
specific parts of the program, such as the beginning of the definition of a function, the use of
comments in the program, and conditional terms such as if and else (that become highlighted
in a different color).
Fig. 3.5. Grasshopper’s visual user interface. Fig. 3.6. Khepri’s textual user interface.
Fig. 3.4. Part of a complex
program in a TPL, Python.
Fig. 3.3. Simple program in a TPL, Python.

36
The user interaction with the programming language will also be an essential criterion
for the understanding and comparison between VPLs and TPLs that we propose to fulfill in
the next sections.
3.5. Limit of Complexity
The limit of complexity is not a linear criterium, as it cannot be quantifiable nor qualifiable.
The complexity of a program in a VPL can be proportional to the number of components and
connections – and usually, a visually complex program is a heavy program to compute.
However, there are cases where the computational power needed to process a certain
component, and generate the outputs associated, is bigger than the one needed in a modest
group of components.
We define that the limit of complexity is a characteristic of a program, as it is
noticeable whenever a program starts to crash or not giving an immediate response to the
requests or to the alteration of parameters within the correspondent paradigm.
With the development of this investigation, we also aim to test this limit of complexity
of current programming languages for architectures, for both VPLs and a TPLs. This
assessment will be demonstrated along with the increasing complexity of the exercises being
solved using both types of languages in order to better identify the moment where the
performance and efficiency of the language start to become compromised.

37
4. Comparative Study between a VPL and a TPL
In order to compare both VPLs and TPLs in their current application for architecture, we will
develop a study both in theory and in practice.
Regarding theory, we will compare both types of languages according to what is
expected of them to offer in terms of features, mechanisms, and performance. To accomplish
that, we will cover each of the most appealing or useful features and mechanisms and describe
the extent of their implementation in current VPLs and TPLs for architecture.
Then, we will assess those characteristics by testing their implementation and
application while programming hypothetical case studies. These case studies will be
organized according to (1) programming mechanisms that aid the generation of geometries,
e.g., mapping and cross references, or (2) common geometric behaviors and structures in
architecture, e.g., attractors and spaceframes.
For this evaluation, we will use Grasshopper as a VPL and, as a TPL, Khepri, a
programming environment that uses the textual programming language Julia, in order to
better explore both paradigms in the context of the architectural practice.
4.1. Theoretical comparison
Both visual and textual programming languages are characterized by features that ease the
programming process for the architect. There are already some publications (Boshernitsan &
Downes, 2004; Burnett & Baker, 1994; Burnett et al., 1995) about the characteristics that
qualify visual programming languages and that bring them closer to the user, as well as
studies (Noone & Mooney, 2018; Eid & Millham, 2012; Green & Petre, 1992, Navarro-Prieto
& Cañas, 2001) that already introduce a comparison between these advantageous
characteristics and others that define TPLs in general.
To analyze the power, qualities, and limitations of both VPLs and TPLs, we will
explain some of the features and mechanisms that they offer. Some of these features are
exclusive to VPLs, while others are better implemented in TPLs. Other cases will be
introduced where some visual features were already implemented for TPLs or, the other way
around, some programming mechanisms inherent to TPLs that were already extended to the
visual realm.
4.1.1. Abstraction Mechanisms
Any programming language should not only provide and allow to combine primitive
data and procedures in order to create more complex ones, but also be able to build abstract
calculation patterns so that they can be treated as simple operations. This mechanism is called
abstraction and is a core concept of programming. For example, potentiation is a

38
mathematical abstraction of a succession of multiplications. Therefore, abstractions simplify
complex ideas.
In TPLs, abstractions are expressions that compute a series of more complex
operations, without the need to expose that complexity. For example, instead of thinking
about the implementation of a function that creates a continuous curve along positions that
are at the same distance r from a central point p, we can use the predefined abstraction
circle(p,r) to create that particular curve.
In VPLs, abstractions are represented by icons, or boxes, in the programming
environment. This is also one of the strongest advantages of VPLs: these icons are predefined
to represent geometry, functions, and other mathematical entities, allowing architects to focus
solely on devising the logic of the geometry of a project, instead of concerning about the
intricacies of their implementation. Using the same previous example, in Grasshopper the
icon, or component, Circle CNR receives as input a center point, a normal, and a radius,
returning a circle as output.
4.1.2. Number Sliders and Boolean Toggles
Number sliders and Boolean toggles are visual mechanisms that allow to easily
change the value of an input. Both mechanisms are represented in VPLs by boxes, where the
user can, click and drag along to increase or decrease a numeric value, or double click to
alternate between Boolean values (figure 4.1.).
There is already some research that accomplished the implementation of similar
mechanisms inside the textual programming environment. As mentioned, Luna Moth
(Alfaiate et al., 2017) provides user-interaction mechanisms similar to Grasshopper’s sliders
where, instead of clicking and dragging, the user scrolls with the mouse over the value of the
parameter in the program in order to change it.
4.1.3. Immediate Feedback
Immediate feedback allows the user to visualize in the modeling tool and in real time
what is being created and changed in the programming environment. Regarding VPLs,
languages like Grasshopper enable the programming and modeling windows to co-exist in
the monitor, facilitating the visualization of this feature. Other VPLs such as Dynamo, create
a visualization environment inside the programming window that also allows the user to
benefit from immediate feedback.
In what concerns TPLs, there is some research, such as Processing (Reas & Fry, 2007)
and Luna Moth (Alfaiate et al., 2017), that already succeeded in implementing this feature in
a textual programming environment. Another relevant research worth mentioning is Rosetta
(Lopes & Leitão, 2011), that aims to improve program comprehension through the
Fig. 4.1. Number slider and Boolean
toggle in Dynamo (above) and in
Grasshopper (below).

39
establishment of a correlation between the design and the program, also implementing
mechanisms similar to immediate feedback.
4.1.4. Traceability
Traceability is another feature inherent to VPLs that highlights in the modeling tool
the geometry that is being generated by a selected part or parts of the program. For example,
when the user selects a Sphere component in Grasshopper’s environment, the sphere that it
generates changes color in the modeling tool.
Once again, the textual programming environment Luna Moth (Alfaiate et al., 2017)
not only was able to implement this visual feature in the textual paradigm but also surpassed
its current implementation in VPLs by being bi-directional. This means that it allows the
selection of a part of the program to highlight, in the modeling tool, the geometry it generates,
but it also enables the selection of geometry in the modeling tool to highlight the part of the
program that generates it. Rosetta (Lopes & Leitão, 2011) goes even further, extending the
concept of bi-directional traceability by allowing the visualization of the control flow of the
program, highlighting in the program not only the parts that generate a selected geometry but
also identifying the order followed by the computer and the decisions it made while
computing the program’s instructions (figure 4.2.).
4.1.5. Recursion
Recursion is a programming abstraction mechanism that allows a function to invoke
itself during its own evaluation, a feature that is inherent to many TPLs. Recursion is
considered one of the most important programming mechanisms, since complex problems
might have a very simple recursive solution. Usually, in TPLs recursion requires a
conditional form: if A, then B, else C, where A is the conditional, B is the base case that has
an immediate result, and C is the recursive case that turns the original problem into a simpler
subproblem. Exponentiation is a typical mathematical problem that can be solved through
recursion.
Supposedly, while using a VPL, recursion would correspond to a component whose
output would feed the input of the same component until the invocations of the function
Fig. 4.3. Error in Grasshopper when
connecting the output of a
component as its input.
Fig. 4.2. Control flow in Rosetta.

40
ended. In its original implementation, Grasshopper does not allow recursion (figure 4.3.),
only supporting this functionality through plug-ins.
4.1.6. Visual Input Mechanisms
Visual Input Mechanisms (VIMs) are inherent to VPLs and they allow the user to
import geometry that was previously produced in a modeling tool as an input to the program.
This feature is particularly helpful when (1) the intended geometry is easier to produce by
hand or (2) when it is necessary to use already existing geometry, e.g., a city plan. It is also
possible to (3) use, as an input to an AD program, geometry that was itself produced as an
output of another AD program, as it happened with the development of the Morpheus Hotel
(Heijden, 2017).
This feature was recently implemented in a TPL as a result of the investigation
developed during this thesis (Sammer, Leitão, & Caetano, 2019; Sammer & Leitão, 2019).
These researches demonstrate the implementation not only of VIMs in a textual context, but
also extends its flexibility in order to: (1) allow or prevent dependency from the modeling
tool and (2) introduce other textual programming mechanisms such as metaprogramming.
Metaprogramming is the use of programs to generate other programs, being utilized in this
research to generate, in the AD program, fragments that represent existing visual inputs.
These fragments, when executed, generate exactly the same visual input that was selected in
the first place. With the implementation of VIMs for TPLs, we were able to conclude that
one of the biggest advantages of TPLs over VPLs is the flexibility of data treatment and
manipulation according to the intentions of the architect.
However, the use of VIMs in the context of textual programming may require
compromising the performance of this interactive visualization. VPLs like Grasshopper
solely generate a temporary visualization of the geometry in the modeling too and, in order
to the program to be generated in the form of geometric data, the user must use the bake
option. Contrastingly, in textual environments such as Khepri, the implementation of these
visual mechanisms is allied to the direct and real-time generation of geometry, which is a
more time-consuming process (Sammer & Leitão, 2019).
4.1.7. Textual programming
Even though VPLs for architecture were developed to cover all the functionalities of
a TPL, they do not have the flexibility to change the abstractions available, i.e., the set of
icons that come with the VPL cannot be altered within their own definition and
implementation. This might lead to situations where the available abstractions are not suitable
for the idea to be generated, which usually leads to very complex programs that combine
several of the available abstractions to program the intended idea. Therefore, VPLs also
provide the possibility of inserting textual code in the program to overcome this problem. For
example, Grasshopper supports languages such as Python, C#, and VisualBasic.

41
More recently, on-going projects such as Möbius (Janssen, Jung, & Chen, 2019)
already considered a hybrid approach to programming, in order to surpass some of the
described limitations of VPLs: they propose, in the context of the mentioned investigation,
to provide customized visual programming environments that enable their users to create
custom-made high-level and domain-specific functions inside a visual programming context.
This approach takes the structure of a VPL and allows the extent of its limitations by
customizing the different components with textual code (figure 4.4.).
4.1.8. Portability
In computation for architecture, a program is considered portable when it is able to
generate the geometry it defines in different modeling and analysis tools.
Even though the most common VPLs for architecture were created inside a specific
modeling tool, e.g. Grasshopper is integrated into Rhino and Dynamo generates geometry in
Revit, this portability can be indirectly achieved through the use of plug-ins. Even though
these plug-ins allow the program to communicate with other modeling and analysis tools,
they can be fallible for projects of greater complexity and not as intuitive to work with as the
most used abstractions within the visual language.
Contrastingly, textual programming environments such as Khepri, already aimed at
this target, allowing a program to be intrinsically generated in a wide range of CAD, BIM,
and analysis tools. Therefore, users simply need to inform the program about the back-end
that they intend to use.
This ability represents a clear advantage for the design process, since the architect can
decide which tools to use according to the main objectives of each phase of the design
process, without the need of dissecting or duplicating the program to fulfill the data needs of
each tool to be used.
4.1.9. Conclusions
From this theoretical comparison, we were able to establish some relative advantages
between VPLs and TPLs.
Visual features and mechanisms in VPLs
We confirm that, in theory, the abstractions, features, and mechanisms provided by
visual approaches are significantly more appealing and intuitive for less experienced
programmers such as architects. Nevertheless, some of these advantages might become
compromised in practice for more complex programs, as we will assess in the following
sections.
Fig. 4.4. Möbius flowchart (above)
and procedure (below).

42
Scalability and flexibility of TPLs
Regarding TPLs in particular, the scalability of programs becomes one of the strongest
advantages of the textual paradigm. This scalability is associated to a high-performance level
that is a consequence of the intrinsic flexibility of the textual approach. Therefore, the user
can build programs that integrate different levels of complexity of the same project, decide
which parts are to be generated through the use of interaction phases, and even generate the
same information in different modeling and analysis tools.
Visual features in TPLs and performance
Furthermore, we were also able to verify that there is already some research that
fulfilled the effort to implement visual features in a textual programming context. However,
and even though projects such as Processing (Reas & Fry, 2007), Luna Moth (Alfaiate et al.,
2017), and Rosetta (Lopes & Leitão, 2011) were able to bring TPLs closer to visual users,
their application ended up being restricted to a scientific and academic context. Therefore,
they ended up not to avenge in a wider industry nor to have effective application in the
processes of developing architectural projects.
Still, the awareness of this gap between theory and practice has been debunking more
focused research on the progress of more sophisticated and robust tools such as Khepri. This
programming environment is also being developed to incorporate the possibility of using
visual mechanisms as a way to bring textual programming closer to architects (Sammer,
Leitão, & Caetano 2019; Sammer & Leitão, 2019).
However, the use of visual features and mechanisms in a textual programming context
may compromise the performance of a program, as we already proved with the investigation
regarding the implementation of visual input mechanisms in Khepri. Therefore, it is up to the
architect whether this direct interaction and use of visual features are relevant to the
programming process or not.
Nevertheless, from this theoretical comparison, we can already conclude that there is
no impediment to the implementation of the most appealing features and mechanisms
inherent to VPLs in a textual programming context. This integration might be an answer to
surpass the barrier between architects and TPLs and facilitate the early stages of the learning
process, allowing a more dynamic and direct visualization and interaction with the modeling
tool in use.
4.2. Practical comparison
In order to validate the analysis of the previous section and draw more informed
conclusions about the effectiveness of the characteristics approached in theory, we will test
what they mean in practice and report the extent of their functionality when creating programs
for architectural designs. The practical comparison will, thus, clarify the extent of the
theoretical advantages by testing the limit of such features and mechanisms.

43
Since we are also looking for the limit of complexity that compromises the use of
VPLs, we adopted a methodology where the problems solved are successively becoming
more complex. The nature and organization of the introduced architectural problems were
inspired by the work of Tedeschi, that spent several years developing exercises in
Grasshopper for his book AD_ Algorithms-Aided Design: Parametric Strategies using
Grasshopper (2014).
Therefore, the challenges are developed both in Grasshopper and in Khepri, in their
current versions. The proposed challenges will also be organized according to the main
objective of the exercise: either to implement a specific programming mechanism or to create
a typically used geometry.
4.2.1. Series
Series is an abstraction that returns a list of values within a given domain. In
Grasshopper, the component that represents this abstraction receives as inputs the first value
of the series (S), the step size for each successive number (N), and the number of values in
the series (C) (figure 4.5.).
Alike Grasshopper, where the Series component is predefined, this abstraction is also
easily implemented in a TPL as follows:
series(start, step, count) =
count == 0 ?
[] :
[start, series(start + step, step, count - 1)...]
This implementation applies a recursion mechanism, explained in the previous
section, that successively computes the start + step expression for each decreasing value
of count, ending and closing the list created when this count value equals zero. Therefore,
the implemented function series() also receives as parameters the starting value of the
series (start), the increment of values (step), and the number of values intended (count).
julia> series(0, 3, 4) 0
3
6
9
This representation in Julia is what we obtained when using the Read-Eval-Print-Loop
(REPL) window of the programming environment. This functionality allows Khepri to
interact with the user while executing this cycle: it waits for an expression or instruction
(represented by the prompt julia>) that then it reads, evaluates, and determines the value
to after return the correspondent result.
Similarly to what happens in Grasshopper, the most frequently used abstractions are
predefined in Julia or within Khepri. That is precisely what happens with the series()
operation that is already available in the programming environment, implemented on top of
Fig. 4.5. Series component in
Grasshopper.

44
Julia's predefined range() function, that receives the length of the list, the stop value, and
the number of values to compute.
4.2.2. Cross Reference
Grasshopper’s Cross Reference component allows the automatic generation of two
lists containing the combinations between the lists given as input (figure 4.6.).
In order to better visualize the results of this programming mechanism, we will
reproduce a simple exercise created by Tedeschi (2014) that generates a square of boxes
(figure 4.7.). The Cross Reference component is, then, used to generate a list of boxes along
the x-axis that is reiterated along a list of positions along the y-axis.
The Grasshopper program goes as follows:
Using Khepri, there is a simpler way to obtain the same results: instead of generating
two independent lists, one with boxes along the x-axis and other with positions along the y-
axis along which those boxes will be iterated, we create a list of lists of positions, i.e., a
matrix. This type of iterations has its most direct implementation in the For Cycle:
for x in series(0,2,5), y in series(0,2,5)
box(xy(x, y))
end
The For Cycle iterates a variable along a list of values. For each value, it evaluates
the body of the For Cycle which presumably depends on the current value of the variable.
However, as we intend to have a more direct comparison between TPLs and VPLs,
we are also able to implement a new abstraction closer to the behavior of Cross Reference,
the crossref() function. This implementation still represents a simpler and more direct
way to achieve the same results as Grasshopper’s, while benefiting from other mechanisms
of textual programming. Therefore, the mentioned function is implemented as follows:
crossref(as, bs) = [(a, b) for a in as, b in bs]
julia> crossref([1,2,3], [4,5,6])
(1, 4) (1, 5) (1, 6)
(2, 4) (2, 5) (2, 6)
(3, 4) (3, 5) (3, 6)
The crossref() function receives two lists and returns a list of tuples (pairs of
values) that cross every element of the first list with every element of the second. Using this
new function, we can rewrite the program that generates the square of boxes as follows:
Fig. 4.6. Cross Reference
component in Grasshopper.
Fig. 4.8. Grasshopper program that generates a grid of cubes equally spaced between them.
Fig. 4.7. Square of boxes.

45
map(crossref([0, 1, 2, 3, 4], [0, 1, 2, 3, 4])) do (x,y)
box(xy(x,y))
end
This exercise is also useful to understand, on a smaller scale, the implications of
making changes to a program, in this case, to accommodate other dimensions. For example,
if, instead of a square of boxes, users want a cube of boxes (figure 4.9.), extending to a third
spatial dimension, in Khepri they solely need to add a third iteration along the z-axis within
the For Cycle we have shown previously:
for x in series(0,2,5), y in series(0,2,5), z in series(0,2,5)
box(xyz(x, y, z))
end
If the user wants to make the same modifications in Grasshopper, for this scale of
alterations, the program complexity also does not increase considerably (figure 4.10.).
In this case, the alterations made were not sufficient to conclude which paradigm
better deals with the cost of change. However, we still need to assess the necessity of
changing a program for more complex projects, where these modifications start to impose
obstacles in the maintenance of visual programs.
4.2.3. Remapping
In Grasshopper, the remapping mechanism is accomplished with the Remap Numbers
component (figure 4.11). This component receives a list of values and returns a list of the
correspondent values remapped into a new domain given as input.
To translate directly this mechanism in the textual form, we implemented the
remap() function that, like the Grasshopper’s component, receives a value inside a source
domain (from the minimum of the domain A to its maximum B) and makes it correspond to
another value inside a target domain (from the minimum of the codomain C to its maximum
D) (figure 4.12.).
remap(value,(A, B),(C, D)) =
C + (D - C)/(B - A)*(value - A)
Considering that this function solely computes one single value, and in order to obtain
a similar result to the one generated in Grasshopper, the textual approach relies on the use of
higher-order functions as follows:
Fig. 4.9. Cube of boxes.
Fig. 4.10. Grasshopper program that generates a cube of cubes equally spaced between them.
Fig. 4.11. Remap Numbers or
ReMap component in Grasshopper.
Fig. 4.12. Illustration of the remap
mechanism: (A) min_domain, (B)
max_domain, (C), min_codomain,
and (D) min_codomain.

46
julia> map(v -> remap(v, (1,6), (0, 12)), 1:6)
0.0
2.4
4.8
7.2
9.6
12.0
The map() function was predefined in Khepri to receive a set of values (in arrays,
tuples, and iterators, among others) and apply to them a given function inside a given domain.
In this particular case, the map()function operates to a list of v values the remap() function
defined to obtain a list of mapped values inside that new target domain.
4.2.4. Cull Pattern
Another useful abstraction is Grasshopper’s Cull Pattern component, that receives a
list of values and a pattern in Boolean values as inputs and returns a list of values filtered by
that pattern. For example, if we associate to the component the pattern [False, False, True],
the output will be the values of the input list with the indexes 3, 6, 9, 12, etc. (figure 4.13.).
The created implementation within Khepri, the cull() function, follows the same
reasoning: we want to define a function that receives a “template” or Boolean pattern and a
list of values, in order to return a list filtered by that input pattern.
cull(template, as) =
[a for (a, t) in zip(as, cycle(template)) if t]
To use such function, the user simply needs to associate a list of Boolean values and
a list of numeric values as follows:
julia> cull([false, false, true], [1, 2, 3, 4, 5, 6, 7, 8, 9])
3
6
9
4.2.5. Basic 3D Geometry and Boolean Operations
Grasshopper also provides geometric abstraction, i.e., that reproduce geometries
parametrically, such as boxes, cones, cylinders, and spheres. However, the implementation
of these abstractions was made within the modeling tool Rhino and, therefore, the geometric
operations of the program mimic the behavior of the tool’s operations. This has consequences
such as the fact that volumes are treated as surfaces and not solids, which might have
implications when performing Boolean operations. The Cylinder component is an example
of this limitation, as the geometry created by the component is merely a surface representing
the curved surface of the cylinder, without the top and bottom bases. In order to close the
cylinder, the user must add another component, the Cap Holes component.
In a TPL implementation, Khepri already provides all these operations and more. The
implemented set of geometric functions include box(), cone(), cylinder(),
regular_pyramid(), sphere(), regular_pyramid_frustum(), cone_frustum(),
Fig. 4.13. Cull Pattern component
in Grasshopper.

47
and torus()(figure 4.14.). Alike Grasshopper’s abstractions, these functions also take
arguments that allow the parametrization of the geometry generated, such as:
cone(centerpoint_base, base_radius, apex_point)
cylinder(centerpoint_base, radius, centerpoint_top)
sphere(centerpoint, radius)
4.2.6. Visual Input Mechanisms
As previously presented, VIMs are a particularly helpful feature provided by VPLs
that allows the user to import geometry that was previously modeled in a modeling tool as
input to the program. With the development of the recent investigations (Sammer, Leitão, &
Caetano, 2019; Sammer & Leitão, 2019), to which this thesis was a contribution, we were
able to extend the implementation of VIMs to the textual paradigm.
These researches also worked as a practical confirmation of some premises
established in theory regarding the relative performance of VIMs within a VPL and a TPL.
Given that languages like Grasshopper are closely linked with the modeling tool they work
with, which allows the visualization of geometry that has not yet been generated, the
portability of textual programs created in Khepri requires that this relationship is necessarily
more restrictive. This means that VIMs within the textual programming context may
compromise the performance of the programs, since the geometry is automatically generated
and regenerated in every iteration, which is a time-consuming computation.
In this case, the implementation of VIMs within Khepri includes a set of predefined
functions, e.g. select_point() and select_surface(), that, when executed, ask the
user to select from the modeling tool the geometry to import. However, this approach does
not establish a dependency between the program and the geometry selected as input, which
means that any alteration in this geometry is not taken into account unless it is reselected. To
achieve dependency, alike Grasshopper, the user must inform Khepri by using other
predefined functions such as with_shape_dependency(), that allows to re-execute
automatically the program whenever the input is changed in the modeling tool.
To evaluate this mechanism, we can go back to the example given in the Cross
Reference section, that already takes advantage of VIMs in Grasshopper. We used two
programs to create a square of boxes and a cube of boxes, where the unit box to be iterated
was imported from Rhino into a Box component. The Box component, however, is quite
limiting because it solely allows storing boxes. If we change that component for the Geometry
component, we can import different types of geometry to be iterated according to the rules
defined in the rest of the program (figure 4.15.).
To achieve similar results in Khepri, we can also reuse the same example where,
instead of defining parametrically the geometry to iterate, the user selects from the modeling
tool the visual input intended after the program is executed.
Fig. 4.14. Solids resultant of the
implementation of geometric
functions in Khepri.

48
template = select_shape()
for x in series(0,2,5), y in series(0,2,5)
move(template, vxy(x,y))
end
4.2.7. Attractor Mechanisms
Attractor mechanisms create a geometrical visual effect where a geometrical entity is
assumed as an attractor, towards which other geometries react according to given parameters.
Some of the built projects that resort to this geometric behavior are the Nanjing International
Youth Cultural Centre by Zaha Hadid Architects (figure 4.16.), the Messe Basel Exhibition
Hall by Herzog & de Meuron (figure 4.17.), and MCM M:AZIT Store by THE
SYSTEM_LAB (figure 4.18.).
A simple example demonstrated in Tedeschi’s book (2014) is a surface of circles,
which radii vary according to the distance between the center of each circle and a
given/imported geometrical entity, e.g. a point (figure 4.19. and figure 4.20.). A built example
of this is the façade of the Quality Hotel Friends by Karolina Keyzer and Wingårdhs (Solna,
Sweden, 2013), where the radii of the grid of circular windows vary according to both the
distance to the attractor and the sine function (figure 4.21.).
This example also illustrates the use of the remapping mechanism explained
previously, as the ReMap component is the one responsible for performing distance-based
transformations using attractors. Therefore, the component is used to remap, in this case, the
distances between each circle and the attractor proportionally to a new domain of given
values (maximum and minimum radii), so that the circles do not cross each other. This new
remapped list of values, that are proportional to the list of distances but inside a new given
Fig. 4.17. Messe Basel Exhibition
Hall by Herzog & de Meuron,
Basel, Switzerland, 2013.
Fig. 4.18. MCM M:AZIT Store by
THE SYSTEM_LAB, Seoul, South
Korea, unknown date. Fig. 4.20. Grasshopper program of an attractor point, that makes the radii of a grid of circles vary
according to the distance.
Fig. 4.15. Three versions of the same Grasshopper program, only varying the geometry
being imported into the Geometry component.
Fig. 4.19. Point attractor influencing
the radii of a grid of circles.
Fig. 4.16. Nanjing International
Youth Cultural Centre by Zaha
Hadid Architects, Nanjing, China,
2018.

49
domain, will then be used as input to the component that will scale each circle according to
their distance to the attractor point.
Using Khepri, we can use some of the programming abstractions previously
presented, such as the For Cycle, to create the grid of circles, and the remap()function, to
remap the radius of each iterated circle according to its distance to the attractor point.
attractor_circles(p, r, count, q, r_min, r_max) =
let ps = [p+vxy(x, y)
for x in series(0, 2*r, count),
y in series(0, 2*r, count)],
dists = [distance(p, q) for p in ps],
domain = extrema(dists)
[circle(p, remap(d, domain, (r_min, r_max)))
for (p, d) in zip(ps, dists)]
end
attractor_circles(xy(1,2), 1, 10, xy(8, 14), 0.01, 0.8)
Even though this exercise illustrates an attractor point, the attractor mechanism can
also use a list of points, a line, or a curve as attractor geometries. In order to accommodate
those changes in the Grasshopper program, the user must alter all the group of components
that are influenced by the nature of the new attractor.
Contrastingly, while using a TPL, the user can take advantage of other mechanisms
that are facilitated with the textual approach. One example is the ability to create a single
program that is able to identify different types of visual inputs according to the type of
selection being made by the user. Therefore, the architect can select (1) one single attractor
point, (2) multiple and separated positions to work as individual attractor points, (3) or
multiple sequential positions that then create an attractor curve (Sammer, Leitão, & Caetano,
2019) (figure 4.22.). After the interaction between the user and the modeling tool, the
program identifies which type of attractor was requested and generates the results
accordingly.
4.2.8. Spaceframes
Spaceframes are a type of structure built from single trusses connected to create a
surface. Even though this structure is commonly hidden inside the envelope of a building,
such as in the Heydar Aliyev Center by Zaha Hadid Architects (figure 4.23.), they can also
be used for their aesthetics, lightness, and transparency, such as in Joe & Rika Mansueto
Library by Murphy/Jahn (figure 4.24.) and the Biosphere, the Museum of the Environment
by Buckminster Fuller (figure 4.25.).
The programming of spaceframes is particularly helpful for more advanced stages of
the design process, mainly when the architect has to deal with structure feasibility. The
generation of a digital model is, therefore, crucial for further computational analysis.
The Grasshopper program used to create a spaceframe includes the analysis of an
imported surface along which the trusses will adapt to. From that analysis, it is able to extract
Fig. 4.23. Space frame of Heydar
Aliyev Center by Zaha Hadid
Architects, Baku, Azerbaijan, 2012.
Fig. 4.22. Different natures of visual
inputs: one point, multiple points, or
a curve.
Fig. 4.21. Façade of the Quality
Hotel Friends by Karolina Keyzer
and Wingårdhs, Solna, Sweden,
2013.

50
the matrix of points along the surface and another matrix of the correspondent apexes, that,
when connected, create a pyramidal mesh (figure 4.27.). Even though the Grasshopper
program that is shown (figure 4.26.) seems visually simple, there are some components used
to accomplish that simplicity that require more advanced knowledge in the programming
language, namely when working with lists.
In Khepri, the definition of a spaceframe can be visually more complex due to all the
abstractions that are created specifically for the creation of the geometry. In this case,
functions such as spaceframe_nodes() and spaceframe_struts() were defined
within the body of the program to then structure the spaceframe() function as follows:
spaceframe(ptss) =
let ais = ptss[1]
bis = ptss[2]
cis = ptss[3]
spaceframe_nodes(ais)
spaceframe_nodes(bis)
spaceframe_struts(ais, cis)
spaceframe_struts(bis, ais)
spaceframe_struts(bis, cis)
spaceframe_struts(bis, ais[2:end])
spaceframe_struts(bis, cis[2:end])
spaceframe_struts(ais, ais[2:end])
spaceframe_struts(bis, bis[2:end])
if length(ptss) == 3 # no nodes left?
spaceframe_nodes(cis)
spaceframe_struts(cis[2:end], cis)
else
spaceframe(ptss[3:end])
spaceframe_struts(bis, ptss[4])
end
end
spaceframe(spaceframe_pts(map_division(in_world,
select_surface(), 10, 10)))
This function receives as input a matrix of points, that can also result from the analysis
of an imported surface, as it happens in the Grasshopper example. This matrix is then
analyzed to extract the nodes’ positions, that are combined to create each strut between them.
Even though the textual approach starts requiring an increased amount of code, it still brings
other advantages regarding the construction of spaceframes, namely by allowing the
flexibility of combining and connecting different positions to generate different types of
spaceframes, e.g., simple linear trusses, crossed bars, etc.
Fig. 4.27. Spaceframe generated in
Khepri.
Fig. 4.26. Grasshopper program of a space frame.
Fig. 4.25. Biosphere, Museum of the
Environment by Buckminster
Fuller, Montreal, Canada, 1967.
Fig. 4.24. Joe & Rika Mansueto
Library by Murphy/Jahn, Chicago,
USA, 2011.

51
4.2.9. Paneling
Paneling is a geometrical mechanism that allows a certain geometrical entity to be
iterated along a surface. This geometrical entity can change according to the functions
imposed to it. Built examples of this mechanism are the façade of the BAD café by Nudes
(figure 4.28.), the Soumaya Museum by FR-EE Fernando Romero Enterprise (figure 4.29.),
and South Australian Health and Medical Research Institute by Woods Bagot (figure 4.30.).
To illustrate the programming of the paneling mechanism, we will reproduce the
proposal for a Sustainable Transit Station Inspired by Matchsticks by Erik Giudice
Architecture (figure 2.31.). A similar exercise was solved by Tedeschi in his book, where the
Grasshopper program (figure 4.32.) first (1) evaluates the geometrical unit to be iterated in
order to (2) create a boundary box that is tangent to that geometry. Then, (3) a grid is
generated over the surface – that, in this case, is a VIM imported from Rhino (see section
4.2.4.), and (4) extruded to create unit “boxes” over the same surface. The boundary box of
the geometrical unit is (5) arrayed over each individual volume of the three-dimensional grid
and (6) distorted accordingly along with the geometry unit.
To replicate the image of the Sustainable Transit Station, we imported from Rhino a
surface and the geometrical unit to be iterated along it (figure 4.33.), both generated manually
in the modeling tool.
Once again, even though the program seems simple in its structure, the components
used are more sophisticated and already require a deeper knowledge of the programming
language. Furthermore, its simplicity is only apparent, considering that it is needed a greater
amount of computation to generate this mechanism, which compromises other appealing
features such as immediate feedback.
When translating this solution to an equivalent in Khepri, there are some limitations
to consider regarding the intrinsic characteristics and specifications of the modeling tool in
use. One limitation is that the modeling tool used for this evaluation, AutoCAD, does not
support non-uniform scaling. Thus, it makes it impossible to distort the element so that it fits
the subdivided surface, as it happens with the Grasshopper program. Furthermore, in this
particular case, we consider that the Grasshopper approach becomes limiting when creating
geometry that is not distorted according to the position inside the surface.
Fig. 4.30. South Australian Health
and Medical Research Institute by
Woods Bagot, Adelaide, Australia,
2013.
Fig. 4.32. Grasshopper program of a paneling and morphing mechanism.
Fig. 4.29. Soumaya Museum by FR-
EE Fernando Romero Enterprise,
Mexico City, Mexico, 2011.
Fig. 4.28. The BAD café by Nudes,
Mumbai, India, 2015.
Fig. 4.31. Proposal for a Sustainable
Transit Station by Erik Giudice
Architecture, Jönköping, Sweden,
unknown date.

52
Khepri already provides mechanisms to iterate a geometry along a surface. This
approach is used, for instance, to model surfaces like the façade of the Retail Store for Regal
Shoes by NUDES (figure 4.34.). Therefore, the pragmatic way of tackling this exercise using
a textual approach would require the definition of the unit element using a function such as
unit_hollow_triangles():
unit_hollow_triangles(p0, p1, p2, p3) =
let f = 0.3,
h = 0.2
extrusion(hollow_triangle(p0, p1, p2, f), h)
extrusion(hollow_triangle(p0, p2, p3, f), h)
end
s = select_surface()
iterate_quads(unit_hollow_triangles, map_division(in_world, s, 10, 10))
The unit_hollow_triangles() is, therefore, responsible for the generation of
one geometrical unit similar to the one modeled by hand in the Grasshopper example (figure
4.33.), with the advantage of being completely parametric in its implementation.
Furthermore, we also defined mathematically the surface and used that definition to
create a grid of points that are organized in groups of four (p0, p1, p2, and p3), defining
quadrangles along the surface (quads).
iterate_quads(f, ptss) =
[[f(p0, p1, p2, p3)
for (p0, p1, p2, p3)
in zip(pts0[1:end-1], pts1[1:end-1], pts1[2:end], pts0[2:end])]
for (pts0, pts1)
in zip(ptss[1:end-1], ptss[2:end])]
Thus, it is now legible that the unit element itself must also be defined within 4 points
to be iterated along all the quads created over the surface.
The function interate_quads() receives as arguments the function that defines the
geometric unit (f) and the matrix of points that define the surface (pts). In the particular
case of the façade for Regal Shoes, the unit geometry is a simple box and the surface can be
described by a sine behavior in both directions u and v, as given in the following example
(figure 4.35.):
pts = map_division((u,v)->xyz(u,0.5*(sin(u)+sin(v)),v),
0, 30, 50, 0, 30, 50)
iterate_quads((p0, p1, p2, p3) -> box(p0, distance(p0,p1)), pts)
Nevertheless, it is important to reinforce the idea that it is up to the user to decide
which approach is more advantageous. Thus, it is also possible to choose the alternative
approach of using VIMs to import the unit element, the surface from the modeling tool, or
both, instead of defining them textually. However, as explained, there must be some
compromise regarding the performance of these mechanisms in the textual context.
Fig. 4.34. Façade of the Regal Shoes
Retail Store by NUDES, Assam,
India, unknown date.
Fig. 4.35. Geometry generated by
the textual program created to
resemble the façade of Regal Shoes.
Fig. 4.33. Unit (above) and result of
paneling and morphing over an
imported surface (below).
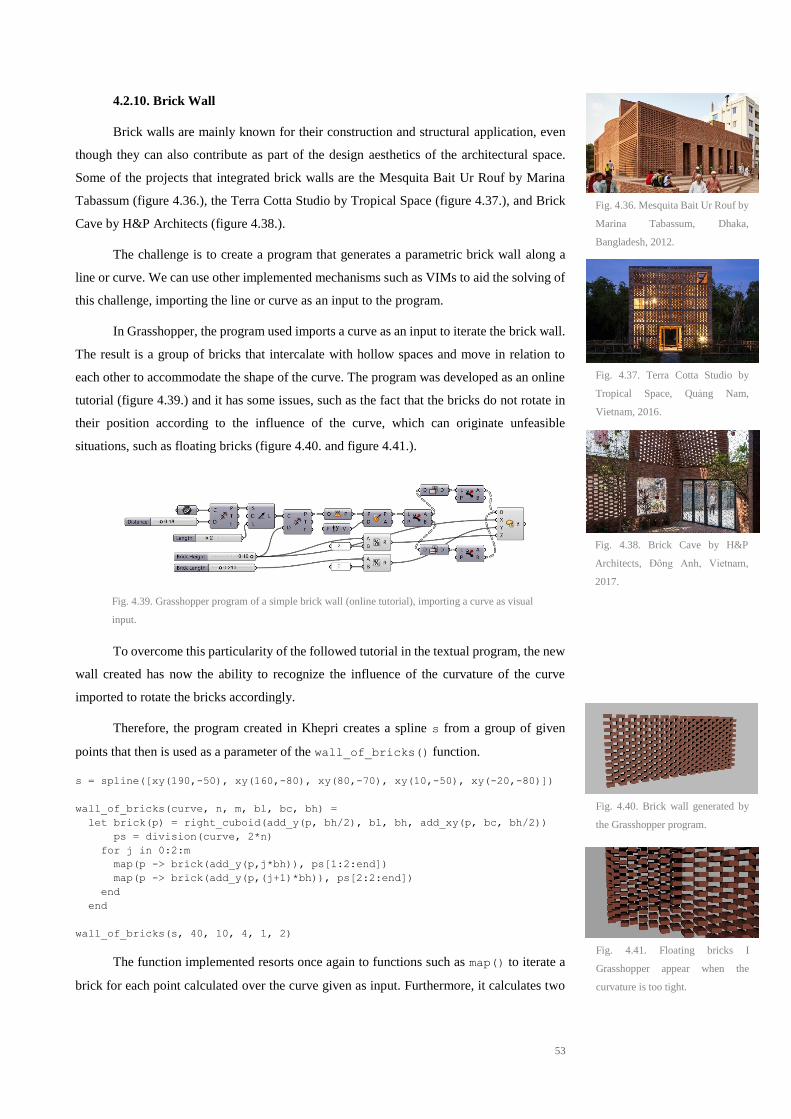
53
4.2.10. Brick Wall
Brick walls are mainly known for their construction and structural application, even
though they can also contribute as part of the design aesthetics of the architectural space.
Some of the projects that integrated brick walls are the Mesquita Bait Ur Rouf by Marina
Tabassum (figure 4.36.), the Terra Cotta Studio by Tropical Space (figure 4.37.), and Brick
Cave by H&P Architects (figure 4.38.).
The challenge is to create a program that generates a parametric brick wall along a
line or curve. We can use other implemented mechanisms such as VIMs to aid the solving of
this challenge, importing the line or curve as an input to the program.
In Grasshopper, the program used imports a curve as an input to iterate the brick wall.
The result is a group of bricks that intercalate with hollow spaces and move in relation to
each other to accommodate the shape of the curve. The program was developed as an online
tutorial (figure 4.39.) and it has some issues, such as the fact that the bricks do not rotate in
their position according to the influence of the curve, which can originate unfeasible
situations, such as floating bricks (figure 4.40. and figure 4.41.).
To overcome this particularity of the followed tutorial in the textual program, the new
wall created has now the ability to recognize the influence of the curvature of the curve
imported to rotate the bricks accordingly.
Therefore, the program created in Khepri creates a spline s from a group of given
points that then is used as a parameter of the wall_of_bricks() function.
s = spline([xy(190,-50), xy(160,-80), xy(80,-70), xy(10,-50), xy(-20,-80)])
wall_of_bricks(curve, n, m, bl, bc, bh) =
let brick(p) = right_cuboid(add_y(p, bh/2), bl, bh, add_xy(p, bc, bh/2))
ps = division(curve, 2*n)
for j in 0:2:m
map(p -> brick(add_y(p,j*bh)), ps[1:2:end])
map(p -> brick(add_y(p,(j+1)*bh)), ps[2:2:end])
end
end
wall_of_bricks(s, 40, 10, 4, 1, 2)
The function implemented resorts once again to functions such as map() to iterate a
brick for each point calculated over the curve given as input. Furthermore, it calculates two
Fig. 4.40. Brick wall generated by
the Grasshopper program.
Fig. 4.39. Grasshopper program of a simple brick wall (online tutorial), importing a curve as visual
input.
Fig. 4.41. Floating bricks I
Grasshopper appear when the
curvature is too tight.
Fig. 4.38. Brick Cave by H&P
Architects, Đông Anh, Vietnam,
2017.
Fig. 4.36. Mesquita Bait Ur Rouf by
Marina Tabassum, Dhaka,
Bangladesh, 2012.
Fig. 4.37. Terra Cotta Studio by
Tropical Space, Quảng Nam,
Vietnam, 2016.
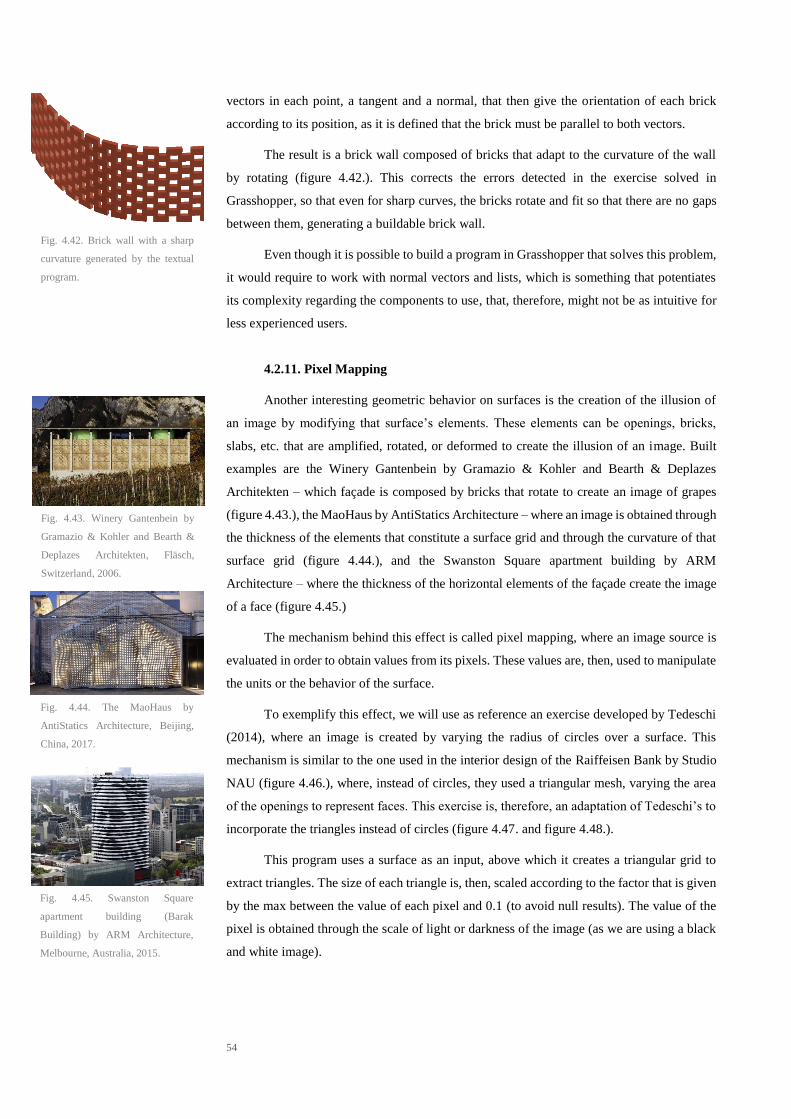
54
vectors in each point, a tangent and a normal, that then give the orientation of each brick
according to its position, as it is defined that the brick must be parallel to both vectors.
The result is a brick wall composed of bricks that adapt to the curvature of the wall
by rotating (figure 4.42.). This corrects the errors detected in the exercise solved in
Grasshopper, so that even for sharp curves, the bricks rotate and fit so that there are no gaps
between them, generating a buildable brick wall.
Even though it is possible to build a program in Grasshopper that solves this problem,
it would require to work with normal vectors and lists, which is something that potentiates
its complexity regarding the components to use, that, therefore, might not be as intuitive for
less experienced users.
4.2.11. Pixel Mapping
Another interesting geometric behavior on surfaces is the creation of the illusion of
an image by modifying that surface’s elements. These elements can be openings, bricks,
slabs, etc. that are amplified, rotated, or deformed to create the illusion of an image. Built
examples are the Winery Gantenbein by Gramazio & Kohler and Bearth & Deplazes
Architekten – which façade is composed by bricks that rotate to create an image of grapes
(figure 4.43.), the MaoHaus by AntiStatics Architecture – where an image is obtained through
the thickness of the elements that constitute a surface grid and through the curvature of that
surface grid (figure 4.44.), and the Swanston Square apartment building by ARM
Architecture – where the thickness of the horizontal elements of the façade create the image
of a face (figure 4.45.)
The mechanism behind this effect is called pixel mapping, where an image source is
evaluated in order to obtain values from its pixels. These values are, then, used to manipulate
the units or the behavior of the surface.
To exemplify this effect, we will use as reference an exercise developed by Tedeschi
(2014), where an image is created by varying the radius of circles over a surface. This
mechanism is similar to the one used in the interior design of the Raiffeisen Bank by Studio
NAU (figure 4.46.), where, instead of circles, they used a triangular mesh, varying the area
of the openings to represent faces. This exercise is, therefore, an adaptation of Tedeschi’s to
incorporate the triangles instead of circles (figure 4.47. and figure 4.48.).
This program uses a surface as an input, above which it creates a triangular grid to
extract triangles. The size of each triangle is, then, scaled according to the factor that is given
by the max between the value of each pixel and 0.1 (to avoid null results). The value of the
pixel is obtained through the scale of light or darkness of the image (as we are using a black
and white image).
Fig. 4.43. Winery Gantenbein by
Gramazio & Kohler and Bearth &
Deplazes Architekten, Fläsch,
Switzerland, 2006.
Fig. 4.44. The MaoHaus by
AntiStatics Architecture, Beijing,
China, 2017.
Fig. 4.45. Swanston Square
apartment building (Barak
Building) by ARM Architecture,
Melbourne, Australia, 2015.
Fig. 4.42. Brick wall with a sharp
curvature generated by the textual
program.

55
This type of mechanisms can easily scale in complexity, according to the type of
alterations to be made to the elements of a surface. The example given by Tedeschi already
shows a mastery of the language, that is not always accomplished by less experienced users.
The following example (figure 4.49.) shows another application of the pixel mapping
mechanism with a greater scale of complexity. In this case, the bricks of a wall similar to the
one used in the previous section rotate according to the relative values of the pixels of an
input image (figure 4.50.).
Even though the principle is the same, this second program is very different from the
first. This also translates the idea that different users have the freedom to program the same
thing in very different ways, which sometimes is a disadvantage concerning the legibility and
understanding of one another’s programs.
This flexibility is also extended to the textual realm, even though with limitations.
Textual languages such as Julia within Khepri offer alternatives for the implementations of
abstractions but the syntax and structural rules of the language make it readable for others
that did not create the program.
In Khepri, there are two ways of implementing pixel mapping: either (1) using the
pixels of the image to define the number of iterations – corresponding to each pixel a
geometrical element that will be distributed and modified according to the given parameters,
or (2) mapping each geometrical element within the correspondent closer pixel of the image.
Fig. 4.49. Grasshopper program developed from an online tutorial.
Fig. 4.50. Pixel mapping result,
using an image of Le Corbusier’s
Modulor.
Fig. 4.48. Pixel mapping result,
using an image of Le Corbusier.
Fig. 4.46. Interior of Raiffeisen
Bank by Studio NAU, Zurich,
Germany, 2011.
Fig. 4.47. Grasshopper program adapted from Tedeschi’s version of a pixel mapping mechanism.

56
The second is more advantageous that the first approach, since the user may not have full
control over the number of pixels of an imported image.
bricks_of_image(image, p, w_rows, w_cols, l, w, h, s) =
let (i_rows, i_cols) = size(image)
for (row, offset) in zip(1:w_rows, cycle([0, s/2])), col in 1:w_cols
rotated_brick(p+vxz(col*s+offset, (w_rows-row)*h), l, w, h,
rotation_from_color(
image[round(Int, row*(i_rows/w_rows)),
round(Int, col*(i_cols/w_cols))]))
end
end
bricks_of_image(img, u0(), 70, 50, 10, 4, 5, 12)
The bricks_of_image() function receives an image (img), a point (p) where the
wall begins, the number of bricks in both directions (w_rows, w_cols), and the length (l),
width (w), and height (h) of each brick, and the gap between bricks (s) of the wall.
By comparison, we start understanding that both programs in a VPL and a TPL tend
to become more intricate with the complexity of the geometry or of the mechanisms used.
However, while the textual program adds lines of code and maintains the legibility and
structure, the visual program, besides losing some helpful features such as immediate
feedback, also become difficult to understand.
4.2.12. BIM Paradigm
Nowadays, the architectural process of conceiving a built space usually includes the
construction of digital models in Building Information Modeling (BIM) tools, such as Revit
or ArchiCAD. These tools are particularly helpful in later stages of the design process,
allowing architects to easily obtain technical sections, maps of quantities, and budget
calculations. The documents generated by these tools can, then, be used to inform other areas
of expertise, such as structure, HVAC, plumbing and draining, and lighting, among others.
Nevertheless, as the construction of BIM models is usually associated with later stages
of the design process, these models are expected to be final, losing their flexibility and, thus,
the possibility of changing the design. Any alteration on these models is, therefore, expensive
and may prone to errors. The algorithmic approach circumvents this limitation, by creating a
program that can easily be used to also generate the geometry in other tools, including BIM
tools.
There are VPLs already design within the BIM paradigm, such as Dynamo, that works
with Revit. For other commonly used VPLs, such as Grasshopper, BIM is not intrinsic to the
implementation of the language, even though there are plug-ins developed to extend this
feature. Nevertheless, the use of plug-ins in Grasshopper may be more challenging for less
experienced users, as they require specific knowledge about the way their components work,
and the information required to feed those components.

57
The portability that has been achieved in textual programming environments such as
Rosetta and Khepri, allows this connection with BIM tools to be smoother and simpler (Feist
et al., 2016). However, considering that BIM tools require more information than CAD tools,
the user must foresee the necessity of this connection in the program by structuring it to
accommodate that type of specific information, e.g. whether a box is a wall or a slab.
Khepri is being developed to integrate more BIM tools as back-ends and currently
already performs the connection with Revit (figure 4.51.). This implementation was tested
recently in the same investigations that approached visual input mechanisms within a textual
approach (Sammer, Leitão, & Caetano, 2019; Sammer & Leitão, 2019).
Thence, the user simply needs to inform Khepri which is the back-end in use and the
model is generated in the mentioned modeling tool.
4.2.13. Analysis Tools and Plug-ins
Another clear advantage of computational processes applied to the architectural
practice is the ability to assess digital models through analysis tools, in order to better predict
and adapt the performance of projects according to the intended criteria. Nowadays, projects
can be digitally analyzed according to their structure, thermal behavior, lighting, acoustics,
and aerodynamics, among others.
The use of analysis tools is of great utility for architects, since it provides useful
information to aid in the design process. Thence, the architect is able to make more informed
design decisions based on the simulations obtained through digital analysis of the geometry
of a project, enhancing the safety, sustainability, and performance of buildings to be built.
However, the manual use of analysis tools can become challenging, since some of
them require specific information that may differ from the 3D models created in modeling
tools. Therefore, to import directly 3D models into some of these tools can lead to errors and
incoherent information (figure 4.52.) whenever the geometry fed to the tool is not in the
Fig. 4.51. BIM model generated by Khepri in Revit, using a predefined family of circular windows.
Fig. 4.52. Analysis generated
directly and by hand in DIVA for
Rhino, a lighting analysis tool.

58
specific format required. AD aids greatly in this matter, since it allows the flow of
information from the program directly to the tool – and not from a 3D model to the tool.
In commonly used VPLs such as Grasshopper, there was a fast urge to fulfill these
analysis request by, once again, extending the base features with plug-ins. The set of available
analysis plug-ins for Grasshopper is extensive, and some of the most commonly used have
already been addressed in Table 1.
These plug-ins are, therefore, a set of components that indicate both the inputs to
provide and the outputs they generate (figure 4.53.). However, these components are
predefined abstractions to which implementation users do not have access too. Therefore,
they cannot truly understand how it works within the so-called “black box”, nor can they
make modifications or corrections to meet other outcomes within that pre-definition.
Therefore, and even though it is possible to connect VPLs such as Grasshopper to
other analysis tools, this connection is not as intuitive as the overall use of the language,
which can become a barrier for less experienced users.
On the other hand, and as presented in previous sections, Khepri is a textual
programming tool that allows the user to build programs that can be generated in different
digital tools, including analysis ones. This intrinsic portability represents a great advantage,
since it allows the user to integrate within one single script the information needed to feed
multiple modeling and analysis tools. Therefore, and once again, the user simply needs to
inform Khepri about the back-end to connect to, without concerning about filtering,
modifying, or adapting the model to provide the requested information of a specific tool.
This direct connection between a single program and analysis tools overcame some
limitations regarding specific data requirement, circumventing the misinterpretation or loss
of information (figure 4.54.).
4.2.14. Conclusions
With the previous evaluations, we are now able to draw conclusions regarding the
behavior and performance levels of VPLs and TPLs for the different scales of complexity
assessed throughout this section.
Fig. 4.53. Ladybug for Grasshopper to perform radiation analysis, using the “black box”
components predefined within the plug-in.
Fig. 4.54. Analysis generated by
connecting a textual program
directly with an analysis tool.
59
Complexity and performance
The first issue to address regards the performance of the features and mechanisms
provided by programming languages for different levels of complexity of the programs
created. It becomes evident that, for simpler programs, the interactivity and visual
intuitiveness of VPLs like Grasshopper truly facilitates the understanding of what is being
programmed. Features like number sliders associated with mechanisms like immediate
feedback are crucial characteristics of VPLs that bring them closer to more visual users, such
as architects. However, as it was predicted, these main appealing features and mechanisms
become compromised for a greater complexity level and, in some cases, they might even stop
working.
This complexity can be understood in two different dimensions: the visual and the
computational. Usually, they are related, considering that the more visually complex a
program is, the more computation it requires. Nevertheless, we have also shown programs
that are visually simple and computationally demanding, due to the sophisticated abstractions
they apply. In either case, features and mechanisms such as the mentioned above may become
unfeasible for the work dynamic on a visual program, requiring a long time to be computed
and losing their relevance.
A complex program in a TPL can also be associated with a program with sophisticated
abstractions or a program with a considerable amount of instructions and functions to be
computed. However, the main difference is that, regardless the length of the program or the
computational demands of its abstractions, the absence of heavy visual mechanisms hardly
compromises the performance in TPLs, that can even be optimized by the ability to stage
operations for greater computational demands.
This means that the program can integrate interaction phases that allow users to define
which functions should be computed and when, managing the time of the generation of
geometry according to their intentions. This allows postponing more demanding operations
to only after simpler precedent decisions are made within the design process.
Complexity and readability
Another dimension of complexity regards the visual appearance of a program. In
VPLs, a program that is visually complex generally compromises its readability and
understanding. In an attempt to circumvent this problem, languages like Grasshopper already
offer, within its user interface, mechanisms of alignment, grouping, and other tools to
organize the program. Still, for a greater scale of complexity, it is not the arrangement or
documentation of the components of a program that will make it more readable.
Programs with a higher degree of complexity become difficult to read and decipher,
not only by third parties but also by those responsible for their construction. Furthermore,
this issue has direct implications in the maintenance of the program, aggravated by the loss
of visualization mechanisms, such as immediate feedback and traceability.

60
In sum, a visually complex program in Grasshopper is difficult to understand, modify,
and maintain.
Contrastingly, complex textual programs do not mean illegible programs. In fact, the
scalability of textual languages is also associated with this characteristic: it is not a larger
number of lines of code that make the program more complicated to understand. This happens
because of the uniformity of the formal structure of the language, as well as all the available
searching mechanisms and features to organize and comment abstractions within the
program.
Maintenance and cost of change
Algorithmic approaches have already proven that they greatly enhance the efficiency
and flexibility of the workflow of an architectural project, by not only allowing a freer
experimentation of the design space, but also by reducing the cost of change. However,
within algorithmic approaches, this flexibility differs between paradigms.
A complex program created in a VPL not only becomes difficult to understand and
decipher, but it also becomes more challenging and less intuitive to alter, manage, and
maintain. This difficulty is illustrated by the way a program is created: if the drag-and-drop
and connection of boxes representing abstractions can be a puzzling task, the process of
altering and managing that visual information can only be even more confusing.
Although there are mechanisms within visual programming environments that allow
organizing a program, mechanisms that were applied in the development of projects like the
Morpheus Hotel (Heijden, 2018), for a great complexity this task continues to represent a
challenge and can take longer than would be feasible within the design process.
On the other hand, programs created within the textual paradigm do not suffer from
this limitation, since the cohesive structure of a textual code allows to clearly search and
identify which parts of the program generate which geometry. Considering that this structure
is represented by a set of functions that call other functions, increasing its degree of
complexity, any change made in a primary function is automatically propagated to those who
invoke it.
Therefore, the cost of changing a program in a TPL is lower than when programming
in a VPL, since the readiness with which those changes are made in the textual approach is
more intuitive and easily performed.
Abstractions and flexibility
The visual complexity of programs can also be overcome by the use of more
sophisticated abstractions, that are able to synthesize complex operations and instructions.
Grasshopper already provides components that compute demanding operations or manage
large data sets. However, these abstractions are not modifiable within their own
implementation, meaning that it is not possible to make alterations to better answer to other

61
similar requests. To overcome this limitation, the solution usually comprises the combination
of several abstractions, which can increase the visual and computational complexity of the
program.
To keep up with the current demands of its users, Grasshopper relies on individual
developers to provide new plug-ins with new abstractions. However, this process can become
untrustworthy, as we cannot fully assess the quality of the plug-ins created, besides being
difficult to use, since these new abstractions are implemented within a foreign reasoning and
might not be the most intuitive for other users.
Using the textual approach, these limitations are surpassed by the intrinsic flexibility
of the paradigm. Even though it is possible to predefine some abstractions within a
programming tool, such as in Khepri, there is an endless combination of instructions and
operations that, combined with programming mechanisms such as recursion or higher-order
functions, structure a much simpler approach to programming new abstractions. Therefore,
the principle is to create new abstractions based on predefined ones, benefiting from the
freedom of structuring them according to specific requests.
We can then conclude that, even though TPLs require a greater abstraction power
from their users, since they cannot immediately see what is being programmed and changed,
the continuous use will translate in a gradual mastery of the approach, as some of the most
used abstractions and mechanisms become intuitive to use in the long term.
Visual mechanisms and performance
Other conclusion taken from this assessment regards the implementation of visual
features within the textual context and its correspondent performance. For that, this thesis
contributed for researches responsible for the implementation of VIMs within Khepri
(Sammer, Leitão, and Caetano, 2019; Sammer & Leitão, 2019), from which we were also
able to understand the impact of integrating visual mechanism in the textual approach.
VPLs are developed and strongly integrated within specific modeling tools and, in
this case, we used Grasshopper that is developed within Rhino. This allows a deeper
connection between modeling tool and programming language and can be illustrated by the
ability to solely visualize in Rhino a visual representation of the geometry created in
Grasshopper, i.e., without computing the geometry within the modeling tool. This has a big
impact on performance, since the more demanding operations of generating the geometric
data are solely performed when the user bakes the visualization generated by the program.
Visual mechanisms implemented within the textual approach may require a greater
time of computation when compared with VPLs. This happens because, unlike Grasshopper,
the geometry programmed in Khepri is being generated in the modeling tool every time the
program is executed, which represents a time-consuming task. Therefore, even though visual
mechanisms in TPLs offer clear advantages regarding the interactivity with the modeling

62
tool, the relevance of their use and the compromise of performance required should always
be considered by the user, that has the freedom to choose to use them or not.
Portability and plug-ins
Another important point assessed with this study is related to the ability to generate
the same program in different modeling and analysis tools, i.e. portability. VPLs can either
be developed and integrated within CAD or BIM tools, even though they also provide plug-
ins to extend their portability and allowing the program to connect with others.
Grasshopper provides a large set of plug-ins to not only generate the program in BIM
tools such as Revit and ArchiCAD, but also to feed information to analysis tools that assess
the geometry created, such as Ladybug and Kangaroo. However, some of these plug-ins can
be difficult to use for less experienced user, regardless the all the documentation usually
available.
On the other hand, textual programming environments like Khepri were already
created and developed to integrate portability of the programs defined. Even though users
must create a program that predicts the use of tools with more specific data requests, such as
BIM tools, the alterations to the program are minimal, as they solely need to inform Khepri
which back-end to connect with.

63
5. Guidelines
After studying the theoretical features of both types of languages and assessing their practical
application when used to program from simple to complex geometries, we are now able to
draw some guidelines regarding two aspects of their use and implementation: (1) to establish
a methodology that reflects on the use of either VPLs or TPLs according to the intentions of
the architect in applying AD and (2) to propose guidance in the implementation of further
features and mechanisms in TPLs that might bring them closer to their users from early stages
of the design process, competing directly with VPLs.
5.1. Guidelines for choosing which approach to use
There are different types of architects, with different beliefs and work methods, as there are
different types of projects, varying in context, function, program, scale, complexity, and
aesthetics. Each stage of the design process requires different approaches to design. As
previously discussed, the first creative steps usually include a brainstorm that is materialized
through sketches and drawings, the more intuitive, practical, and organic method of
expression used by architects. The question that now arises considers the following stages
after the conception of an idea: how to materialize and formalize a sketched concept?
The current conventional approach used in the majority of the design studios around
the world usually encompasses the manual use of CAD and BIM tools. However, what is the
extent of this manual approach with regard to the complexity of a project? When is it
advantageous to use an AD approach? And, considering that the architect chooses to benefit
from AD, to what extent does one take advantage of a VPL or when is it justified to adopt a
textual approach? The following description reflects on a methodology that associates the
increasing complexity of the project and of its formal outputs to be generated and the work
method that best meets the correspondent needs of its materialization.
The conventional manual approach is worth using when the project solely includes
simple geometry and requires a low level of experimentation and exploration of the design
space. The documentation produced using a conventional manual approach is only effective
when the design is final and when there is no need for flexibility regarding the final outcomes.
Otherwise, the cost of change in this approach is considerably high. When choosing the
manual approach, there are two possible ways of materializing a design intention: either using
CAD tools or BIM tools.
Architects use CAD tools to formalize 2D drawings of a final project (figure 5.1.),
being an easier and more intuitive methodology that better resembles the traditional drawing
board used to draw and sketch, besides also being the more familiar among architects and
other engineers. They are useful for creating rigorous technical drawings with a low level of
repetition, dependency between geometry, and other tiresome tasks. However, this type of
orthographic projections requires a greater capacity for abstraction from those who interpret

64
the drawings, an ability that is not often intrinsic to clients or other entities less familiar with
these methods of representation.
For this reason, CAD tools started by also integrating 3D modeling capabilities, even
though they continue to work exclusively with geometries and volumes. Nevertheless, and
even though 3D models already allow a more familiar visualization of the final product,
creating a 3D model in a CAD tool is still a task with a certain degree of difficulty. Therefore,
within modeling tools, this difficulty was compensated by the development of similarly
intuitive tools that, although more demanding to work with, provide more complete
information about the modeled geometry: BIM tools (figure 5.2.).
In the current architectural practice, there is already a tendency towards the
replacement of CAD tools with BIM tools. This may be associated with the greater variety
of documentation that can be extracted from BIM documents, besides the 3D model itself:
not only 2D technical drawings, but also all technical information regarding materials,
properties, and prices, among others. Furthermore, these tools can also be associated with
powerful render engines that produce virtual images of the projects even closer to what they
would actually look like in reality. In addition, BIM tools, by dealing with objects with
physical and technical properties, still allow the extraction of quantitative information, such
as maps of quantities and budgets, which have proved to be essential for the management of
architectural projects.
In sum, CAD and BIM tools within the manual approach are very intuitive to use and
they have been quickly incorporated both in the architecture curriculum and the design
practice inside architectural studios, as that they became common knowledge between
Fig. 5.1. 2D drawing created using a CAD tool.
Fig. 5.2. 3D model created using a BIM tool.

65
architects and engineers from other specialties. However, they may not be the most adequate
approach when dealing with less common types of shapes, namely organic geometry. This
limitation is intrinsic to the principles of the implementation of some of these tools, e.g., in
BIM tools objects are described with properties and attributes, such as slabs being horizontal
boxes and walls vertical ones. This means that BIM is unlikely to represent a slab that turns
into a wall, for example. Furthermore, as the cost of change is considerably high for the
manual approach, BIM tools, in particular, are efficient to use in final stages of the design
process, i.e., when the concept for the project is already set.
Whenever the project reaches a certain level of geometrical complexity, requires a
higher level of flexibility and experimentation, or even compels to benefit from optimization
and analysis, algorithmic approaches should be considered.
Assuming that AD potentiates both the development and the final materialization of
an architectural project, there are still two different levels of complexity to consider: (1) an
experimentation phase, where it is beneficial to have a dynamic direct interaction between
the modeling tool and the AD program, prevailing a simplified generation and visualization
of the results; and (2) a full integration phase. This full integration approach includes (1) the
complete development of the project, merging the geometrical generation of the model
(visualized in CAD and BIM tools), the assessment through analysis tools, and the possibility
of performing optimization according to the intended objectives, and (2) the production of
powerful documentation, such as renders, animations, and real-time visualization and
navigation, including virtual reality (Leitão, Castelo-Branco, & Santos, 2019).
When the requirements to meet solely include more experimental manipulation of
simplified geometry, in order to benefit from visual interaction mechanisms, such as
immediate feedback, VPLs offer true benefits. Therefore, languages like Grasshopper may
be more advantageous than current TPLs for architecture to easily and intuitively create
simpler algorithms that only need to fulfill an experimental purpose – without the need of
being developed to generate a full definition of a complex project.
This limit of complexity supported by VPLs is here addressed as a reflection about
the conclusions taken from the comparative assessment between VPLs and TPLs. As we were
able to verify, whenever the program requires a more demanding computation, some of the
appealing visual features and mechanisms become compromised, either by becoming slower
to respond or by simply stop working. Furthermore, the legibility of a complex visual
program can be challenging, being a particular disadvantage when working collaboratively,
since the program becomes too hard to understand for those who did not create it. Therefore,
it can be said that it is nearly impossible – or, at least, not feasible timewise – to understand
a program such as the one created for the shell of the Hangzhou Tennis Center (figure 5.3.).
Moreover, a maintenance problem arises. The lack of abstraction mechanisms leads to a
tendency for the overuse of copy and paste mechanisms, introducing redundancy. In turn,
redundancy leads to programs that are hard to change and maintain because, if there is a

66
change to be done to one of the elements, all the ones that were copied to be equal will also
have to be changed. In these cases, the user finds more advantages in building a single
program using a TPL.
VPLs are, therefore, adequate for a lower level of complexity and a more limited time
to invest in an AD approach, since they allow to quickly and intuitively created programs
that simulate in real time the changes being made during the exploration of the design, but
take longer to create extended programs of complex projects.
On the other hand, textual programming is more demanding to master, besides also
being less interactive and less intuitive to use by architects. However, the programs created
have fewer problems in scaling to very large and complex programs, without compromising
neither their legibility nor their performance.
Within the algorithmic approach, the increased complexity associated with the tools
to which the PLs are associated extends this methodology to an orthogonal relation,
considering that CAD tools provide simpler documentation than BIM tools, to which more
complex information can be associated.
In VPLs, there are different languages that fit different paradigms, e.g. Grasshopper
for a CAD tool and Dynamo for a BIM tool, even though it is also possible to extend this
predefined implementation with the use of plug-ins. This methodology adds considerable
complexity to the way the user interacts with a language, besides being less intuitive to use.
On the other hand, the textual approach presented in the context of programming
environments for architecture, such as Khepri, provides intrinsic portability of the programs
created. Therefore, Khepri allows to trivially change the back-end in which the program is to
be generated, and it includes simpler modeling tools such as CADs and more informative
ones such as BIMs.
The following scheme summarizes and systematizes the described orthogonal
methodology, relating the complexity of a project to both the paradigm and the tools chosen
to generate the documentation of that project.
Fig. 5.3. Visual program that generates the envelope of the Hangzhou Tennis Center.

67
There is a third dimension to consider that relates to analysis tools. They can be
associated with either the manual or the algorithmic approach and integrated within CAD or
BIM tools associated with them. Therefore, the representation we are looking for that
integrates all the approaches and relates the complexity of the information and documentation
obtained through them can be represented in a 3D graph as shown in chart 2.
In sum, architects should choose their design approach according to (1) the type of
documentation to produce at the different stages of the design process, (2) the level of detail
intended from that documentation, (3) the application of that documentation – that can be
merely illustrative or used for more technical applications, (4) the time available for the
production of that documentation, (5) the flexibility required from that documentation, (6)
whether it is necessary to generate the same documentation in different modeling tools, (7)
whether it is necessary to assess the geometry generated with analysis tools, or even (8)
whether the project benefits from optimization.
Nevertheless, all the research and conclusions drawn on the theme are strong
arguments for us to consider TPLs the most advantageous approach for architecture in the
long term. Nevertheless, there is still a strong barrier regarding the learning process of TPLs,
that usually take more time and effort to be mastered. Therefore, we will also suggest some
guidelines concerning implementations within Khepri that have the potential to facilitate the
initiation in the textual approach for architects.
Chart 1 – Relation of the complexity of a project to the approach chosen and the tools used.
Chart 2 – Integration of the third dimension of Analysis to the approaches and tools indicated in chart 1.

68
5.2. Guidelines for future implementations in TPLs
Given the long-term advantages of TPLs in the development of complex projects, as
well as in all variants of analysis, optimization, and visualization of the obtained results, the
textual approach to AD offers a solution to the barriers encountered when using VPLs for
programs with greater complexity. However, the demanding learning process and the lack of
mechanisms of visualization and interaction with the modeling tools, make TPLs still
unappealing for architects.
For this reason, this research also aims to propose guidelines for future
implementations in the development of textual programming environments for architecture,
such as Khepri. These guidelines are based on the study of the current use and utility of visual
features and mechanisms in VPLs that can also be implemented in a textual context.
Recent research derived from this thesis (Sammer, Leitão, & Caetano, 2019; Sammer
& Leitão, 2019) has proved that there is no impediment to implement visual features within
the textual programming context. However, this merge between both visual and textual
paradigms may raise other questions regarding the relevance of a hybrid approach.
Considering the framework previously presented, that gives the architect the freedom
to choose the methodology that best suits the needs of a certain stage of the project – always
considering the textual programming will better suit projects with great complexity and with
the need to integrate optimization and analysis, the use of the implemented visual features
within a TPL should also be up to the architect’s will. This choice should consider the
adjustments to be made when some visual features are used, e.g., the performance of the
program can become compromised when using dependency on shapes that were imported,
providing a similar behavior to Grasshopper’s immediate feedback that becomes very time-
consuming.
Therefore, considering that the possibility of using visual mechanisms should be
integrated at least to facilitate early stages of the learning process of TPLs, we now present
some guidelines regarding not only further possible visual implementations but also the
integration of other programming mechanisms within the textual approach. These guidelines
are drawn to be integrated within textual programming environments, in this particular case,
in Khepri.
Error detection and Debugging
Whenever an error occurs in Grasshopper, the responsible component is highlighted
in red and a message is generated informing what are the reasons for that error. This
mechanism is crucial to the understanding of the program and aids in the comprehension and
solution of the errors found, even though those messages might not always be clear to
interpret (figure 5.4.)

69
In Khepri, error messages are also generated whenever something is not working
accordingly. However, they are also hard to understand, being difficult to identify where the
error actually occurred and why. This can be a serious limitation, considering that, by typing,
one is more likely to make mistakes than by drag-and-dropping static abstractions, as happens
with VPLs. Thus, users of textual languages are more likely to receive these error messages,
which reinforces the strong limitation represented by their incomprehensibility.
To surpass this limitation, we suggest the implementation of clearer error messages
that better point out in what function the error occurred and what needs to be altered to correct
that error. This mechanism can be complemented by more visual implementations of error
tracking such as control flow visualization mechanisms.
Control flow
Rosetta already implemented a control flow visualization mechanism that enables the
visualization of the sequence of operations followed by the computer to perform the given
instructions in the program. As mentioned, this mechanism can be very useful when
combined with error detection mechanisms, as it would allow the user to not only be informed
about what are the lines of code with error, but also the implications they had in the rest of
the program, showing the sequence of instructions followed by the computer through where
the error was propagated.
Therefore, the implementation of a similar mechanism should also be considered in
the development of Khepri, as it represents an alternative feature that really aids the user in
understanding what is being programmed and executed.
Documentation mechanisms
Components in Grasshopper are built to inform the user about the inputs they receive
and outputs they generate, as each component is described in the correspondent
documentation within the language (figure 5.5.). This is a helpful feature for less experienced
users, since it allows them to intuitively learn about each component and progress alone in
the mastery of the language.
This feature is already being developed within Khepri, as all the predefined
abstractions are also documented and described within their own implementations.
Furthermore, the user can also benefit from a typing mechanism where, by typing the function
Fig. 5.4. Component highlighted in red with error message in Grasshopper.
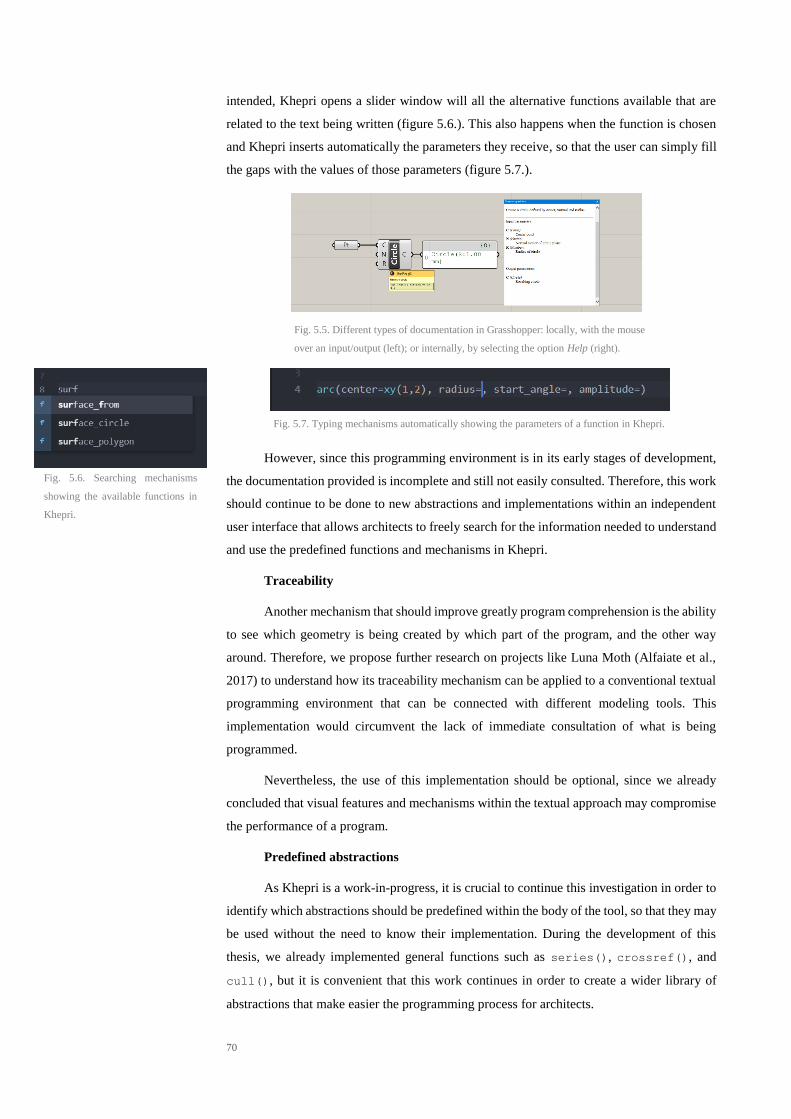
70
intended, Khepri opens a slider window will all the alternative functions available that are
related to the text being written (figure 5.6.). This also happens when the function is chosen
and Khepri inserts automatically the parameters they receive, so that the user can simply fill
the gaps with the values of those parameters (figure 5.7.).
However, since this programming environment is in its early stages of development,
the documentation provided is incomplete and still not easily consulted. Therefore, this work
should continue to be done to new abstractions and implementations within an independent
user interface that allows architects to freely search for the information needed to understand
and use the predefined functions and mechanisms in Khepri.
Traceability
Another mechanism that should improve greatly program comprehension is the ability
to see which geometry is being created by which part of the program, and the other way
around. Therefore, we propose further research on projects like Luna Moth (Alfaiate et al.,
2017) to understand how its traceability mechanism can be applied to a conventional textual
programming environment that can be connected with different modeling tools. This
implementation would circumvent the lack of immediate consultation of what is being
programmed.
Nevertheless, the use of this implementation should be optional, since we already
concluded that visual features and mechanisms within the textual approach may compromise
the performance of a program.
Predefined abstractions
As Khepri is a work-in-progress, it is crucial to continue this investigation in order to
identify which abstractions should be predefined within the body of the tool, so that they may
be used without the need to know their implementation. During the development of this
thesis, we already implemented general functions such as series(), crossref(), and
cull(), but it is convenient that this work continues in order to create a wider library of
abstractions that make easier the programming process for architects.
Fig. 5.6. Searching mechanisms
showing the available functions in
Khepri.
Fig. 5.7. Typing mechanisms automatically showing the parameters of a function in Khepri.
Fig. 5.5. Different types of documentation in Grasshopper: locally, with the mouse
over an input/output (left); or internally, by selecting the option Help (right).

71
6. Conclusion
The perspectives about what architecture really means, what it does, and what it should do
vary from region to region of the world, from culture to culture within a region, from person
to person from a certain culture. However, there is a common reality to all architects that
relates to the representation methods used to illustrate, explain, and sell their intentions for a
project.
The evolution of the tools and methods used by architects to express their concepts
and ideas has always followed the progression of humanity’s needs in different fields. More
recently, the discipline has acknowledged the benefits of computer science and programming
to accomplish new esthetics, associated with better performances and a more sustainable
impact. Furthermore, the automation of certain tasks previously executed manually allowed
a more accurate and efficient work process, besides reducing the propensity for errors. This
also came to extend the conventional orthographic projections with 3D models, offering a
more appealing and elucidating representation method. Programming, in particular,
introduced Algorithmic Design (AD), which allows the creation of programs as an alternative
approach to the manual manipulation of geometry in modeling tools.
6.1. Reflections
Algorithmic Design as a Representation Method for Architecture
Programs created within the AD approach represent an algorithmic description of
geometry that, then, is generated in computational tools for architecture. This approach
enables architects to create parametric models of projects through the establishment of rules
and constraints, which, in turn, allow the exploration of design variations more effortlessly
and efficiently.
This represents one of the greatest advantages of adopting an algorithmic approach:
the architect is able to easily explore the design space within the rules and constraints defined
by him. That is the main reason why it is crucial to be the architect in charge of the creation
of the algorithm, i.e., to be in control of the behavior of the geometry and decide within which
criteria and range of values the model is parametric.
This exploration of geometrical variations within a parametric model also influences
the cost of change of digital projects. AD reduces this cost drastically, by automating the
generation and regeneration of geometry, as the architect simply needs to change parts of the
program, and not the geometry itself. This fact comes to surpass the limitations of the manual
approach, where any manual alteration in complex sets of geometry is a time-consuming,
error-prone, and, therefore, expensive task. Thence, any alteration in an AD program is, then,
propagated according to the rules within the algorithm, which means that geometry with
dependency upon other geometries is also automatically changed correspondingly. The

72
results of those modifications are also automatically regenerated in the chosen tool, where it
is computed a new version of the design.
Moreover, the algorithmic approach also allows further control and minimization of
errors in the project generated. Thus, AD not only allows the propagation of alterations
through the set of rules and constraints defined within the algorithm, but also informs the
user about possible errors in the definition of the geometry. Additionally, some PLs also
provide mechanisms that facilitate the tracking of changes in the geometry and the detection
of errors created while creating or modifying a program. The organization of an AD program
also aids in the structuring of a project, in the isolation of parts of that project, and in the
consequent management and manipulation of the geometry, partially or in whole.
Besides the effortless exploration of the design space, the low cost of change, and the
minimization of errors in digital models, there are various other advantages in adopting AD
as a representation method to support architectural projects.
The translation of geometry into algorithms allows portability, which means that a
single program can generate models in multiple modeling and analysis tools. The great
advantage of the AD approach when compared with the manual use of these tools is that it
dismisses the construction of different digital models for different tools. This also has an
impact on the use of analysis tools, that generally require simplified geometries of the original
model, which duplicates the architect's work. Moreover, the adaptation to the simplification
requirements of these tools may drive to a misrepresentation of the original geometry, which,
in itself, leads to results that are not completely accurate.
The direct provision of algorithmic information to analysis tools circumvents these
problems, since the information is filtered directly from the program to meet their
requirements. In addition to the reduced amount of work by dismissing the duplication of
models, this approach greatly reduces the loss of information, which translates into more
reliable results.
Programming for architecture can even provide powerful mechanisms that facilitate
the manipulation and management of geometric data. Metaprogramming is one of those
mechanisms that allow generating programs within an AD program by inverting the flow of
information: instead of creating a fragment of program that generates geometry within a
modeling tool, the architect is able to incorporate an existent geometry from the modeling
tool within a fragment of program obtained through metaprogramming. For an architect, this
possibility of integrating this type of sophisticated programming mechanisms can be very
useful to the understanding of the programs created, to the management information, and to
the integration and manipulation of existent geometry.
Furthermore, and even though the learning curve of TPLs is more demanding, the
mastery of the textual approach allows the simplification of frequently used abstractions with
the mechanization of the available operations. Mechanization results in predefined

73
abstractions that regard more complex geometries or geometric mechanisms. One practical
example is the generation of spaceframes, that can be translated as a mechanic process of
creating struts and nodes connect in a 3D mesh along a surface. Therefore, the
implementation of spaceframes can be mechanized within Khepri, by internalizing their
definition within the body of mechanisms of the tool. The result is a function that architects
do not have to define or to know how it is implemented, that they solely call in the program
and give the parameters of their choice. Through this process, this type of mechanized
operations conquers meaning to the user, which allows a more fluid and simplified workflow.
Furthermore, some PLs for architecture further enable optimization mechanisms
associated with the results obtained through different analysis. This is a strong advantage in
the light of nowadays demands, where buildings must fulfill a set of requirements regarding
performance and sustainability. Therefore, the parametrization of the models allows
obtaining multiple design alternatives – varying in the parameters and range of values chosen
by the architect, associated with performance values regarding different criteria. The
automation of this process relieves architects from adjusting the program for each iteration,
as they solely need to look at the final data to choose the design variation that best suits their
intentions. The following table resumes all the advantages offered by the AD approach, in
contrast with a manual approach, that justifies and encourages the mastery of algorithmic
methods and thinking among architects.
ADVANTAGES OF THE AD APPROACH
Easy exploration of the design space
Efficient and effortless manipulation of geometry
Automation of repetitive, time-consuming, and error-prone tasks
Mechanization of the available operations
Low cost of change
Reduction and control of errors
Portability and integration with multiple modeling and analysis tools
Flexibility in managing complex geometric data
Efficient creation, experimentation, and production of documentation from digital models
Effective and efficient collaborative work
Implementation of visual mechanisms through metaprogramming
Generation of optimal solutions using optimization algorithms
In sum, AD incorporates all the advantages of the digitalization of the drawing board
and extends them to a new realm of optimization, accuracy, and efficiency. Besides allowing
the production of powerful representations of design, such as 3D models, renders,
animations, and videos, the architect is free to explore this advantages within a parametric
approach, that allows to effortlessly explore the design space of the project, to assess more
accurately the generated models, and to obtain more reliable information to aid in the design
decisions, also extending this information with mechanisms such as optimization.
Table 3 – Advantages of the AD approach.

74
Algorithmic Design as an Architectural Reasoning
Nevertheless, AD has the potential to be more than just a support to the digital
representation of a project, as it can further influence other aspects of the design process,
namely the architectural reasoning, with the introduction of algorithmic thinking. Therefore,
by acknowledging the potentialities associated with the algorithmic generation and
assessment of geometry in modeling and analysis tools, architects are able to challenge their
design intentions to accomplish new and bolder aesthetics.
The basis to this conclusion comes from the premise that, with so many tools available
to generate, assess, and optimize projects developed through AD, there are little limitations
to what is feasible to reproduce digitally or not. The fact that the data obtained through
analysis and optimization are increasingly more accurate and trustworthy, architects are able
to rely on that information to defy the limits of what was buildable before the appearing of
algorithmic approaches. AD not only allows a digital generation and visualization of
geometry, aiding in the production of appealing and realistic virtual documentation, but also
provides a stronger bridge to later stages of the design process, namely construction.
Moreover, algorithmic thinking further potentiates other domains of the architectural
process of conceiving ideas. One of those domains relates to the process of algorithmizing
ideas and the results obtained through that process. The ability to explore a wider design
space within a range of values given by the architect is related to the generalization of an idea
during the creation of an algorithm. This generalization is accomplished through the
assignment of parametric variables, i.e., dimensions, values, and measures that can vary
within a set of rules and constraints that constitute a generic algorithm. If an algorithm is
created to only compute one static geometry, the design space is limited, and the alternative
designs do not vary much. However, if an idea is translated in a generic algorithm that is able
to generate that same specific idea and many similar others, the possibilities are endless,
which introduces a curious factor to the design process: surprise. When a specific idea is
generated by a generic algorithm, the architect can choose to be surprised by other outcomes
of the computation. The introduction of randomness is one of the mechanisms that compute
this surprise factor, giving random values within a range chosen by the architect. Therefore,
the algorithms can be created with different degrees of randomness applied to different parts
of the geometry to be created, and the architect can explore the surprise outcomes of each
iteration. The advantage of such mechanisms is in the possibility of generating random results
that might be more appealing, functional, or performant than the first specific idea that was
base to the building of a more generic algorithm. Therefore, the surprise factor of
computation multiplies the inventiveness of the architect, that is able to generate new shapes
within the frame and rules of an initial idea.
We strongly believe that architects of the present day should learn how to program,
due to all the benefits of being in charge of the algorithmic process and thinking and to take
full advantage of the design parametrization and exploration. Therefore, architects should
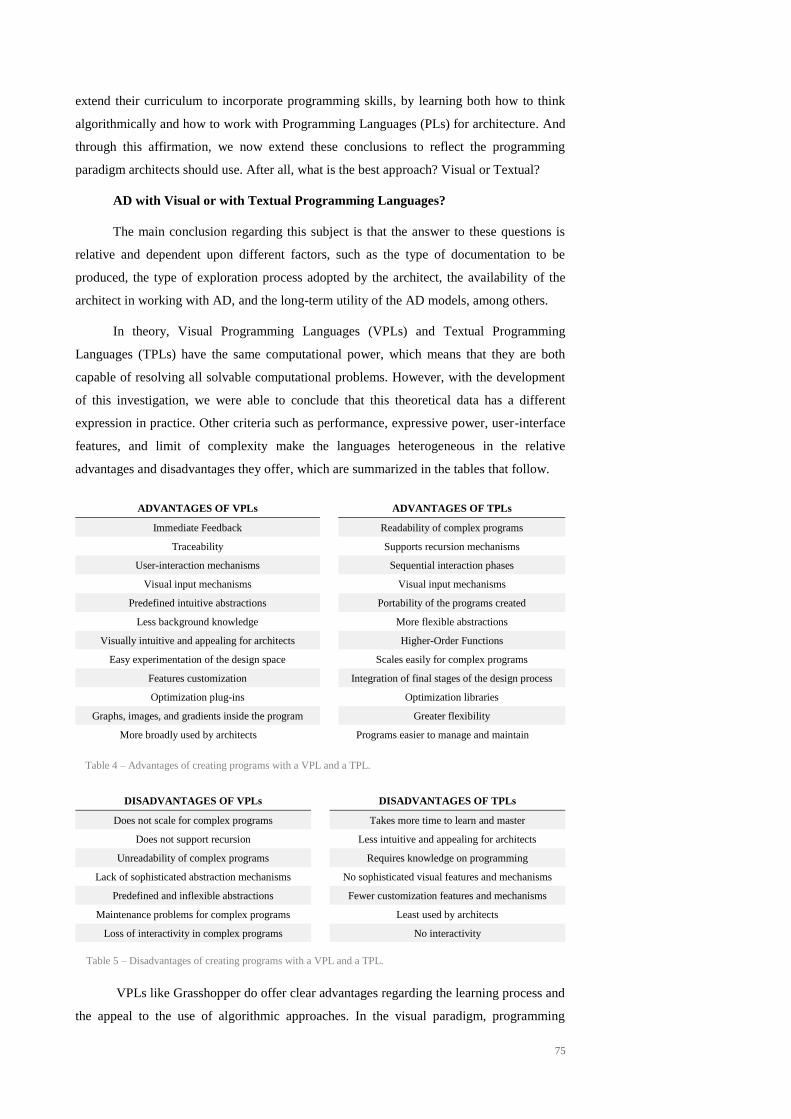
75
extend their curriculum to incorporate programming skills, by learning both how to think
algorithmically and how to work with Programming Languages (PLs) for architecture. And
through this affirmation, we now extend these conclusions to reflect the programming
paradigm architects should use. After all, what is the best approach? Visual or Textual?
AD with Visual or with Textual Programming Languages?
The main conclusion regarding this subject is that the answer to these questions is
relative and dependent upon different factors, such as the type of documentation to be
produced, the type of exploration process adopted by the architect, the availability of the
architect in working with AD, and the long-term utility of the AD models, among others.
In theory, Visual Programming Languages (VPLs) and Textual Programming
Languages (TPLs) have the same computational power, which means that they are both
capable of resolving all solvable computational problems. However, with the development
of this investigation, we were able to conclude that this theoretical data has a different
expression in practice. Other criteria such as performance, expressive power, user-interface
features, and limit of complexity make the languages heterogeneous in the relative
advantages and disadvantages they offer, which are summarized in the tables that follow.
VPLs like Grasshopper do offer clear advantages regarding the learning process and
the appeal to the use of algorithmic approaches. In the visual paradigm, programming
ADVANTAGES OF VPLs ADVANTAGES OF TPLs
Immediate Feedback Readability of complex programs
Traceability Supports recursion mechanisms
User-interaction mechanisms Sequential interaction phases
Visual input mechanisms Visual input mechanisms
Predefined intuitive abstractions Portability of the programs created
Less background knowledge More flexible abstractions
Visually intuitive and appealing for architects Higher-Order Functions
Easy experimentation of the design space Scales easily for complex programs
Features customization Integration of final stages of the design process
Optimization plug-ins Optimization libraries
Graphs, images, and gradients inside the program Greater flexibility
More broadly used by architects Programs easier to manage and maintain
DISADVANTAGES OF VPLs DISADVANTAGES OF TPLs
Does not scale for complex programs Takes more time to learn and master
Does not support recursion Less intuitive and appealing for architects
Unreadability of complex programs Requires knowledge on programming
Lack of sophisticated abstraction mechanisms No sophisticated visual features and mechanisms
Predefined and inflexible abstractions Fewer customization features and mechanisms
Maintenance problems for complex programs Least used by architects
Loss of interactivity in complex programs No interactivity
Table 4 – Advantages of creating programs with a VPL and a TPL.
Table 5 – Disadvantages of creating programs with a VPL and a TPL.
76
abstractions, such as functions and geometry, are represented as boxes (the so-called
components), and the flow of data between those boxes as connecting wires. This flow-chart
form is more familiar to architects, who are thus relieved of having to know what is behind
the implementation of each component, focusing solely on the dynamics of connecting the
available abstractions to create a visual algorithm. However, these predefined abstractions
also represent a limitation for architects, who are restricted to the set of available operations,
not having the freedom and the means to make small changes within these components to
achieve more personalized and adapted results. The solution is usually to combine a larger
number of available components that could actually be simply implemented as a single one.
This freedom of implementing new abstractions becomes exclusive to plug-in developers, an
area that already starts to segregate from the architectural domain. Another alternative would
be to use specific components that allow the insertion of textual programs, which proves that
some issues in scaling or adapting programs solely have a solution in the textual paradigm.
Thus, we already understood that this flexibility is inherent in textual programming,
as architects building a program are able to freely combine all the possible predefined
operations and define new ones within the same structure and reasoning. These predefined
operations are implemented within the body of Khepri and also dismiss the architect of
knowing how they are implemented. The main difference from VPLs is that, if architects
need to make alterations within a pre-implemented function, they have the means to do so.
Another clear advantage of VPLs is the available visual features and mechanisms,
such as immediate feedback, traceability, and visual input mechanisms, that allow a closer
interaction both with the program and with the modeling tool in use, which facilitates the
understanding of the program. Nevertheless, we strongly believe that those advantages fall
short when contextualized within the real potentialities of AD for architecture. VPLs working
with complex problems show limitations, such as the loss of the appealing features and
mechanisms mentioned above. Moreover, this scalability problem is extended to program
comprehension, since complex visual programs become hard to understand, modify, and
maintain.
TPLs within programming tools such as Khepri, on the other hand, come to surpass
the scalability problems by supporting sophisticated abstractions and programming
mechanisms like recursion, that simplify complex problems in simpler sub-problems.
Therefore, the programs created keep the same structure regardless of the amount of code or
the computational demands of the functions created, also allowing the user to organize,
search, and modify the program easily.
Another limitation regarding VPLs that conditions their application in architecture
relates to the tools they work with, since they are integrated and implemented within a
specific modeling tool, such as Grasshopper for Rhino. The lack of intuitiveness of using
plug-ins to extend this limitation, that sometimes might not work accordingly to the user’s
wishes, leads us to conclude that it is more beneficial to engage in more generic approaches,

77
i.e., that enables us to work with various tools. This portability is an intrinsic feature of TPLs
implemented in programming environments such as Khepri, which allows a single program
to generate the same model in different modeling and analysis tools. The interaction with the
program to obtain this portability is simple, since the user solely has to inform Khepri which
is the back-end to use. Even though this portability demands that the program incorporates
as much information as required by the most complex tool to use, it provides strong
advantages when managing and developing projects in the long term, mainly projects with a
great level of complexity that need to be fully developed digitally.
The efficiency of program building is another aspect that differentiates both
paradigms. This aspect is related to productivity, since it measures the time and effort spent
while creating a program. VPLs for architecture provide an intuitive mechanism to build a
program, since the user solely needs to search for the components, drag and drop them in the
programming window, and connect them to create the algorithm. Although it is an intuitive
way of working and similar to the way we materialize our reasoning, it is a relatively time-
consuming process, especially if the user takes special care in dropping the components in
an organized way. The use of the mouse simultaneously with the keyboard, together with the
freedom to place components unconstrainedly in the programming window, makes building
a visual program a more time-consuming and sometimes confusing task.
In contrast, writing a text is the primary process of using a computer. Any architect
accustomed to writing on computers is able to construct a textual program almost
uninterruptedly. The only disadvantage of this process is the greater propensity to errors, that
are more likely to occur by typing than by dragging static objects. However, we believe that
the attention needed to detect in advance any typing errors takes no more time than the
required during the process of building a visual program. From experience, we can say that
an expert building a program in a VPL takes more time than an expert writing an equivalent
program in a TPL. The relevance of this factor, as mentioned previously, is the productivity
of building an algorithm, as the use of TPLs is more productive than the use of VPLs,
consuming less time and demanding less effort.
In a world increasingly dominated by software, we need to think about what is the
percentage of programs built around the world that are created using TPLs. The answer is the
overwhelming majority, which makes us reflect on why this is not the trend observed in
architecture, where the majority of architects that practice AD is still using VPLs.
Presently, the bigger limitation to the use of TPLs is in the demanding learning process
and in the lack of appealing features and mechanisms that aid architects to understand and
master the program they are creating. However, as a product of this investigation, we were
also able to conclude that there is no impediment to the future implementation of visual
features and mechanisms within the textual approach that promise to bring TPLs closer to
architects. By using this strategy, TPLs might start to become more accessible for less
experienced users and more easily integrated into the workflow of architects worldwide.

78
The Barriers to Surpass
As already stated, TPLs are less appealing and intuitive to use. Programs textually
structured are more abstract and difficult to understand in the beginning. However, this
limitation can easily be overcome, not only by adapting the implementation of TPLs for
architects, but also by insisting on their integration within the architectural curriculum. After
all, when technical drawings were first developed and adopted as representation methods of
architectural projects, they were also considered abstract and difficult to interpret by those
less familiar with the technique. Actually, one can affirm that for some people that do not
deal with technical drawings on a daily basis, plans, elevations, and section are still difficult
to construe.
Furthermore, and besides practical limitations regarding the implementation of TPLs
for architecture, that, in their current format of application, are considered less appealing and
intuitive to use, there are other psychological obstacles in what concerns the tendency to use
VPLs over TPLs.
Architects that are familiar with the visual paradigm within the AD approach tend to
accommodate to what it provides, which sometimes means that they also accommodate to
the limitations of the languages they are used to work with. This is corroborated by Paul
Graham (2003): programmers tend to get attached to their favorite languages, i.e., the
languages that are more familiar and comfortable to them. One possible explanation behind
this is the fact that languages become more than just technology, they become a habit of mind
(Graham, 2003). In the case of VPLs, a habit that does not scale or allow evolution within
the paradigm.
We conclude that this phenomenon also applies to architects using AD: when they
start using and mastering the visual approach, which guarantees them the results they want
in a more instinctive way, it is not worth thinking or investing in any other approach.
Therefore the transition to TPLs is not natural, since users of VPLs prefer to
circumvent the limitations within the visual approach than evolve to more powerful methods
to develop algorithmic programs. Solely the users that understand the most powerful
languages are able to see the differences between them (Graham, 2003), and VPLs are far
from being the most powerful approach to AD.
Once again, this limitation can only be surpassed in the core of the integration of AD
for architecture: architects should first learn to master algorithmic thinking in order to be
comfortable in creating textual AD programs of their designs. It is only through the insistence
that textual approaches will be able to become generalized in the world of architecture.
Although it is expected to be a lagging process, mainly due to the overwhelming impact of
VPLs in the current practice of architecture, the potential of textual languages will begin to
bring competitive advantages to the architects who adopt them. Thus, the trend may reverse

79
when, to keep up with this advantage, other architects and architectural studios also start
investing in TPLs to compete directly with those who already use them to create architecture.
The last consideration in favor of TPLs, that is a potentiality to explore in order to
surpass the initial limitations of the textual paradigm, regards the intellectual flexibility in
using both paradigms. The fact that TPLs are more demanding to learn and use is related to
the knowledge of programming required that, in VPLs, is not necessarily mandatory.
Therefore, an architect who learns the fundamentals of programming when working with a
TPL, quickly and easily transitions and learns to work with a VPL. The opposite, however,
is no longer the case, since the lack of in-depth knowledge of the principles of programming
makes it difficult for an exclusive VPL user to write a program using a TPL.
6.2. Future Work
The assessment of this research is based on a comparative methodology, whose evaluation is
guided by the theoretical and practical analysis of two programming languages, a VPL,
Grasshopper, and a TPL within a textual programming tool for architecture, Khepri. Some of
the guidelines comprised within the development of this thesis already bring about further
investigation.
In an immediate way, we suggest the continuation of the comparison of other visual
components of Grasshopper and the equivalent textual abstractions in Khepri, predefined or
not. This allows to both (1) understand in greater depth the advantages and limitations within
both paradigms and (2) extend the set of predefined abstractions within Khepri, in order to
provide a broader range of operations that aid in the programming process for architects.
Furthermore, the deeper understanding of how current PLs for architecture are used
and what are the main benefits and barriers to their relative application will give us further
and more concise information to establish stronger bases for the implementation and
development of TPLs for architecture. The main objective is to create a textual programming
tool for architecture that, regardless of the demanding learning curve, is able to offset the
initial investment to master the textual approach with advantages for building architectural
projects with varying degrees of complexity. Thence, these implementations should also be
extended to programming mechanisms provided to bring TPLs closer to architects and to be
able to compete directly with the best known and used VPLs from early stages of the design
process. This thesis has already shown two contributions of that methodology with the
implementation of visual input mechanisms, that are inherent to VPLs like Grasshopper,
within Khepri (Sammer, Leitão, & Caetano, 2019; Sammer & Leitão, 2019).
The second line of investigation comes to complement the initial approach to
portability in both paradigms. Therefore, we propose to extend the comparison of VPLs and
TPLs in their current application for BIM and analysis tools. The investigation of the
implementation of Grasshopper’s plug-ins will give more insight regarding their true utility
for architects and the adequacy of the workflow they propose. Thus, we will be able to assess

80
the relevance of implementing similar mechanisms in a textual approach, which will
represent a starting point for further extend this portability in Khepri.
Another possible aspect to pursue as future work, which complements the previous
proposal to explore other modeling tools, will be to address visual languages that are
integrated directly within other modeling paradigms, namely Dynamo that is implemented
within Revit, a BIM tool. Even though Dynamo is not supported by a community of users as
large as Grasshopper’s, this direct integration within Revit may bring new solutions for better
implementations of BIM tools in a textual approach. Furthermore, this investigation can add
a parallel comparison between (1) a VPL for a CAD tool that is extended with plug-ins to
connect to BIM tools and (2) a VPL that is already integrated within a BIM tool. An example
of this would be to assess Geometry Gym for Grasshopper and Dynamo, in order to provide
information regarding the relative advantages of both types of implementations. The
conclusions taken from this comparison would also be valuable information to further extend
Khepri to the BIM realm.
Finally, the last proposal for future investigation regards the integration of the
algorithmic methodology within the conceptual phase of the development of an architectural
project, working as another tool for conceiving and developing ideas. Currently, AD solely
represents an alternative approach to the manual usage of modeling and analysis tools, being
a support for the generation and visualization of geometry. However, we believe that it can
bring further advantages for the architect if the ideas started to be conceived within an
algorithmic thinking, simultaneously with the creation of the algorithm that later generates
those ideas. A possible evaluation of this proposed methodology would be a comparative
study of the development of proposals for the same project using both approaches: one team
of architects using the conventional approach, creating and manipulating manually the
various computational tools available for architecture, such as CAD, BIM, and analysis tools;
and another team working with an algorithmic approach from the beginning of the conceptual
phase, with the integration of all the available tools in a single program. This study may
provide useful clarification regarding (1) the compared efficiency of both work methods, (2)
the physical effort and time needed in the development of the proposals, (3) the efficiency of
the collaboration process within the team, (4) the time needed to generate digital models and
other supports to the communication of the project, (5) the variety of documentation produced
within the same time-frame, (6) the quality and accuracy of the results obtained, (7) the
performance of the final idea, and (8) the interest and relevance of the result obtained
according to the objectives to fulfill with the project proposal, among others.

81

82

83
References
Abelson, H., Sussman, G. J., & Sussman, J. (1996). The Structure and Interpretation of Computer Programs. Cambridge: MIT Press.
Adriaenssens, S. (Ed.), Block, P. (Ed.), Veenendaal, D. (Ed.), & Williams, C. (Ed.) (2014). Shell Structures for Architecture. London:
Routledge.
Agirbas, A. (2017). Teaching by Coding in Architecture Undergraduate Education: A Case Study with Islamic Patterns. Proceedings
of the 17th International CAAD Futures Conference, Istanbul, Turkey, pp. 249-258.
Aguiar, R., Cardoso, C., & Leitão, A. (2017). Algorithmic Design and Analysis Fusing Disciplines. ACADIA 2017: Disciplines &
Disruption, Processing of the 37th Annual Conference of the Association for Computer Aided Design in Architecture
(ACADIA), Cambridge, Massachusetts, USA, pp. 28-37.
Aish, R. (2005). From Intuition to Precision. Digital Design: The Quest for New Paradigms, Proceedings of the 23 rd International
Conference on Education and research in Computer Aided Architectural Design in Europe (eCAADe), Lisbon, Portugal, pp.
10-14.
Alfaiate, P. & Leitão, A. (2017). Luna Moth: A Web-based Programming Environment for Generative Design. Sharing Computational
Knowledge! Proceedings of the 35th International Conference on Education and research in Computer Aided Architectural
Design in Europe (eCAADe), 2, Rome: Sapienza University of Rome, pp. 511-518.
Algorithmic Design for Architecture (2018). [Online]. Retrieved from: https://algorithmicdesign.github.io/index.html [Accessed:
Accessed: Jun. 22, 2018].
ARUP (2018). 30 St Mary Axe. [Online]. Retrieved from: https://www.arup.com/projects/30-st-mary-axe?query=gherkin [Accessed:
Oct. 9, 2018]
Austin, M. & Qattan, W. (2016). ‘I’m a Visual Thinker.’ Rethinking algorithmic education for architectural design. Living Systems
and Micro-Utopias: Towards Continuous Designing, Proceedings of the 21st International Conference of the Association for
Computer-Aided Architectural Design Research in Asia (CAADRIA), Melbourne, Australia, pp. 829–838.
Autodesk (2018). The Dynamo Primer. [Online]. Retrieved from: http://dynamoprimer.com/en/ [Accessed: Mai. 14, 2018].
Backus, J. (1981). The History of Fortran I, II and III. Richard L. Wexelblat (Ed.) (1981). History of Programming Languages.
Proceedings of a 1978 ACM SIGPLAN conference, New York: Academic Press.
Bennis, W. (2003). Frank Gehry: Artist, leader, and “Neotenic.” Journal of Management Inquiry, 12(1), pp. 81- 87.
Boehm, B. (2006). A view of 20th and 21st century software engineering. Proceedings of the 28th International Conference on Software
Engineering (ICSE ’06), Shanghai, China, pp. 12 – 29.
Boeykens, S., & Neuckermans, H. (2009). Visual Programming in Architecture: Should Architects Be Trained as Programmers?
Joining Languages, Cultures, and Visions, Proceedings of the 13th International CAAD Futures Conference, Montréal: Les
Presses de l’Université de Montréal, pp. 41-42.
Boshernitsan, M. & Downes, M. (2004). Visual Programming Languages: A Survey. Technical report no. UCB/CSD-04-1368,
Berkeley: University of California.
Brown, T.B., & Kimura, T. D. (1994). Completeness of a Visual Computation Model. Software – Concepts and Tools, no. 15, pp.
34–48.
Bucci, F. & Mulazzani, M. (2000). Luigi Moretti: Works and Writings. New York: Princeton Architectural Press.
Burnett, M. M. & Baker, M. J. (1994). A Classification System for Visual Programming Languages. Journal of Visual Languages and
Computing, 5(3), pp. 287-300.
Burnett, M. M., Baker, M. J., Bohus, C., Carlson, P., Yang, S., & Van Zee, P. (1995). Scaling up Visual Programming Languages.
Computer, 28(3), pp. 45-54.

84
Burry, M. (2011). Scripting Cultures – Architectural Design and Programming. London: John Wiley & Sons Ltd.
Castellano, D. (2011). Humanizing Parametricism. Parametricism (SPC), ACADIA Regional 2011 Conference Proceedings, Lincoln,
Nebraska, USA, pp. 275-279.
Castelo Branco, R. & Leitão, A. (2017). Translating Algorithmic Design from CAD to BIM. KINE[SIS]TEM '17 - From Nature to
Architectural Matter International Conference, Lisbon, Portugal.
Castelo Branco, R. (2017). Integrated Algorithmic Design. Master’s Thesis, Lisbon: Instituto Superior Técnico.
Davidson, S. (2018). Grasshopper: Algorithmic Modeling for Rhino. [Online]. Retrieved from: http://www.grasshopper3d.com/
[Accessed: Mai. 14, 2018].
Davis, D. (2013). Modelled on Software Engineering: Flexible Parametric Models in the Practice of Architecture. Ph.D. Thesis,
Melbourne: RMIT University.
Eid, C. & Millham, R. (2012). Which introductory programming approach is most suitable for students: Procedural or visual
programming? American Journal of Business Education 5, (2012), pp. 173–178.
Engelbart, D. C. (1962). Augmenting Human Intellect: A Conceptual Framework. SRI Project No. 3578, California: Stanford Research
Institute.
Feist, S., Barreto, G., Ferreira, B., & Leitão, A. (2016). Portable Generative Design for Building Information Modelling. Living
Systems and Micro-Utopias: Towards Continuous Designing, Proceedings of the 21st International Conference of the
Association for Computer-Aided Architectural Design Research in Asia (CAADRIA), Melbourne, Australia, pp. 147–156.
Ferreira, B., & Leitão, A. (2015). Generative Design for Building Information Modeling. Real Time, Proceedings of the 33rd
International Conference on Education and research in Computer Aided Architectural Design in Europe (eCAADe), 1,
Vienna: Vienna University of Technology, pp. 635–644.
Foster, N. (2003) Architecture and Sustainability. Retrieved from: https://www.fosterandpartners.com/media/546486/essay13.pdf
Fusero, P., Massimiano, L., Tedeschi, A., & Lepidi, S. (2013). Parametric Urbanism: A New Frontier for Smart Cities. Planum. The
Journal of Urbanism, 2(27), pp. 1-13.
Graham, P. (2003, Apr.). Beating the Averages. [Online]. Retrieved from: http://paulgraham.com/avg.html [Accessed: Mar. 22, 2019]
Green, T. R., & Petre, M. (1992). When visual programs are harder to read than textual programs. Human-Computer Interaction:
Tasks and Organisation, Proceedings of ECCE-6 (6th European Conference on Cognitive Ergonomics). GC van der Veer, MJ
Tauber, S. Bagnarola & M. Antavolits. Rome: CUD, pp. 167-180.
Heidari, A., Sahebzadeh, S., Sadeghfar, M., & Taghvaei, B. E. (2018). Parametric Architecture in its Second Phase of Evolution.
Journal of Building Performance Simulation, 9(1), pp. 13-20.
Heijden, R. (2017, Feb. 8). The Morpheus Hotel: From Design to Production: Live Webinar. [Online]. McNEEL-Wiki, 3–5. Retrieved
from https://vimeo.com/203509846 [Accessed: Feb. 19, 2018].
Hirakawa, M. & Ichikawa, T. (1994). Visual languages studies – a perspective. Software - Concepts and Tools, 15, pp. 61-67.
Hirakawa, O., & Chang, S. K. (1986). VICON: A Visual Icon Manager. Visual Languages. New York: Plenum Press, pp. 151-190.
Ivanović, M., Budimac, Z., Radovanović, M., & Savić, M. (2015). Does the choice of the first programming language influence
students’ grades? Proceedings of the 16th International Conference on Computer Systems and Technologies, pp. 305–312.
Janssen, P., Pung, D., & Chen, K. W. (2019). Visual Programming for Geo-COmputation - Towards Tools for Tool Makers. Intelligent
& Informed: Proceedings of the 24th International Conference of the Association for Computer-Aided Architectural Design
Research in Asia (CAADRIA), 2, Victoria University of Wellington, Wellington, New Zealand, pp. 665 - 674.
Julia (2018). [Online]. Retrieved from: https://julialang.org/ [Accessed: Jun. 24, 2018].
Knight, C. (2012, Sep. 7) Frank O. Gehry: Sketches. ArcSpace. [Online]. Retrieved from: https://arcspace.com/studio/frank-o-gehry-
sketches/ [Accessed: Oct. 9, 2018]
85
Leitão, A. & Proença, S. (2014). On the Expressive Power of Programming Languages for Generative Design: The Case of Higher-
Order Functions. Fusion, Proceedings of the 32nd International Conference on Education and research in Computer Aided
Architectural Design in Europe (eCAADe), Newcastle upon Tyne: Faculty of Engineering and Environment, pp. 257-266.
Leitão, A. & Santos, L. (2011). Programming Languages for Generative Design: Visual or Textual? Respecting Fragile Places,
Proceedings of the 29th International Conference on Education and research in Computer Aided Architectural Design in
Europe (eCAADe), Ljubljana, Slovenia, pp. 549-557.
Leitão, A. (2013). Teaching Computer Science to Architects – A Proposal. Future Traditions, Proceedings of the 1st eCAADe Regional
International Workshop, Porto: Faculty of Architecture of University of Porto, pp. 95-104.
Leitão, A., Castelo Branco, R., & Aguiar, R. (2017). Algorithmic-Based Analysis: Design and Analysis in a Multi Back-end
Generative Tool. Protocols, Flows and Glitches, Proceedings of the 22nd International Conference of the Association for
Computer-Aided Architectural Design Research in Asia (CAADRIA), Suzhou, China, pp. 137-147.
Leitão, A., Castelo Branco, R., & Cardoso, C. (2017). Algorithmic-Based Analysis - Design and Analysis in a Multi Back-end
Generative Tool. Protocols, Flows, and Glitches: Proceedings of the 22nd International Conference of the Association for
Computer-Aided Architectural Design Research in Asia (CAADRIA), Xi'an Jiaotong-Liverpool University, Suzhou, China,
pp. 137-146.
Leitão, A., Castelo Branco, R., & Santos, G. (2019). Game of Renders: The Use of Game Engines for Architectural Visualization.
Intelligent & Informed: Proceedings of the 24th International Conference of the Association for Computer-Aided
Architectural Design Research in Asia (CAADRIA), 1, Victoria University of Wellington, Wellington, New Zealand, pp.
655 - 664.
Leitão, A., Lopes, J., & Santos, L. (2014). Illustrated Programming. ACADIA 2014: Design Agency, Proceedings of the 34th Annual
Conference of the Association for Computer Aided Design in Architecture (ACADIA), Los Angeles, USA, pp. 291–300.
Leitão, A., Santos, L., & Lopes, J. (2012). Programming Languages for Generative Design: A Comparative Study. International
Journal of Architectural Computing, 10(1), pp. 139–162.
Lopes, J., & Leitão, A. (2011). Portable Generative Design for CAD Applications. ACADIA 2011: Integration Through Computation,
Proceedings of the 31st Annual Conference of the Association for Computer Aided Design in Architecture (ACADIA),
Calgary/Banff, Canada, pp. 196–203.
Menzies, T. (2002). Evaluation Issues for Visual Programming Languages. Chang, S. (Ed.), Handbook of Software Engineering and
Knowledge Engineering, 2, Emerging Technologies, London: World Scientific Publishing Co. Pte. Ltd, pp. 93-101.
Miller, H. (2018). Cultivating Next-GEN Designers - The Systematic Transfer of Knowledge. Computing for a better tomorrow,
Proceedings of the 36th International Conference on Education and research in Computer Aided Architectural Design in
Europe (eCAADe), 1, Lodz: Lodz University of Technology, Poland, pp. 25-34.
Miller, N. (2011). The Hangzhou Tennis Center – A Case Study in Integrated Parametric Design. Parametricism (SPC), ACADIA
Regional 2011 Conference Proceedings, Lincoln, Nebraska, USA, pp. 141-148.
Moretti, L. (1971). Ricerca Matematica in Architettura e Urbanisticâ. Moebius IV no. 1, pp. 30-53. Republished in: Bucci, F. &
Mulazzani, M. (2000). Luigi Moretti: Works and Writings. New York: Princeton Architectural Press.
Myers, B. A. (1990). Taxonomies of visual programming and program visualization. Journal of Visual Languages & Computing, 1(1),
pp. 97–123.
Myers, B. A. (1998). A Brief History of Human-Computer Interaction Technology. Interactions, 5(2), pp. 44–54.
Navarro-Prieto, R., & Cañas, J. J. (2001). Are visual programming languages better? The role of imagery in program comprehension.
International Journal of Human-Computer Studies, 54(6), pp. 799-829.
NBBJ (2018). A City Blossoms. [Online]. Retrieved from: http://www.nbbj.com/work/hangzhou-stadium/ [Accessed: Jul. 30, 2018].
Nederveen, S., Bakkeren, W., & Luiten, B. (1993). Information Models for Integrated Design. CAAD Futures ’93, Proceedings of the
5th International CAAD Futures Conference, Pittsburgh, USA, pp. 375-390.
86
Noone, M., & Mooney, A. (2018). Visual and Textual Programming Languages: A Systematic Review of the Literature. Journal of
Computers in Education, 5(2), pp. 149-174.
O’Regan G. (2012). History of Software Engineering. A Brief History of Computing, London: Springer.
Payne, A. & Issa, R. (2009). The Grasshopper Primer. Robert McNeel & Associates.
Payne, J. (2010) Beginning Python: Using Python 2.6 and Python 3.1. Indianapolis: Wiley Publishing, Inc.
Pilsitz, M. (2017). Drawing and Drafting in Architecture: Architectural History as a Part of Future Studies. Periodica Polytechnica
Architecture, 48(1), pp. 72-78.
Python Software Foundation (2001). [Online]. Retrieved from: https://www.python.org/ [Accessed: Jun. 23, 2018].
Quirk, V. (2012, Dec. 7). A Brief History of BIM. ArchDaily. [Online]. Retrieved from: https://www.archdaily.com/302490/a-brief-
history-of-bim [Accessed: Out. 13. 2018].
Reas, C. & Fry, B. (2007), Processing: a programming handbook for visual designers and artists. The MIT Press, Cambridge,
Massachusetts & London, England.
Rosetta (2017). [Online]. Retrieved from Rosetta official website: http://web.ist.utl.pt/antonio.menezes.leitao/Rosetta/index.html
[Accessed: Jun. 22, 2018].
Sammer, M. & Leitão, A. (2019). Visual Input Mechanisms in Textual Programming for Architecture. Architecture in the Age of the
4th Revolution: Proceedings of the 37th International Conference on Education and research in Computer Aided Architectural
Design in Europe (eCAADe), Porto, Portugal, to appear.
Sammer, M., Leitão, A., & Caetano, I. (2019). From Visual Input to Visual Output in Textual Programming. Intelligent & Informed:
Proceedings of the 24th International Conference of the Association for Computer-Aided Architectural Design Research in
Asia (CAADRIA), Wellington, New Zealand, pp. 645-654.
Sammet, J. E. (1972). Programming languages: History and Future. Communications of the ACM, 15(7), p.601-610.
Sawhney, A., Singh, M. M., & Ahuja, R. (2017). Worldwide BIM Overview. Wu, P., Li, H., & Wang, X. (Eds.) (2017). Integrated
Building Information Modelling, Sharjah: Bentham Science Publishers, pp. 1 – 45.
Schaefer, R. (2011). On the limits of visual programming languages. SIGSOFT Softw. Eng. Notes 36(2), pp. 7–8.
Schumacher, P. (2008). Parametricism as a Style – Parametricist Manifesto. Darkside Club, 11th Venice Architecture Biennale, pp. 1-
5.
Schumacher, P. (2009). Parametricism - A New Global Style for Architecture and Urban Design. AD Architectural Design - Digital
Cities, Vol 79, No. 4.
Sutherland, I. E. (2003). Sketchpad: A Man-machine Graphical Communication System. Technical Report, number 574, Electronic
Edition, Cambridge: University of Cambridge.
Tedeschi, A. (2014). ADD _ Algorithms-Aided Design: Parametric Strategies using Grasshopper. 1st edition. Potenza: Le Penseur
Publisher.
Terzidis, K. (2004). Algorithmic Design: A Paradigm Shift in Architecture? Architecture in the Network Society, Proceedings of the
22nd International Conference on Education and research in Computer Aided Architectural Design in Europe (eCAADe),
Copenhagen, Denmark, pp. 201-207.
Wirth, N. (2008). A Brief History of Software Engineering. IEEE Annals of the History of Computing, 30(3), pp. 32–39.
Wu, H. C., Ho, M. C., Lai, M. M., & Chen, Y. H. (2016). Humanizing building with digital technology: Frank Gehry’s architectural
evolution. 2016 International Conference on Applied System Innovation (ICASI), Okinawa: Institute of Electrical and
Electronics Engineers Inc. (IEEE), pp. 1-4.