Embed Size (px)
Citation preview

THE EVOLUTION OF PROBABILISTIC RISK ASSESSMENTIN THE NUCLEAR INDUSTRY
M. R. HAYNSSchool of Engineering and Applied Science, Aston University, Birmingham, UK
T he use of probabilistic methods for evaluating the performance of plant is nowcommonplace. In the nuclear industries it has undergone a vigorous period ofdevelopment and is now considered by its a� cionados to be a mature topic. It may be
considered technically mature in that methods and data have been re� ned considerably and itspositive and negative points are well understood. However, its breadth of application,especially in its most complex forms when risk rather than reliability is evaluated, has not beenas wide as originally hoped, especially as an aid to regulation as in the evaluation of riskacceptance, or tolerability.
This paper follows the development of that set of analytical techniques which together formprobabilisticrisk (or safety) assessment through its most formative years (1975–1985)by meansof examples drawn from the de� nitive calculations of the period– in particular, the ReactorSafety Study (1975), the Zion and Indian Point studies in the USA and the Sizewell B study in theUK (all circa 1983). All of these studies contributed in speci� c ways to the development of themethods. In addition, the Sizewell B study, throughits use in a publicenquiry,also precipitatedadebate on the use and interpretation of the results in the public domain.
This evolution clearly shows both the power of the methods, and their extreme complication.These aspects have contributed to the current status of the methods, both for plant performanceand regulatory interpretations, and to the prospects for further developments.
Keywords: nuclear power; probabilistic methods; risk assessment; tolerability of risk; severenuclear accident methodology.
1. INTRODUCTION
The use of probabilistic methods for evaluating plantperformance is now very common. In the nuclear industriesit has undergone a vigorous period of development and inmany ways is considered as a ‘mature topic’. In fact, as thehistory of its development shows, it has served primarily tohighlight some key features of plant reliability, shown theenormous complexity and challenge in being able to fullycharacterize components and system performance in con-ditions well beyond their designed-for capabilities, andexposed the deep philosophical problems associated withde� ning acceptability (or tolerability) of risks, bothtechnically and in the public domain. This review attemptsto show how the methods have been developed, primarilywith reference to the needs of the nuclear industry. Theother reviews accompanying it in this issue address theorigins and history of loss prevention, and developments inthe offshore oil and gas industry. There are many points ofoverlapping interest, and some of the synergies will bebrought out. The vexed question of comparative riskassessment, either between nuclear and other industrialrisks or between human actions and natural events, is left tofurther discussion.
I have used the term ‘Probabilistic Risk Assessment’(PRA) in the title. This is synonymous with the moremodern usage of Probabilistic Safety Assessment (PSA) andis also the same as Quantitative Risk Assessment (QRA),
which is the terminology favoured by non-nuclear applica-tions. They are all similar in that they require quanti� cationof both the frequency (or probability) of an undesired event,and its consequences. For consistency I have used ‘PSA’throughout this review.
The International Atomic Energy Agency (IAEA) hasrather formally de� ned PSA as ‘The appropriate applicationof Probabilistic Risk Assessment (PRA) to safety deci-sions’1. As will be seen, it is not necessarily thequanti� cation of risk which the most useful parameter,and indeed it has been the dif� culties in characterizing risk,and particularly the associated uncertainties, which haveheld back the more general use of the methodology.
Whilst the concept of ‘risk’ is understood in a visceralsense by most people, it is in fact a very tenuous thing whenattempts are made to give it a rigorous de� nition. Thus, the‘dictionary’ de� nition is simply ‘a hazard, or the chance ofcommercial loss’2. This is not very illuminating. There havebeen a number of attempts by well-quali� ed technicalprofessionals to provide a more rigorous de� nition. Thus, in1983, The Royal Society Study Group offered a much-quoted de� nition3:
‘For the purposes of this report the Study Group views RISKas the probability that a particular adverse event occursduring a stated period of time, or results from a particularchallenge.
117
0957–5820© Institution of Chemical Engineers
Trans IChemE, Vol 77, Part B, May 1999Open access under CC BY-NC-ND license.
brought to you by COREView metadata, citation and similar papers at core.ac.uk
provided by Elsevier - Publisher Connector

An ADVERSE EVENT is an occurrence that producesharm.With RISK de� ned as above, HAZARD is seen as thesituation that in particular circumstances could lead to harm,where HARM is the loss to a human being or to a humanpopulation consequent on the damage and DAMAGE is theloss of inherent quality suffered by an entity (physical orbiological).BENEFIT is the gain to a human population.DETRIMENT is a numerical measure of the expected harmor loss associated with an adverse event.’
This de� nition or group of de� nitions is rather general,though comprehensive. A set of de� nitions more suitable foruse in the chemical process industries has been developedby the Institution of Chemical Engineers (IChemE)4.
‘HAZARD: a physical situation with a potential for humaninjury, damage to property, damage to the environment orsome combination of these.RISK: the likelihood of a speci� ed undesired eventoccurring within a speci� ed period or in speci� edcircumstances. It may be either a frequency (the numberof speci� ed events occurring in unit time) or a probability(the probability of a speci� ed event following a prior event),depending on the circumstances.’
These two de� nitions (or sets of de� nitions) are typical ofa number that have been produced, but are essentially of thesame type. The difference between them shows thedesirability of using the terms which are most suitable in aparticular context. For example, in its book Living withRisk5 the British Medical Association chose the RoyalSociety Study Group De� nition.
For use in the application to the nuclear industry it hasbeen suggested6 that an adaptation of the IChemE de� nitionis the most useful– that is:
‘RISK; the likelihood of speci� ed undesired eventsoccurring within a speci� ed period or in speci� edcircumstances arising from the realisation of a speci� edhazard. It may be expressed as either a frequency (theexpected number of speci� ed events occurring in unit time)or a probability (the probability of a speci� ed eventfollowing a prior event), depending on the circumstances.’
This de� nition indicates that the analysis is concernedwith a range of possible accident-initiating events whichcould cause different types of harm and to differing extents.
Although all the quotations above mention probabilitiesin their de� nitions, they do not de� ne what is meant. In factthe nature of probability– which de� nes the nature ofrisk– has been a topic of debate by mathematicians andphilosophers ever since its concepts were � rst applied. I donot wish to get into this in any detail; the de� nitions aresimply saying that risk is represented quantitatively usingthe algebra of probability7.
The three types of probability which occur whenestimating the risk posed by nuclear plant are:
· those obtained directly from observations (such as thestatistics of component failures);· those obtained by logical deduction (with such techniquesas the fault or event trees of probabilistic safety assessment);
· those expressing degrees of belief (such as arise from thetechniques used to extract expert opinion).
The nature of these three types of probability, as well asthe difference between frequency and probability, need tobe borne in mind whenever discussion of risk, andparticularly its quanti� cation, are undertaken.
A very useful compendium of de� nitions and genericterms and concepts relating to risk is available8.
The Evolution of the Concept of Risk
The concept of risk has, of course, a very long history andhas been extensively reviewed (see for example References9 and 10). The picture is generally of the concept of riskevolving from exposure to misfortune on the vagaries of ournatural environment to exposure to industrial hazards andother man-made activities. Thus, the concept of risk isdeeply embedded in our cultural heritage. That much of theearly evaluation of risk as a concept was closely linked withthe development of religious thought, especially theprobability of the after-life, should give the modern studentof the subject a strong forewarning that these are deep anddif� cult waters.
The concepts of insurance and home commercial riskmanagement have a history almost as long as the concept ofrisk itself, but the real milestone came with the developmentof probability theory by Pascal in 1657. This seems to haveinitiated a � urry of activity culminating in the � rstquantitative assessment of risks to health which would berecognized by modern practitioners– LaPlace’s analysis ofthe in� uence of smallpox vaccinations on the probability ofdeath in 1792.
An appreciation of the risk to the environment as a variantof the concept of risk to people began to emerge only later.(I leave aside many early assessments of risk to farmersfrom � ooding, pestilence and so on.) Indeed, the connectionbetween risks to man and risks to the environment, andhence the concept of the symbiosis between man and hisenvironment, came later still. This is described in LordAshby’s seminal book on environmental risk11. Theattainment of a society with time and wealth to appreciatethe natural environment seems to have been a prerequisitefor such a development. Perhaps the most eloquent exampleof such thinking is to be found in Rousseau’s Nightingale, ascited by Ashby. Rousseau asks to what lengths we should goto have the pleasure of hearing the nightingale.
As we come closer to the present time, and particularlythe last decades, the amount of literature expands enor-mously and the historical perspective is lost. However, theconcept of ‘risk’ does seem to have continued to evolve, andcertainly the common usage of the word is in � ux. Theemergence of the environmental movement has served tofocus on the relationship between man and his environmentto the point where it is no longer simply the impact of anactivity on people that is of concern, but rather the widerfeeling that we must be cognisant of the need to protect ourtotal environment that is of prime importance. These are notaltruistic or sentimental feelings. The clear interdependenceof all life on earth is now widely accepted, though fewwould go quite as far as Lovelock with the concept of Gaia.This movement has Rachel Carson’s Silent Spring as one of
118 HAYNS
Trans IChemE, Vol 77, Part B, May 1999

its in� uential milestones. Whether or not we agree with thetechnical details of works such as this, we must accept thatthey have signi� cantly affected the intellectual climate inwhich we now work, and we should attempt to express goalsin terms which properly match the public’s perception ofthese matters.
This brings the development of the concept of risk to thepresent. We have � nally introduced the idea of perception ofrisk. Risk cannot be felt (although fear can) and it isessentially unmeasurable. It can, however, be calculated,albeit imperfectly, and this leads to further problems. Take,for example, the question of life expectancy. This hasimproved enormously this century. Increases of about 20years have been achieved in Western Europe and NorthAmerica5. Despite this, reductions in the frequency ofcatastrophic events and continuing assurances that thehealth of the population is getting better, people constantlyindicate through polls and other sampling techniques thatthey believe life is getting riskier.
Furthermore, continuing scienti� c investigations arebringing new and previously unknown risks to the attentionof the public, creating an impression of an environmentbecoming increasingly hazardous for its inhabitants.Research into the factors controlling people’s perception ofrisk has indicated that the primary attributes for publicconcern are not mortality or morbidity rates, which seemremote, but characteriztics such as the potential forcatastrophe; lack of familiarity and understanding; theinvoluntary nature of risks; scienti� c uncertainty; lack ofpersonal control; risks to future generations; doubtfulbene� ts; inequitable distribution of risks and bene� ts; andpotentially irreversible effects. When coupled with the dreadof nuclear matters associatedwith weaponsand the ‘mystery’of radiation in general, these factors give some insights as towhy the generation of electricity by nuclear � ssion is bearingthe brunt of the debate concerning risks to society from theactivities of advanced technological industries.
The evolution of ‘risk’ as a component of our culture hasbeen presented above from the rather parochial view ofWestern cultural development. Any consideration of theacceptability (or tolerability)of risk is therefore dependent onthe cultural values existing in a society. Of particular concernis the relationship between purely economic factors (essen-tially a matter of insurance) and other aspects of society.Thus,the value attributed to human life has important rami� cationswhen judgements are made as to the costs which would beconsidered appropriate to improve the safety of plant, andhence save lives. Different nations and cultures might havediffering approaches to the issues of the cost of life and thebalance between the desire to develop technologies with thepotential for great bene� t and the need to make plant safe. Ishall not go into this, but note that I am addressing this issuefrom the perhaps parochial needs of an industry operating inthe conditions of the Western or developed nations.
This evolution of our ‘cultural’ understanding of risk isimportant because any calculations aimed at quantifying therisk posed by particular activities must be ‘interpretable’ interms of current usage. As will be seen, one of the outcomesof using PSA results in the public domain has been to fuelthe debate over the acceptability of nuclear activities ratherthan, as the purely technical interpretation of the resultswould seem to suggest, give members of the publiccon� dence that they are not seriously threatened by them.
The Beginnings of Quanti� cation of Risk and Reliability
An understanding of the evolution of reliability engineer-ing is as essential as PSA because it forms an importantsubset of the whole problem. The early days of usingstatistical methods for, for example, moving from single tomultiple engined aircraft in the 1930s, has been documentedin Green and Bourne’s seminal book on reliabilitymethods12. Reliability and ‘Life Testing’ are now well-advanced topics in their own right and are extensively usedin aerospace, military and many industrial applications. Fora recent overview see Kecicioglu13. It is not, however,quantitative risk assessment because it lacks any evaluationof the consequences of the failures (or, more precisely,failure rates) which it predicts. It is shown later that much ofwhat now falls under the heading of PSA is, in fact,reliability engineering since it is the intermediate results ofPSA which have become the most used– that is, those ofcomponent and systems reliability, or for the evaluation ofthe frequency of parameters which act as ‘markers’ for theperformance of the system, such as core melt frequency14.
Both the aircraft and nuclear industry were ‘feelingtowards a quali� cation of risk’15 by the 1960s. Particularcontributions were made by Siddall16 on the reliabilityof various reactor components and by Howard et al.17 onaircraft automatic landing.
In the UK, the Windscale accident in 1957 had animportant in� uence on the development of the approach tosafety18. It was not the instigator of the approach, because asearly as 1955 Marley and Fry19 made some evaluations ofthe consequences of possible reactor accidents so as to makesure that recommendations concerning siting and permis-sible levels of population in the viscinity of nuclear plantwere available to decision-makers. At the same time, thedesigners of the � rst generation of nuclear power stationsbelieved that a measure of absolute safety could be achievedby a combination of siting (limiting the number of peopleaffected) and by reactor design (making an event leading toa release of radioactivity highly improbable). It becameclear from the Windscale experience that absolute safety asenvisaged could not be achieved and that there was evolvinga crucial need to be able to quantify the risks.
It is widely accepted that Farmer made the � rst steptowards risk analysis by producing, towards the end of the1960s20, his criteria for the permissible probabilities ofreleasing quantities of 131I, a very volatile � ssion productwhich tends to be the most easily released following anuclear accident. The levels are reproduced in Figure 1.The basic objective of these criteria was to ensure that lessthan one death to the public should be predicted for theforeseeable future arising from the operation of the thenplanned gas cooled reactors in the UK. By modern standardsthese criteria might seem very crude. Only one volatile� ssion product was considered, and there was no spectrumof accident sequences leading to a range of well-character-ized releases. These would be called ‘source terms’ intoday’s parlance. However, and this is the key point, inorder to make use of the criteria, it is necessary to assess thevarious probabilities of different levels of release. At thattime this was a dif� cult task because of the lack ofquantitative data for failure rates of different components.This need for the acquisition of reliability data was wellappreciated in the UK and led to the setting up of the Safety
119PROBABILISTIC RISK ASSESSMENT IN THE NUCLEAR INDUSTRY
Trans IChemE, Vol 77, Part B, May 1999

and Reliability Service in the United Kingdom AtomicEnergy Authority (UKAEA) in 1970. This eventuallybecame part of the National Centre of Systems Reliabilityand this had, and still has, a large membership across a rangeof industries and from many countries. It is presentlyincorporated in AEA Technology, the commercial companyprivatized out of the ‘old’ UKAEA.
This database and others was an essential precursor to thecomplicated and detailed PSA studies which were soon tofollow.
This brings us to a position in the early 1970s when theneed for improved quantitative analysis was clear, and themeans for it were almost all in place.
It is sometimes said that the history of PSA begins with its� rst major application– the Reactor Safety Study (WASH1400)21. This introductory discussion is meant to show thatwhilst this is indeed the case so far as a full-scale PSA isconcerned, it was made possible by the evolution ofrequirements for better ways of evaluating the reliabilityof plant, and of the consequences of the resulting releases ofradioactivity.
The rest of this review follows the evolution of the fullquantitative PSA method from the Reactor Safety Study(RSS), through a number of later de� ning studies (Zion,Indian Point and the Sizewell B Analysis) in Section 2, tothe point where the methodology and its implications weredebated in a public/legal forum– that is, the Sizewell Bpublic enquiry. Finally, the de� nitive compendium docu-ment on guidance for PSA users– NUREG 1150 of198922– is used to close off this intensive period of methodsdevelopment. The resulting lessons learned have contributed toits continued use, especially as a possible regulatory tool, andthis is given some attention in Section 3. Then in Section 4, Ireview the state of the art in the methodology and highlightwhere the current outstanding issues are.
In Section 5 I brie� y summarize the R&D which has beenundertaken to back up the severe accident analysisrequirements of a full-scope PSA, and indicate where weseem to be at present. Some spin-offs and practical uses ofthis research, particularly in accident management and inthe treatment of human factors, are discussed.
Since one of the original ‘visions’ for PSA was in its useas a tool for judging the acceptability of plant against risk-based criteria, I include in Section 6 a brief examination ofhow regulatory authorities have responded to the develop-ment of this major new tool. I try to indicate why it has notbeen fully incorporated into the regulatory process and drawsome conclusions concerning implications of the use of‘risk’ as a quantitative acceptance parameter as a result ofthe extensive discussions of the matter at the Sizewell Bpublic inquiry.
After the mid-late 1980s, the evolutionary path of PSAdivides into many different areas and it becomes increas-ingly dif� cult to maintain a coherent overview. However, inSection 7 I consider some of these newly developed areasand, with a little crystal-gazing, try to identify clearmessages for the future.
In summary, the main sections of this review are:
Section 2: Milestone PRA calculationsSection 3: Major insights gained from the studiesSection 4: The state of the art in PSA methodsSection 5: Severe accident research and developmentSection 6: The regulators’ views of probabilistic methodsSection 7: Summary and messages for the future
2. MILESTONE PSA CALCULATIONS
The key developments in the methodology of PRA cameduring the decade 1975–1985. A number of ground-breaking analyses were performed which have shaped thenature of the PSA tool as it is today. This section brie� yidenti� es these analyses and indicates the particularcontributions and lessons which they gave.
2.1 The Reactor Safety Study (WASH 1400)
Although it is now almost universally agreed that the RSSwas the milestone study for PSA and that it has radicallychanged how active safety issues are addressed, it is ameasure of the pace of development that it is now equallyconsidered to be outdated. However, any review of PSAdevelopment should begin with at least the realization thatmany of the features that we now consider to be written on‘tablets of stone’ were in fact invented for use in the RSSand, regardless of technical advances, remain the acceptedform today. In reviewing the RSS, therefore, it is useful tohighlight some of these now established aspects of PSA,through reference to their past use.
The RSS studied two LWR systems– the Pressurized-Water Reactor (PWR) at Surrey 1 and the Boiling-WaterReactor (BWR) at Peach Bottom.
The concept of accident sequences and their use both asidenti� ers of important nodal points in accident develop-ment and as conceptually appealing means of representingthe possible outcomes was evolved in the RSS. This way ofcategorizing accidents is still in common use, as is thenomenclature � rst devised in the RSS. This is illustrated inTable 1, where the original RSS classi� cation scheme isshown. The description of accident sequences was taken onestep further by the RSS in that accidents with nominallysimilar � ssion product releases were again condensed into asmaller set of groups called release categories. Nine suchcategories were de� ned. This was a less satisfactory aspect
120 HAYNS
Trans IChemE, Vol 77, Part B, May 1999
RE
AC
TO
R Y
EA
RS
102
10710CURIES I 131
106105104103102
103
104
105
106
107
Figure 1. Criteria for release of 131I proposed by Farmer in 1967.Reproduced from Reference 20 by permission of the IAEA.

of the RSS methodology and these categories have notsurvived into present usage. The trend now is less towardcategorization and more toward the evaluation of detailedestimates of release fractions at the accident sequence level.This is because the amounts of � ssion products calculatedby the modern generation of computer models are found tobe very sensitive to apparently small differences betweensequences, and indeed for the same sequence from plant toplant23. To give an impression of the kinds of accidentsequences which were grouped together into categories,Table 224 shows a breakdown of a set of release categoriesderived for the Sizewell B study and which I use here ratherthan those of the RSS as they are more descriptive and theyalready include additional insights.
One innovation introduced in the RSS which has become� rmly established in PSA methods is the use of the CCDF(Complementary Cumulative Distribution Function)* as ameans of displaying the numerical results for risk. Theprincipal reasons for this are outlined in the RSS21 (MainReport, 2.2, p. 11). The expression of risk as an individualrisk number such as 10–5 per year had been used previouslyin attempts to delineate risk acceptance levels at thattime25. However, the RSS authors were not satis� ed withthis individual risk representation since it does notdifferentiate with respect to the magnitude of the con-sequences of accidents. Society generally views the singlelarge consequence event unfavourably compared to the totalof small events having the same average risk. This isre� ected in the Farmer criterion20 which was risk averse,and indeed the authors of the RSS (notably ProfessorRassmussen) have acknowledged that Farmer’s approachin� uenced their choice of CCDFs to demonstrate aversion.
The concept of risk aversion was introduced to accountfor the fact that large consequence events are viewed with
such horror that their low frequency is likely to bediscounted when judgements concerning acceptability areto be made. It may be said that the RSS, in leading the wayin showing the consequences of reactor accidents in terms ofnumbers of people who could be killed or the area of landwhich might be contaminated, did the nuclear industry adisservice. In reality, events of the past 10 years have shownthat such quanti� cation and expression of risk in meaningfulterms has led to vast improvements in the industry’sunderstandingof risk. It has also led directly to action whichhas reduced the risk from operating, and future, powerplants.
Whether risk aversion should be considered, and at whatlevels of consequence the public would become concerned,is not for PSA analysts alone to ponti� cate upon– as a topicit is still under lively debate and is discussed further inSection 6. Here I only wish to point out that judgementsconcerning the acceptability or tolerability of risk can onlybe made if a reasonable assessment of the risk posed by aplant is available. PSA provides the means for quantifyingthe risk, and the RSS led the way in expressing the results ina form useful for such a purpose.
The methods developed for expression of the risks in theRSS study are illustrated in Figures 2 and 3 where CCDFsfor early and delayed facilities are shown respectively.These curves indicated explicitly (for the � rst time) thatthere was a (low) chance that more than ~ 4000 peoplemight be killed immediately and ~ 50,000 later as a result ofa reactor accident. As an additional source of worry to thepublic, the RSS also gave details of the potential groundcontamination as shown in Figure 4. The principal authorsof the RSS believed that these � gures represented such a lowrisk that the public would immediately recognize the logicof nuclear power as a clean and safe technology. They failedto take into account their own judgement on risk aversionand that low frequencies are much harder to comprehendthan large consequences.
121PROBABILISTIC RISK ASSESSMENT IN THE NUCLEAR INDUSTRY
Trans IChemE, Vol 77, Part B, May 1999
Table 1. Categorization and nomenclature for accident sequences. Reproduced from Reference 21 bypermission of the USNRC.
Symbol Description
A Intermediate to large LOCAB Failure of electric power to ESFsB0 Failure to recover either on-site or off-site electric power within about 1 to 3 hours
following an initiating event which is loss of off-site AC power.C Failure of containment spray injection systemsD Failure of emergency core cooling injection systemsF Failure of containment spray recirculation systemG Failure of containment heat removal systemH Failure of emergency core cooling recirculation systemK Failure of reactor protection systemL Failure of secondary relief valves and the auxiliary feedwater systemM Failure of the secondary system steam relief valves and the power conversion systemQ Failure of primary system relief valves to close after openingR Massive rupture of the RPVS1 A small LOAC with an equivalent diameter of 2–6 inchesS2 A small LOCA with an equivalent tube diameter of 1
2–2 inchesT Transient eventV LPIS check valve failure (interfacing systems LOCA)a Containment failure due to reactor pressure vessel steam explosionb Containment failure due to inadequate isolation of containment openings and sealsg Containment failure due to hydrogen burningd Containment failure due to overpressuree Containment vessel melt through
* CCDFs give values for the probability of exceeding certain levels ofconsequences.

As the � rst comprehensive study, the RSS clari� ed manyof the ‘insights’ which are now generally associated with theimplementation of PSA studies. Rather than repeat them, Idefer the description of a list of such insights until I havediscussed the contributions of other milestone studies.However, several features of the RSS results should behighlighted because they had a signi� cant impact on theway the methodology developed post 1975.
First, the study indicated that, contrary to any precon-ceived notions, large pipe breaks did not dominate the riskposed by the plant. Rather the performance of valves (failureto reseat), small pipe breaks and transient events and humanaction all contributed signi� cantly to the risk. No simple,single features were identi� ed26. Thus, emphasis in morerecent studies has been on methods for handling multiple ordependent failures (common cause failure), completeness(that is, have all possible routes/sequences been identi� ed?)and human/machine interfaces.
Even though the RSS’s treatment of post core melt eventsis now considered to be rather crude, one of the most far-reaching insights gained by the study was that core melt didnot always equate to very large consequences. In the RSS,following a core melt, the containment boundary wasalways assumed to be penetrated; this conclusion arises
from the fact that basement melt-through was considered‘unstoppable’ because of the high decay heat generated bythe molten core (the so-called ‘China’ syndrome). However,this route to the environment would lead to considerable� ltering of the radionuclides and thereby reduce the amountavailable for harm to the population.More recent thinking isthat the containment is rather unlikely to fail at all. And,indeed, one question of whether Reactor Pressure Vessel(RPV) failure is an inevitable consequence of core melt (orpartial core melting) has been raised by the very detailedanalysis which has been completed on the physicalprocesses underlying the TMI-2 accident sequence devel-opment27. However, the realization that core melt did notequate necessarily to catastrophic consequences led to thenow very large programme of work investigating contain-ment performance so that proper account may be taken of itin risk assessment. This boils down to developing data andmethods to enable the performance of buildings andequipment to be evaluated when subjected to conditionsbeyond their design limits and in devising ‘severe accidentmanagement’ schemes aimed speci� cally at containing ormitigating core melt accidents28.
A natural rami� cation of the realization that not all severeaccidents lead to very large releases is that the most likely
122 HAYNS
Trans IChemE, Vol 77, Part B, May 1999
Table 2. Description of accident release categories used in the Sizewell B PSA: (a) Category descriptions; (b) Grouping of chemical species. Reproducedfrom Reference 41 by permission of Westinghouse.
(a)
Release category Summary description
UK1 Used for accident sequences involving core melting, where a containment bypass pathway from the primary circuit to theenvironment exists. The pathway considered in this study is the failure to the isolation valves separating the reactor coolingsystem and the low pressure residual heat removal system. It is equivalent to the V sequence of the RSS.
UK2 Used for overpressure failure events with a source term re� ecting the possible occurrence of a steam explosion, and in whichthe containment sprays are not functioning. It is also used to include those sequences where, although there is no steamoverpressure failure, an isolation failure or small bypass of the containment occurs.
UK3 Used for early overpressure failures where sprays are not functioning. It is also used for sequences where sprays arefunctional but where containment failure occurs so soon after most of the � ssion products are released from the reactorsystem that the sprays are not effective in removing � ssion products from the containment atmosphere and in particular forsmall-break sequences.
UK4 Used for overpressure events with the assumed occurrence of a steam explosion at a time when the spray system isfunctioning.
UK5 Used for late overpressure failures without sprays operating. Failures are as a result of relatively slow pressure build-up dueto loss of containment heat removal capability. It is pessimistically assumed that failure occurs after 4 hours. Cooling of thecore debris is lost so that dry-out and vaporization release occurs.
UK6 Used for late overpressure failures without sprays operating. Failures are as a result of relatively slow pressure build-up dueto loss of containment heat removal capability. In this case, failure is assumed to occur after 8 hours. Debris in the cavityfrom the molten core remains covered by water so that no vaporization release occurs.
UK7 Used for delayed overpressure failure events following a large break LOCA with spray systems functional for a signi� cantperiod before RPV failure.
UK8 Used for delayed overpressure failure sequences for which the spray systems are functional.UK9 and 10 Used for melt-through of the base mat, with and without spray failure respectively. A release takes place through the base
mat and the surrounding soil to the atmosphere.UK11 and 12 Used for all degraded core accidents in which the containment remains intact or for which the system is recovered. UK11
and 12 refer to cases with and without spray failure, respectively. Radioactive release to the environment would be small,corresponding only to normal levels of containment leakage.
(b)
Class Description
1 Xenon (Xe) and krypton (Kr) noble gases2 Organic iodine3 Elemental iodine, halogens4 Caesium (Cs) and rubidium (Rb) alkali metals5 Tellurium (Te)6 Barium (Ba) and strontium (Sr) alkaline earths7 Ruthenium (Ru) noble metals8 Lanthanum (La) refractory oxides, including actinides.

result of a core melt accident is a very small number (if any)of off-site consequences. This may seem self-evident today,but it was not so in 1975. The RSS authors were quick topoint this out and said:
‘For the most likely course of events following the meltingof the core; the number of fatalities expected is muchsmaller than those that commonly occur in accidents such as� res, explosions and crashes of commercial airliners.
‘In addition the likelihood of core melt is calculated to bemuch smaller than any of the above.’ [Reference 21, 1.8, p. 6]
In order to demonstrate these insights the RSS comparedthe calculated results, taking a reactor programme of 100reactors, with statistical data from other activities. This isthe now quite well known Figure 6-1 of the RSS and isshown here as Figure 5. Much has been said concerning thepropriety of making risk comparisons of this type; thiscannot be followed up here, but see References 6 and 29 forexample.
In the RSS the � nal remarks [Reference 21, 1.10, p. 7] are:
‘This report provides considerable background for gainingan understanding of the concepts involved in risk assess-ment and of the elements involved in nuclear power plantsafety. The results of the study of nuclear reactor accidentrisks are presented and compared with risks due to naturalphenomena and other technologies in our society in order toprovide perspective on low probability risks. A large amountof information has been developed in conducting the study
123PROBABILISTIC RISK ASSESSMENT IN THE NUCLEAR INDUSTRY
Trans IChemE, Vol 77, Part B, May 1999
PR
OB
AB
ILIT
Y P
ER
RE
AC
TO
R Y
EA
R >
X
10–3
EARLY FATALITIES, X105104103102
10–4
10–5
10–6
10–7
10–8
10–9
101100
PWR
Average curve
BWR
Figure 2. RSS results for risks of early fatalities per reactor year ofoperation for PWR and BWR plant in the form of CCDFs. (Approximateuncertainties are estimated to be represented by factors of 1/4 and 4 onconsequence magnitudes and by factors of 1/5 and 5 on probabilities.) Notethat as early as the RSS there was a qualitative attempt to representuncertainties.Reproduced from Reference 21 by permission of the USNRC.
PR
OB
AB
ILIT
Y P
ER
RE
AC
TO
R Y
EA
R >
X
10–3
LATENT CANCER FATALITIES PER YEAR, X105104103102
10–4
10–5
10–6
10–7
10–8
10–9
101100
BWRAverage curve
PWR
Figure 3. RSS results for risks of latent cancer fatality incidences perreactor year in the from of CCDFs. (Approximate uncertainties areestimated to be represented by factors of 1/6 and 3 on consequencemagnitudes and by factors of 1/5 and 5 on probabilities.)Reproduced from Reference 21 by permission of the USNRC.
PRO
BA
BIL
ITY
PE
R Y
EA
R >
X
10–3
RELOCATION AND DECONTAMINATION AREAÑ MILES2, X
103102101
10–4
10–5
10–6
10–7
10–1
10–2
10–1
Decontamination area
Relocation area
100 104
Figure 4. RSS results for probability of ground contamination following areactor accident in the form of CCDFs. (Approximate uncertainties areestimated to be represented by factors of 1/5 and 2 on consequencemagnitudes and by factors of 1/5 and 5 on probabilities.)Reproduced from Reference 21 by permission of the USNRC.

and most of it is presented in this report and its appendices. Itis expected that this information will be of use in making thecontroversy about reactor safety more objective. Obviously,the question of the acceptability of nuclear accident risksrequires a much broader social judgement that transcends thescope of the Reactor Safety Study.’
Just how successful it has been in bringing objectivity torisk assessment can be gauged from the developments sinceand the industry which has now developed to serve theneeds of the utilities and regulators in PSA.
2.2 The Zion30 and Indian Point Studies31
These studies are included here because they representtwo very important milestones in the early use of PSA. First,these were the initial studies to include comprehensive anddetailed assessments of the effect of a range of externalevents on the risk and second, it was the � rst time that PSAhad been used in a licensing or regulatory sense. In late1976, the US Nuclear Regulatory Commission (NRC)Commissioners, as a result of a petition to shut down theIndian Point plants, required that Zion² and Indian Pointperform in-depth risk studies. Over three years, detailedstudies investigating all aspects of external (seismic, � re,
wind, � ood) as well as internal risk were conducted. Thesewere the � rst studies to examine seismic and � re risks,including uncertainties, in detail, and as such represented atest of the method. In addition, substantial advances weremade in the evaluation of severe accident phenomenology,which included realistic transient analysis and containmentstrength, a detailed ‘containment event tree’, and supportingexperimental programmes in areas of hydrogen combustionand debris bed coolability. Following review and commentby NRC contractors, this study served as a focal point in anAtomic Safety and Licensing Board (ASLB) hearingaddressing the Indian Point site. In spite of the substantiallyhigher-than-average population density, the study con-cluded that the risks were comparable to risks at othersitesand well withintheCommissioners’ then-proposedsafetygoals32. An NRC sponsored study conducted at the same timeinvestigated a broad variety of sites and PSA studies, andconcludedthat risk variabilitydue to populationdifferences isnot as signi� cant as is the risk variability due to designdifferences33,34.
Even though the models for core melt progression andcontainment performance were considerably improved overthose available to the RSS, a signi� cant conclusion fromthese studies, and especially the containment analysis, wasthat the more we knew about core melt, the less likely thatvery large accident consequences would eventually arise.This led directly to the creation of a major R&D effort forbetter understanding of severe accidents. A brief historicaloverview of this important research area is given inSection 5, but note that even though those programmeshave been running, in some cases, in excess of 15 years,‘closure’ is, in many cases, still elusive35.
The calculated values for the contribution to core meltfrom the various accident sequence types (for internallyinitiated events) are shown in Figures 6 and 7. These arefrom the Zion Study and are included to illustrate how theimportant contributors can be identi� ed, both at the accidentsequence level and release category level. Note that in these� gures it is not total risk which is being used to determinethe relative contributions. This is an important featurebecause the principal contributors to either a releasecategory (a rather arti� cial quantity) or to core meltfrequency will not necessarily have the same ranking withregard to risk. This is discussed more fully in the sectiondevoted to Sizewell B below.
External eventsOne of the most important features of the Zion and Indian
Point Studies was their comprehensive treatment of externalevents.
The range of external events considered included:
1. Fire2. Floods3. Tornadoes (and associated missiles)4. Aircraft accidents5. Turbine missiles6. Transportation and hazardous materials7. Seismic effects.
In order to show the effects of external events, results inthe same format as Figures 6 and 7 are shown for IndianPoint 2 and 3 in Figures 8 and 9. In these � gures thecontribution from external events is shown hatched. Even
124 HAYNS
Trans IChemE, Vol 77, Part B, May 1999
FR
EQ
UE
NC
Y (
EV
EN
TS/
YE
AR
> X
)
10–2
10FATALITIES, X
1,000,000100,00010,0001000100
10–3
10–4
10–5
10–6
10–7
10–1
1
10
100 Nuclear power plants
Air crashespersons on ground Chlorine releases
Explosions
Fires
Dam failures
Total man-caused
Air crashes total
Figure 5. RSS results comparing risks (in the form of CCDFs) from 100nuclear power stations and other industrial activities and naturallyoccurring events. Fatalities due to auto accidents are not shown becausedata are not available for large consequence accidents. Auto accidentscause about 50,000 fatalities per year.(All of the statistical data in this � gure are relevant pre-1975.)Reproduced from Reference 21 by permission of the USNRC.
² Note that the Zion plant, owned by Commonwealth Edison, was, in fact,closed in 1998.

125PROBABILISTIC RISK ASSESSMENT IN THE NUCLEAR INDUSTRY
Trans IChemE, Vol 77, Part B, May 1999
AN
NU
AL
FR
EQ
UE
NC
Y O
F O
CC
UR
RE
NC
E
10–5
2R7
RELEASE CATEGORY
Z-55R68A8B
10–6
10–7
10–8
10–9
10–10
Z-3 2 Z-1 TOTALCORE-MELT
10–4
0.001%0.001%
0.01%
0.1%
1.0%
10%
100%
1.8-2%
99.1%
2.0-2%1.2-2%
6.4-3%
<2.3-4%
5.0-4%
0.57%
0.26%
<2.3-4%
4.21-5 YR–1
Figure 6. Zion PSA results: contribution to total core melt frequency by release category. The release category de� nitions are given in Reference 31, but notethat the dominant category (8B) represents a very small release to atmosphere as it is for an accident sequence in which the containment remains intact andthe in-containment spray system is functional. The release categories are:Z-10– seismic failure of containmentZ-1– early overpressure failure of containment2– containment bypass2RW– late overpressure failure of containment8A– containment intact without spray operation8B– containment intact with spray operationReproduced from Reference 30 by permission of ComEd.
AN
NU
AL
FR
EQ
UE
NC
Y O
F C
OR
EM
ELT
10–5
TESESL
SLFCSLFSLC
CORE DAMAGE STATE
TEFCTEFTEC
AEFCAEFAEC
SEFCSEFSEC
ALFCALFALC
10–6
10–7
V AEAL
TOTAL
1.0%
10%
100%
49.9%
23.2%17.6%
4.2% 4.2%
0.6%
0.2%
<10–11PER REAC-YR
4.21-5
Figure 7. Zion PSA results. Contribution to total core melt frequency by core damage state. The core damage states are de� ned by lists of initiating andsubsequent events and can be interpreted using Table 1. Thus, for example, the designation SLFC is a sequence of events comprising:S = small LOCAL = failure of secondary system steamF = failure of containment spray recirculation systemC = failure of containment spray injection systemFor V sequence this is LPIS check valve failure (that is, containment bypass).Reproduced from Reference 30 by permission of ComEd.

though both Zion (for which similar results were obtained)and Indian Point are in areas thought to be relatively ‘safe’vis-a-vis external hazards, the contribution to core meltfrequency is 550% overall from these events. Clearly, ifinternal initiators are reduced, then eventually the very largebut very low probability external events must dominate thetotal risk and may well represent an ultimate level of riskattainable for the technology. Table 3 gives the detailedbreakdown of results in tabular form. This is taken fromTables 8.3-2A-1 and 8.3-2A-1 (revised)33.
A representative calculated risk curve for the Indian Point
2 study is shown in Figure 10. In this the internal andexternal contributions to risk are shown along with theinternal ones alone. The importance of external events ishighlighted by this � gure.
Figure 10 also gives uncertainty estimates at the 50% and90% con� dence levels. In fact, the uncertainty calculationswere very much more sophisticated than might be assumedfrom Figure 10 and so in Figure 11 the calculatedprobability densities are shown for the contributions tocore melt frequency for the various release categories forIndian Point 2 (see Reference 33).
126 HAYNS
Trans IChemE, Vol 77, Part B, May 1999
AN
NU
AL
FR
EQ
UE
NC
Y O
F O
CC
UR
RE
NC
E
10–5
Totalinternal
Totalseismic
INITIATING EVENT
Totalfires
Totalwind
10–6
10–7
10–4
0.1%
1.0%
10%
100%
10–3
12.9%
3.31´10–4/YRExternal eventInternal event
Total2RW
all events
0.34%
43.5%43.5%
Figure 9. Indian Point PSA. Breakdown of contributions to the dominant release category in Figure 8 (2RW). The category is clearly seen as beingdominated by external events, with seismic and � res contributing about equally.Reproduced from Reference 31 by permission of Consolidated Edison Co.
AN
NU
AL
FR
EQ
UE
NC
Y O
F O
CC
UR
RE
NC
E
10–5
2R7
RELEASE CATEGORY
Z-55R68A8B
10–6
10–7
10–8
10–9
10–10
Z-3 2 Z-1 TOTALRELEASEFREQUENCY
10–4
0.001%
0.01%
0.1%
1.0%
10%
100%
0.004%
0.0001%
Z-1Q
10–3
19.1%10.6%
69.9%
0.14%
4.72´10–4/YR
3.47
´10–3
%
1.7´10–3%
4.6´
10–5
%
9.9´10–2%
1.0´10–4%
<10–5% <10–5%
External eventInternal event
2RW
Figure 8. Indian Point PSA. Contributions to total release frequency by release category (as de� ned in the caption to Figure 6.) highlighting the contributionsfrom internal and external events.Reproduced from Reference 31 by permission of Consolidated Edison Co.

The indication of ‘� re’ as a serious and signi� cantaccident initiator is borne out by experience. The � re at theTVA Browns Ferry Plant was a very near miss, and morerecently, the most likely initiator for severe accidents inRussian-designed plant has been identi� ed as from internal� res. (See, for example, Reference 36.)
2.3 Major PSA Studies on Reactors at the Design Stage
It is a moot point as to whether PSA as currently availablecould be described as a ‘design tool’. However, it is clearthat the PSA performed by Westinghouse and UKAEA stafffor the proposed Sizewell B PWR was done at the designstage and may be legitimately seen as having had anin� uence on the design. (For an authoritative description ofhow the then CEGB viewed the use of PSA for the SizewellStudy, see Reference 37.)
The rationale for performing a PSA at an early stage ofthe design process has been described in the proof of R RMathews (CEGB’s safety director at the time) (CEGB P2)37
and in the CEGB’s statement of case38 to the Sizewell B PublicInquiry. In Chapter 21 (paragraph 21.3) it is stated that:
‘The design targets are set at levels of probability so lowthat, if they are met, the chances of failing to copesatisfactorily with any postulated accident are very remote.It might be considered unrealistic to try to go further andanticipate what would happen if all of the safety provisionsfailed completely. The CEGB has nevertheless initiatedstudies which do attempt to analyse those very remotepossibilities. It has done so for a number of reasons. First, itrequires con� rmation that the predicted probabilitiesof verysevere accidents occurring are not immediately below thecriterion or ‘cut-off’ point for design basis accidents. If thiswere not con� rmed, then some alternations in design couldbe required to reduce the probability to a new, lower, level.Secondly, the CEGB feels that it is desirable to understandthe potential consequences of uncontrolled releases; thisprovides a measure of the possible harm which could resultfrom such accidents against which to balance the largeresource, cost and effort that is expended to ensure the
127PROBABILISTIC RISK ASSESSMENT IN THE NUCLEAR INDUSTRY
Trans IChemE, Vol 77, Part B, May 1999
Table 3. Indian Point PSA results. Contributions to total care melt frequency from internal and external events. Detailed breakdown by initiating event andrelease category. Reproduced from Reference 31 by permission of Consolidated Edison Co.
Seismic Early Containment Containment Totalfailure of overpressure Containment Late intact intact core
containment failure bypass overpressure without spray with spray melt
ReleaseInitiating events category Z-1Q Z-1 2 2RW 8A 8B CM
Large LOCA (1) 0 1.6–9 1.6–9 1.8–17 1.4–9 1.6–5 1.6–5Medium LOCA (2) 0 1.6–9 1.3–9 1.6–17 1.1–9 1.3–5 1.3–5Small LOCA (3) 0 3.4–14 1.7–9 1.5–8 4.9–9 1.7–5 1.7–5Steam generator tube 0 4.9–14 1.6–11 2.2–8 4.7–11 1.2–7 1.4–7
rupture (4)Steam break inside 0 7.4–17 2.0–11 3.2–11 2.6–11 2.0–7 2.0–7
containment (5)Steam break outside 0 7.4–17 2.0–11 3.2–11 2.6–11 2.0–7 2.0–7
containment (6)Loss of main feedwater (7) 0 5.8–14 1.8–10 2.6–8 3.4–10 1.8–6 1.8–6Loss of one MSIV (8) 0 1.1–14 1.8–11 4.9–9 5.1–11 1.7–7 1.7–7Loss of RCS � ow (9) 0 1.1–15 3.3–12 4.8–10 6.2–12 3.2–8 3.3–8Core power excursion (10) 0 6.7–23 2.1–19 3.0–17 4.0–19 2.0–15 2.1–15Turbine trip (11a) 0 6.3–14 2.0–10 2.9–8 3.7–10 1.9–6 2.0–6Turbine trip, loss of 0 2.2–12 3.9–9 1.0–6 3.5–9 3.7–5 3.8–5
offsite power (11b)Turbine trip, loss of 0 7.8–15 6.4–12 3.5–9 3.6–13 5.7–8 6.0–8
service water (11c)Reactor trip (12a) 0 5.9–14 9.8–11 2.7–8 2.8–10 9.3–7 9.6–7Reactor trip, loss of 0 1.7–17 3.7–12 7.7–12 3.1–12 3.7–8 3.7–8
component cooling (12b)Interfacing system LOCA (V) 0 0 4.6–7 0 0 0 4.6–7
Switchgear room 0 0 0 5.6–5 0 0 5.6–5Electrical tunnel 0 0 0 8.8–5 4.8–5 0 1.4–4Cable spreading room 0 0 0 3.0–7 0 1.6–6 1.9–6Diesel generator building 0 0 0 4.4–8 0 4.0–7 9.0–7
Tornado 0 0 0 1.6–5 4.9–10 0 1.6–5Hurricane 0 0 0 2.7–5 0 0 2.7–5
Total seismic 6.8–7 1.3–8 2.9–8 1.4–4 4.2–9 2.6–10 1.4–4Total wind 0 8.5–11 8.5–9 4.3–5 4.9–10 0 4.3–5Total � res 0 3.0–10 3.8–8 1.4–4 4.8–5 2.5–6 2.0–4Total internal 0 3.2–9 4.7–7 1.1–6 1.2–8 8.8–5 9.0–5
Total all events 6.8–7 1.7–8 5.4–7 3.3–4 4.8–5 9.1–5 4.7–4
Note: 1.6–9 is read as 1.6 ´ 10- 9 .

safety of nuclear plant. The accident at Three Mile Islandhas led to an intensi� cation of efforts on the analysis ofevents which could lead to a degraded core.’
Since the Sizewell B Public Inquiry did not form part ofthe formal licensing process, it cannot be said that the PSAwas performed with the Nuclear Installations Inspectorate(NII) in mind. However, it is clear that the NII would wish tohave such a study available, and it has said so39. The NII’sneed is to be provided with an assurance that no accidentwith very severe consequences is likely at a frequency onlyjust below the design basis– that is, that there is no ‘cliffedge’ in the design.
The bene� ts of performing PSA calculations at an early
stage in the design process are clear. Even when themethodology was still evolving, its usefulness had beennoted and implemented by the reactor designers. Thecomments40 of D.C. Richardson (Westinghouse Corpora-tion) who acted as manager for much of the Sizewell Bdegraded core study41 gave a clear indication of that. Inpassing, note that few, if any, of the insights quoted heredepend upon the consequence (that is, risk) assessmentaspects of PSA. This point will be returned to.
The results of the Sizewell B study are given in Proof 16(Degraded Core Analysis– J. H. Gittus42) and in addenda,particularly Addendum 3, which contains revised results.The results used here are taken from the December 1983version of P16 Addendum 3. Table 4 gives the collected
128 HAYNS
Trans IChemE, Vol 77, Part B, May 1999
FR
EQ
UE
NC
Y O
F E
XC
EE
DA
NC
EO
CC
UR
RE
NC
E P
ER
RE
AC
TO
R Y
EA
R
EARLY FATALITIES105104103102
104
10–6
10–8
10–10
10–12
101100
P
0.90
0.50
Internal and external risk
Internal risk only
Figure 10. Internal and external CCDFs compared to internal risk only for the Zion study.Reproduced from Reference 30 by permission of ComEd.
PR
OB
AB
ILIT
Y D
EN
SIT
Y
10–2
FREQUENCY, OCCURRENCES PER REACTOR YEAR
10–810–910–1010–1110–1210–13 10–7 10–6 10–5 10–4 10–3
2RW
8B
8A2
Z-1Q
Z-1
Total core melt
Figure 11. Uncertainties in release category frequency values expressed as probability densities. Indian Point Unit 2.Reproduced from Reference 31 by permission of Consolidated Edison Co.

129PROBABILISTIC RISK ASSESSMENT IN THE NUCLEAR INDUSTRY
Trans IChemE, Vol 77, Part B, May 1999
Tab
le4.
Freq
uenc
ies
ofri
skim
port
ants
eque
nces
from
the
Siz
ewel
lBPS
A.N
ote
that
the
rank
ing
with
rega
rdto
freq
uenc
yof
sign
i�ca
ntre
leas
eis
nota
tall
corr
elat
edw
ith
the
cont
ribu
tions
ofth
ese
quen
ces
toco
rem
elt
freq
uenc
y.R
epro
duce
dfr
omR
efer
ence
41by
perm
issi
onof
Wes
ting
hous
e.
Rac
kw
ithre
spec
tto
degr
aded
core
freq
uenc
yS
eque
nces
Freq
uenc
yof
degr
aded
core
,per
reac
tor
year
ofop
erat
ion
Per
cent
ages
ofto
tal
degr
aded
core
freq
uenc
y
Con
diti
onal
prob
abil
ityof
cont
ainm
ent
fail
ure
orby
pass
Fre
quen
cyof
sign
i�ca
ntre
leas
e,pe
rre
acto
rye
arof
oper
atio
n
Rel
ativ
era
nkw
ithre
spec
tto
freq
uenc
yof
sign
i�ca
ntre
leas
e
1Sm
all
LO
CA
coex
iste
ntw
ith
loss
ofco
mpo
nent
cool
ing
2.85
´10
-7
23.0
2.65
´10
-2
7.55
´10
-9
3
2A
TW
Tco
exis
tent
with
turb
ine
trip
failu
re1.
35´
10-
710
.92.
65´
10-
23.
58´
10-
94
3L
arge
LO
CA
coex
iste
ntw
ith
loss
ofco
mpo
nent
cool
ing
1.03
´10
-7
8.3
1.21
´10
-2
1.25
´10
-9
8
4M
ediu
mL
OC
Aco
exis
tent
with
loss
ofco
mpo
nent
cool
ing
1.03
´10
-7
8.3
1.21
´10
-2
1.25
´10
-9
8
5L
OC
Abe
yond
the
capa
city
ofth
eE
CC
51.
00´
10-
78.
11.
21´
10-
21.
21´
10-
910
6S
mal
lL
OC
Aco
exis
tent
with
failu
reof
high
head
inje
ctio
n9.
42´
10-
67.
62.
65´
10-
22.
50´
10-
96
7M
ediu
mL
OC
Aco
exis
tent
with
failu
reof
high
head
inje
ctio
n9.
38´
10-
87.
61.
21´
10-
21.
13´
10-
911
8S
mal
lL
OC
Aco
exis
tent
with
failu
reof
reci
rcul
atio
n5.
56´
10-
84.
53.
8´
10-
32.
11´
10-
10
9L
arge
LO
CA
coex
iste
ntw
ithfa
ilure
ofre
circ
ulat
ion
5.53
´10
-8
4.5
1.28
´10
-2
7.08
´10
-10
10M
ediu
mL
OC
Aco
exis
tent
with
failu
reof
reci
rcul
atio
n5.
53´
10-
84.
51.
28´
10-
27.
06´
10-
10
11L
oss
ofst
eam
outs
ide
cont
ainm
ent
coex
iste
ntw
ithm
ain
stea
mis
olat
ion
fail
ure:
exce
ssiv
eco
oldo
wn
and
rupt
ure
ofve
ssel
3.23
´10
-8
2.6
1.21
´10
-2
3.91
´10
-10
12In
terf
acin
gsy
stem
sL
OC
A2.
69´
10-
92.
21.
002.
69´
10-
91
13L
arge
LO
CA
coex
iste
ntw
ithfa
ilure
oflo
wpr
essu
rein
ject
ion
1.31
´10
-9
1.1
1.21
´10
-2
1.59
´10
-10
14L
oss
ofst
eam
insi
deco
ntai
nmen
tco
exis
tent
with
mai
nst
eam
isol
atio
nfa
ilur
e:ex
cess
ive
cool
dow
nof
vess
elan
dru
ptur
e
1.31
´10
-8
1.1
1.21
´10
-2
1.59
´10
-10
15L
oss
offe
edw
ater
�ow
coex
iste
ntw
ithlo
ssof
com
pone
ntco
olin
gan
dau
xili
ary
feed
wat
er
1.05
´10
-8
0.8
2.65
´10
-2
2.78
´10
-10
16L
eaka
geto
seco
ndar
yco
olan
tco
exis
tent
with
failu
reof
oper
ator
tode
pres
suri
zepr
imar
yci
rcui
t
1.03
´10
-9
0.8
1.00
1.03
´10
-9
2
–L
oss
ofof
f-si
tepo
wer
coex
iste
ntw
ith
part
ial
loss
ofem
erge
ncy
pow
eran
dlo
ssof
com
pone
ntco
olin
g
3.69
´10
-9
0.3
8.55
´10
-1
3.15
´10
-9
5
–Sm
all
LO
CA
coex
iste
ntw
ith
loss
ofof
f-si
tean
dem
erge
ncy
pow
er2.
86´
10-
90.
28.
55´
10-
12.
45´
10-
97
–L
eaka
geto
seco
ndar
yco
olan
tinv
olvi
ngm
ulti
ple
tube
rupt
ure
coex
iste
ntw
ith
fail
ure
ofop
erat
orto
desp
ress
uriz
epr
imar
yci
rcui
t
2.50
´10
-9
0.2
1.0
2.50
´10
-9
6
96.6
Not
e1:
Sign
i�ca
ntis
used
inth
ista
ble
toin
dica
tea
rele
ase
from
afa
iled
orby
pass
edco
ntai
nmen
t.

frequencies for the risk important accident sequences. Asnoted in the comments on the Zion and Indian Point Studies,the sequences which rank highest with respect to core melt(here taken as synonymous with degraded core) frequencydo not necessarily rank highest with respect to risk. This isshown very clearly here where the dominant contributor tocore melt frequency is the small Loss of Coolant Accident(LOCA), with ~ 23% of the total core melt frequency,whilst the dominant contributor to risk is the interfacingsystems LOCA. The latter only ranks 12 with respect to coremelt frequency. The reasons are that the V sequence(interfacing LOCA) by de� nition involves containmentbypass whereas for the small LOCA induced core melt tohave the same effect an almost simultaneous above-groundfailure of the containment is needed. It was calculated thatonly 1 in 40 core melt events would result in the failure orbypass of containment. This re-emphasizes the nowperceived importance of containment survivability whichwas � rst highlighted in the RSS.
From the point of view of public risk, preventing largeairborne releases offers the obvious way of mitigating theconsequences of core melt accidents. Thus procedureshighlighting accident management, or the provision ofspecially engineered safeguards designed speci� cally forsevere accidents, have been subject to intensive studies inthe decade following these initial PSAs. However, all thingsare relative and a balance is required between defenceagainst extremely rare events and action for much more
likely events, but having lower consequences. Thus, the� nancial risk to a utility from, for example, the Three MileIsland accidents, may dominate over rarer events. PSA is atool which can help in providing a means of examining thepriorities to be placed in assessing the overall risk from theplant.
Figure 12 shows the overall CCDFs for the Sizewell Banalysis, with the individual release category contributionsalso shown. The dominance of UK1 (the V sequence) isclearly seen and re� ects the ordering shown in Table 4.
Since this time (the late 1980s), virtually all ‘new’designs have had PSAs performed on them, at least to level1, and other established designs have had PSAs ‘back � tted’to them. These include ‘advanced’ designs such as theWestinghouse AP600, ABB Combustion Engineering’sSystem 80+, GE’s ABWR and the EPR43, to name but afew. Also, some more exotic designs such as the Swedish‘PIUS’44, the Safe Integral Reactor SIRTM45 and the ‘Mars’design46 have had PSAs performed to establish the focalpoints in systems reliance on, for example, passivefeatures47. I comment on these developments in Section 7.There have also been many analyses of existing plant that Iam not able to discuss in detail here. These includeimportant studies from the European point of view such asthe ‘German Risk Study’48 and the PSA on the ‘StandardFrench 900 MW(e) PWR,49. These too have contributed tothe general development of the methods and in theunderstanding of their applicability.
130 HAYNS
Trans IChemE, Vol 77, Part B, May 1999
1
3
4
5
3 2
FR
EQ
UE
NC
Y W
ITH
WH
ICH
TH
E N
UM
BE
R O
F E
AR
LY D
EA
TH
S I
S E
XC
EE
DE
D, Y
–1
NUMBER OF EARLY DEATHS
105104103102101
Total
410–13
10–12
10–11
10–10
10–9
10–8
10–7
2
6
5
1
7
Figure 12. The Sizewell B PSA. The calculated CCDFs for early fatalities. The individual curves are for the accident sequences identi� ed in Table 5 andfollows the ranking order– that is, 1 = V sequence etc.Reproduced from Reference 42 Crown copyright is reproduced with the permission of the Controller of Her Majesty’s Stationery Of� ce.

3. MAJOR INSIGHTS GAINED FROM THESTUDIES
From the 20 or so PSAs completed by the mid-1980s it ispossible to draw a set of wide-ranging conclusionsregarding the insights which may be claimed to have beenestablished by them. The main insights from the principalstudies are summarized in Table 5, which is adapted fromReferences 22 and 41. Each individual study provided botha contribution to the overall insights, and detailed insightsapplicable to the speci� c design. It would not be realisticto ry to identify very design-speci� c items, even if suchinformation were generally available. Utilities, especially inthe USA, tend to be guarded about releasing speci� cinformation on their plant because of possible litigation. Inthe next section I consider application to generic plantcomponents and these give a reasonable overview of thekind of detailed, plant-speci� c results which can beobtained.
3.1 Global Insights
In addition to plant-speci� c and generic insights, thePSAs performed to date have yielded certain global insightsthat it is believed apply not only to the plants analysed but toall or most current nuclear power plants, based on ourknowledge of their general design and operating character-iztics. These, in some instances, apply to quite disparatereactor types (for example, Liquid Metal cooled FastBreeder (LMFBRs) or High Temperature Reactors(HTRs)) but remember that the PSA applications in thisreview have been dominated by LWR studies and this willnecessarily bias the trends.
The process of performing PSA studies yields extremelyvaluable engineering and safety insights. Conceptualinsights are the most important bene� ts of PSAs, and themost general of these is the entirely new way of thinkingabout reactor safety in a logic structure that transcendsnormal design practices and regulatory processes. PSAmethods introduce much-needed realism into safety evalua-tions in contrast with more traditional licensing analysesthat generally use a conservative, qualitative approach thatcan mask important safety issues.
The estimated frequency of core melt is generally higherthan had been thought before the RSS. However, unlike theRSS, most core melts are not expected to result in large off-site consequences. The small fraction of accidents thatmight lead to large off-site consequences generally involveeither an early failure of the containment in relation to thetime of core melt, or a containment bypass. For othercontainment response modes, the retention properties ofthe containment are substantial. Lack of a signi� cantcontainment function is now considered to be one of themost damning criticisms of early versions of the Russiandesigned RBMK and VVER 440 230 reactors.
The range of core-damage-frequency point estimates inthe library of PSAs used here (Table 5) covers about twoorders of magnitude (<10–5 to 10–3 per year). Anexamination of variability in the results indicates thatquantitatively pinpointing reasons for the differences isextremely dif� cult. It is possible, however, to uncovergeneral reasons for the variability that are attributable toplant design, operation, site characteriztics, scope of the
studies, PSA methods employed and analytical assumptionspostulated. Caution must be exercised in comparing thequantitative results of various PSAs, if they were producedby different teams, using different databases and perhapseven methods. In general, internal comparisons offer themost bene� cial use of PSA results for practical applications.
The speci� cs of dominant accident sequences and theestimates of risk vary signi� cantly from plant to plant, eventhough each plant meets all applicable regulatory require-ments of the host country.
The following global insights about off-site consequenceshave been identi� ed:
· Estimated risks of early fatalities and injuries are verysensitive to source-term magnitudes, the timing of releasesand assumptions about the effectiveness of emergencyplans.· Estimates of early health effects differ greatly from onesite to another, but site-to-site differences are substantiallyless for latent cancers.· Airborne pathways are much more important than liquidpathways.
Accidents beyond the design basis (including externallyinitiated events) are the principal contributors to public risk.This indicates that the designers, operators and regulatorshave been generally effective in reducing the risks fromexpected operationaloccurrences and designbasis accidents.
PSA studies have provided a diverse assessment of theways in which various elements of reactor safety contributeto risk when compared to traditional safety analysis. Amongthe principal insights are the following:
· Human interactions are extremely important contributorsto safety and reliability of the plants. This includes all typesof interactions that humans can have, either with a system orwith other humans, that can impact the frequency orconsequences of an accident sequence.· Test and maintenance considerations are importantcontributions to safety and reliability of the plants.· Dependent and common cause failures are importantcontributors to plant risk.
The failure of long-term decay heat removal is a majorfunctional contributor to core-melt frequency.
Small LOCAs and transients are dominant contributors tocore-melt frequency in most PSAs, while large LOCAs areusually not. This, of course, is a very much PWR-orientedconclusion.
Earthquakes, internal � res and � oods seem to play animportant role in plant risk, although this tentativeconclusion appears to be highly plant and site speci� c.
Whilst much attention has been placed on dominantaccident sequences and ways to reduce risk even further,one of the most important insights gained from PSAs is theneed to identify and maintain the reliability of risk-important systems and components at or near the levelsnow present. Degradation of such systems or componentscan sharply increase risk or the likelihood of core melt. Thequestion of ageing plant is one receiving much attention atpresent. The implications for PSA, and indeed the prioritiesfor operators and regulators, are discussed in more detail inSections 6 and 7.
The results of a number of studies, including those usedfor illustration in Section 2, indicate important distinctions
131PROBABILISTIC RISK ASSESSMENT IN THE NUCLEAR INDUSTRY
Trans IChemE, Vol 77, Part B, May 1999

132 HAYNS
Trans IChemE, Vol 77, Part B, May 1999
Table 5. Compendium of results from PSAs performed up to ~ 1985. Reproduced from References 22 and 41 by permission of the USNRC andWestinghouse.
Individual riskwithin 1 mile
PRA NSSS/AEDate/power
(Mwe)F coremelt1,2
F majorrelease1,3
Earlyfatality1,4
Cancerfatality1,5 Comments
Arkansas Nuclear One-1 IREP B&W/Bechtel 1981 836 5 ´ 10- 5 2 ´ 10- 5 6 ´ 10- 7 2 ´ 10- 7 All-PWR 28
Biblis B German RSS FRG(W) 1978 1300 4 ´ 10- 5 1 ´ 10- 6 3 ´ 10- 8 2 ´ 10- 8 Containment stronger andlarger than U.S.
Big Rock Point6 Wood-Leaver/SA1 GE/Bechtel 1981 71 1 ´ 10- 3 0 0 – Low power level, remotesiting.9
Browns Ferry IREP GE/TVA(BWR/4,Mark I)
1981 1067 2 ´ 10- 4 4 ´ 10- 5 2 ´ 10- 7 1 ´ 10- 6 ATWS and interdepen-dency in redundant RHRtrains dominate coremelt10
Calvert Cliffs RSSMAP CE/Bechtel 1982 850 2 ´ 10- 3 1 ´ 10- 4 9 ´ 10- 6 2 ´ 10- 5 More comprehensiveIREP study in progress.AFWS redesign willlower risk and core meltfrequency11
Crystal River IREP B&W/Gilbert 1980 825 4 ´ 10- 4 2 ´ 10- 4 3 ´ 10- 6 2 ´ 10- 6 P core melt reduced byfactor of 3 by procedurechanges12
Grand Gulf RSSMAP GE/Bechtel(BWR/6,Mark III)
1981 1250 4 ´ 10- 5 4 ´ 10- 5 1 ´ 10- 7 1 ´ 10- 7 Containment always failsdirectly to atmosphere,does not assume staffsanalysis of ATWS risk
Indian Point-26 PLG W/UE&C 1982 873 4 ´ 10- 4 3 ´ 10- 4 3 ´ 10- 8 1 ´ 10- 8 Includes externalevents7,13
Indian Point 36 PLG W/UE&C 1982 965 9 ´ 10- 5 3 ´ 10- 5 1 ´ 10- 9 3 ´ 10- 10 Includes external events7
Limerick6 SAI GE/Bechtel(BWR/4,Mark II)
1981 1055 2 ´ 10- 5 3 ´ 10- 6 1 ´ 10- 8 1 ´ 10- 8 Mean value, assumesATWS � x
Millstone-1 IREP GE/Ebasco 1982 652 3 ´ 10- 4 1 ´ 10- 4 1 ´ 10- 7 6 ´ 10- 7 Major release is in releasecategory 3
Oconee RSSMAP B&W/Bechtel 1980 860 8 ´ 10- 5 4 ´ 10- 5 2 ´ 10- 7 1 ´ 10- 7 1/4-PWR 2; 3/4-PWR 3Peach Bottom Wash-1400 GE/Bechtel
(BWR/4,Mark I)
1975 1065 3 ´ 10- 5 7 ´ 10- 6 4 ´ 10- 8 3 ´ 10- 8 Staff’s analysis of ATWSwould likely result in riskexceeding safety goal
Sequoyah RSSMAP W-1C/TVA 1978 1148 6 ´ 10- 5 4 ´ 10- 5 1 ´ 10- 6 5 ´ 10- 7 Hydrogen control reducesrisk by 2 to 3
Surry Wash-1400 W/S&W 1975 775 6 ´ 10- 5 1 ´ 10- 5 2 ´ 10- 7 1 ´ 10- 7 2/3-PWR 2; 1/3-PWR 3Zion6 PLG W/S&L 1981 1100 4 ´ 10- 5 4 ´ 10- 6 2 ´ 10- 8 1 ´ 10- 8 Includes external eventsSizewell-B W+UK W 1982 1340 1 ´ 10- 6 2 ´ 10- 8 2 ´ 10- 10 6 ´ 10- 11 Excludes external events.
There are large uncertainties associated with the values presented in this table. Also, PRAs were not performed using consistent methodology andassumptions.1 All numbers are median values or point estimates from internal initiators unless otherwise speci� ed.2 Frequency of core melt 1 ´ 10- 4 is the safety goal value for accident probability comparison.3 Frequency of release with potential for early fatalities assuming nominal evacuation and warning times (RSS).4 5 ´ 10- 7 is the safety goal for early fatality risk comparison. Same assumptions as 3 above unless speci� ed.5 2 ´ 10- 6 is the safety goal for cancer fatality risk comparison. Same assumptions as 3 above unless speci� ed.6 Utility-performed PRAs. All values are rough estimates based upon initial interpretation of results.7 Optimistic emergency response assumptions (1-hour delay with at least 8-hour warning) for dominant sequence when determining individual risk.8Predicted risk is dominated by small locas and transients. Source term reduction expected to reduce predicted risk to within guidelines. Likelihood of majorrelease could be reduced by adding parallel valves at the discharge of the boarated water storage tank or by improving DC power redundancy.9 Low power level (71 Mwe) results in low individual risk. Extensive design modi� cations necessary to reduce core melt frequency.10 Reduction of core melt frequency would require redesign of the residual heat removal system to eliminate commonalities between trains which reduce thesigni� cance of multiple redundancy.11 AFWS redesign is expected to signi� cantly reduce core melt frequency and individual risk. IREP study including improved AFWS design will beavailable in spring 1983. Modi� cations to DW power system and engineered safety system actuation system may be required to lower core melt frequencywithin guidelines. Predicted risk is dominated by transient event and should be signi� cantly reduced by new source term data.12 Core melt frequency could be reduced to less than guidelines levels by improving written procedures and improving the reliability of the steam supply tothe EFWS turbine-driven pump. Predicted risk is dominated by small loca events. New source term information is expected to result in a moderate reductionin predicted risk.13 Core melt frequency is dominated by seismic considerations.14 Core melt frequency could be reduced to below guideline levels by redesigning the emergency AC power system to reduce dependency on the gas turbineand improving procedures for responding to transients. Predicted risk is dominated by transient events. New source term information should result in asigni� cant reduction.

between contributors to different types of outcomes ofpotential accidents. The risk cannot be measured in terms ofany single indicator, and changes in plant con� guration thatsigni� cantly affect one indicator may or may not affect theothers. For example, a modi� cation that reduces thefrequency of core melt may not signi� cantly affect publicrisk, and vice versa. Hence, a risk management strategy thatfocuses on core-melt frequency is not likely to result in thesame set of actions as a strategy that focuses on public risk.
4. THE STATE OF THE ART IN PSA METHODS
It is important to recognize that the level of developmentand understanding varies among the different parts of thePSA. Thus, the reliance placed on PSA insights discussed inthe previous section should depend upon the strength ofthose areas of PSA used to obtain them. The different areashave each reached a different level of development, or stateof the art. This section summarizes the state of the art for allthe areas that make up a complete PSA; a more extensivediscussion is given in the references.
4.1 Level of Development
A PSA study is multidisciplinary. Depending on itsscope, a PSA may require analyses of plant systems, humanbehaviour, the progression of core-melt accidents, radio-nuclide behaviour, health effects and seismic hazards.However, not all areas of analysis involved have reachedthe same level of development.For example, the methods ofreliability analysis have been used in some form sinceWorld War II, whereas the methods used for analysingcore-melt progression are new21 and unique to reactortechnology.
The use of PSA in the regulatory process should considerwhat parts of the PSA exhibit the greatest strengths and whatparts may be weaker (I return to this point in Section 6). Aparticular area of analysis can be characterized by its degreeof validity or realism, stability and need for improvement.
The fact that improvement is needed in an area raises therelated question of the feasibility of achieving signi� cantprogress in that area in the next few years. I touch onanticipated future development in Section 7.
The degree of validity or realism of a method refers to theextent that approximations or conservatisms may have beenknowingly or unknowingly introduced. This may have beendone because of insuf� cient knowledge or because of theneed to simplify the model. Validity is a measure of howclosely the model represents actual reality. In some cases,there is so little experience with the phenomena of interestthat it is dif� cult to reach a de� nite conclusion on thevalidity of a model. The uncertainty associated with a resultmay re� ect inherent variation in the data base, questionsabout the validity of the model, or both.
Stability is a measure of the rate of change of the analysismethods in an area. If no signi� cant changes in the methodshave appeared recently, and if the methods in use aregenerally accepted by most of the experts in the area, theanalysis area may be termed stable. This implies a certaindegree of reproducibility. That is, for a stable area, differentanalysts working separately on a given problem willproduce comparable results by similar or equivalent
methods. Note that stability does not necessarily implyvalidity. A method may be recognized as using quiteimperfect models in certain areas, yet because of thecomplexity of the problem there has been little progress, sothe method has remained stable. The recognized need forimprovement in an area is an indication that there is nooverall satisfaction with the methods and this depends onour perception of the state of technology in that area. Theseperceptions are subject to change. For example, severalyears after the RSS there was little dissatisfaction with, orinterest in, the area of radionuclide release, transport, anddeposition after severe core damage or melting. As a resultof measurements made at Three Mile Island after theaccident and ongoing research, it was recognized that someof the conservative assumptions might not be appropriateand the need for improvement in this area changedaccordingly51. Section 5 looks at how a comprehensiveresearch programme has evolved to improve PSA methods.Each of the key sub-topics of PSA are now discussed in alittle more detail.
4.2 Plant Analysis
System modelling in PSA studies is usually considered tohave reached a high level of development. The degree ofvalidity is fairly high, and recent improvements have mostlybeen in the areas of further automation and increased abilityto treat large and complex systems. The areas needing themost improvement are human interactions and dependentfailures. The data base is also weak in certain places. Thetechniques of fault and event trees have advancedconsiderably since their initial application to a full nuclearplant in the RSS and a variety of approaches to their use isavailable. Many sophisticated software packages are nowavailable to perform this level of analysis. The insightsdrawn from system modelling are generally quite solid,even though issues about the completeness of the analysispersist.
The treatment of the underlying assumptions in systemanalysis (for example, success criteria, time dependencies,thermal hydraulics phenomena) is still open to debate. Thetransient initiator data base has improved substantially butimprovements are still desirable in the failure rate data base,since the ranges (and error factors) are quite broad for someimportant areas. Progress has been made recently in thecollection and analysis of component data, but more isneeded. Few analyses of LOCA initiators are available andcausal data are sparse. Thus, the overall understanding ofthe root causes of failure has not improved substantially.This also affects the ability to model dependent or commoncause failures and quantitative efforts in this area remainlargely unsuccessful. The improvements in data have notchanged the insights gained from analyses very much. It isalso believed that the conservatisms and the simpli� cationin the modelling do not have a strong in� uence on theseinsights.
The modelling of human interactions introduces sub-stantial uncertainty. This is particularly true of operatorerrors of commission and errors originating in misdiagnosisof accident conditions. However, even in the area of errorscaused by failure to follow existing procedures, theuncertainties are of the same order of magnitude as those
133PROBABILISTIC RISK ASSESSMENT IN THE NUCLEAR INDUSTRY
Trans IChemE, Vol 77, Part B, May 1999

associated with component failure data. Progress has beenmade recently in this dif� cult area and much more work isnow under way52. This aspect of system modelling isbecoming more systematic and the results more reproduci-ble. Recent reviews are available28,29.
In summary, the whole area of PSA system modelling hasadvanced a good deal since the RSS, particularly in the areaof initiating event-mitigating system interactions. Theconclusions and insights it affords are usually reasonablysound if appropriate consideration is given to the uncertain-ties and if great numerical accuracy is not required for theparticular application. Most important, system modellinghas provided insights about the relationships amongsystems, failures and phenomena that could not have beenobtained in any other way.
There continues to be rather large uncertainties in thenumerical results of PSAs (core-melt frequency, off-siterisk) for a variety of reasons. One key reason is that for someaccident sequence initiators, the likelihood of the initiator isso low that such events have rarely, if ever, happened. Insuch cases (examples of which include very large pipebreaks, and especially Reactor Pressure Vessel failure, largeearthquakes, and failures of the reactor protection systemfunction), the PSA analysis must rely on synthesizedestimates that are dif� cult to perform and uncertain becauseof the lack of data associated with them. For other initiators(including the more common transients, the smaller earth-quake and minor � res) there is a valid data base that can berelied on in the analysis, and the uncertainties are smaller. Itturns out that the numerical results of PSA are more reliablewhen the accident sequence quanti� cation relies oncombining several reasonably well-known rates and failurelikelihood. On the other hand, the results are somewhat lessreliable when the key numerical inputs are synthesized fromvarious analyses and extrapolations rather than taken fromdirect observed experience.
4.3 Containment Analysis and Accident SequenceDevelopment
This area includes analyses of the thermal hydraulicresponse of the plant to an accident, the progression ofsevere accidents and containment performance under severeaccident loadings for accident sequences or groups ofsequences. The analyses include a wide range of phenom-ena, some of which are not well understood.
In general, the validity of the analyses in these areas is notas good as in the plant system analysis. This is due largely tothe lack of experimental results against which to comparethe models. Some of the areas, especially radionuclidebehaviour in post-melt environments, are suf� cientlycomplex that it would be very dif� cult to constructmodels based on � rst principles even if results from realisticcore-melt experiments were available. Whilst the entire arearemains in a state of � ux resulting from the widelyperceived need for improvements and the results of currentresearch, there are some trends developing towardsexploitation and implementation of work already completedand these are reported further in Section 5.
Different models are required to model different phases inthe progression of an accident: core degradation and meltingwithin the vessel, steam and water circulation before vessel
failure, the dispersal of the molten portion of the core uponvessel failure, core concrete interactions and the coolabilityof the debris bed on the containment � oor. Structuralanalysis is needed to determine the response of thecontainment to thermal and pressure stresses. Hydrogengeneration and mixing in the containment are of specialconcern. It is also necessary to estimate the amount ofenergy that can be released in steam explosions after the fallof the molten core into water in the bottom of the vessel or inthe reactor cavity. Furthermore, specialized and detailedunderstanding of quite different aspects of phenomena maybe required in applying PSA to different types of reactors.For example, such items as recriticality, Q* (the energyreleased in a whole core accident) and sodium burningwould need to be included for studies on LMFBRs, whilstother reactor types will have different special needs.Further, extending the coverage to nuclear chemical plantand criticality and to non-nuclear hazardous plant of allkinds needs specialist input at this point of the analysis tomodel particular accident sequence development. (See thepapers accompanying this one for coverage of non-nuclearplant). It is not possible to generalize these brief remarks tocover the state of development of phenomena for all reactortypes, nuclear plant or non-nuclear chemical plant. Specia-list advice and input is needed.
4.4 Fission Product Transport
The characteriztics of radionuclide releases to theenvironment are described in terms of various timing andlocation parameters, the thermal energy release rate, and thequantities of radionuclides released, and also the quantitiesof radionuclides of the various elements available forrelease from the fuel and transported through the reactorcoolant system, the containment, and possibly buildingsexternal to the containment*before reaching the environment.
Analyses have shown that both natural and engineeredretention mechanisms can signi� cantly reduce the inventoryof radionuclides available for release if enough time isavailable for those mechanisms to act. Therefore, sourceterms are strongly affected by whether or not the contain-ment fails and, if it fails, by the time and the mode of failure.
Advances have also been made in the PSA analysiscapabilities, including improved codes and methods fordeveloping and quantifying containment event trees.
Shortly after the Three Mile Island accident, questionswere raised about the appropriateness of the methods usedto analyse source terms in the RSS and subsequent PSAs. Inthe face of complex problems and large gaps in the existingbody of knowledge, the RSS chose to make conservativeassumptions for source term predictions in some areas– forsome of the radionuclides in certain accident sequences, theRSS methods estimate higher release fractions than we nowbelieve would be observed in an actual accident. Theseover-predictions may be signi� cant in many cases since theconservative assumption must be to assume 100% release.As a result of suspected de� ciencies, a number of researchprogrammes have been undertaken to improve the ability to
134 HAYNS
Trans IChemE, Vol 77, Part B, May 1999
* The meaning here is to cover other transport pathways which might go viathe service buildings or, in the case of Sizewell B, the tertiary containment.

model radionuclide release and transport in severe accidentsrealistically, and these are outlined in the next section.
Many uncertainties are associated with the predictions ofsevere accident progression, containment response andradionuclide transport. Few sensitivity studies were per-formed and the validation of models for the broad range ofsevere accident phenomena is extremely limited andquantitative uncertainty estimates are not generally avail-able. As a minimum, current research can be expected toprovide a better characterization of source term uncertain-ties and in some important areas reduce the conservatisms inPSA analysis.
4.5 Health, Environmental and EconomicalConsequence Analysis
The health and economic consequence analysis portion ofa PSA provides estimates of the frequency distribution ofpossible off-site consequences for core-melt accidents.Models have been developed which describe the transport,dispersion and disposition of radioactive materials andpredict their resulting interactions with the environment andthe effect on the human population. Consequences caninclude early fatalities and injuries, latent cancer fatalities,genetic effects, land contamination and economic costs.
The validity in the area is relatively high, and the analysismethods have been quite stable for some years. One areawhere detailed improvements or specialist applicationshavebeen made is in the enhancement of models for themitigation of radiation exposure (for example, evacuationand sheltering).
The � rst comprehensive assessment of consequences wasperformed in the RSS. Since that study, modellingcapabilities have been improved, model and parameterevaluation studies have been performed and existing modelshave been applied to provide guidance in such areas asemergency planning and reactor siting. In addition, theimportance of potential consequences resulting fromreleases of radioactive materials to liquid pathways hasbeen examined.
Uncertainties in off-site consequence predictions havenot yet been assessed comprehensively, although theirmagnitude can be inferred from the large body of existingparametric (or sensitivity) analysis in which consequencesare calculated for a range of plausible values of a keyparameter or model. The PSA ‘Procedure Guide’50 made atentative listing of the relative contribution to totaluncertainty of the major parameters and models in an off-site consequence analysis. Important contributors to uncer-tainty were the magnitude of the source term, the form andeffectiveness of emergency response, the rate of drydeposition (fallout during rainless periods) of particulatematter from the plume, the modelling of wet deposition(washout by rainfall) and the dose response relationships forsomatic and genetic effects.
Ongoing research is focused on quantifying and, wherepossible, reducing uncertainties. Although uncertainties arelikely to remain quite large, a thorough examination of theirorigin and magnitude will provide both a � rmer basis forthe application of consequence analyses and a betterunderstanding of their limitations. A current major study(COSYMA) is being undertaken under the EU’s fourth
Framework programme (in collaboration with the USA) toperform a comprehensive examination of uncertainties inconsequence calculations. This is expected to make asigni� cant contribution to this area.
4.6 External Events
External initiators are discussed separately, principallybecause the method for treating them is, in some respects,different from the method for treating so-called internalinitiators. The external initiators differ from the internalinitiators in that they are likely to cause importantconcurrent events that complicate the response of theplant to the initiator and may degrade off-site mitigationefforts. For example, a severe external � ood is almostcertain to affect the possible evacuation of the nearbypopulation and an earthquake severe enough to damage theplant is also likely to cause a loss of off-site power and todisrupt evacuation plans seriously. External events include:
1. Earthquakes2. Internally initiated � res3. Floods (both external and internal)4. High winds (tornadoes and hurricanes)5. Aircraft, barge and ship collisions6. Truck, train and pipeline accidents7. External � res8. Volcanoes9. Turbine missiles
10. Lightning
For a speci� c site, it is necessary to identify which ofthese (and other hazards) must be considered. Not all applyto all sites!
The basic approach consists of quantifying the expectedfrequencies of the various initiating events, determiningtheir effects on various pieces of equipment and determiningthe resulting effect of any degradation or failures on plantperformance.
The validity of the analyses for many external initiatorsremains questionable because of the lack of appropriateexperience against which to judge models or because theproblems are inherently complex and dif� cult to treat. Themethods of analysis for most of the external initiators arenow reasonably mature; nevertheless the need for furtherimprovement in the current treatment of most of theimportant initiators is recognized. These are discussedbelow.
The analysis of external initiators has seen majoradvances in the decade under consideration. However, theuncertainties associated with such analyses are stillsigni� cantly larger than those associated with most internalinitiating events, principally because of uncertaintiesassociated with the development of the hazards curves(that is, the frequency of occurrence of an event exceeding agiven magnitude). Nuclear power plants are carefullydesigned and engineered to be resistant to external initiatorsat the levels expected to occur. Taking normal design safetymargins into account, the external initiators that are found topose a signi� cant threat to the plant are extremely severeand thus exceedingly rare. As might be expected, predictingthe frequency of these unusual occurrences is very dif� cultand the resulting expected frequencies have very large
135PROBABILISTIC RISK ASSESSMENT IN THE NUCLEAR INDUSTRY
Trans IChemE, Vol 77, Part B, May 1999

uncertainties and the plant response tends to be of the ‘cliffedge’ variety leading to chaotic situations with multiplecomponent and systems failures, as well as potentialdegradation of the key barriers to release of radioactivity.
For seismic events, a consensus prevails that theuncertainties in the core-melt frequency remain quite largefor seismic PSA analyses. For these results, error factors of10 to 30 (implying ranges of about 100 to 1000 for the 5 to95% con� dence interval) might be reasonable at present. Amajor contributor to this uncertainty is the likelihood of thevery large earthquakes that dominate the analysis. Theselarge numerical ranges for quantitative results do not negatethe signi� cant engineering insights obtained. Many of theseinsights are new and could not be acquired with traditionalmethods. In particular, the system vulnerabilities andcommon cause dependencies revealed have indicatedareas where further investigation is warranted and whereregulatory consideration may be required.
It is still too early to judge the achievable accuracy of the� re analysis methods. The uncertainties are probably largerthan those for internal initiators, but the engineering insightsobtained from the � re analyses performed to date havealready been very useful and are in no way invalidated bythe large uncertainties in the quantitative results. Methodsdeveloped for PSA are now � nding application within thedesign basis in demonstrating the safety case for modernplant. PSA � re analyses have found major uses in analysis ofFormer Soviet Union (FSU) designed plant. In the yearsfollowing Chernobyl and the generation of signi� cantWestern assistance, the identi� cation of � re hazards andtheir recti� cation has been one of the most signi� cantdevelopments of these methods53.
While engineering insights are available concerningvulnerabilities from high winds, the estimates of core-meltfrequency or risk from them are highly uncertain due to thedif� culties in determining the frequency with which windspeeds high enough to signi� cantly damage a reactor maybe expected.
Flooding analysis is complicated by several factors. Thefragility of safety equipment (especially electrical equip-ment) exposed to the spray from an internal pipe or tankbreak is very dif� cult to analyse quantitatively. Flood-induced corrosion can compromise the ability of safetyequipment to remain operable during the recovery periodafter a particular � ood has been nominally ‘controlled’.Another � aw in the analysis is the limited ability to quantifypartial blockages of drains or sumps that are relied on tocarry away � ood waters. Finally, � ooding (especially froman external source) can randomly deposit solid matter likesludge, silt or even sizeable objects in or on reactor plantequipment. These effects are dif� cult to analyse. The database and analytical methods for coping with these issues arenot well developed. Dif� culties in modelling humanintervention can also complicate the analysis.
External initiators such as aircraft impacts, pipelineaccidents, external � res, volcanoes and turbine missiles aretypically analysed probabilistically by performing a bound-ing analysis on their frequency of occurrence. An estimate isthen made of whether the initiating event is serious enoughto merit ‘concern’. The main insight gained from theanalyses performed on these ‘other’ initiators (numbers 5through 10 in the list above) are that, generally, they haveminor risk signi� cance in the United States. However, for
European situations, aircraft impact is seen as being ofparticular importance due to the large number of aircraftmovements, particularly of military craft, in Europeanairspace. In Germany this has led to special designprovisions (the ‘bunker’ containment design). This indicateshow PSA can be used as an important guide to anunderstanding of which issues must be taken seriously andwhich can legitimately be discounted at an early stage inthe siting of hazardous plant. It also raises the issue ofthe relevance of the historical data bases since, postre-uni� cation and the end of the Cold War, the type ofmilitary � ights (mainly in the 1950s and 1960s of USAFStar� ghters) which contributed to the statistical data base ofaircraft crash rates in Germany have ceased.
4.7 Uncertainty Analysis
The preceding sections have discussed the sources ofuncertainty in PSA results (parameter variation, modelling,completeness). Uncertainty analysis provides a frameworkfor properly combining and describing the uncertaintiesassociated with various elements of the analysis todetermine the overall uncertainties associated with theresults (for example, risk) or intermediate quantities (forexample, sequence frequency). This is shown as ‘linking’ allthe components of the PSA in Figure 13.
Risk analysts are only at the threshold of performingcomprehensive uncertainty analyses. A variety of techni-ques have been used or proposed; however, many are stillbeing developed and, in general, the methods have not beenapplied in all their combinations for all parts of the PSA.The uncertainties which are generally quanti� ed in PSAs arethose which are due to parameter or data uncertainties.Uncertainties which are due to alternative models oralternative assumptions need to be considered separatelyby sensitivity analyses. In speci� c cases, the effects ofdifferent modelling assumptions can be as large, or largerthan, the uncertainties stemming from the data or parameterestimation.
Because of the different probability distributions whichare used in PSAs to quantify parameter uncertainties, thepropagated output probability distributions describinguncertainties in the results are themselves uncertain. Statedcon� dence or probabilities associated with given ranges (orerror factors for the risk results) are consequently alsouncertain. PSA uncertainties should be considered ‘fuzzy’values that account principally for the input parameteruncertainties which have been explicitly quanti� ed.
The signi� cance of many of the modelling simpli� cationsand assumptions which exist in a PSA can be revealed byperforming sensitivity studies to evaluate the impacts ofmodel alternatives and different assumptions. They can alsobe treated by assigning uncertainties to parameters sub-jectively and propagating these uncertainties.
Well-developed methods are available for estimatinguncertainties in the parameters derived from the basic dataand propagating them through the analysis. While the twoprinciple approaches used differ, they may produce similarresults, particularly when the data base is large. They canalso differ substantially, re� ecting the assumptions onwhich they are based.
Uncertainty and sensitivity analyses need to be better
136 HAYNS
Trans IChemE, Vol 77, Part B, May 1999

organized and displayed. The sensitivity and uncertaintyanalyses that are performed in a PSA have not always beenwell organized and discussed together in one place in thereport. If this is done, it will provide a better understandingof the dominant uncertainty contributors, aid in identifyingrobust uses of the results and better identify areas whereadditional research is needed.
4.8 Summary of the State of the Art of PSA
The following represents a minimal summary of the stateof the art of PSA following its rapid development from~ 1975–1985.
System modelling (plant analysis)· Methodology basically unchanged since RSS.· Improved computer codes now allow ef� cient handling ofmore complex models.· Improved treatment of dependent failures.
Human interactions· Improved techniques for handling procedural errors.· Cognition and comprehension errors are often consideredbut modelling is still relatively crude.· Analysis now includes recovery actions, but furtherimprovement is needed.
Data base· Signi� cant improvement for transient initiators.· Only modest improvement in other areas.· Accident progression, containment response and radio-nuclide transport.· Signi� cant improvement in analytical abilities.· Area currently undergoing rapid change.
· Generally only subjective uncertainty estimates currentlyavailable.· Limited experiments to provide validity in some areas.
Consequence analysis· Some improvement in modelling capabilities.· Sensitivity analyses available for many modellingassumptions.· Comprehensive uncertainty analysis not yet available.
External initiators· Major advances in recent years.· Great con� dence cannot be placed in quantitative resultsof low frequency events.
Uncertainty analyses· Some improvements in methods.· Comprehensive treatment not yet available.
5. SEVERE ACCIDENT RESEARCH ANDDEVELOPMENT
One of the most important rami� cations of the develop-ment of PSA has been its voracious need for information.The quantitative approach to risk evaluation means thatthere is ‘nowhere to hide’ when it comes to the needfor information and understanding. When the RSS wasperformed, its main contribution was to expose areas of lackof knowledge or data, or where ‘engineering judgement’had been used in situations where judgement was hardlyappropriate. The need for more information was broughtinto sharp focus by the TMI-2 accident and the regulatoryresponses to it. This spawned an intensive R&D pro-gramme, generally labelled ‘Severe Accident’ research,
137PROBABILISTIC RISK ASSESSMENT IN THE NUCLEAR INDUSTRY
Trans IChemE, Vol 77, Part B, May 1999
Analysis ofphysicalprocesses
Identification ofaccident initiator
contributions
Initial design/informationcollection
Human and componentreliability data
base
Identification ofaccident initiators(external events)
Site dependentevent data
Componentfragilities
System response
Procedures andhuman reliability
modelling
Systemmodelling
Fault/eventtree
development
Accidentsequence
quantification
Containmentbuildingresponse
Accident sequenceplus containment
failure modequantification
Quantificationof risk
Uncertainty analysis
FissionProduct sourceterm evaluation
Environmentalconsequenceevaluation
External event analysis
Plant analysis
Containment response
Figure 13. ‘Linking Diagram’ showing the connection between the various steps in a PSA and in particular showing the central role of the uncertaintyanalysis.

which began in earnest around 1980 and in some areascontinues to this day. Any history of the development of thePSA methodology would be incomplete without somereference to the major R&D it engendered, and the tangibleimprovements in safety which have ensued.
Whilst methods have been re� ned, and data basesimproved, the developments in reliability analysis havenot required an extensive research programme. The topicarea is rather mature and hence the value of level 1 PSA(which described component and systems features up tocore degradation) has been recognized and its output is nowvirtually commonplace for a variety of uses. For level 2 PSAin particular the implementation of the methodology servedrather to highlight the paucity of models and data needed tofollow the evolution of a degrading core both in- and ex-vessel, and in the requirement to understand containmentresponse suf� ciently well to be able to predict radioactivesource terms to be expected with speci� c accidentsequences. Apart from human factors (which I return toshortly), it has been with the phenomenology of coredegradation that much of the R&D has been focused.
All countries operating reactors for power generationhave actively participated in this programme, and the levelof international collaboration has been almost uniquelyhigh. The international institutions (the IAEA, Organizationfor Economic and Cultural Development (OECD)/NuclearEnergy Agency (NEA), World Association of NuclearOperators (WANO), etc.) have also played very active roles.This has meant that research results in the majority of theareas have been made freely available to all countries, ashave been the consequent safety bene� ts. There are twomain reasons for this. First, there is a common interest inresearch which leads directly to an improvement in safety,and second, many of the research areas are technicallycomplex and must operate with dif� cult materials inextreme conditions. They are therefore very expensive. Agood example of such collaborations is the EuropeanUnion’s Severe Accidents research programme which hasbeen organized and paid for by the Nuclear Fission SafetyProgramme of the EURATOM Framework programme(Council decision 94/268/Euratom of 26 April 1994).
It is anticipated that a similar programme will continueunder the � fth Framework programme beginning in 1999.The EU’s programme in Severe Accident research has had amid-term review54. A quotation from the foreword of thisreview by E. Andretta, the Director of the relevant section ofthe Commission, sums up the ‘international’ view of suchresearch:
‘The subject of hypothetical severe accidents in LWRs is socomplex to understand, the relevant research is soexpensive, that international research programmes, such asthe present one, are needed to come to � rm conclusions.Through these EU research projects, the outline spectrum ofsevere accident problems is being addressed, from earlyaccident progression in the primary coherent system, threatsto the reactor pressure vessel and radiological releases out ofthe primary circuit, up to severe damage to containmentintegrity, assuming that the safety systems are not workingsatisfactorily. Technological solutions are also investigated,especially for mitigative measures against the consequencesof severe accidents. In addition, some R&D efforts are beingdevoted to risk relevant aspects of materials ageing.’
Virtually all of the topics mentioned here have beenspawned out of the need to have an improved understandingof the basic mechanisms of the core melting behaviour, andworkable models so that level 2 PSA can be re� ned into aviable tool. Similar research programmes have beenactively funded in the USA (mainly through theUSNRC55) and in all LWR operating countries. In the UKthis is co-ordinated by the Nuclear Safety Directorate of theHealth and Safety Executive, and managed by a jointindustry/NII group.
Whilst there are still a number of open issues, much ofthis research is now mature and the resources available bothnationally and internationally have been reducing in recentyears. This generally follows the trend in other aspects ofthe nuclear industry where the building programme ismoribund and the attention has refocused somewhat ontoissues relating to plant ageing (which also have their severeaccident elements) and into radionuclide waste manage-ment. This has caused concern in many research circlessince expensive core specialized facilities and capabilitiesare in jeopardy and because there is always more knowledgeto be unearthed,. In recognition of that, the Committee onthe Safety of Nuclear Installations (CSNI) of the OECD/NEA has initiated a study of this possibility to co-ordinatespeci� c international collaborations where such facilities aredeemed to have real safety signi� cance for many countries.This work has been reported in a series of documents56, thelatest of which is in the � nal stages of preparation.
Current applications are focusing on what can be done tomitigate and/or manage severe accidents, and a full reviewof developments is available57. In addition, a recent reviewof the technical issues underpinning the remaining uncer-tainties in severe accident phenomenologyis also available58.
6. THE REGULATORS’ VIEWS OFPROBABILISTIC METHODS
The early developers of PSA believed that the capabilityto ‘calculate’ risks posed by plant (and this applied to allpotentially hazardous plant as exempli� ed by the papersaccompanying this one) would � nd use not only with plantoperators and designers but also with regulators. After all,the acceptability of a plant in the broadest sense has to be acombination of risks (health, environmental and economic)and bene� ts59. The ability to have a � rm quanti� cation ofthe actual risk posed to people is an essential contribution tothis process60. This review began with the early (1967)attempts by Farmer to provide a criterion against whichrisks may be judged– it led eventually to the developmentof the methods of PSA in order to calculate the risk so thatcompliance with a criterion could be judged. This processitself led to a much deeper understanding of risk and theproblems connected with calculating it and, in time, led theregulatory authorities to regard PSA with some caution. Inthe UK, much of this debate took place at the Public Enquirycalled over the then CEGB’s application to build a PWR atSizewell in Suffolk (The Sizewell B Inquiry). This debatefocused on risk acceptance and risk quanti� cation withmuch discussion surrounding the nature and importance ofuncertainties in what is already a probabilistic case. Thewhole question of risk acceptance criteria was discussedwith the Inspector himself almost complaining that theindustry (CEGB) had set out to calculate risk, but the
138 HAYNS
Trans IChemE, Vol 77, Part B, May 1999
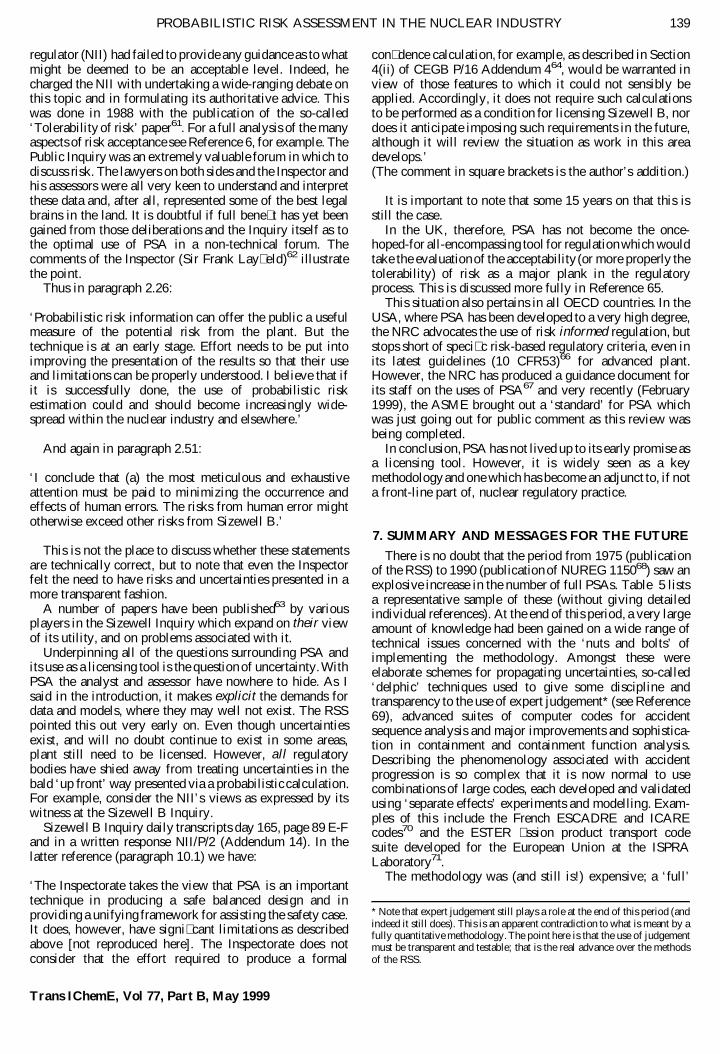
regulator (NII) had failed to provide any guidance as to whatmight be deemed to be an acceptable level. Indeed, hecharged the NII with undertaking a wide-ranging debate onthis topic and in formulating its authoritative advice. Thiswas done in 1988 with the publication of the so-called‘Tolerability of risk’ paper61. For a full analysis of the manyaspects of risk acceptance see Reference 6, for example. ThePublic Inquiry was an extremely valuable forum in which todiscuss risk. The lawyers on both sides and the Inspector andhis assessors were all very keen to understand and interpretthese data and, after all, represented some of the best legalbrains in the land. It is doubtful if full bene� t has yet beengained from those deliberations and the Inquiry itself as tothe optimal use of PSA in a non-technical forum. Thecomments of the Inspector (Sir Frank Lay� eld)62 illustratethe point.
Thus in paragraph 2.26:
‘Probabilistic risk information can offer the public a usefulmeasure of the potential risk from the plant. But thetechnique is at an early stage. Effort needs to be put intoimproving the presentation of the results so that their useand limitations can be properly understood. I believe that ifit is successfully done, the use of probabilistic riskestimation could and should become increasingly wide-spread within the nuclear industry and elsewhere.’
And again in paragraph 2.51:
‘I conclude that (a) the most meticulous and exhaustiveattention must be paid to minimizing the occurrence andeffects of human errors. The risks from human error mightotherwise exceed other risks from Sizewell B.’
This is not the place to discuss whether these statementsare technically correct, but to note that even the Inspectorfelt the need to have risks and uncertainties presented in amore transparent fashion.
A number of papers have been published63 by variousplayers in the Sizewell Inquiry which expand on their viewof its utility, and on problems associated with it.
Underpinning all of the questions surrounding PSA andits use as a licensing tool is the question of uncertainty. WithPSA the analyst and assessor have nowhere to hide. As Isaid in the introduction, it makes explicit the demands fordata and models, where they may well not exist. The RSSpointed this out very early on. Even though uncertaintiesexist, and will no doubt continue to exist in some areas,plant still need to be licensed. However, all regulatorybodies have shied away from treating uncertainties in thebald ‘up front’ way presented via a probabilistic calculation.For example, consider the NII’s views as expressed by itswitness at the Sizewell B Inquiry.
Sizewell B Inquiry daily transcripts day 165, page 89 E-Fand in a written response NII/P/2 (Addendum 14). In thelatter reference (paragraph 10.1) we have:
‘The Inspectorate takes the view that PSA is an importanttechnique in producing a safe balanced design and inproviding a unifying framework for assisting the safety case.It does, however, have signi� cant limitations as describedabove [not reproduced here]. The Inspectorate does notconsider that the effort required to produce a formal
con� dence calculation, for example, as described in Section4(ii) of CEGB P/16 Addendum 464, would be warranted inview of those features to which it could not sensibly beapplied. Accordingly, it does not require such calculationsto be performed as a condition for licensing Sizewell B, nordoes it anticipate imposing such requirements in the future,although it will review the situation as work in this areadevelops.’(The comment in square brackets is the author’s addition.)
It is important to note that some 15 years on that this isstill the case.
In the UK, therefore, PSA has not become the once-hoped-for all-encompassing tool for regulation which wouldtake the evaluation of the acceptability (or more properly thetolerability) of risk as a major plank in the regulatoryprocess. This is discussed more fully in Reference 65.
This situation also pertains in all OECD countries. In theUSA, where PSA has been developed to a very high degree,the NRC advocates the use of risk informed regulation, butstops short of speci� c risk-based regulatory criteria, even inits latest guidelines (10 CFR53)66 for advanced plant.However, the NRC has produced a guidance document forits staff on the uses of PSA67 and very recently (February1999), the ASME brought out a ‘standard’ for PSA whichwas just going out for public comment as this review wasbeing completed.
In conclusion, PSA has not lived up to its early promise asa licensing tool. However, it is widely seen as a keymethodology and one which has become an adjunct to, if nota front-line part of, nuclear regulatory practice.
7. SUMMARY AND MESSAGES FOR THE FUTURE
There is no doubt that the period from 1975 (publicationof the RSS) to 1990 (publication of NUREG 115068) saw anexplosive increase in the number of full PSAs. Table 5 listsa representative sample of these (without giving detailedindividual references). At the end of this period, a very largeamount of knowledge had been gained on a wide range oftechnical issues concerned with the ‘nuts and bolts’ ofimplementing the methodology. Amongst these wereelaborate schemes for propagating uncertainties, so-called‘delphic’ techniques used to give some discipline andtransparency to the use of expert judgement* (see Reference69), advanced suites of computer codes for accidentsequence analysis and major improvements and sophistica-tion in containment and containment function analysis.Describing the phenomenology associated with accidentprogression is so complex that it is now normal to usecombinations of large codes, each developed and validatedusing ‘separate effects’ experiments and modelling. Exam-ples of this include the French ESCADRE and ICAREcodes70 and the ESTER � ssion product transport codesuite developed for the European Union at the ISPRALaboratory71.
The methodology was (and still is!) expensive; a ‘full’
139PROBABILISTIC RISK ASSESSMENT IN THE NUCLEAR INDUSTRY
Trans IChemE, Vol 77, Part B, May 1999
* Note that expert judgement still plays a role at the end of this period (andindeed it still does). This is an apparent contradiction to what is meant by afully quantitative methodology. The point here is that the use of judgementmust be transparent and testable; that is the real advance over the methodsof the RSS.
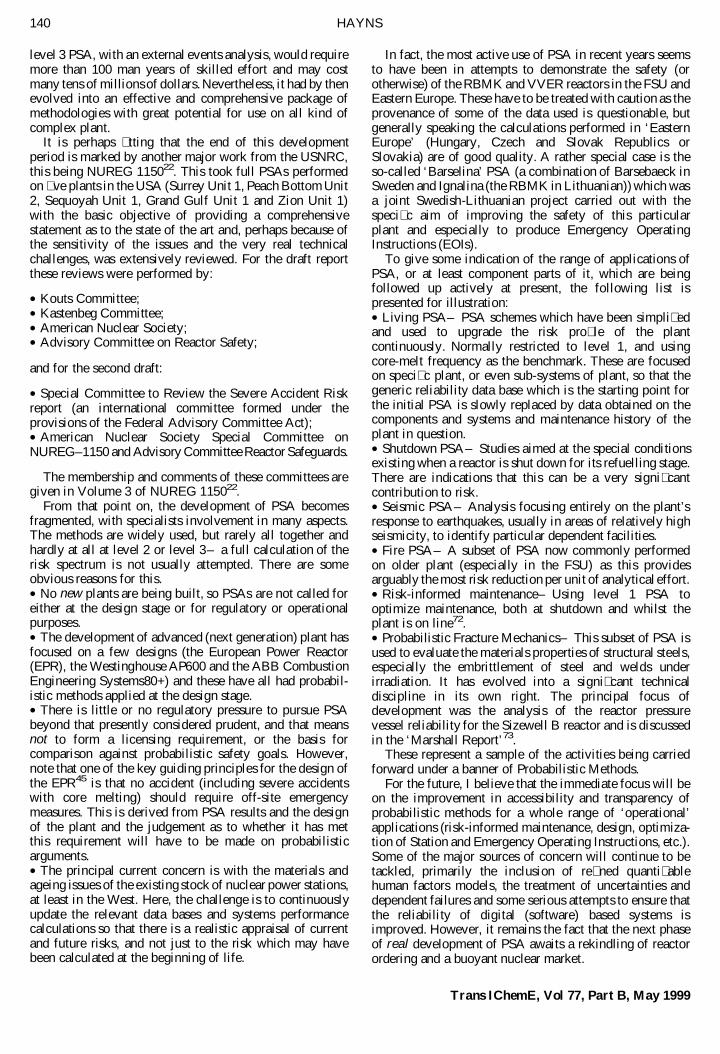
level 3 PSA, with an external events analysis, would requiremore than 100 man years of skilled effort and may costmany tens of millions of dollars. Nevertheless, it had by thenevolved into an effective and comprehensive package ofmethodologies with great potential for use on all kind ofcomplex plant.
It is perhaps � tting that the end of this developmentperiod is marked by another major work from the USNRC,this being NUREG 115022. This took full PSAs performedon � ve plants in the USA (Surrey Unit 1, Peach Bottom Unit2, Sequoyah Unit 1, Grand Gulf Unit 1 and Zion Unit 1)with the basic objective of providing a comprehensivestatement as to the state of the art and, perhaps because ofthe sensitivity of the issues and the very real technicalchallenges, was extensively reviewed. For the draft reportthese reviews were performed by:
· Kouts Committee;· Kastenbeg Committee;· American Nuclear Society;· Advisory Committee on Reactor Safety;
and for the second draft:
· Special Committee to Review the Severe Accident Riskreport (an international committee formed under theprovisions of the Federal Advisory Committee Act);· American Nuclear Society Special Committee onNUREG–1150 and Advisory Committee Reactor Safeguards.
The membership and comments of these committees aregiven in Volume 3 of NUREG 115022.
From that point on, the development of PSA becomesfragmented, with specialists involvement in many aspects.The methods are widely used, but rarely all together andhardly at all at level 2 or level 3– a full calculation of therisk spectrum is not usually attempted. There are someobvious reasons for this.· No new plants are being built, so PSAs are not called foreither at the design stage or for regulatory or operationalpurposes.· The development of advanced (next generation) plant hasfocused on a few designs (the European Power Reactor(EPR), the Westinghouse AP600 and the ABB CombustionEngineering Systems80+) and these have all had probabil-istic methods applied at the design stage.· There is little or no regulatory pressure to pursue PSAbeyond that presently considered prudent, and that meansnot to form a licensing requirement, or the basis forcomparison against probabilistic safety goals. However,note that one of the key guiding principles for the design ofthe EPR45 is that no accident (including severe accidentswith core melting) should require off-site emergencymeasures. This is derived from PSA results and the designof the plant and the judgement as to whether it has metthis requirement will have to be made on probabilisticarguments.· The principal current concern is with the materials andageing issues of the existing stock of nuclear power stations,at least in the West. Here, the challenge is to continuouslyupdate the relevant data bases and systems performancecalculations so that there is a realistic appraisal of currentand future risks, and not just to the risk which may havebeen calculated at the beginning of life.
In fact, the most active use of PSA in recent years seemsto have been in attempts to demonstrate the safety (orotherwise) of the RBMK and VVER reactors in the FSU andEastern Europe. These have to be treated with caution as theprovenance of some of the data used is questionable, butgenerally speaking the calculations performed in ‘EasternEurope’ (Hungary, Czech and Slovak Republics orSlovakia) are of good quality. A rather special case is theso-called ‘Barselina’ PSA (a combination of Barsebaeck inSweden and Ignalina (the RBMK in Lithuanian)) which wasa joint Swedish-Lithuanian project carried out with thespeci� c aim of improving the safety of this particularplant and especially to produce Emergency OperatingInstructions (EOIs).
To give some indication of the range of applications ofPSA, or at least component parts of it, which are beingfollowed up actively at present, the following list ispresented for illustration:· Living PSA– PSA schemes which have been simpli� edand used to upgrade the risk pro� le of the plantcontinuously. Normally restricted to level 1, and usingcore-melt frequency as the benchmark. These are focusedon speci� c plant, or even sub-systems of plant, so that thegeneric reliability data base which is the starting point forthe initial PSA is slowly replaced by data obtained on thecomponents and systems and maintenance history of theplant in question.· Shutdown PSA– Studies aimed at the special conditionsexisting when a reactor is shut down for its refuelling stage.There are indications that this can be a very signi� cantcontribution to risk.· Seismic PSA– Analysis focusing entirely on the plant’sresponse to earthquakes, usually in areas of relatively highseismicity, to identify particular dependent facilities.· Fire PSA– A subset of PSA now commonly performedon older plant (especially in the FSU) as this providesarguably the most risk reduction per unit of analytical effort.· Risk-informed maintenance– Using level 1 PSA tooptimize maintenance, both at shutdown and whilst theplant is on line72.· Probabilistic Fracture Mechanics– This subset of PSA isused to evaluate the materials properties of structural steels,especially the embrittlement of steel and welds underirradiation. It has evolved into a signi� cant technicaldiscipline in its own right. The principal focus ofdevelopment was the analysis of the reactor pressurevessel reliability for the Sizewell B reactor and is discussedin the ‘Marshall Report’73.
These represent a sample of the activities being carriedforward under a banner of Probabilistic Methods.
For the future, I believe that the immediate focus will beon the improvement in accessibility and transparency ofprobabilistic methods for a whole range of ‘operational’applications (risk-informed maintenance, design, optimiza-tion of Station and Emergency Operating Instructions, etc.).Some of the major sources of concern will continue to betackled, primarily the inclusion of re� ned quanti� ablehuman factors models, the treatment of uncertainties anddependent failures and some serious attempts to ensure thatthe reliability of digital (software) based systems isimproved. However, it remains the fact that the next phaseof real development of PSA awaits a rekindling of reactorordering and a buoyant nuclear market.
140 HAYNS
Trans IChemE, Vol 77, Part B, May 1999

REFERENCES1. IAEA Report of the Advisory Group on Development of a Manual for
Probabilistic Risk Analysis and its Application to Safety DecisionMaking, 14–18 May 1984 (IAEA, Vienna).
2. Shorter Oxford Dictionary on Entomological Principles, 3rd edition,1970, p. 1743.
3. Royal Society, 1983, Risk Assessment: A Study Group Report, and1992, Risk: Analysis, Perception and Management: Report of a RoyalSociety Study Group (Royal Society).
4. Jones, D. A. (ed), 1992, Nomenclature for Hazard and Risk Assessmentin the Process Industries, 2nd edition (Institution of ChemicalEngineers).
5. British Medical Association, 1987, Living with Risk (John Wiley andSons).
6. Allen, F. R., Garllick, A. R., Hayns, M. R. and Taig, A. R., 1992, TheManagement of Risks to Society from Potential Accidents (ElsevierApplied Science).
7. See Reference 6, Chapter 5.8. Le Guen, J., 1995, Generic Terms and Concepts in the Assessment and
Regulation of Industrial Risks, Health and Safety Executive discussiondocument.
9. Covello, V. T. and Munpower, J., 1985, Risk analysis and riskmanagement: an historical perspective, J Risk Analysis, 5 (2): 103–120.
10. Bernstein, D. L., 1997, Against the Gods (John Wiley and Sons).11. Ashby, E., 1978, Reconciling Man with the Environment (Oxford
University Press).12. Green and Bourne, 1972, Reliability Technology (Wiley) (reprinted
1982).13. Kececioglu, D., 1993, Reliability and Life Testing Handbook (Prentice
Hall).14. Hayns, M. R., The implications of PRA for safety policy, in
Cullingford, M. C., Shah, S. M. and Gittus, J. H. (eds), 1987,Implications of Probabilistic Safety Assessment, 27–41 (ElsevierApplied Science).
15. Kinchin, G. H., Risk assessment, in Marshall, W. (ed), 1983, NuclearPower Technology, Volume 3 (Clarendon Press, Oxford).
16. Siddall, E., 1959, Statistical analysis of reactor safety standards,Nucleonic, 17 (2): 64.
17. Howard, R. W., Barthrop, R. K., Bishop, G. S. and Bevan, F.,Reliability in automatic landing, Flight, 10 October 1960.
18. For a complete and authoritative account of the Windscale accident andthe history of the development of nuclear power around this time, seeGowing, M., 1987, How Nuclear Power Began (University ofSouthampton Press).
19. Marley, W. G. and Fry, T. M., 1956, Radiological hazards from anescape of � ssion products and the implications for nuclear powerreactor location, Proc Int Conf on the Peaceful Uses of Atomic Energy,13: 102–105 (United Nations, New York).
20. Farmer, R., 1967, Siting criteria– a new approach, Containment andSiting of Nuclear Power Plants Proceedings of a Symposium, IAEA SM89/34 (IAEA, Vienna).
21. Reactor Safety Study, An Assessment of Accident Risk in USCommercial Nuclear Power Plants, USNRC WASH 1400 (NUREG75/014), October 1975.
22. Severe Accident Risks: An Assessment for Five US Nuclear PowerPlants, USNRC NUREG 1150, December 1990.
23. See for example Battelle Memorial Institute (BMI) Report 2104, July1984, Radionuclide Release under Speci� c LWR Accident Conditions,and Gittus, J. H. (ed), 1983, PWR Degraded Core Analysis, UKAEAReport NDR (610).
24. Westinghouse Electric Corporation, Sizewell B Probabilistic SafetyStudy, WCAP 9991, July 1992.
25. Ottway, H. J. and Endman, R. P., 1970, Reactor siting from a risk pointof view, Nuclear Engineering and Design, 13: 305–376.
26. In principle both RPV failure and interfacing systems LOCA should beviewed as ‘simple’ systems failures but the ways in which they aredealt with are anything but simple. In the UK the rami� cations of thiswere exempli� ed in the Sizewell B study and the NII’s stated approachto large accidents– these are discussed in Section 6.
27. The Three Mile Island Reactor Pressure Vessel Investigation Project–Achievements and Signi�cant Results, OECD/NEA and USNRC OpenForum, OECD, Paris 1994.
28. See for example papers in Severe Accident Management Implementa-tion, OECD Specialists Meeting, Niantic, CT, USA, 12–14 June 1995.
29. US Nuclear Regulatory Commission, February 1981, A RiskComparison, NUREG/CR 1916, and the discussion in Reference 8.
30. Commonwealth Edison Co., 1981, Zion Probabilistic Safety Study.31. Consolidated Edison Co. and New York State Power Authority, 1980,
Indian Point Probabilistic Safety Study.32. US Nuclear Regulatory Commission, February 1982, Safety Goals for
Nuclear Power Plant, A Discussion Paper, NUREG 0880.33. US Nuclear Regulatory Commission, June 1980, Report of the Task
Force on Interim Operation of Indian Point, NUREG 0715.34. Testimony before the Nuclear Regulatory Commission, September
1984 (Testimony of F. Rowsome, USNRC).35. Brearly, I. R., Nixon, W. and Hayns, M. R., 1987, An investigation of
the closure problem applied to reactor accident source terms,Implications for Probabilistic Risk Assessment, IAEA SR 111/37(Elsevier Applied Science).
36. See for example Fire and Safety ‘94, 5–7 December 1994, Barcelona(Nuclear Engineering International). In particular, Hayns, M. R., Firesand external hazards in Soviet designed plant– insights from Westernassistance programmes (pp. 349–352) and Marttila, J., Fire risks inSoviet designed NPPs (pp. 353–365).
37. Sizewell B Power Station Public Inquiry, Mathews, R. R., The CEGBSafety Policy, CEGB Proof P/2 to the Sizewell B Public Inquiry.
38. Sizewell B Power Station Public Inquiry, CEGB Statement of Case,CEGB 1 Vol. 2, 139–143.
39. Sizewell B Power Station Public Inquiry, Wood, P. B., Proof ofEvidence of HM Nuclear Installations Inspectorate’s view on theCEGB’s safety case, NII/P/2.
40. Richardson, D. C. et al., A decade of experience of PRA in the USA–what has been achieved?, IAEA Symposium on Safety Codes andGuides (NUSS) in the Light of Current Safety Issues, Vienna, 29October–2 November 1984, IAEA - SM-275/38.
41. Westinghouse Electric Corporation Sizewell B Probabilistic SafetyStudy, WCAP 9991, July 1982.
42. Sizewell B Power Station Public Inquiry, Gittus, J. H. et al., CEGBProof of Evidence, P/16, Addendum 3.
43. The EPR Project, European Nuclear Society Conference Report,Strasbourg, 13–14 November 1995.
44. Pederson, T., 1989, PIUS: status and prospects, IAEA Bulletin 3, 25–29.
45. Shepherd, J. and Hayns, M. R., 1991, SIR: reducing size can reducecosts, Nuclear Energy, 30 (2): 85–93.
46. MW (Th.) MARS Nuclear Power Plant, Design Progress Report, 1997(University of Rome ‘La Sapienza’).
47. See for example Hayns, M. R. and Hicken, E. F., Key issues for passivesafety, IAEA Advisory Group Meeting on Technical Feasibility andReliability of Passive Safety Systems, 21–24 November 1987, Julich,Germany. And Hayns, M. R. and Phillips, D. W., 1987, Safetyprinciples for advanced plant, Nuclear Power Performance and Safety.IAEA International Conference, 28 September–2 October 1987,Vienna, Austria, IAEA-CN-48/210, 459–471.
48. Deutsche Riskostudie, Kernkraft Werke, Verlag, TUV, Rheinland,1980. See also Birkhoffer, A., 1980, The German risk study for nuclearpower plants, IAEA Bulletin, 22 (5/6): 23–33.
49. A Probabilistic Safety Assessment of the Standard French 900MW9ePressurised Water Reactor, CEA, IPSN, EPS 900, April 1990.
50. US Nuclear Regulatory Commission, September 1984, ProbabilisticRisk Assessment Reference Document, NUREG 1050.
51. Hayns, M. R., Abbey, F., Clough, P. N. and Dunbar, I. H. (UKAEA)and Walker, D. H. (Westinghouse), November 1982, The TechnicalBasis of ‘Spectral Source Terms’ for Assessing the Uncertainties inFission Product Release during accidents in PWRs with specialreference to Sizewell B, UKAEA Report SRD R256.
52. See for example Norros, L., 1998, Evaluation and development ofprocess operators’ working practices, Symposium of the FinnishResearch Programme on Reactor Safety. VTT Automation, 187–198,and references contained therein.
53. See papers in Fire and Safety ‘94, 5–7 December 1994, Barcelona,Spain (Nuclear Engineering International Ltd and Status MeetingsLtd).
54. Van Goethem, G., Kleinhurst, G., Marten Bernejo, J. and Zurita, A.(eds), 1997, FISA– 97 EU Research on Severe Accidents, EC,Luxembourg 17–19 November 1997, EUR 18258 EN.
55. See for example Spies, T. P., Lee, R. Y., Solfer, L. and Meyer, R. O.,1992, LWR severe accident source term research in the USA, inKriscler, W. and Rubenstein, M.C. (eds), The Phebus Project (ElsevierApplied Science).
141PROBABILISTIC RISK ASSESSMENT IN THE NUCLEAR INDUSTRY
Trans IChemE, Vol 77, Part B, May 1999

56. OECD/NEA, 1997, Nuclear Safety Research in OECD Countries–Capabilities and Facilities.
57. Livelent, M., 1997, Severe accident management for existingreactors– perspectives for future reactors, FISA– 97 EU Researchon Severe Accidents, EUR 18258 EN, 15–28.
58. Henry, R. E., 1995, Overview: uncertainties remaining in severeaccident phenomenology, OECD International Conference on SevereAccident Management Implementation, Niantic, CT, USA, 12–14 June1995, paper No. 29.
59. See for example Chicken, J. E. and Hayns, M. R., 1989, The RiskRanking Technique in Decision Making (Pergamon Press).
60. Hayns, M. R., 1988, Consequence assessment in nuclear power plantsafety, Radiation Protection in Nuclear Energy, IAEA InternationalConference, Sydney, Australia, 18–22 April 1988, IAEA CN 51/88,449–465.
61. Health and Safety Executive, 1998, The Tolerability of Risk fromNuclear Power Stations (HMSO, London).
62. Sir Frank Lay� eld, Sizewell B Public Inquiry Report (HMSO, London).63. Cullingford, M. C. and Shah, S. M. (eds), 1987, Implications of
Probabilistic Risk Assessment (Elsevier Applied Science), particularlyJenkins, P. D., The use of probabilistic safety assessment methods forCEGB reactors (pp 523–539), Campbell, J. F., The role of probabilisticsafety assessment and the licensing of Sizewell B (pp 611–626), andSiddall, E., The logic of risk assessment (pp 739–753).
64. Sizewell B Power Station Public Enquiry, CEGB Proof of EvidenceCEGB P/16 Addendum 4.
65. Roberts, L. E. J. and Hayns, M. R., 1989, Limitations on the usefulnessof risk assessment, Risk Analysis, 9 (4): 483–494.
66. USNRC Regulatory Guide (10 CFR53), 1994.67. US Nuclear Regulatory Commission, 1994, A Review of NRC Staff
Uses of Probabilistic Risk Assessment, NUREG 1489.68. See Reference 23 and the following supporting documents:
1. Accident frequency analysis: NUREG CR 4550.2. Accident progression: NUREG CR 4551.3. External events methods: Bohn, M. P. and Lambright, J. A.,November 1990, Procedures for the External Event Core DamageFrequency Analysis for NUREG 1150, NUREG CR 4840, SAND88-3102 (Sandia National Laboratories).4. Source term analysis: Denning, R.S. et al., July 1986, Report onRadionuclide Release Calculations for Selected Severe AccidentScenarios, NUREG CR 4624, Volumes 1–5, BMI 2139 (BattelleColumbus Division). And NUREG CR 5263, Volume 6, BMI 2139,August 1990.
5. Accident management analysis: Camp, A. L. et al., September 1988,The Risk Management Implications of NUREG 1150 Methods andResults, NUREG CR 5263, SAND88 3100 (Sandia National Labora-tories).6. QA studies: Cybulskis, P., November 1989, Assessment of the XSORCodes, NUREG CR 5346, BMI 2171, (Battelle Columbus Division).And Dobbe, C. A. et al., February 1990, Quality Assurance andVeri� cation of the MACCS Code Version 1.5, NUREG CR 6376, EGG2566 (Idaho National Engineering Laboratory).7. Code descriptions: Iman, R. L. and Shortencarrier, M. J., August1986, A User’s Guide for the Top Events Matrix Analysis Code(TEMAC), NUREG CR 4598; SAND86 0960 (Sandia NationalLaboratories). And Iman, R. L. and Shortencarrier, M. J., June 1984,A Fortran 77 Programme and User’s Guide for the Generation of LatinHypercube and Random Samples for Use with Computer Models,NUREG CR 3624, SAND83 2365 (Sandia National Laboratories).
69. Pyy, P. and Pulkkinen, U., 1998, Risk and reliability analysis (LURI)and expert judgement techniques, The Finnish Research Programmeon Reactor Safety, VTT Symposium 189, 163–177.
70. Rocreax, M. and Gauvain, J., 1997, ESCADRE and ICARE codesystem, in Van Goethem, G., Kleinhurst, G., Marten Bernejo, J. andZurita, A. (eds), FISA– 97 EU Research on Severe Accidents, EC,Luxembourg 17–19 November 1997, EUR 18258 EN.
71. Jones, A. V. and Sheperd, I., ESTER– a European source termevaluation system, in Van Goethem, G., Kleinhurst, G., MartenBernejo, J. and Zurita, A. (eds), FISA– 97 EU Research on SevereAccidents, EC, Luxembourg 17–19 November 1997, EUR 18258 EN.
72. See for example, Knoll, A., 1996, Quantitative risk matrices for on-linemaintenance at a nuclear power plant, ANS Annual Meeting, Reno,Nevada, June 1996, 260–261 (PSE&G, Hancocks Hill).
73. Study group under the chairmanship of Lord Marshall, 1983, AnAssessment of the Integrity of a PWR Pressure Vessel (UKAEA).
ADDRESSCorrespondence concerning this paper should be addressed to Professor
M. R. Hayns, School of Engineering and Applied Science, AstonUniversity, Aston Triangle, Birmingham B4 7ET, UK.
The manuscript was received 18 January 1999 and accepted forpublication after revision 12 March 1999.
142 HAYNS
Trans IChemE, Vol 77, Part B, May 1999


![B. Why Invest in Probabilistic Risk Assessment?1].pdf · Beyond highlighting the risk – by undertaking probabilistic risk analysis – the study made concrete recommendations based](https://img.dokumen.tips/doc/110x75/5ecae787cb8b5d212c4efc86/b-why-invest-in-probabilistic-risk-assessment-1pdf-beyond-highlighting-the.jpg)