Embed Size (px)
Citation preview

Rivista Italiana di Economia Demografia e Statistica Volume LXVI n. 2 Aprile-Giugno 2012
THE EVOLUTION OF OPTIMIZATION MODELS SUPPORTING
MOBILITY POLICIES AND TERRITORY DEVELOPMENT
Paolo Dell’Olmo
1 Introduction
In this paper four major milestones in the development of optimization models
are identified in the perspective of policy decision making for mobility and land
development. These milestones definition is arbitrary and is motivated only with
the purpose of helping the reader in following the contribution of mathematical
programming techniques into the decision-making tools that have been, and still
are, practically adopted in strategic and planning territory management. The
milestones defined will be referred as: Linear Programming, Integer and Mixed
Integer Programming, Integration of Optimization Models in Real-Time ICT
Architectures, Optimization and Business Analytics.
We introduce the reader into the evolution of optimization models so that the
contribution of the new outcomes in relation to applications in transportation and
mobility appears more evident.
The paper is organized as follows. In section 2 the main characteristics of
Linear Programming, which are at the base of any optimization model are recalled
and the evolution seen from the application point of view is sketched. Section 3
underlines the difference between linear programming and integer programming
and some example of integer optimization problems on graphs are given. In
Section 4 the role of optimization model with respect to Information and
Communication Technology development for transportation is briefly described.
Finally, in Section 5 is presented an example of application of optimization for
mobile services for tourism in metropolitan areas.
The reader should relay on the references for further investigations.
2 Linear Programming and the Management of Continuous Resources
Linear programming allows to model an optimization problems by means of
continuous variables that may represent, in general, a continuous divisible resource
as, for instance, the quantity of flow in an arc of a network or the portion of land

88 Volume LXVI n. 2 Aprile-Giugno 2012
that should be cultivated with certain grain. In general, in Linear Programming, we
want to find an assignment of the variables that maximize (or minimize) a given
linear function representing, for instance, profits (or costs). Such assignments must
obey to a number of constraints. Clearly, the flow in an arc cannot exceed the
capacity of the arc or the sum of assigned portions of lands cannot be grater than
the area of the region under study.
See the model below reported for illustrative purposes, where the decision
variable xi represents the quantity of a (continuously divisible) kind of good i to be
produced, and coefficients aij the quantity of raw material of kind j required for one
unit of good i, and bj the total amount of raw material j available. The ci
coefficients represent the profit that can be obtained by a unit of good i. Solving the
model permits to find the best (more profitable) quantity of each good to be
produced in order to maximize profit while respecting the constraints on the total
availability of each resource (bj). minimize
(1)
such that
(2)
As can be noticed, both objective and constraints are linear functions. Linear
programming is a very important class of problems, both for modelling capabilities
and for the algorithmic implications. Linear programming has so many applications
that we have to refer to the books in the references. The basic modelling result can
be seen as in this way: any practical interesting configuration of the decision
variables (corresponding to a specific real scenario) is one of the vertices of a
convex polyhedron in Rn and the number of these vertices (although extremely)
large is finite (see Figure 1). Assume the resource to be assigned is water for the
agriculture in different fields in a given area. The optimal water allocation on the
different fields (i.e. maximizing a give linear economic or function,) is one of the
vertices of the polyhedron. This remains true for any objective function also if

Rivista Italiana di Economia Demografia e Statistica 89
obtained as a linear combination of different criteria (i.e. any compromise between
profits and environmental impact).
Figure 1 ‒ An illustrative representation of the solution space of an LP program.
Figure 2 ‒ An illustrative representation the steps of the simplex algorithm toward the
optimal solution.

90 Volume LXVI n. 2 Aprile-Giugno 2012
From an algorithmic point-of-view, having to search only for vertices has a
great implication. The simplex, that moves from one vertex to an adjacent and
better one, was proposed in the forties (soon after the war, and was motivated by
military applications, Dantzig 1947) and, although it has performed very well in
practice, is known to run in exponential time in the worst-case. The first
polynomial-time algorithm, the ellipsoid algorithm, was only discovered at the end
of the seventies (Kachian 1979). Karmarkar’s algorithm in the mid-eighties lead to
very active research in the area of interior-point methods for linear programming.
We recall some of the numerous variations of interior-point methods in class
(Dikin 1967), (Frisch 1977).
A first application of optimization algorithm used in practice in Italy in the cast
iron production in the sixties reduced by 50% the cost. The application of the
simplex method was done using an electronic desk calculator to support each step
of the algorithm by two people in time measured in weeks.
Currently, the improvements, both on algorithms and in computer
computational power allows to solve problems with 1 million variables in tenths of
seconds.
For a more recent application of linear programming in the are of land planning
we mention the paper of Alampi Sottini et al. 2008, where an LP program is
designed and solve to simulate both a more profitable and sustainable use of land in
the area of Mugello (Tuscany, Italy) taking into account several constraints like the
maximum of agriculture surface available, the surface and aliments for animals, the
maximum number of family manpower, the agricultural and zootechnical
productions. Solution results visualized by means of a Geographical Information
System permit to the decision-maker to analyse very complex scenarios.
A further example is in equitable flow assignment on networks (see Dell’Olmo
2011). In this case, we have to assign flows on arcs of the network so to satisfying
the demand of goods transportation on different origin-destination points with the
double objective of minimizing both transportation cost and the impact of traffic in
different areas.
The example of the application of a Linear Programming model to flow
assignment for the network of Salerno is given in the next Figure. The color of an
area represents the traffic volume in that area (red = high, yellow = low). As can be
seen, in the right picture the optimized flow assignment has the same cost, but with
a more equitable impact on the areas than the case of the picture to the left.
Linear programming capabilities are now available in commercial software
tools to anyone interested in practical use of this kind of optimization models, only
in specific cases research activity is devoted in improving solution algorithms.

Rivista Italiana di Economia Demografia e Statistica 91
Figure 3 ‒ A grid of uniform cells overlapped to the underlying road transportation
network of the city of Salerno, Italy.
3 Integer Programming, Logistics and Freight Distribution
In the early seventies the classes P and NP (Garey and Jhonson 1979) were
defined, it was observed that a large class of optimization problems were equally
difficult to solve and for no one of them polynomial time algorithm (like for the
case of linear programming) exists. Routing and scheduling problems, which are
the basic ingredients of distribution logistic management, belong (unfortunately) to
this class. For these problems, decision variables must assume integers values and,
in a wide range of cases, variable values are only 0 or 1. In many routing problems,
for instance, a value of 1 of a variable means the corresponding arc is part of the
solution, 0 means the opposite. As in practice one wants to know if an arc is in his
paths or not, fractional values of decision variables have very little meaning,
The classical problem of this kind is the well known Travelling Salesman
Problem (TSP). The TSP is so defined: Given a complete undirected graph G=(V,
E) that has nonnegative integer cost c(u, v) associated with each edge (u, v) in E,
the problem is to find an hamiltonian cycle (tour that visit each node only once) of
G with minimum cost.
Here, the basic difficulty, for which efficient algorithms like those for linear
programming cannot be applied, is that the solution set is not represented by the
vertices of a polyhedron, but by integer points in a multidimensional solution
space.
No general efficient solution method exists at this moment for exact solutions of
this type of problems and a great effort has been done in designing specific solution
procedure for problem classes.

92 Volume LXVI n. 2 Aprile-Giugno 2012
Figure 4 ‒ Example of TSP solutions of value 62 and 48 respectively.
Fig. 5 ‒ The solution space of an integer programming is represented by the dots contained
in the polyhedron.
The main contribution of optimization methods from the late seventies up to
now is to having provided a number of different solution approaches to solve
computationally difficult problems of this kind.
Algorithms like Dynamic Programming, Branch and Bound, Branch and Cut
(see references book integer programming) have been proposed to find exact
solutions to computationally intractable problems (see picture below that illustrates
the way branch and bound partitions the solution space).

Rivista Italiana di Economia Demografia e Statistica 93
Figure 6 ‒ The partition of the solution space operated by branch and bound algorithm.
To give an idea of progresses in algorithm design in the last decades see the
following picture where the size (number of cities) of the TSP instances solved is
reported on the y axis over the years.
Figure 7 ‒ The size of TSP instances solved over the years.

94 Volume LXVI n. 2 Aprile-Giugno 2012
Beyond the performances in test problem, it has to be noticed that the same
techniques are implemented in other routing models (for instance Multi-Depot
Vehicle Routing Models, Toth 2002) that are fundamental tools for a competitive
distribution logistic system.
Currently, a significant effort of the research activity in this area is devoted in
finding better solution methods (i.e. capable of solving real life large instances) and
algorithms for specific problems that take into account a number of operational
constraints (like time windows, priorities and the like). See Golden 2008 for recent
advances in this area.
4 Real-Time Optimization and Services on Transportation Networks
In the last decade, transportation networks have been equipped with a number
of different devices (traffic sensors, cameras, on board GPS, etc.) which changed
significantly the way optimization models are used in traffic control. Especially in
metropolitan areas, a complex communication network gathers data from different
sources into a central control system where several decisions can be taken
regarding traffic lights control, Variable Message Signs (VMS) implementation
and further services for public and private transportation (see the Figure below).
Figure 8 ‒ Different sources and devices to collect real time data.

Rivista Italiana di Economia Demografia e Statistica 95
In this case, optimization models are components of larger software
architectures and very often are fed with real time data with the purpose of having
real-time decisions.
For example, when traffic congestion slow down traffic flow on a given road,
routing algorithms must be able to providing alternative paths in tenth of seconds
ensuring that the whole network reaches a new acceptable state of stochastic
equilibrium.
A further example of application is when distribution services accept on line
(real time) requests of new pick-up and delivery. In those cases, the fleet paths
must be dynamically adapted to incoming demand and on board equipment is
necessary to advisor the driver for the change. For this class of models execution
time must be kept as small as possible and a number of additional constraints must
be taken into account also additional requirements like inventory (see Favaretto et
al. 1998) for an example.
5 Mobile Services for Tourism
Following what has been described in the previous section, we present here an
application of optimization models to support the mobility of a specific class of
users, that is tourist in large metropolitan areas.
In this case, available time for the visit is always limited and one wants to visit as
many interesting places as possible. Clearly there are several ways to approximate
the utility function of a specific tourist (knowing his/her characteristics and
preferences), and an example of objective function is given next:
( ) ∑ ∑ ∑
(3)
Here the variable yj is 1 if the place is visited and, similarly, variable yij is 1 if the
arc connecting place i to place j is chosen, and 0 otherwise. The coefficient Skj and
Skij can be seen as fuzzy estimates of the marginal value for the tourist k in visiting
location i or travelling in the road connecting i to j respectively.
Time constraints can be represented as follows:
∑ ∑ ∑
(4)
where tkj is an estimation of the time required that tourist k requires to visit location
j and tkij ; tmax is the total time available.
96 Volume LXVI n. 2 Aprile-Giugno 2012
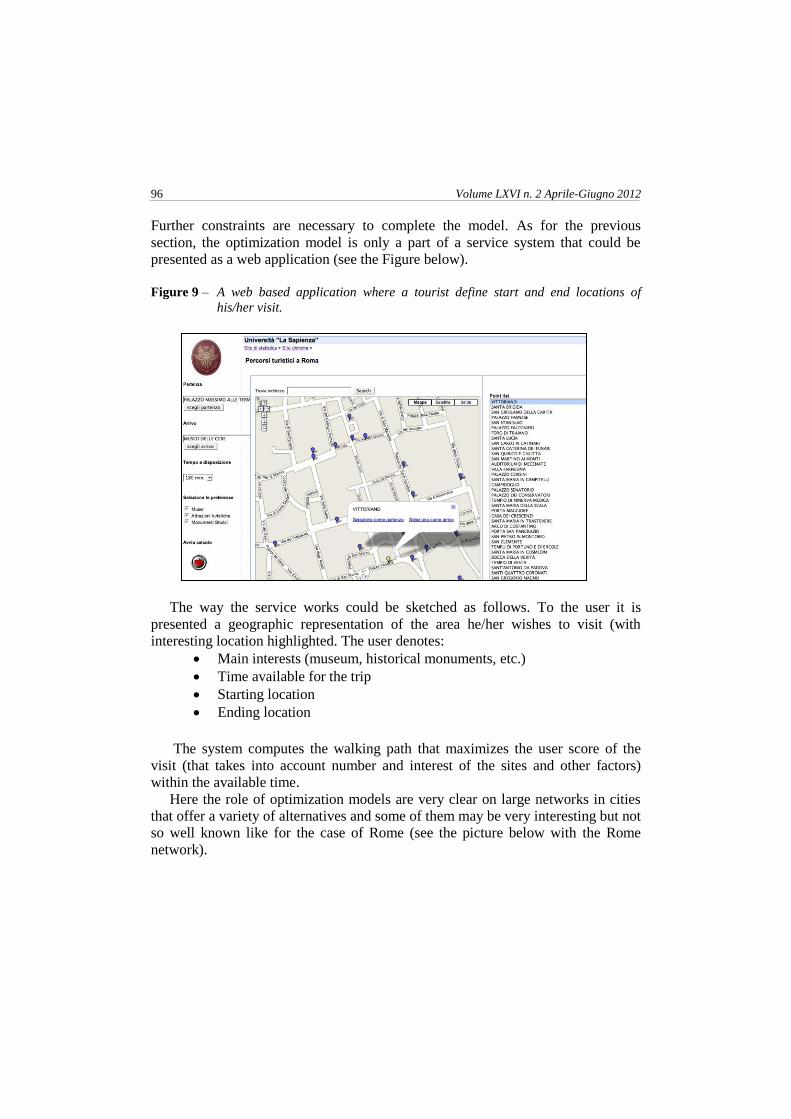
Further constraints are necessary to complete the model. As for the previous
section, the optimization model is only a part of a service system that could be
presented as a web application (see the Figure below).
Figure 9 ‒ A web based application where a tourist define start and end locations of
his/her visit.
The way the service works could be sketched as follows. To the user it is
presented a geographic representation of the area he/her wishes to visit (with
interesting location highlighted. The user denotes:
Main interests (museum, historical monuments, etc.)
Time available for the trip
Starting location
Ending location
The system computes the walking path that maximizes the user score of the
visit (that takes into account number and interest of the sites and other factors)
within the available time.
Here the role of optimization models are very clear on large networks in cities
that offer a variety of alternatives and some of them may be very interesting but not
so well known like for the case of Rome (see the picture below with the Rome
network).

Rivista Italiana di Economia Demografia e Statistica 97
Figure 10 ‒ The graph of Rome with 1092 nodes, 4468 arcs and 226 places of interest.
Figure 11 ‒ The perimeter of places of interest so that sum of distances a to x and x to b is
equal
In order to limit the search to places that can be reached within the time limit,
an ellipse is defined with first and second focus the starting and ending point of the
visit.

98 Volume LXVI n. 2 Aprile-Giugno 2012
The ellipse radius is computed calculating the maximum distance that can be
travel by walking in the maximum available time.
Figure 12 ‒ The graph of Rome with 1092 nodes, 4468 arcs and 226 places of interest.
Thus, the main idea is that any of the places that is located within the ellipse
could be added to the start-ending point of the visit, so we can select the one with
maximum interest. From the computational point of view, however, the complete
algorithm is not so straightforward are requires several steps to reach the optimal
solution.
In each step a new location is inserted and a new ellipse is designed using the
new locations as focus. The iterations continue finding a new ellipse and a new
location to be added until no more places can be inserted to the path because of the
time limit constraint (see the next picture).
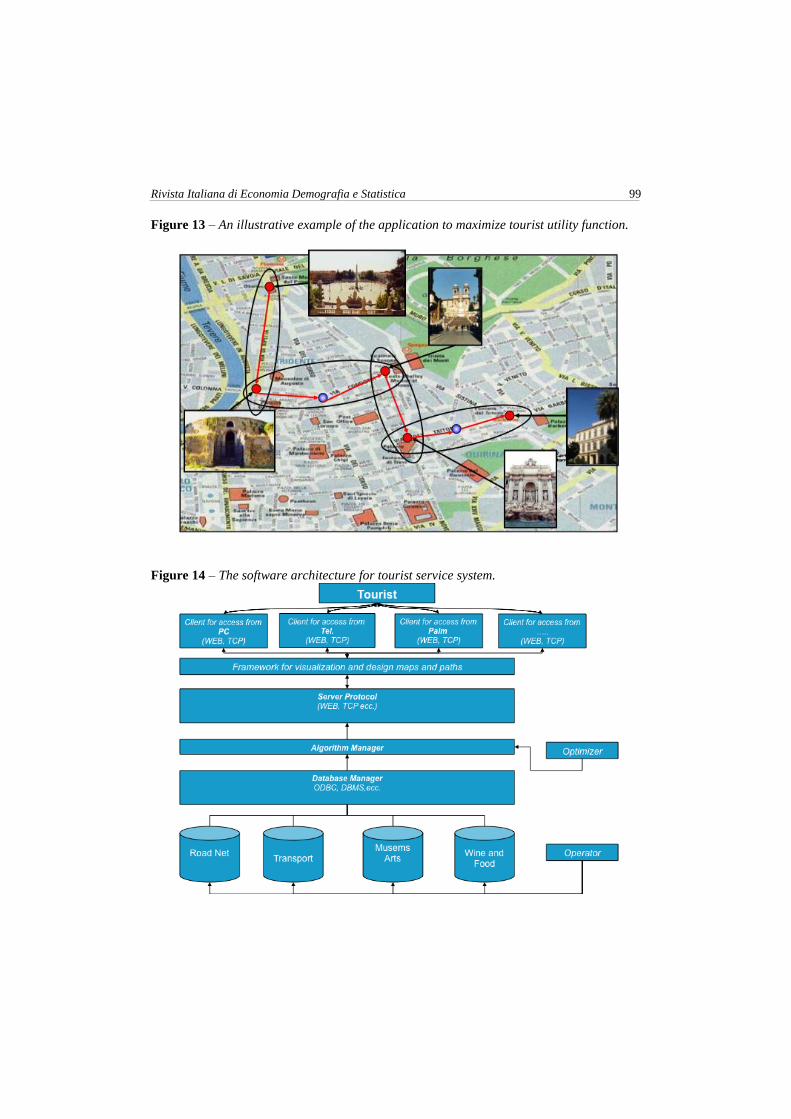
Although important, the optimization algorithm to furnish a practical service to
an end-user (tourist) requires a quite complex architecture. In the next figure we
present the basic components of a possible architecture.
It should be clear that a lot of data from different sources should be integrated
for the practical realization of this kind of service. For instance, time to visit
locations as museums or churches has to be known in advance and coordinated
with public services transportation availability and estimated travel times.
Similarly, with other services like restaurants, cafés, and shops open hours has to
be acquired.
Rivista Italiana di Economia Demografia e Statistica 99
Figure 13 ‒ An illustrative example of the application to maximize tourist utility function.
Figure 14 ‒ The software architecture for tourist service system.
100 Volume LXVI n. 2 Aprile-Giugno 2012
Acknowledgements
The author wish to thank Umberto Ferraro Petrillo, Nicoletta Ricciardi and
Gianni Storchi for their contribution in the tourist service system.
References
ALAMPI SOTTINI V., MARONE E., RICCIOLI F., SCOZZAFAVA G. 2008. Le
variazioni del territorio rurale e le diverse tipologie di imprenditore agricolo: un caso di
studio. Economia e Diritto Agroalimentare, Territorio e paesaggio agrario, Vol. XIII,
No.1, pp. 25-39, issn 1970-9498 (online), issn 1826-0373 (print), Firenze: University
Press.
CARAMIA M., DELL'OLMO P., 2008. Multi-Objective Management in Freight Logistics:
Increasing Capacity, Service Level and Safety with Optimization Algorithms. New York:
Springer.
CARAMIA M., RICCIARDI N., SCOZZARI A., STORCHI G. 1999. Tourist Flow
Organization in an Artistic Town. In: Computer in Urban Planning & Urban Management.
Milano: Franco Angeli.
CRAINIC T.G., RICCIARDI N., STORCHI G. 2009. Models for Evaluating and Planning
City Logistics Systems. Transportation Science, Vol. 43, No. 4, pp. 432-454.
BAITAA F., UKOVICH W. PESENTI R. FAVARETTO D. 1998. Dynamic routing-and-
inventory problems: a review. Transportation Research Part A: Policy and Practice.
Vol.32, Issue 8.
DANTZING G. B., TAMPA N. M. 1997. Linear Programming: Introduction. New York:
Springer.
DELL’OLMO P., SGALAMBRO A. 2011. The Spatially Equitable Capacitated
Multicommodity Network Flow Problem. Lecture Notes In Computer Science, Vol. 6701,
pp. 196-209.
GAREY M.R., JOHNSON D. 1979. Computers and Intractability: A Guide to the Theory
of NP-Completeness. New York: W. H. Freeman & Co.
GOLDEN B. RAGHAVAN; WASIL E. 2008. The Vehicle Routing Problem: Latest
Advances and New Challenges. Series: Operations Research/Computer Science
Interfaces Series, Vol. 43, New York: Springer.
JUENGER. M., LIEBLING. Th.M., NADDEF. D., NEMHAUSER G.L.,
PULLEYBLANK. W.R., REINELT. G., RINALDI. G., WOLSEY. L.A. 2010. 50 Years
of Integer Programming 1958-2008. The Early Years and State-of-the-Art Surveys. New
York: Springer.
MARCOTTE P., MERCIER A., SAVARD G., VERTER, V. 1998. Toll policies for
mitigating hazardous materials transport risk. Transportation Science, Vol. 43, No. 2, pp.
228–243.
TANIGUCHI E., THOMPSON R.G., YAMADA T., VAN DUIN R. 2001. City Logistics-
Network Modelling and Intelligent Transport Systems. Pergamon.
TOTH P., VIGO V. 2002. The Vehicle Routing Problem, SIAM.
WOLSEY L. A. 1998. Integer Programming. New York: Wiley.

Rivista Italiana di Economia Demografia e Statistica 101
SUMMARY
The evolution of optimization models supporting mobility policies and
territory development
The evolution of optimization techniques if often hidden in currently used decision
making systems and advisory tools that support decision making at policy level. No matter
how much system integration and availability of data pushed the innovation, in many cases,
like distribution logistic, no practical results could be achieved without the improvement in
algorithms design we have seen in the last decades. Such algorithms, integrated in a
Geographical Information System to support land development plans, or in a smartphone to
give personalized mobile services to tourists, make it possible to obtain answers to complex
decision problems in reasonable time, not because of computational power of the
processors, but for the efficiency of the solution methods. In the paper, we attempt to
follow the main steps of optimization algorithms giving some examples of their impact in
managing problems related to mobility and territory.
____________________
Paolo DELL’OLMO, Full Professor, Sapienza University of Rome, Department of
Statistical Sciences, [email protected]