Embed Size (px)
Citation preview
THE EUROPEAN CHEMICAL INDUSTRY Facts & Figures 2014
2
OverviewChemical Industry Profile
World chemicals sales: geographic breakdown 4
World chemicals sales by region 5
Chemicals sales by country: top 10 6
EU share in the global chemicals market 7
EU chemical industry sales by geographicbreakdown 8
World exports and imports of chemicals by regional shares 9
EU chemical industry sales by sectoral breakdown 10
EU chemical industry sales: structure by destination 11
EU chemical industry by sales structure 12
Contribution of the chemical industry to the EU economy 13
Energy
Fuel and power consumption in the EU chemical industry 33
Fuel and power consumption by source in the EU chemical industry 34
Energy intensity in the EU chemical industry 35
Energy intensity: chemicals vs total industry 36
Capital Spending
Capital spending in the EU chemical industry 38
Capital spending by region 39
Capital spending intensity by region 40
R&D Spending
R&D in the EU chemical industry 42
R&D spending by region 43
R&D spending intensity by region 44
Sustainable Development
Total greenhouse gas emissions in the EU chemical industry 46
Greenhouse gas emissions and production 47
Greenhouse gas emissions per unit of energy consumption and per unit of production 48
Acidifying emissions 49
Non-methane volatile organic compounds emissions to air 50
Emissions to water 51
Water quality-nitrogen and phosphorous emissions 52
Safety and health at work 53
International Trade
Extra-EU chemicals trade balance 15
Extra-EU chemicals trade by region (exports & imports) 16
Extra-EU chemicals trade flows with major geographic blocs 17
EU chemicals trade surplus: sectoral breakdown 18
EU chemicals trade surplus: sectoral and regional breakdown 19
EU chemicals trade surplus: 2012 vs 2013 20
Growth and Competitiveness
Production, trade and consumption growth 22
Chemicals growth performance against total manufacturing 23
EU chemicals production growth by sector 24
International comparison of production growth 25
Employment
Employment in the EU chemical industry 27
Labour cost per employee 28
Labour cost per employee: chemicals vs total manufacturing 29
Labour productivity 30
EU labour productivity: chemicals vs total manufacturing 31
3
World chemicals sales: geographic breakdown
World chemicals sales by region
World exports and imports of chemicals by regional shares
EU share of global chemicals market
EU chemical industry sales: structure by destination
Chemicals sales by country: top 10
EU chemical industry sales by sectoral breakdown
EU chemical industry sales by geographic breakdown
EU chemical industry by sales structure
Contribution of the chemical industry to the EU economy
Chemical Industry Profile
4
527
152
408
132
528
144
44
EURest of Europe*
103
1,047
China
Rest of Asia***
Japan
South Korea
Rest of the world
72India
NAFTA**
Latin America
Chemicals sales (€ billion)
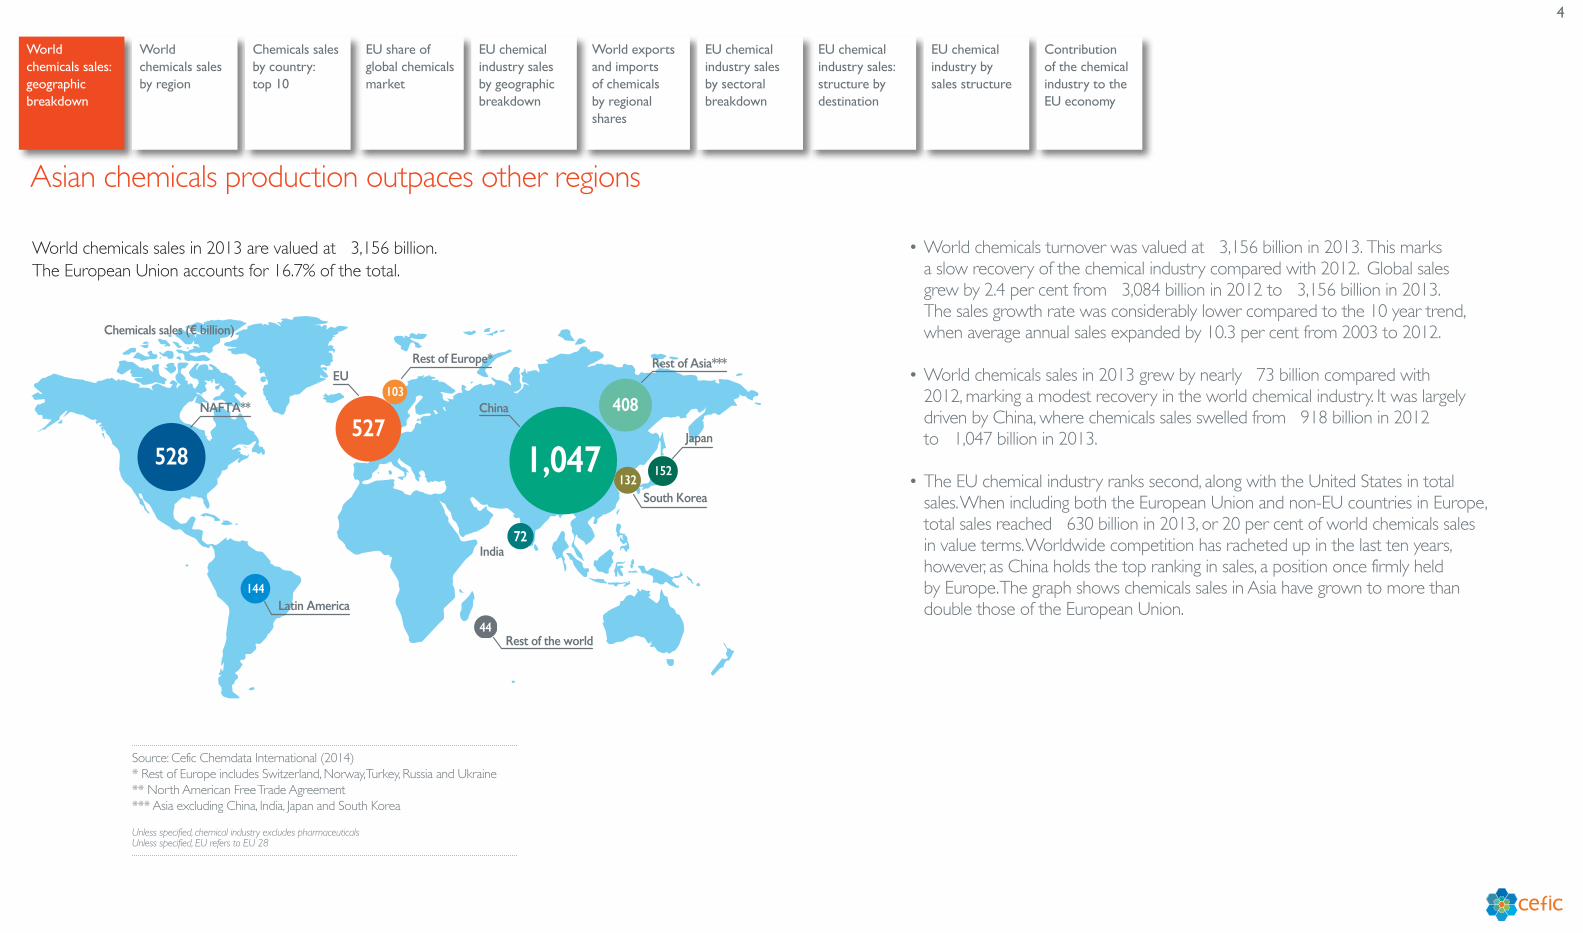
World chemicals sales in 2013 are valued at €3,156 billion.The European Union accounts for 16.7% of the total.
World chemicals sales: geographic breakdown
World chemicals sales by region
World exports and imports of chemicals by regional shares
EU share of global chemicals market
EU chemical industry sales: structure by destination
Chemicals sales by country: top 10
EU chemical industry sales by sectoral breakdown
EU chemical industry sales by geographic breakdown
EU chemical industry by sales structure
Contribution of the chemical industry to the EU economy
• World chemicals turnover was valued at €3,156 billion in 2013. This marks a slow recovery of the chemical industry compared with 2012. Global sales grew by 2.4 per cent from €3,084 billion in 2012 to €3,156 billion in 2013. The sales growth rate was considerably lower compared to the 10 year trend, when average annual sales expanded by 10.3 per cent from 2003 to 2012.
• World chemicals sales in 2013 grew by nearly €73 billion compared with 2012, marking a modest recovery in the world chemical industry. It was largely driven by China, where chemicals sales swelled from €918 billion in 2012 to €1,047 billion in 2013.
• The EU chemical industry ranks second, along with the United States in total sales. When including both the European Union and non-EU countries in Europe, total sales reached €630 billion in 2013, or 20 per cent of world chemicals sales in value terms. Worldwide competition has racheted up in the last ten years, however, as China holds the top ranking in sales, a position once firmly held by Europe. The graph shows chemicals sales in Asia have grown to more than double those of the European Union.
Asian chemicals production outpaces other regions
Source: Cefic Chemdata International (2014)* Rest of Europe includes Switzerland, Norway, Turkey, Russia and Ukraine** North American Free Trade Agreement*** Asia excluding China, India, Japan and South Korea
Unless specified, chemical industry excludes pharmaceuticals Unless specified, EU refers to EU 28
5
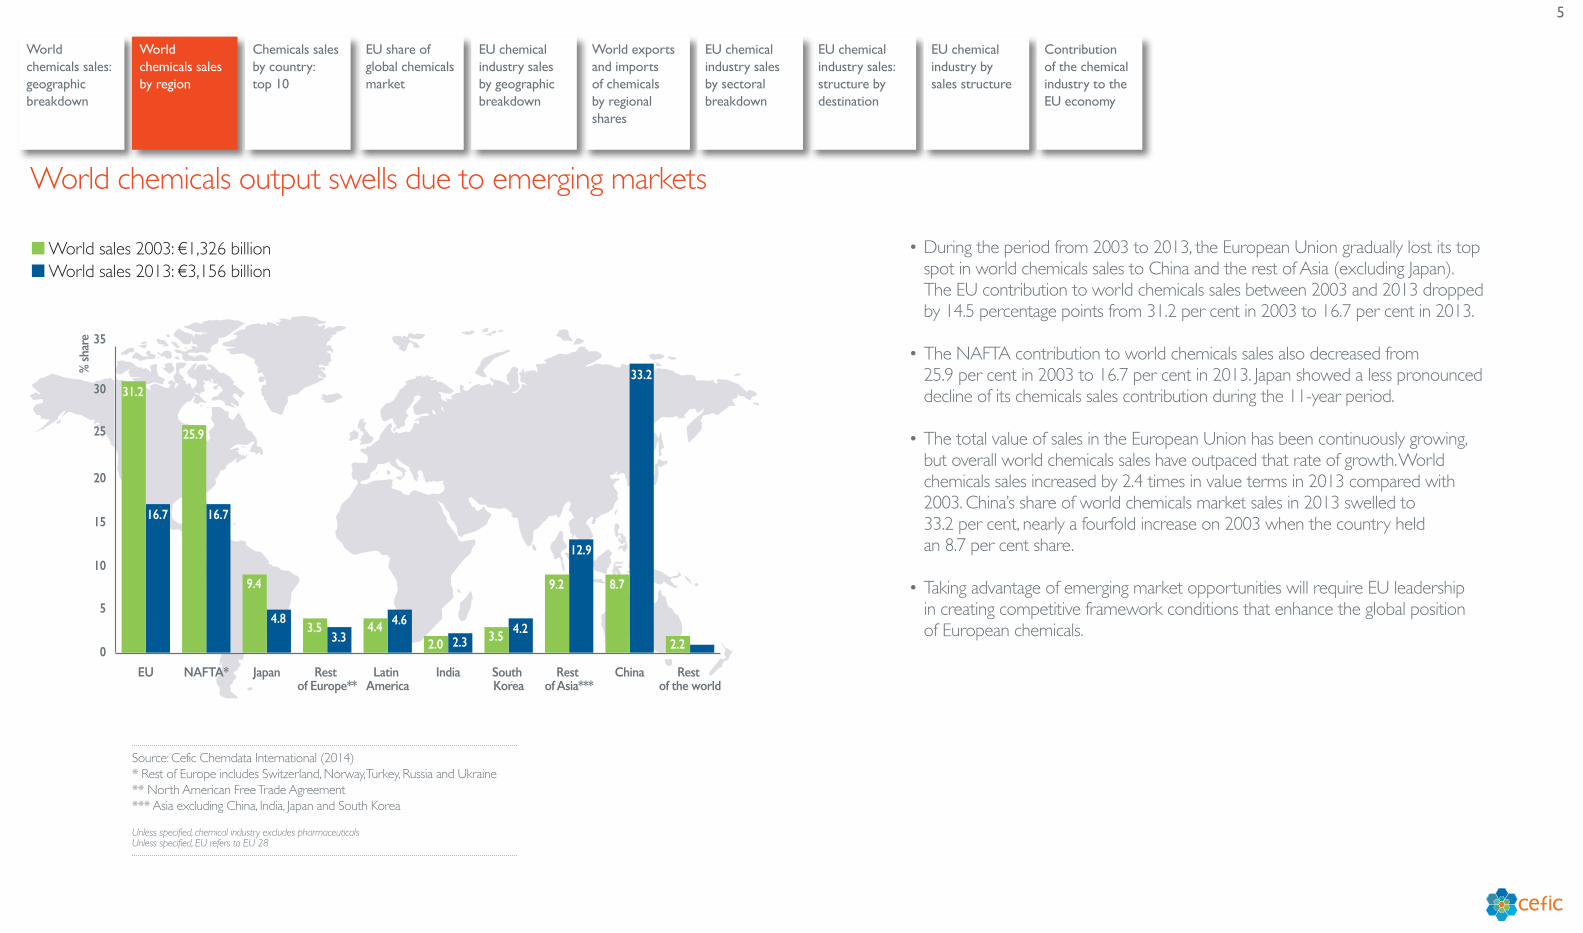
� World sales 2003: €1,326 billion� World sales 2013: €3,156 billion
% sh
are
0
5
10
15
20
25
30
35
Rest of the world
ChinaRest of Asia***
South Korea
IndiaLatin America
Rest of Europe**
JapanNAFTA*EU
31.2
16.7
25.9
16.7
9.4
4.83.5
3.34.4 4.6
2.0 2.3 3.5 4.2
9.2
12.9
8.7
33.2
2.2 1.4
• During the period from 2003 to 2013, the European Union gradually lost its top spot in world chemicals sales to China and the rest of Asia (excluding Japan). The EU contribution to world chemicals sales between 2003 and 2013 dropped by 14.5 percentage points from 31.2 per cent in 2003 to 16.7 per cent in 2013.
• The NAFTA contribution to world chemicals sales also decreased from 25.9 per cent in 2003 to 16.7 per cent in 2013. Japan showed a less pronounced decline of its chemicals sales contribution during the 11-year period.
• The total value of sales in the European Union has been continuously growing, but overall world chemicals sales have outpaced that rate of growth. World chemicals sales increased by 2.4 times in value terms in 2013 compared with 2003. China’s share of world chemicals market sales in 2013 swelled to 33.2 per cent, nearly a fourfold increase on 2003 when the country held an 8.7 per cent share.
• Taking advantage of emerging market opportunities will require EU leadership in creating competitive framework conditions that enhance the global position of European chemicals.
World chemicals output swells due to emerging markets
World chemicals sales: geographic breakdown
World chemicals sales by region
World exports and imports of chemicals by regional shares
EU share of global chemicals market
EU chemical industry sales: structure by destination
Chemicals sales by country: top 10
EU chemical industry sales by sectoral breakdown
EU chemical industry sales by geographic breakdown
EU chemical industry by sales structure
Contribution of the chemical industry to the EU economy
Source: Cefic Chemdata International (2014)* Rest of Europe includes Switzerland, Norway, Turkey, Russia and Ukraine** North American Free Trade Agreement*** Asia excluding China, India, Japan and South Korea
Unless specified, chemical industry excludes pharmaceuticals Unless specified, EU refers to EU 28
6
Che
mica
ls sa
les 2
013
(€ b
illio
n)
0
100
200
300
400
500
600
700
800
900
1000
1100
RussiaTaiwanBrazilIndiaFranceSouth Korea
GermanyJapanUSAChina
1,047.3
151.6
465.7
132.178.4
149.7
72.2 70.2 62.9 56.1
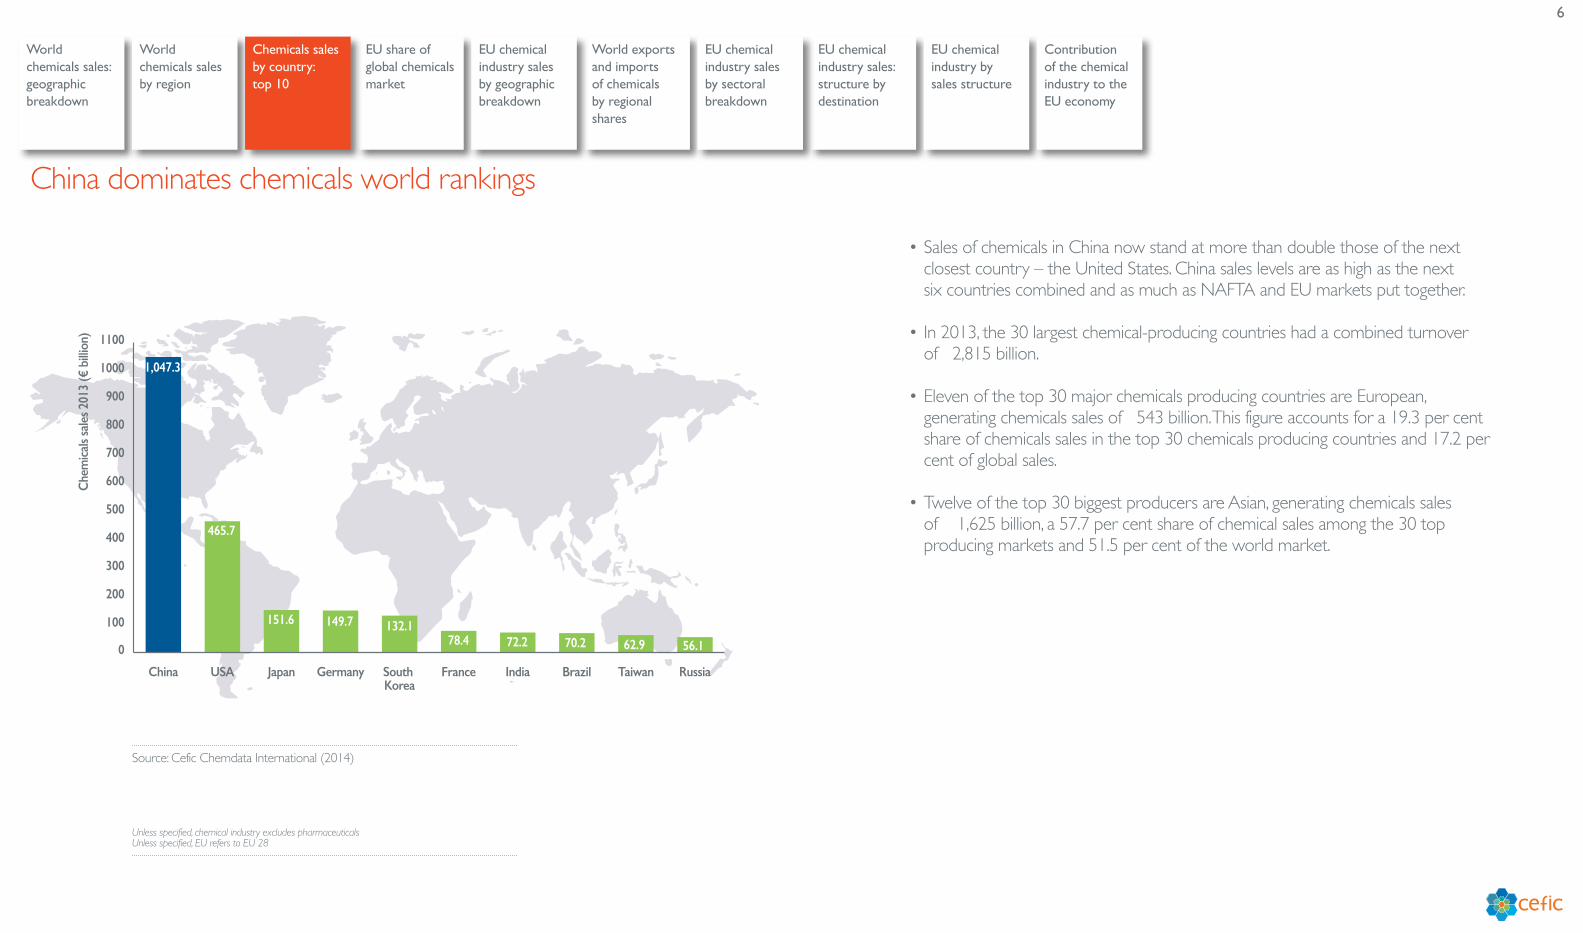
• Sales of chemicals in China now stand at more than double those of the next closest country – the United States. China sales levels are as high as the next six countries combined and as much as NAFTA and EU markets put together.
• In 2013, the 30 largest chemical-producing countries had a combined turnover of €2,815 billion.
• Eleven of the top 30 major chemicals producing countries are European, generating chemicals sales of €543 billion. This figure accounts for a 19.3 per cent share of chemicals sales in the top 30 chemicals producing countries and 17.2 per cent of global sales.
• Twelve of the top 30 biggest producers are Asian, generating chemicals sales
of € 1,625 billion, a 57.7 per cent share of chemical sales among the 30 top producing markets and 51.5 per cent of the world market.
China dominates chemicals world rankings
World chemicals sales: geographic breakdown
World chemicals sales by region
World exports and imports of chemicals by regional shares
EU share of global chemicals market
EU chemical industry sales: structure by destination
Chemicals sales by country: top 10
EU chemical industry sales by sectoral breakdown
EU chemical industry sales by geographic breakdown
EU chemical industry by sales structure
Contribution of the chemical industry to the EU economy
Source: Cefic Chemdata International (2014)
Unless specified, chemical industry excludes pharmaceuticals Unless specified, EU refers to EU 28
7
€ bi
llion %
0
50
100
150
200
250
300
350
400
450
500
550
600
201320092005200119971993
40
35
30
25
20
15
10
5
0
282
362
31.6%
16.7%
421457
422
527
� EU chemicals sales (€ billion)� World share (%)
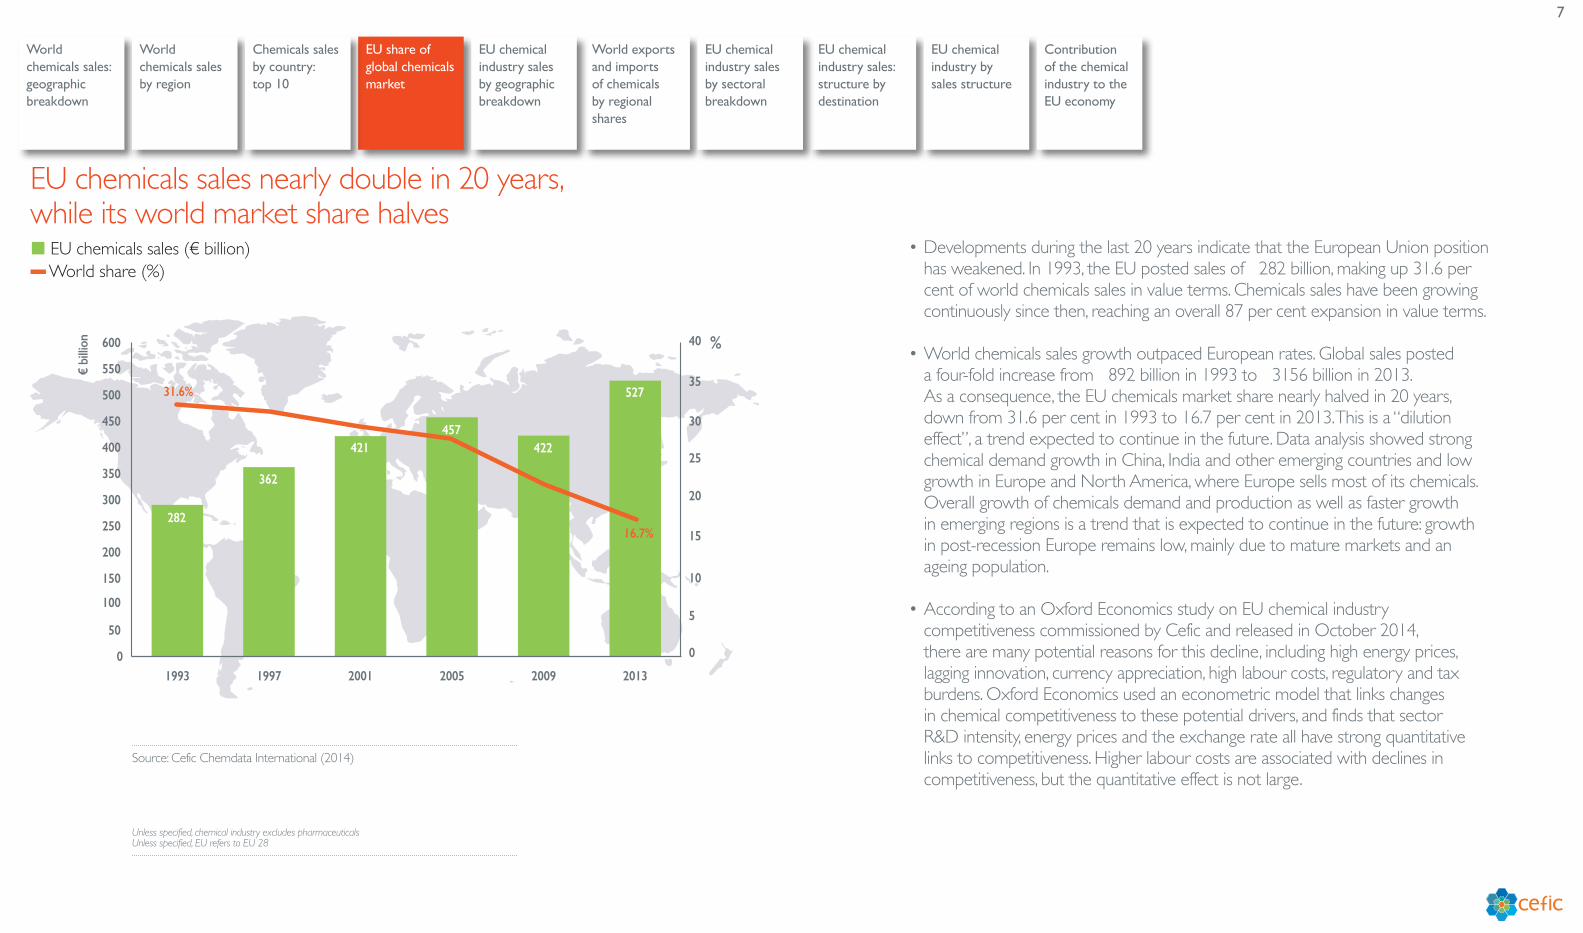
• Developments during the last 20 years indicate that the European Union position has weakened. In 1993, the EU posted sales of €282 billion, making up 31.6 per cent of world chemicals sales in value terms. Chemicals sales have been growing continuously since then, reaching an overall 87 per cent expansion in value terms.
• World chemicals sales growth outpaced European rates. Global sales posted a four-fold increase from €892 billion in 1993 to €3156 billion in 2013. As a consequence, the EU chemicals market share nearly halved in 20 years, down from 31.6 per cent in 1993 to 16.7 per cent in 2013. This is a “dilution effect”, a trend expected to continue in the future. Data analysis showed strong chemical demand growth in China, India and other emerging countries and low growth in Europe and North America, where Europe sells most of its chemicals. Overall growth of chemicals demand and production as well as faster growth in emerging regions is a trend that is expected to continue in the future: growth in post-recession Europe remains low, mainly due to mature markets and an ageing population.
• According to an Oxford Economics study on EU chemical industry competitiveness commissioned by Cefic and released in October 2014, there are many potential reasons for this decline, including high energy prices, lagging innovation, currency appreciation, high labour costs, regulatory and tax burdens. Oxford Economics used an econometric model that links changes in chemical competitiveness to these potential drivers, and finds that sector R&D intensity, energy prices and the exchange rate all have strong quantitative links to competitiveness. Higher labour costs are associated with declines in competitiveness, but the quantitative effect is not large.
EU chemicals sales nearly double in 20 years, while its world market share halves
World chemicals sales: geographic breakdown
World chemicals sales by region
World exports and imports of chemicals by regional shares
EU share of global chemicals market
EU chemical industry sales: structure by destination
Chemicals sales by country: top 10
EU chemical industry sales by sectoral breakdown
EU chemical industry sales by geographic breakdown
EU chemical industry by sales structure
Contribution of the chemical industry to the EU economy
Source: Cefic Chemdata International (2014)
Unless specified, chemical industry excludes pharmaceuticals Unless specified, EU refers to EU 28
8
DE28.4
FR14.9
IT9.6
ES7.4NL
9.6
BE6.9
UK6.8
Others16.4
IE0.9
SE1.8
PL2.8AT
2.6
CZ1.3
FI1.5
HU1.1
PT0.9
Others3.5
share %
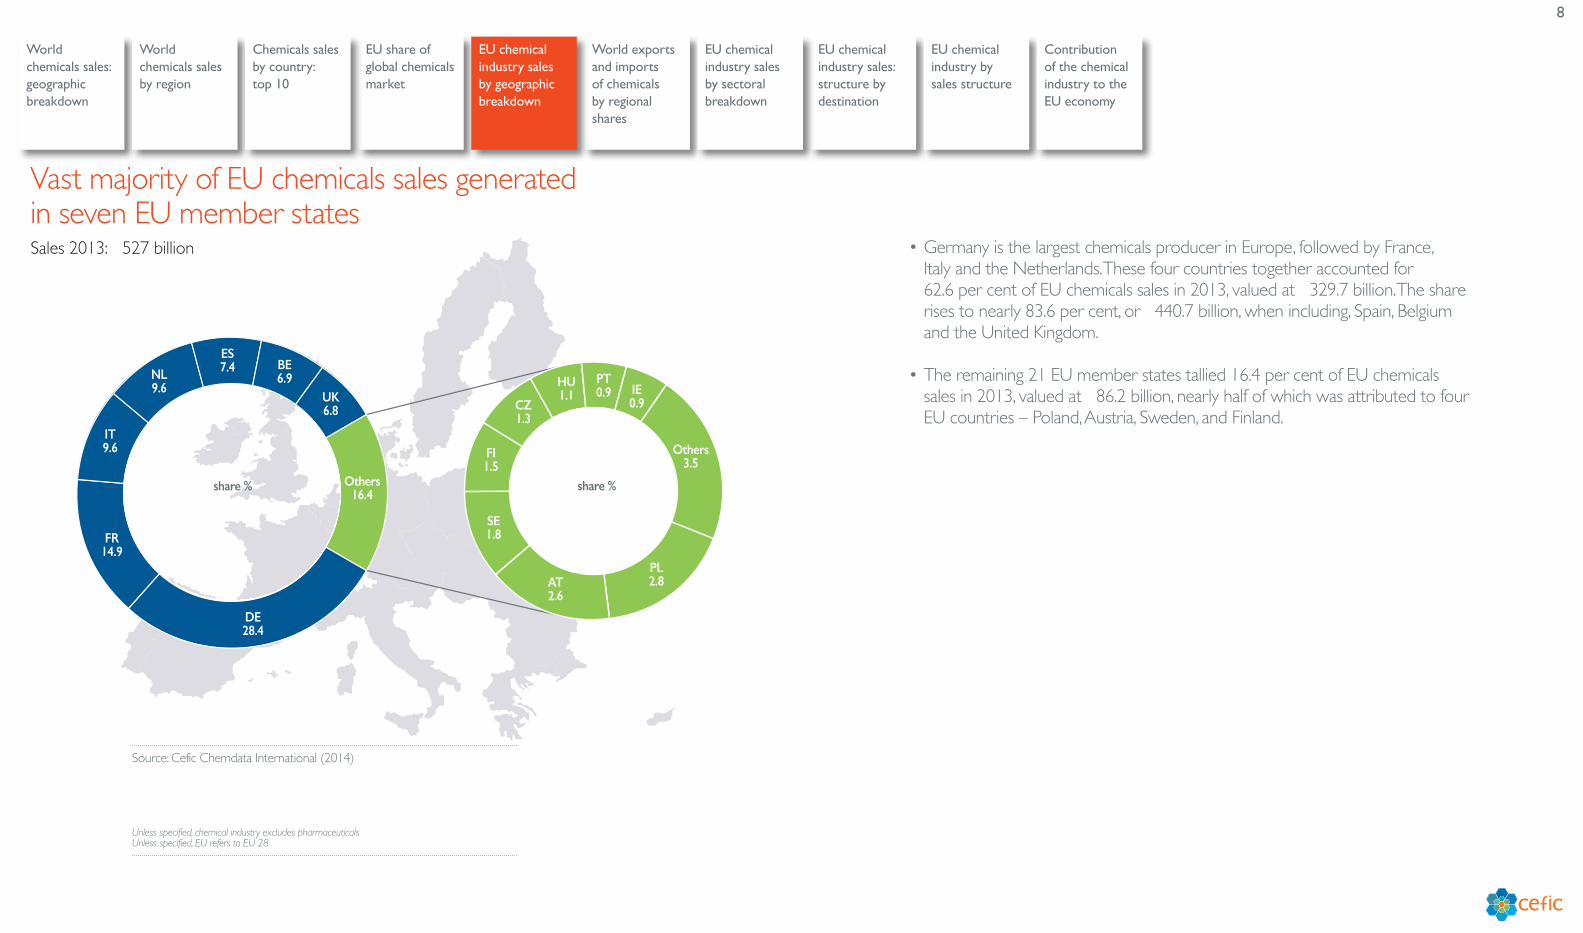
Sales 2013: €527 billion
share %
• Germany is the largest chemicals producer in Europe, followed by France, Italy and the Netherlands. These four countries together accounted for 62.6 per cent of EU chemicals sales in 2013, valued at €329.7 billion. The share rises to nearly 83.6 per cent, or €440.7 billion, when including, Spain, Belgium and the United Kingdom.
• The remaining 21 EU member states tallied 16.4 per cent of EU chemicals sales in 2013, valued at €86.2 billion, nearly half of which was attributed to four EU countries – Poland, Austria, Sweden, and Finland.
Vast majority of EU chemicals sales generated in seven EU member states
World chemicals sales: geographic breakdown
World chemicals sales by region
World exports and imports of chemicals by regional shares
EU share of global chemicals market
EU chemical industry sales: structure by destination
Chemicals sales by country: top 10
EU chemical industry sales by sectoral breakdown
EU chemical industry sales by geographic breakdown
EU chemical industry by sales structure
Contribution of the chemical industry to the EU economy
Source: Cefic Chemdata International (2014)
Unless specified, chemical industry excludes pharmaceuticals Unless specified, EU refers to EU 28
9
35.0
37.4
42.5
35.313.6
11.8 4.6
6.1
5.9
2.4
Asia
NAFTA*
Rest of Europe**
Latin America
EU
1.9
3.5
Africa & Oceania
� World exports of chemicals 2013 in %� World imports of chemicals 2013 in %
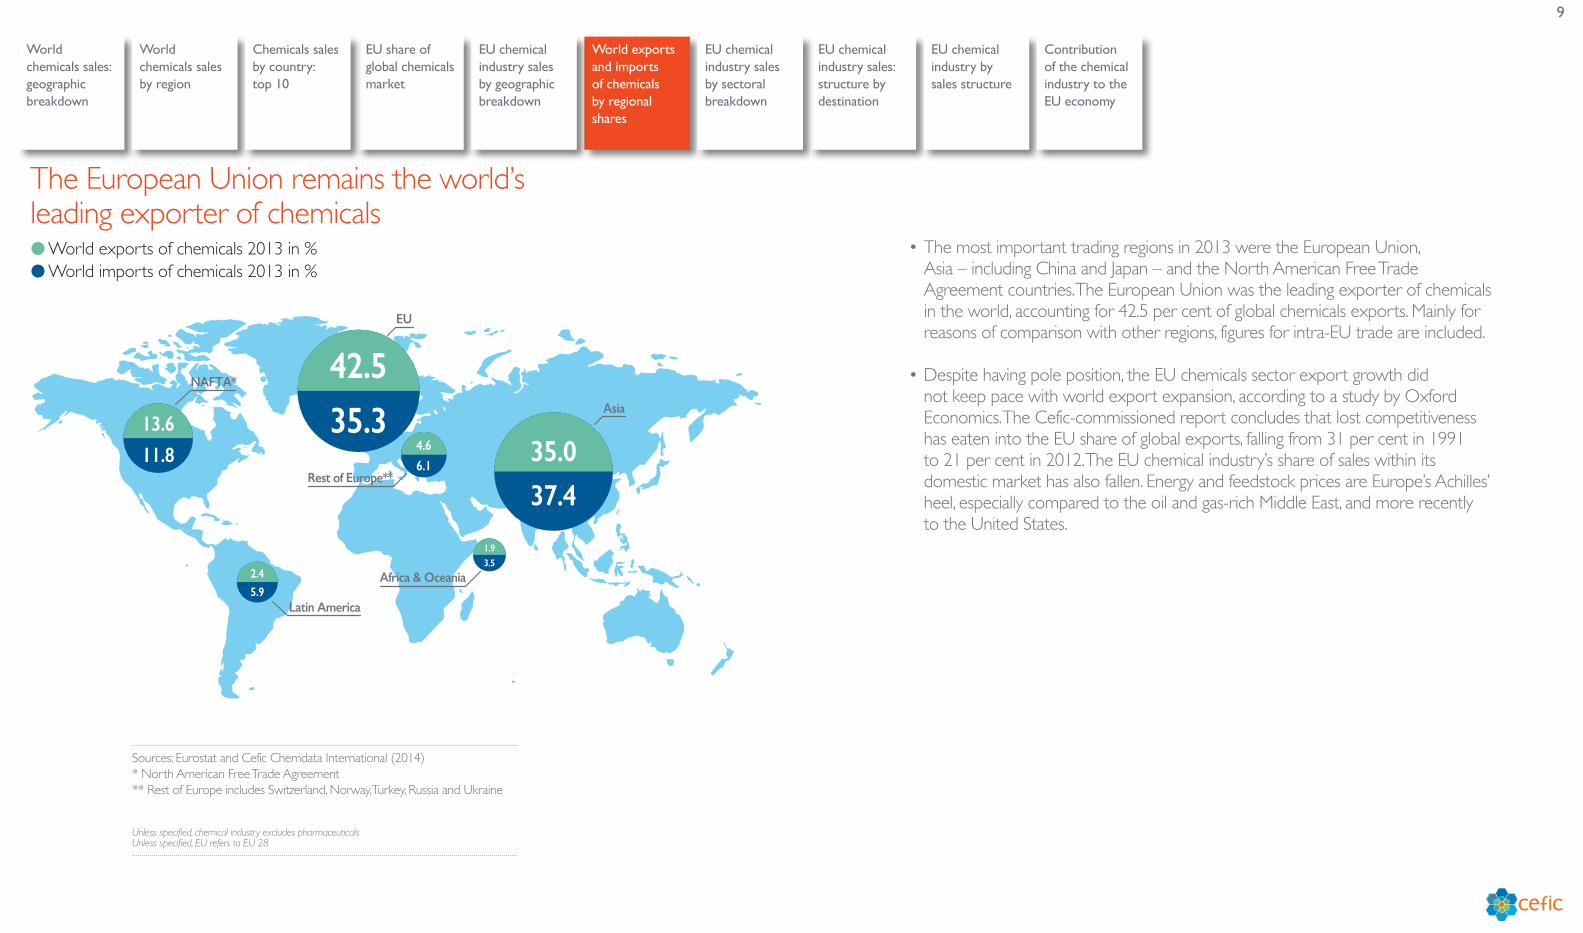
• The most important trading regions in 2013 were the European Union, Asia – including China and Japan – and the North American Free Trade Agreement countries. The European Union was the leading exporter of chemicals in the world, accounting for 42.5 per cent of global chemicals exports. Mainly for reasons of comparison with other regions, figures for intra-EU trade are included.
• Despite having pole position, the EU chemicals sector export growth did not keep pace with world export expansion, according to a study by Oxford Economics. The Cefic-commissioned report concludes that lost competitiveness has eaten into the EU share of global exports, falling from 31 per cent in 1991 to 21 per cent in 2012. The EU chemical industry’s share of sales within its domestic market has also fallen. Energy and feedstock prices are Europe’s Achilles’ heel, especially compared to the oil and gas-rich Middle East, and more recently to the United States.
The European Union remains the world’s leading exporter of chemicals
World chemicals sales: geographic breakdown
World chemicals sales by region
World exports and imports of chemicals by regional shares
EU share of global chemicals market
EU chemical industry sales: structure by destination
Chemicals sales by country: top 10
EU chemical industry sales by sectoral breakdown
EU chemical industry sales by geographic breakdown
EU chemical industry by sales structure
Contribution of the chemical industry to the EU economy
Sources: Eurostat and Cefic Chemdata International (2014)* North American Free Trade Agreement** Rest of Europe includes Switzerland, Norway, Turkey, Russia and Ukraine
Unless specified, chemical industry excludes pharmaceuticals Unless specified, EU refers to EU 28
10
Consumer chemicals 11.7%
Petrochemicals 26.6%
Other inorganics
Industrial gases
Fertilizers
PlasticsSynthetic rubberMan-made fibres
Basic inorganics 13.7%
Polymers 21.5%Auxiliaries for industryPaints & inksCrop protection
Dyes & pigments
Speciality 26.5%
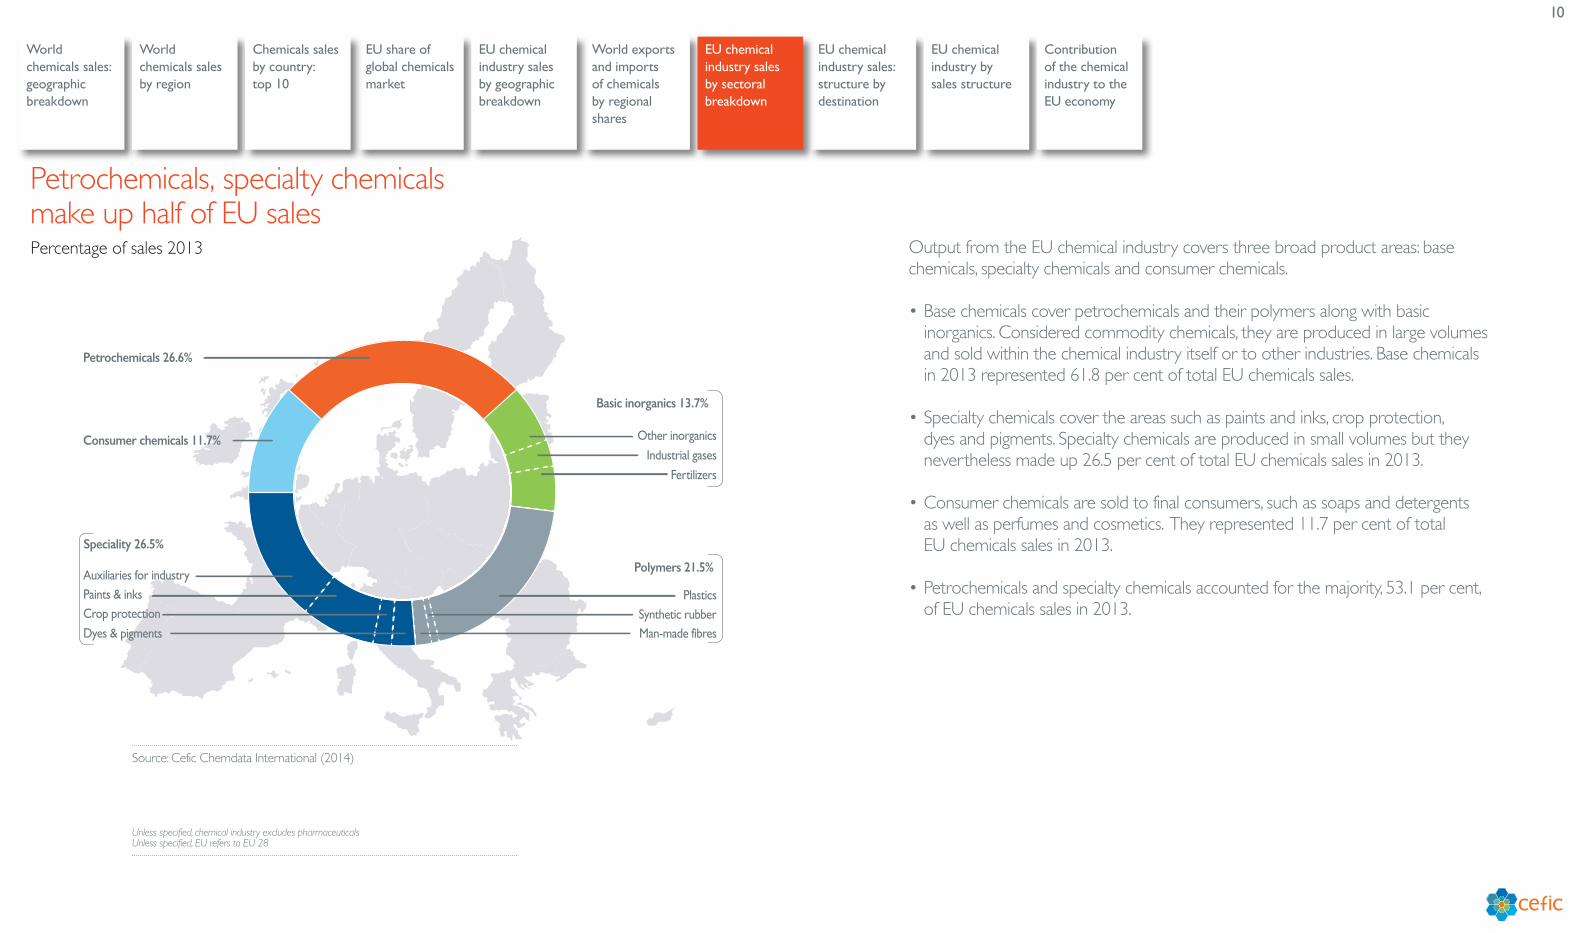
Percentage of sales 2013 Output from the EU chemical industry covers three broad product areas: base chemicals, specialty chemicals and consumer chemicals.
• Base chemicals cover petrochemicals and their polymers along with basic inorganics. Considered commodity chemicals, they are produced in large volumes and sold within the chemical industry itself or to other industries. Base chemicals in 2013 represented 61.8 per cent of total EU chemicals sales.
• Specialty chemicals cover the areas such as paints and inks, crop protection, dyes and pigments. Specialty chemicals are produced in small volumes but they nevertheless made up 26.5 per cent of total EU chemicals sales in 2013.
• Consumer chemicals are sold to final consumers, such as soaps and detergents as well as perfumes and cosmetics. They represented 11.7 per cent of total EU chemicals sales in 2013.
• Petrochemicals and specialty chemicals accounted for the majority, 53.1 per cent, of EU chemicals sales in 2013.
Petrochemicals, specialty chemicals make up half of EU sales
World chemicals sales: geographic breakdown
World chemicals sales by region
World exports and imports of chemicals by regional shares
EU share of global chemicals market
EU chemical industry sales: structure by destination
Chemicals sales by country: top 10
EU chemical industry sales by sectoral breakdown
EU chemical industry sales by geographic breakdown
EU chemical industry by sales structure
Contribution of the chemical industry to the EU economy
Source: Cefic Chemdata International (2014)
Unless specified, chemical industry excludes pharmaceuticals Unless specified, EU refers to EU 28
11
� Extra-EU exports� Intra-EU exports � Home sales
€ bi
llion
0
50
100
150
200
250
300
350
400
450
500
550
600
20132012201120102009200820072006200520042003
151
183
80
151
199
86
143
222
92
158
245
102
157
261
106
156
266
109
104
215
103
118
257
123
126
290
133
98
294
143
96
292
139
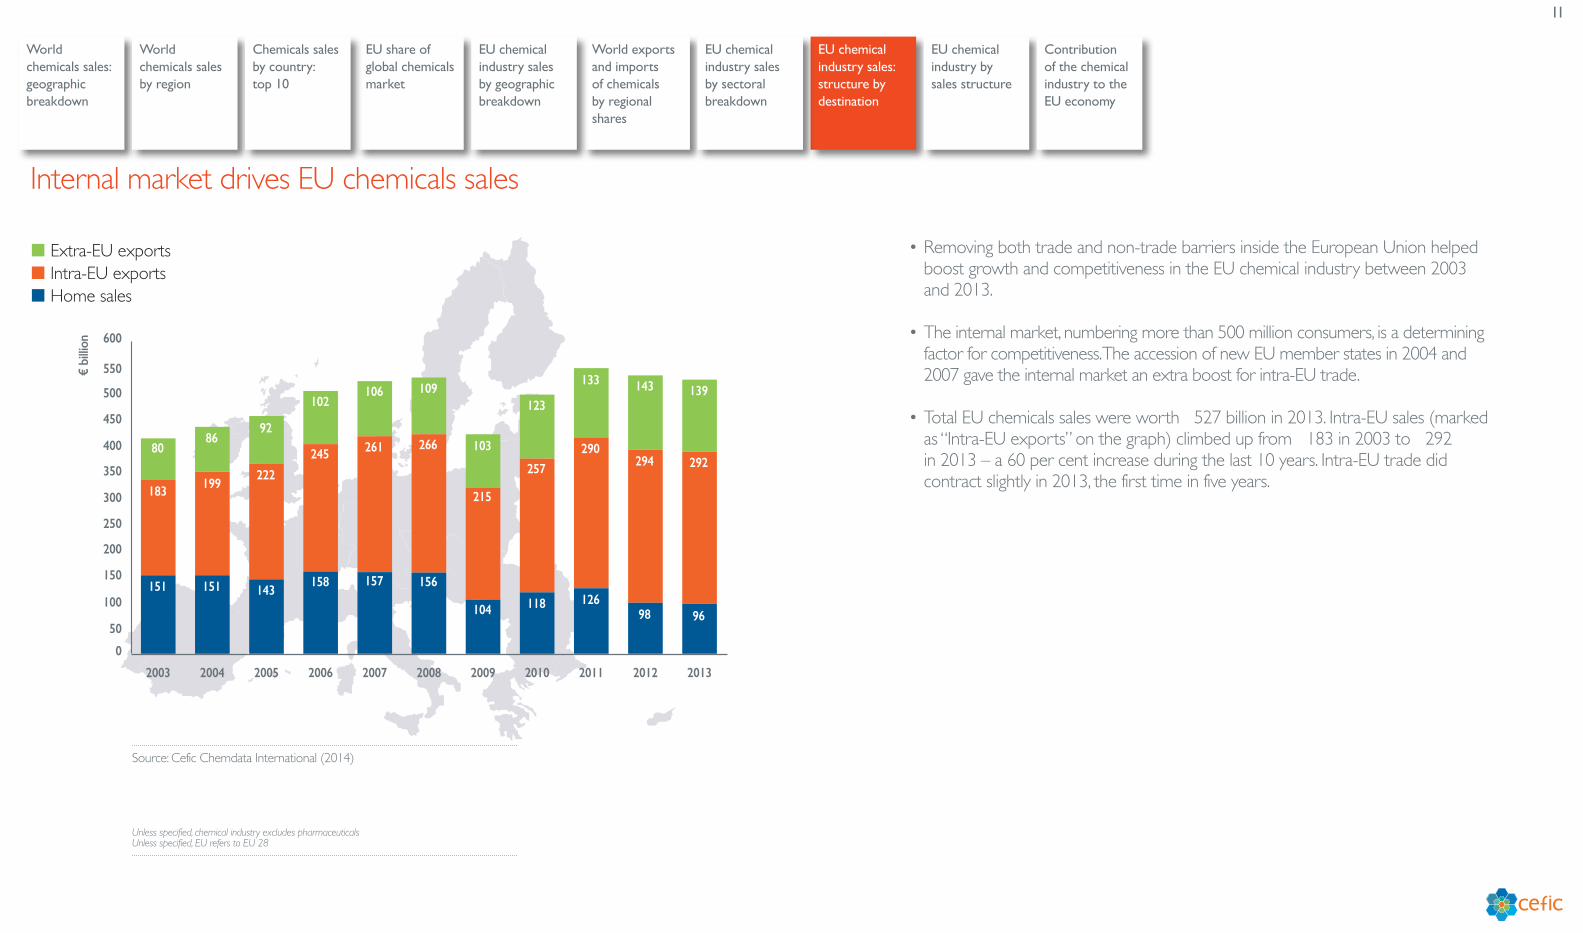
• Removing both trade and non-trade barriers inside the European Union helped boost growth and competitiveness in the EU chemical industry between 2003 and 2013.
• The internal market, numbering more than 500 million consumers, is a determining factor for competitiveness. The accession of new EU member states in 2004 and 2007 gave the internal market an extra boost for intra-EU trade.
• Total EU chemicals sales were worth €527 billion in 2013. Intra-EU sales (marked as “Intra-EU exports” on the graph) climbed up from €183 in 2003 to €292 in 2013 – a 60 per cent increase during the last 10 years. Intra-EU trade did contract slightly in 2013, the first time in five years.
Internal market drives EU chemicals sales
World chemicals sales: geographic breakdown
World chemicals sales by region
World exports and imports of chemicals by regional shares
EU share of global chemicals market
EU chemical industry sales: structure by destination
Chemicals sales by country: top 10
EU chemical industry sales by sectoral breakdown
EU chemical industry sales by geographic breakdown
EU chemical industry by sales structure
Contribution of the chemical industry to the EU economy
Source: Cefic Chemdata International (2014)
Unless specified, chemical industry excludes pharmaceuticals Unless specified, EU refers to EU 28
12
� Extra-EU exports� Intra-EU exports* � Home sales
Sales 2003: €413 billion
Sales 2013: €527 billion
44
37
19
55
18
26
share % share %
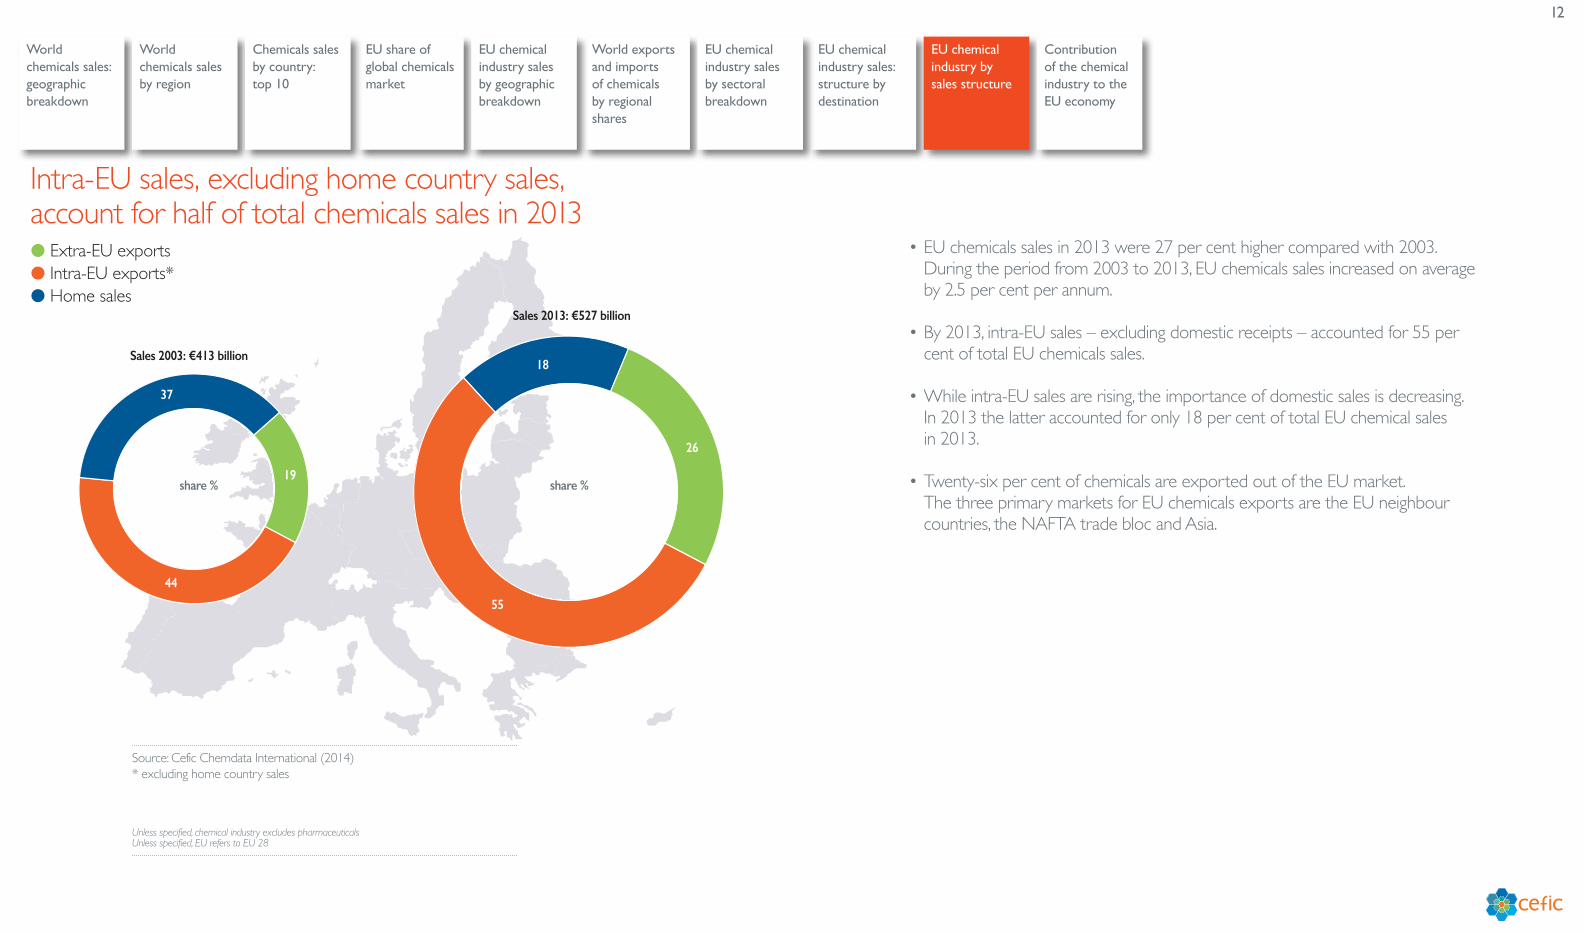
• EU chemicals sales in 2013 were 27 per cent higher compared with 2003. During the period from 2003 to 2013, EU chemicals sales increased on average by 2.5 per cent per annum.
• By 2013, intra-EU sales – excluding domestic receipts – accounted for 55 per cent of total EU chemicals sales.
• While intra-EU sales are rising, the importance of domestic sales is decreasing. In 2013 the latter accounted for only 18 per cent of total EU chemical sales in 2013.
• Twenty-six per cent of chemicals are exported out of the EU market. The three primary markets for EU chemicals exports are the EU neighbour countries, the NAFTA trade bloc and Asia.
Intra-EU sales, excluding home country sales, account for half of total chemicals sales in 2013
World chemicals sales: geographic breakdown
World chemicals sales by region
World exports and imports of chemicals by regional shares
EU share of global chemicals market
EU chemical industry sales: structure by destination
Chemicals sales by country: top 10
EU chemical industry sales by sectoral breakdown
EU chemical industry sales by geographic breakdown
EU chemical industry by sales structure
Contribution of the chemical industry to the EU economy
Source: Cefic Chemdata International (2014) * excluding home country sales
Unless specified, chemical industry excludes pharmaceuticals Unless specified, EU refers to EU 28
13
Percentage of output consumed by customer sector
100
90
80
70
60
50
40
30
20
10
0
Other business activities 7.4%
Furniture 2.1%
Electrical machinery and apparatus 2.2%
Publishing and printing 2.3%
Wood 2.6%
Food and beverages 2.6%
Machinery and equipment 2.8%
Fabricated metal products 3.1%
Other non-metallic mineral products 3.1%
Textiles 3.2%
Basic metals 4.3%
Automotive 4.3%
Pulp and paper 4.6%
Service 4.9%
Wholesales and retail trade 5.1%
Other manufacturing 5.4%
Agriculture 7.0%
Construction 7.9%
Health and social work 11.2%
Rubber and plastics 13.9%
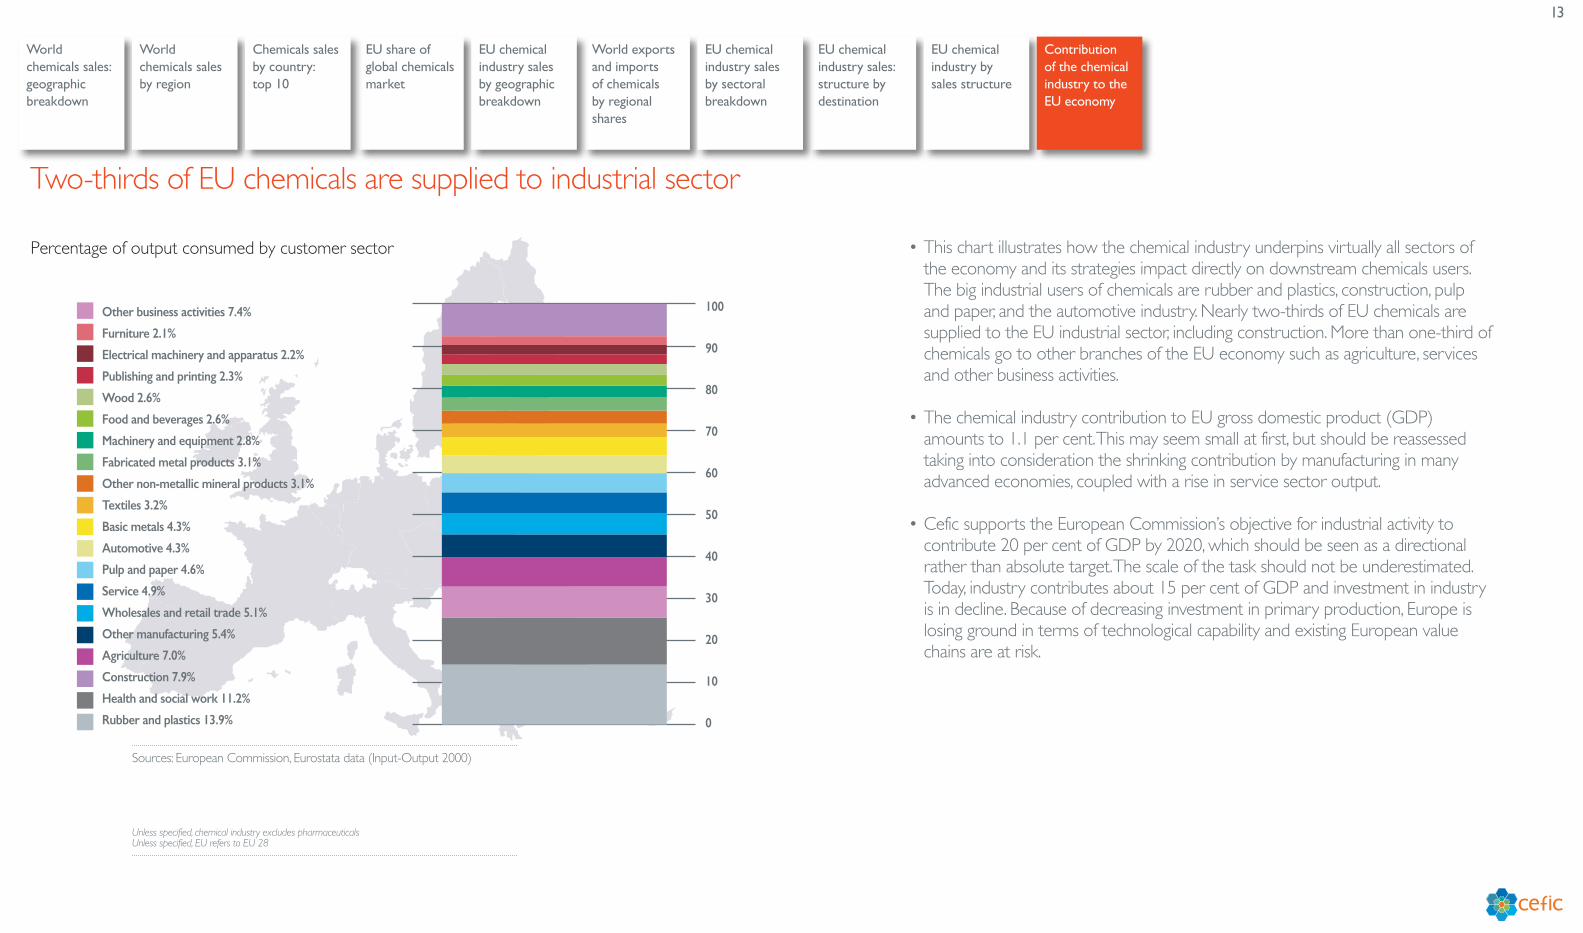
• This chart illustrates how the chemical industry underpins virtually all sectors of the economy and its strategies impact directly on downstream chemicals users. The big industrial users of chemicals are rubber and plastics, construction, pulp and paper, and the automotive industry. Nearly two-thirds of EU chemicals are supplied to the EU industrial sector, including construction. More than one-third of chemicals go to other branches of the EU economy such as agriculture, services and other business activities.
• The chemical industry contribution to EU gross domestic product (GDP) amounts to 1.1 per cent. This may seem small at first, but should be reassessed taking into consideration the shrinking contribution by manufacturing in many advanced economies, coupled with a rise in service sector output.
• Cefic supports the European Commission’s objective for industrial activity to contribute 20 per cent of GDP by 2020, which should be seen as a directional rather than absolute target. The scale of the task should not be underestimated. Today, industry contributes about 15 per cent of GDP and investment in industry is in decline. Because of decreasing investment in primary production, Europe is losing ground in terms of technological capability and existing European value chains are at risk.
Two-thirds of EU chemicals are supplied to industrial sector
World chemicals sales: geographic breakdown
World chemicals sales by region
World exports and imports of chemicals by regional shares
EU share of global chemicals market
EU chemical industry sales: structure by destination
Chemicals sales by country: top 10
EU chemical industry sales by sectoral breakdown
EU chemical industry sales by geographic breakdown
EU chemical industry by sales structure
Contribution of the chemical industry to the EU economy
Sources: European Commission, Eurostata data (Input-Output 2000)
Unless specified, chemical industry excludes pharmaceuticals Unless specified, EU refers to EU 28
14
Extra-EU chemicals trade balance
Extra-EU chemicals trade by region (exports & imports)
EU chemicals trade surplus: 2012 vs 2013
EU chemicals trade surplus: sectoral breakdown
Extra-EU chemicals trade flows with major geographic blocs
EU chemicals trade surplus: sectoral and regional breakdown
International Trade
15
Extra-EU chemicals trade balance
Extra-EU chemicals trade by region (exports & imports)
EU chemicals trade surplus: 2012 vs 2013
EU chemicals trade surplus: sectoral breakdown
Extra-EU chemicals trade flows with major geographic blocs
EU chemicals trade surplus: sectoral and regional breakdown
� Extra-EU trade balance� Extra-EU imports � Extra-EU exports
010
20
30
4050
60
70
8090
100
110
120
130140
150
20132012201120102009200820072006200520042003
Extr
a-EU
trad
e flo
ws:
chem
icals
(€ b
illio
n)
29.2 31.6 31.635.4
31.5 30.0
41.8 42.8 39.947.8 48.7
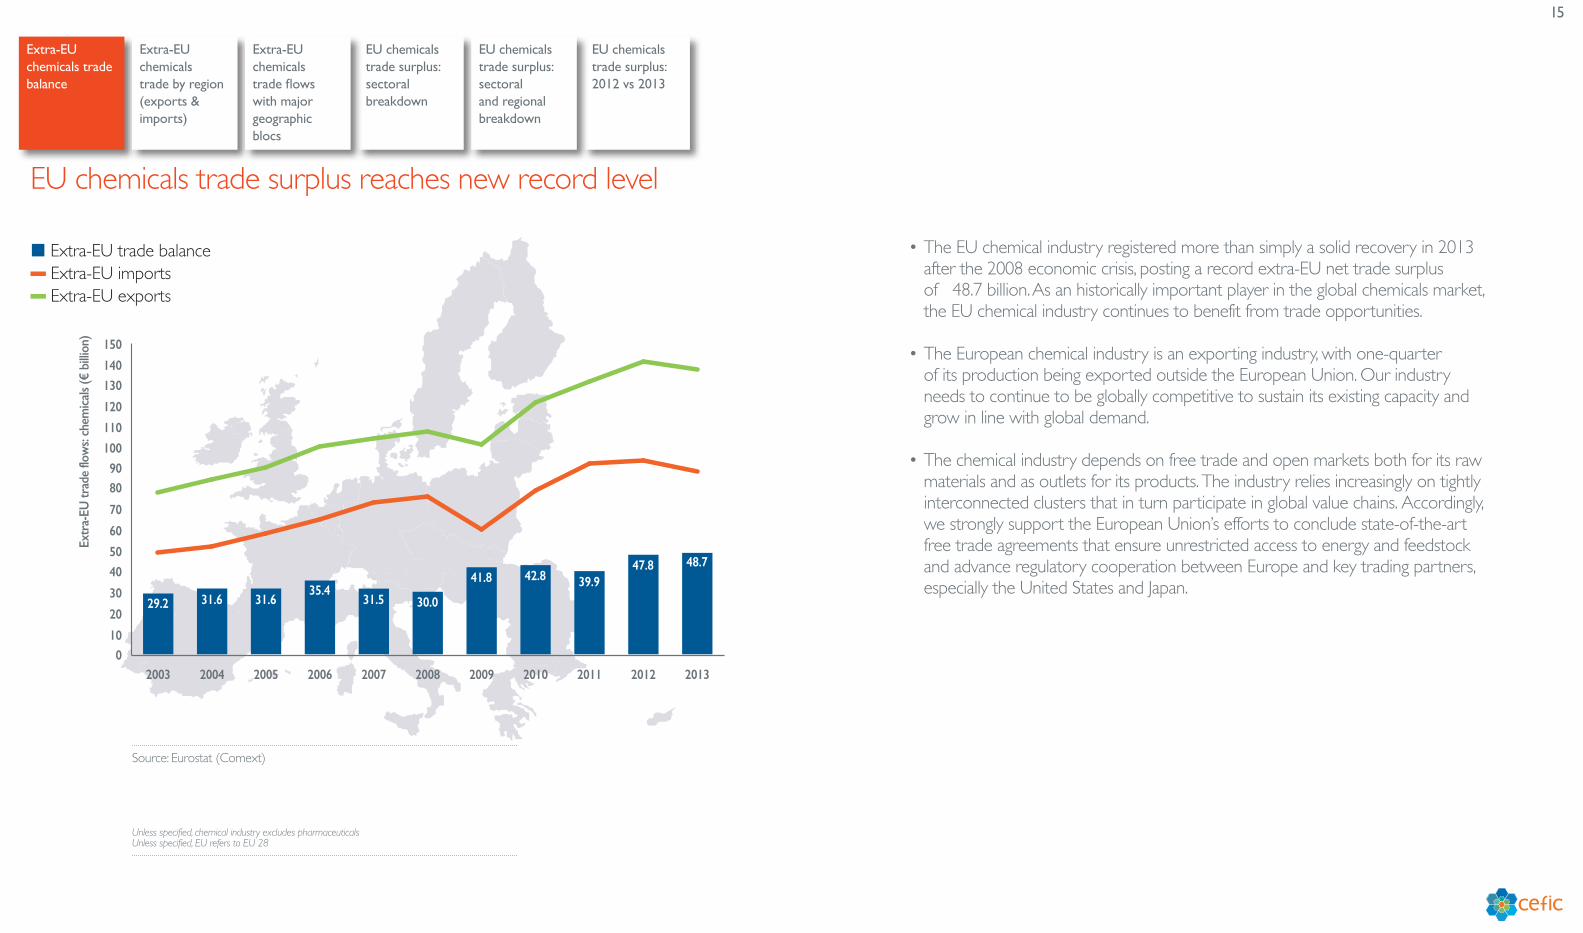
• The EU chemical industry registered more than simply a solid recovery in 2013 after the 2008 economic crisis, posting a record extra-EU net trade surplus of €48.7 billion. As an historically important player in the global chemicals market, the EU chemical industry continues to benefit from trade opportunities.
• The European chemical industry is an exporting industry, with one-quarter of its production being exported outside the European Union. Our industry needs to continue to be globally competitive to sustain its existing capacity and grow in line with global demand.
• The chemical industry depends on free trade and open markets both for its raw materials and as outlets for its products. The industry relies increasingly on tightly interconnected clusters that in turn participate in global value chains. Accordingly, we strongly support the European Union’s efforts to conclude state-of-the-art free trade agreements that ensure unrestricted access to energy and feedstock and advance regulatory cooperation between Europe and key trading partners, especially the United States and Japan.
EU chemicals trade surplus reaches new record level
Source: Eurostat (Comext)
Unless specified, chemical industry excludes pharmaceuticals Unless specified, EU refers to EU 28
16
Extra-EU chemicals trade balance
Extra-EU chemicals trade by region (exports & imports)
EU chemicals trade surplus: 2012 vs 2013
EU chemicals trade surplus: sectoral breakdown
Extra-EU chemicals trade flows with major geographic blocs
EU chemicals trade surplus: sectoral and regional breakdown
� 2008: €187 billion� 2013: €229 billion
% sh
are
0
5
10
15
20
25
30
35
Rest of the world
JapanLatin America
AfricaChinaAsia***NAFTA**Rest of Europe*
26.5 27.226.3
22.420.6
21.6
6.78.7
6.2 6.4 5.5 6.1 5.4 4.72.8 2.9
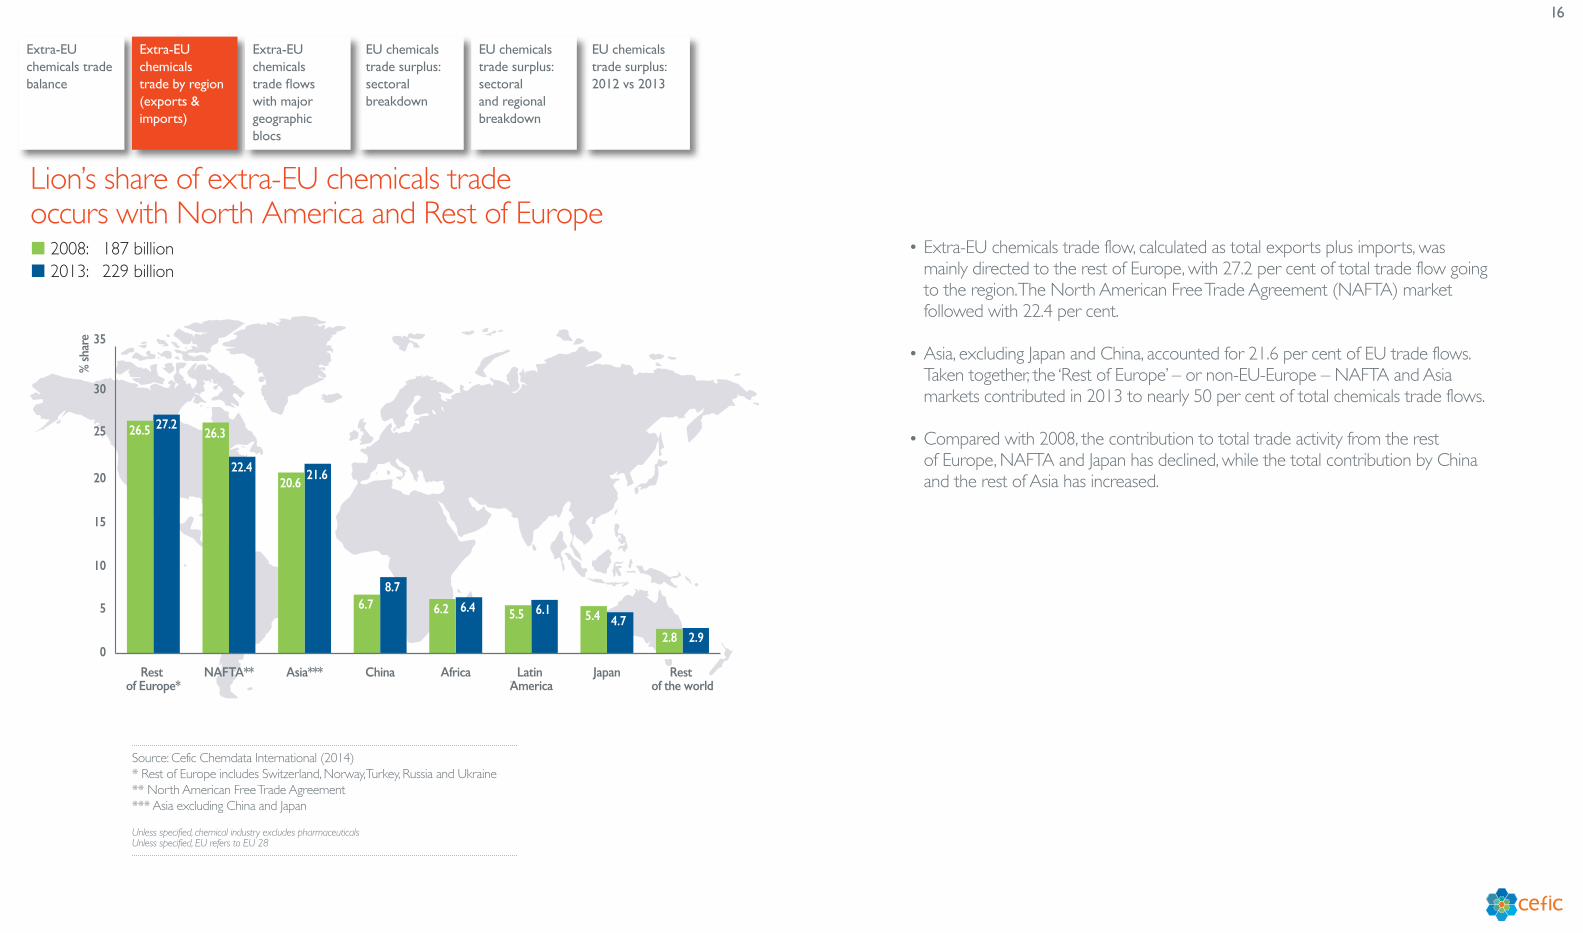
• Extra-EU chemicals trade flow, calculated as total exports plus imports, was mainly directed to the rest of Europe, with 27.2 per cent of total trade flow going to the region. The North American Free Trade Agreement (NAFTA) market followed with 22.4 per cent.
• Asia, excluding Japan and China, accounted for 21.6 per cent of EU trade flows. Taken together, the ‘Rest of Europe’ – or non-EU-Europe – NAFTA and Asia markets contributed in 2013 to nearly 50 per cent of total chemicals trade flows.
• Compared with 2008, the contribution to total trade activity from the rest of Europe, NAFTA and Japan has declined, while the total contribution by China and the rest of Asia has increased.
Lion’s share of extra-EU chemicals trade occurs with North America and Rest of Europe
Source: Cefic Chemdata International (2014)* Rest of Europe includes Switzerland, Norway, Turkey, Russia and Ukraine** North American Free Trade Agreement*** Asia excluding China and Japan
Unless specified, chemical industry excludes pharmaceuticals Unless specified, EU refers to EU 28
17
Extra-EU chemicals trade balance
Extra-EU chemicals trade by region (exports & imports)
EU chemicals trade surplus: 2012 vs 2013
EU chemicals trade surplus: sectoral breakdown
Extra-EU chemicals trade flows with major geographic blocs
EU chemicals trade surplus: sectoral and regional breakdown
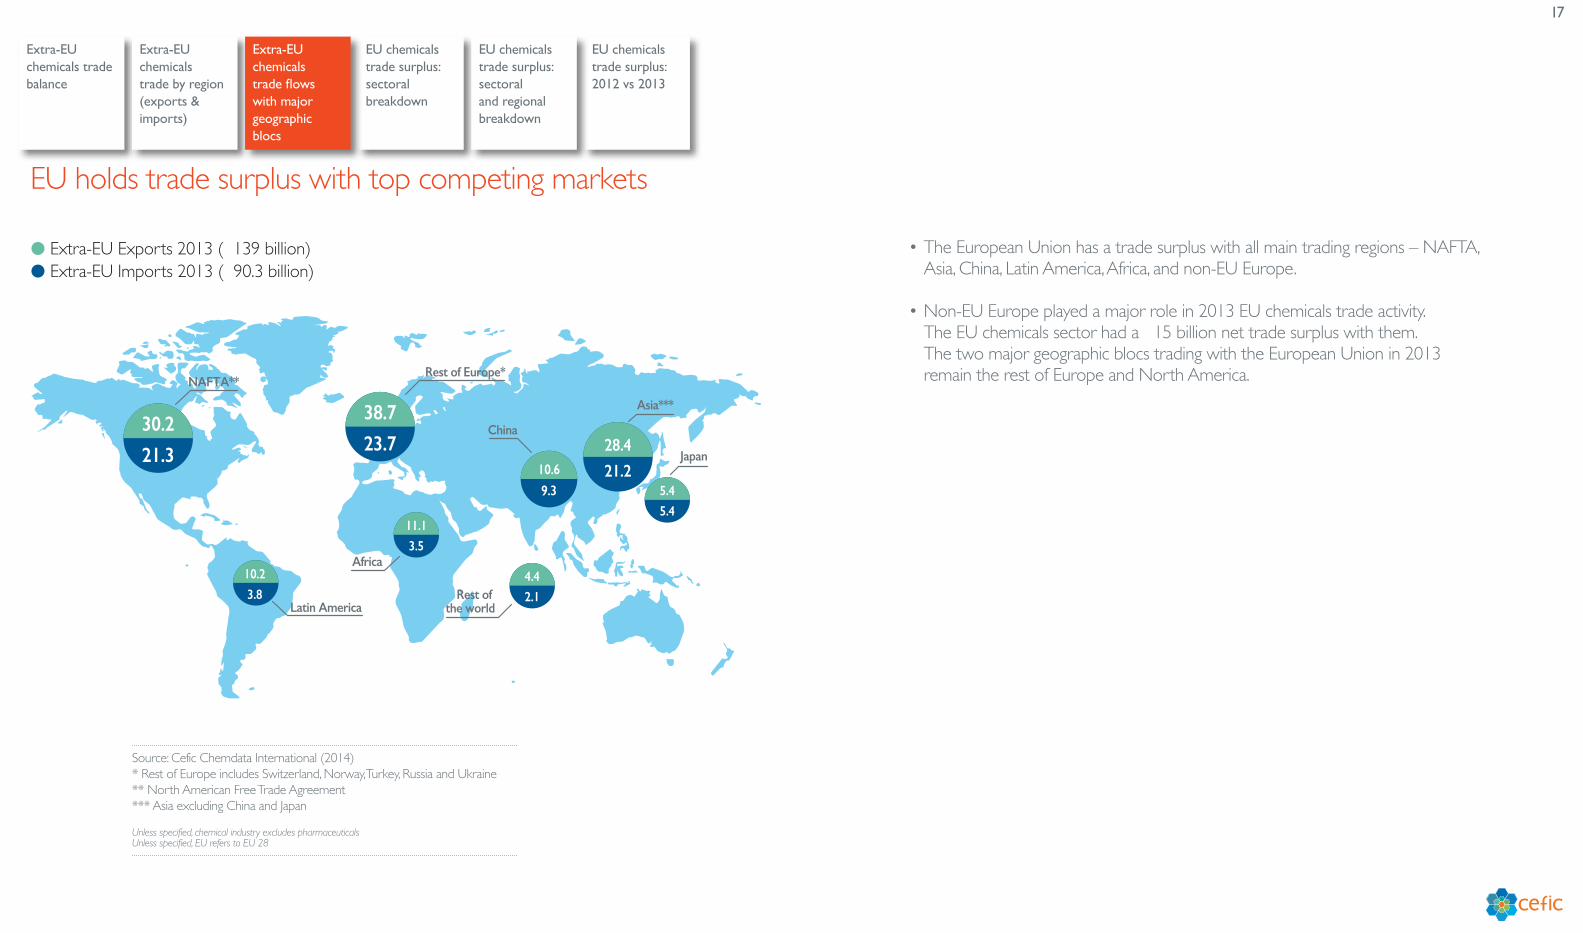
• The European Union has a trade surplus with all main trading regions – NAFTA, Asia, China, Latin America, Africa, and non-EU Europe.
• Non-EU Europe played a major role in 2013 EU chemicals trade activity. The EU chemicals sector had a €15 billion net trade surplus with them. The two major geographic blocs trading with the European Union in 2013 remain the rest of Europe and North America.
EU holds trade surplus with top competing markets
Unless specified, chemical industry excludes pharmaceuticals Unless specified, EU refers to EU 28
� Extra-EU Exports 2013 (€139 billion)� Extra-EU Imports 2013 (€90.3 billion)
28.4
21.210.6
9.3
38.7
23.730.2
21.3
5.4
5.4
4.4
2.1
11.1
3.5
3.8
10.2
Asia***
Rest of Europe*NAFTA**
Rest of the worldLatin America
China
Japan
Africa
Source: Cefic Chemdata International (2014)* Rest of Europe includes Switzerland, Norway, Turkey, Russia and Ukraine** North American Free Trade Agreement*** Asia excluding China and Japan
18
Extra-EU chemicals trade balance
Extra-EU chemicals trade by region (exports & imports)
EU chemicals trade surplus: 2012 vs 2013
EU chemicals trade surplus: sectoral breakdown
Extra-EU chemicals trade flows with major geographic blocs
EU chemicals trade surplus: sectoral and regional breakdown
� Basics inorganics� Specialty chemicals
Extr
a-EU
che
mica
l tra
de b
alan
ce (€
mill
ion)
- 4,000
- 2,000
0
2,000
4,000
6,000
8,000
10,000
12,000
14,000
16,000
18,000
20,000
22,000
24,000
26,000
20132012201120102009200820072006200520042003
� Petrochemicals� Consumer chemicals
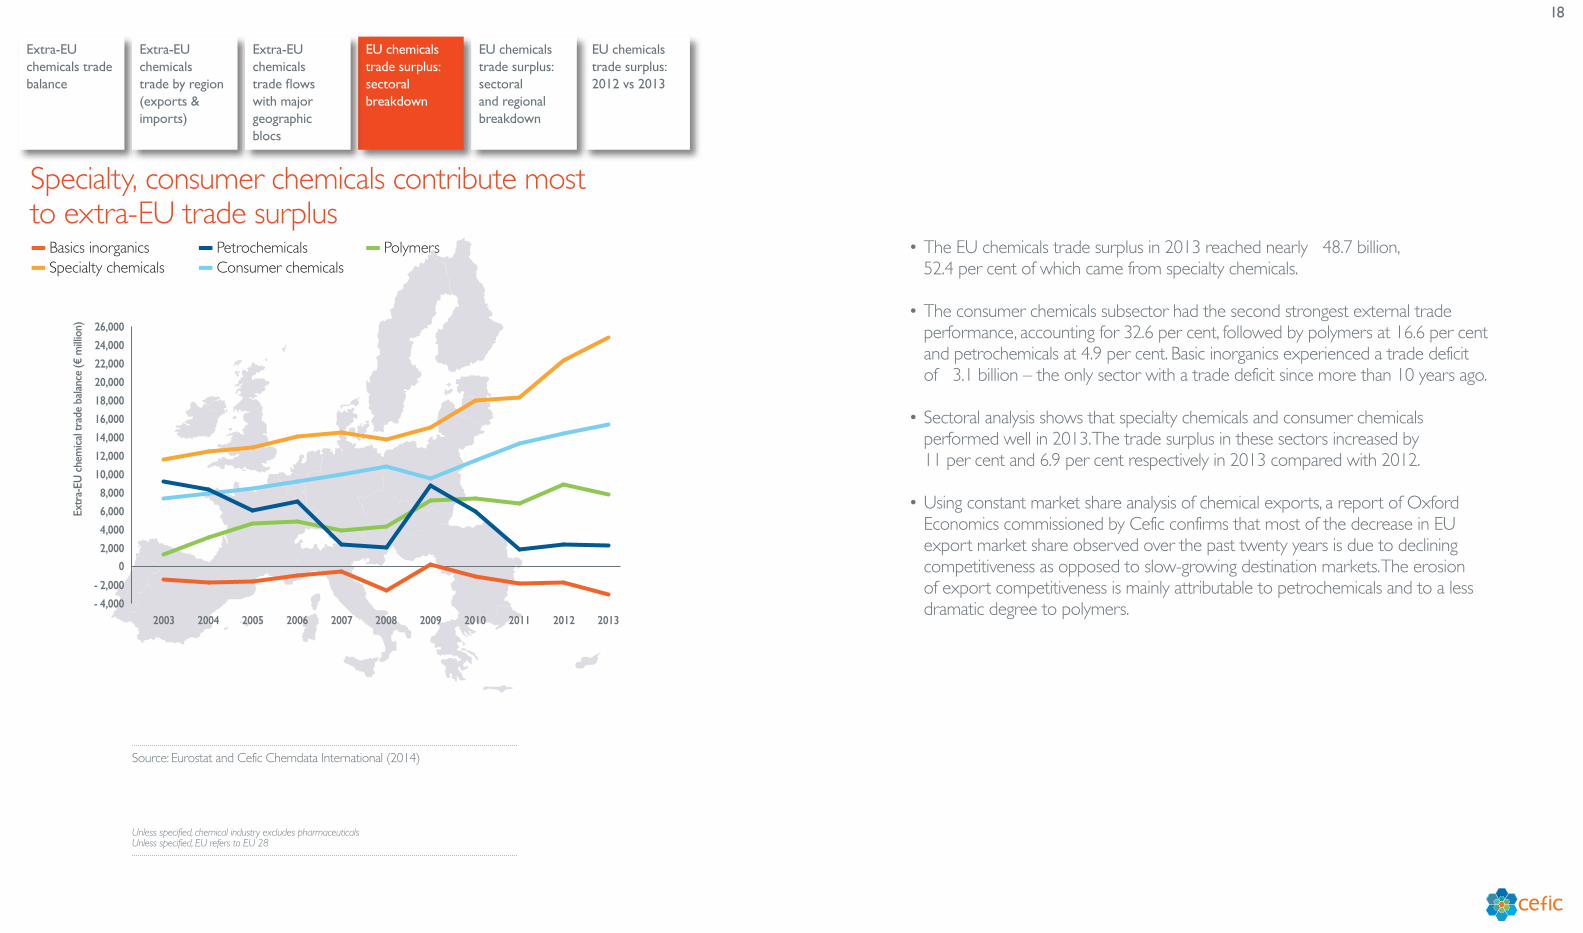
� Polymers • The EU chemicals trade surplus in 2013 reached nearly €48.7 billion, 52.4 per cent of which came from specialty chemicals.
• The consumer chemicals subsector had the second strongest external trade performance, accounting for 32.6 per cent, followed by polymers at 16.6 per cent and petrochemicals at 4.9 per cent. Basic inorganics experienced a trade deficit of €3.1 billion – the only sector with a trade deficit since more than 10 years ago.
• Sectoral analysis shows that specialty chemicals and consumer chemicals performed well in 2013. The trade surplus in these sectors increased by 11 per cent and 6.9 per cent respectively in 2013 compared with 2012.
• Using constant market share analysis of chemical exports, a report of Oxford Economics commissioned by Cefic confirms that most of the decrease in EU export market share observed over the past twenty years is due to declining competitiveness as opposed to slow-growing destination markets. The erosion of export competitiveness is mainly attributable to petrochemicals and to a less dramatic degree to polymers.
Specialty, consumer chemicals contribute most to extra-EU trade surplus
Source: Eurostat and Cefic Chemdata International (2014)
Unless specified, chemical industry excludes pharmaceuticals Unless specified, EU refers to EU 28
19
Extra-EU chemicals trade balance
Extra-EU chemicals trade by region (exports & imports)
EU chemicals trade surplus: 2012 vs 2013
EU chemicals trade surplus: sectoral breakdown
Extra-EU chemicals trade flows with major geographic blocs
EU chemicals trade surplus: sectoral and regional breakdown
� Consumer chemicals� Petrochemicals
� Specialty chemicals� Basic inorganics
� Polymers
Extr
a-EU
bal
ance
, yea
r 201
3 (€
mn)
- 6,000
- 4,000
- 2,000
0
2,000
4,000
6,000
8,000
10,000
12,000
14,000
IndiaJapanSouth Korea
ChinaMiddle East
RussiaBrazilRest of Asia**
USAAfricaRest of Europe*
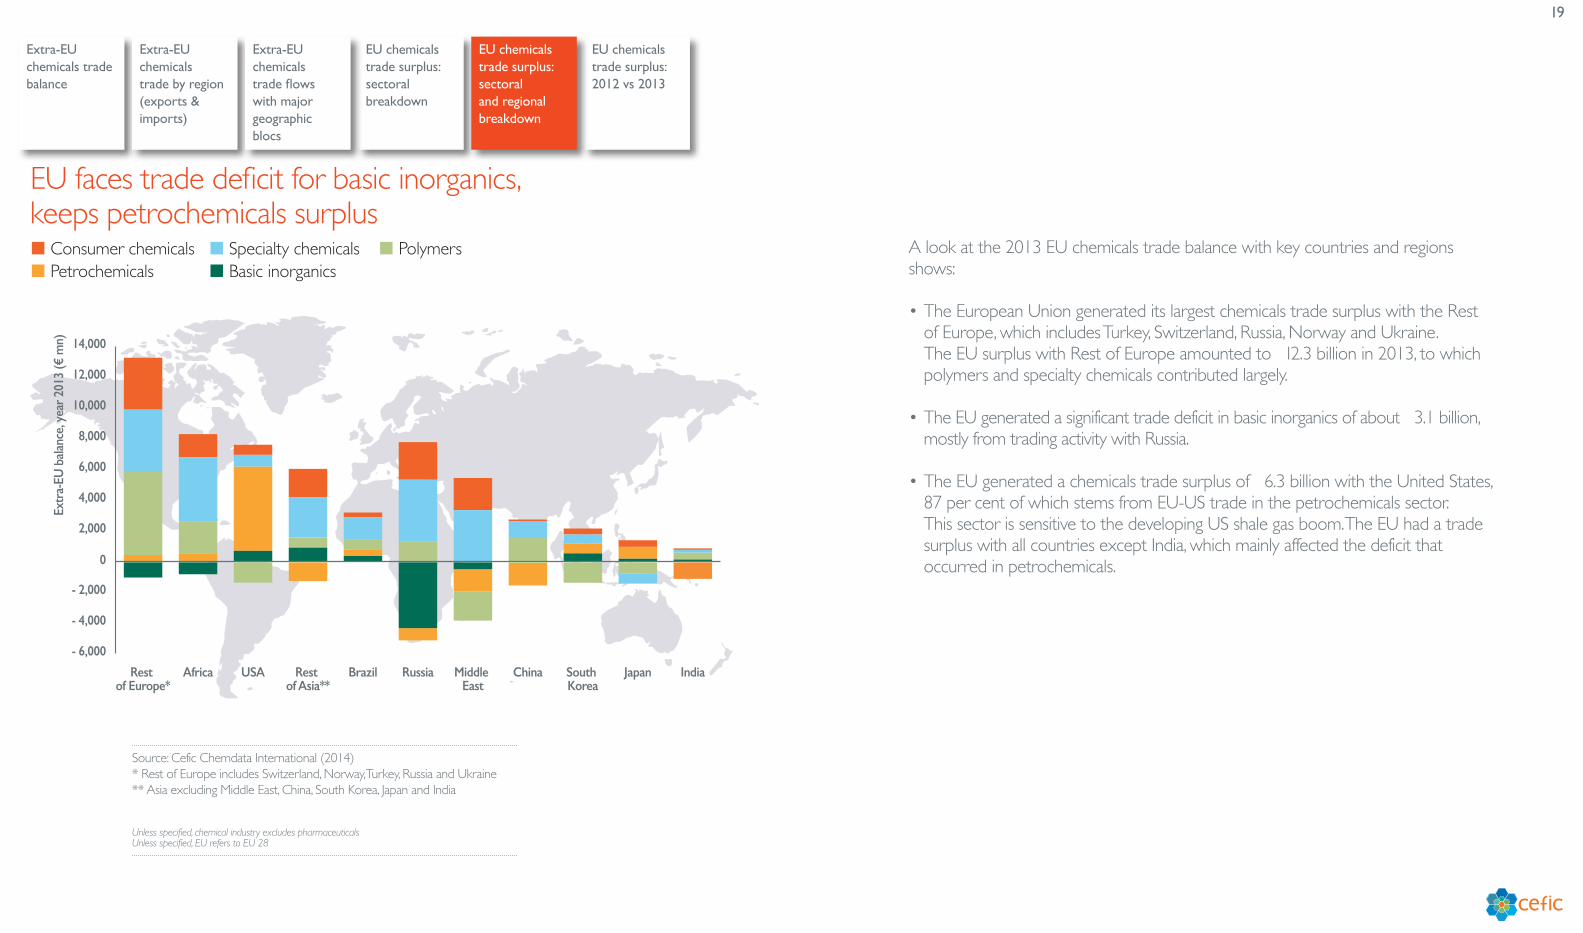
A look at the 2013 EU chemicals trade balance with key countries and regions shows:
• The European Union generated its largest chemicals trade surplus with the Rest of Europe, which includes Turkey, Switzerland, Russia, Norway and Ukraine. The EU surplus with Rest of Europe amounted to €12.3 billion in 2013, to which polymers and specialty chemicals contributed largely.
• The EU generated a significant trade deficit in basic inorganics of about €3.1 billion, mostly from trading activity with Russia.
• The EU generated a chemicals trade surplus of €6.3 billion with the United States, 87 per cent of which stems from EU-US trade in the petrochemicals sector. This sector is sensitive to the developing US shale gas boom. The EU had a trade surplus with all countries except India, which mainly affected the deficit that occurred in petrochemicals.
EU faces trade deficit for basic inorganics, keeps petrochemicals surplus
Source: Cefic Chemdata International (2014)* Rest of Europe includes Switzerland, Norway, Turkey, Russia and Ukraine** Asia excluding Middle East, China, South Korea, Japan and India
Unless specified, chemical industry excludes pharmaceuticals Unless specified, EU refers to EU 28
20
Extra-EU chemicals trade balance
Extra-EU chemicals trade by region (exports & imports)
EU chemicals trade surplus: 2012 vs 2013
EU chemicals trade surplus: sectoral breakdown
Extra-EU chemicals trade flows with major geographic blocs
EU chemicals trade surplus: sectoral and regional breakdown
� Consumer chemicals� Petrochemicals
� Specialty chemicals� Basic inorganics
� Polymers
Del
ta E
xtra
-EU
bal
ance
, (20
13 v
s 201
2, €
mn)
- 2,800- 2,600- 2,400- 2,200- 2,000- 1,800- 1,600- 1,400- 1,200- 1,000
- 800- 600- 400- 200
0200400600
Rest of Europe*
AfricaRussiaBrazilJapanChinaMiddle East
IndiaSouth Korea
USA
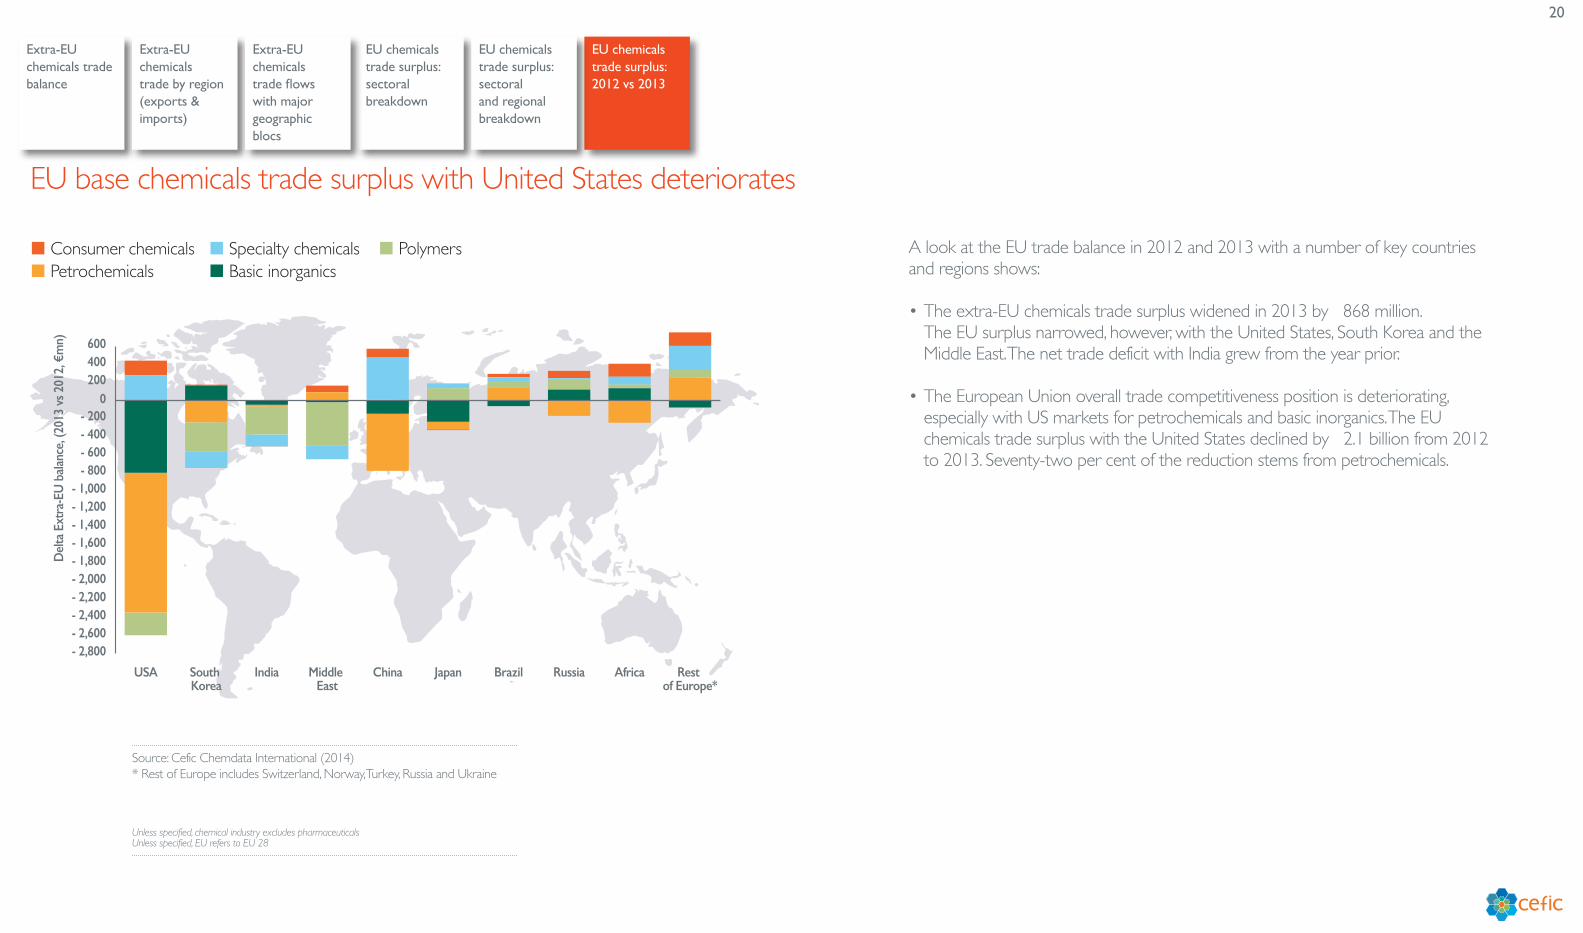
A look at the EU trade balance in 2012 and 2013 with a number of key countries and regions shows:
• The extra-EU chemicals trade surplus widened in 2013 by €868 million. The EU surplus narrowed, however, with the United States, South Korea and the Middle East. The net trade deficit with India grew from the year prior.
• The European Union overall trade competitiveness position is deteriorating, especially with US markets for petrochemicals and basic inorganics. The EU chemicals trade surplus with the United States declined by €2.1 billion from 2012 to 2013. Seventy-two per cent of the reduction stems from petrochemicals.
EU base chemicals trade surplus with United States deteriorates
Source: Cefic Chemdata International (2014)* Rest of Europe includes Switzerland, Norway, Turkey, Russia and Ukraine
Unless specified, chemical industry excludes pharmaceuticals Unless specified, EU refers to EU 28

21
Growth & Competitiveness
Production, trade and consumption growth
Chemicals growth performance against total manufacturing
International comparison of production growth
EU chemicals production growth by sector
22
Production, trade and consumption growth
Chemicals growth performance against total manufacturing
International comparison of production growth
EU chemicals production growth by sector
� Growth rate: 2003 - 2008� Growth rate: 2008 - 2013
-1
0
1
2
3
4
5
6
7
8
9
10
Consumption*Extra-EU importsExtra-EU exportsSales
Ave
rage
gro
wth
in v
alue
(% p
.a.)
5.1
- 0.1
6.3
5.1
9.2
2.8
5.4
- 0,9
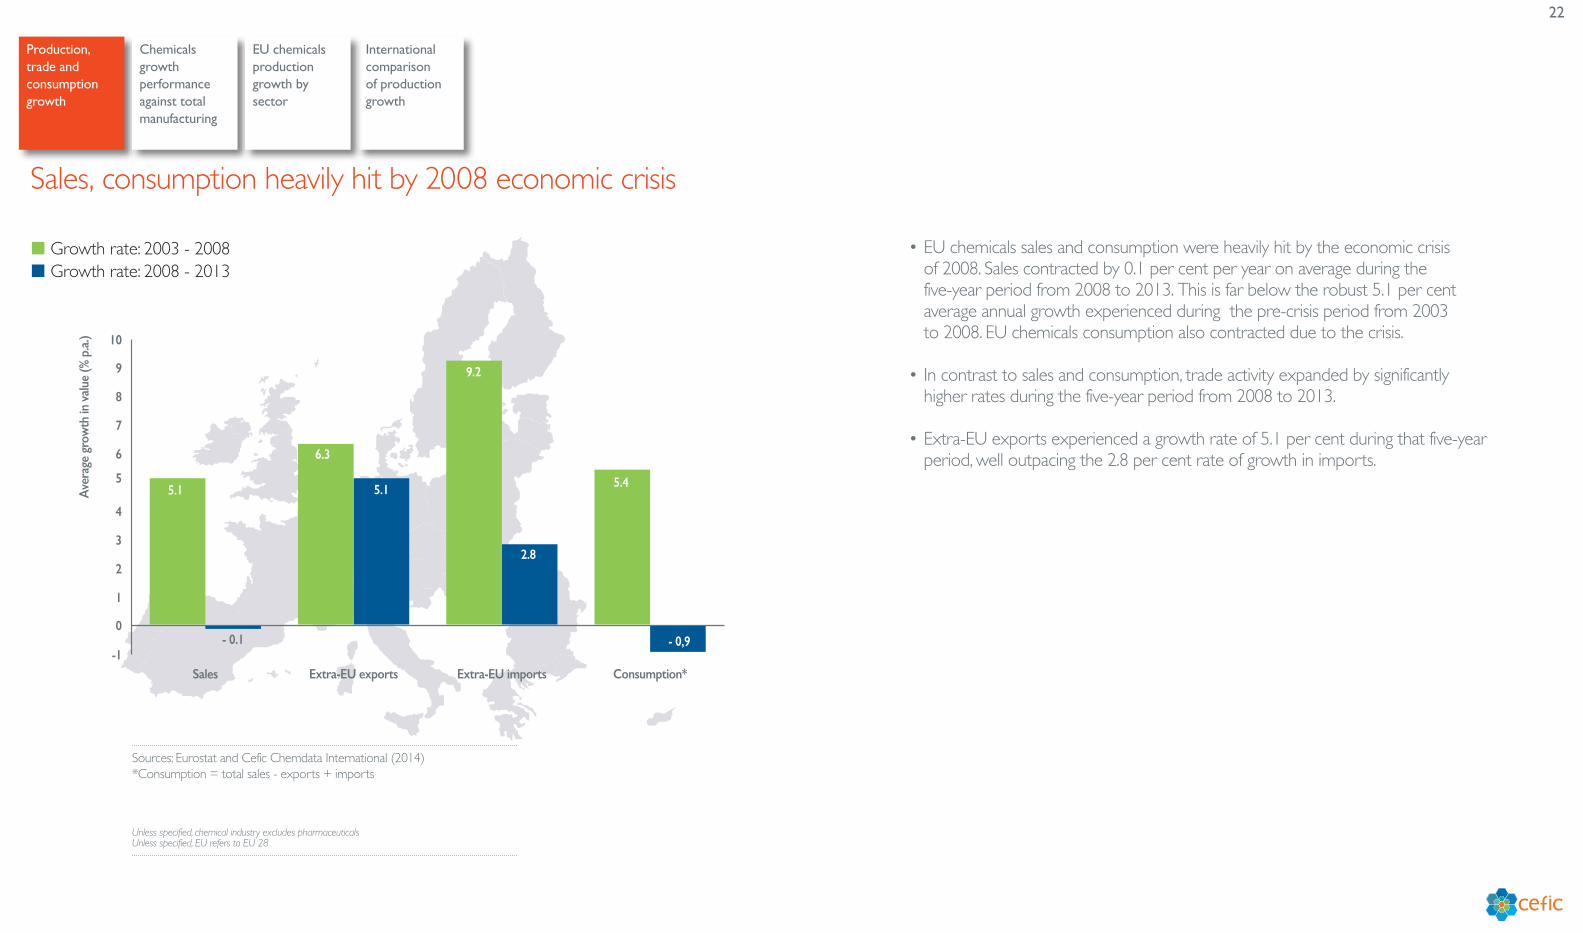
• EU chemicals sales and consumption were heavily hit by the economic crisis of 2008. Sales contracted by 0.1 per cent per year on average during the five-year period from 2008 to 2013. This is far below the robust 5.1 per cent average annual growth experienced during the pre-crisis period from 2003 to 2008. EU chemicals consumption also contracted due to the crisis.
• In contrast to sales and consumption, trade activity expanded by significantly higher rates during the five-year period from 2008 to 2013.
• Extra-EU exports experienced a growth rate of 5.1 per cent during that five-year period, well outpacing the 2.8 per cent rate of growth in imports.
Sales, consumption heavily hit by 2008 economic crisis
Sources: Eurostat and Cefic Chemdata International (2014)*Consumption = total sales - exports + imports
Unless specified, chemical industry excludes pharmaceuticals Unless specified, EU refers to EU 28
23
Production, trade and consumption growth
Chemicals growth performance against total manufacturing
International comparison of production growth
EU chemicals production growth by sector
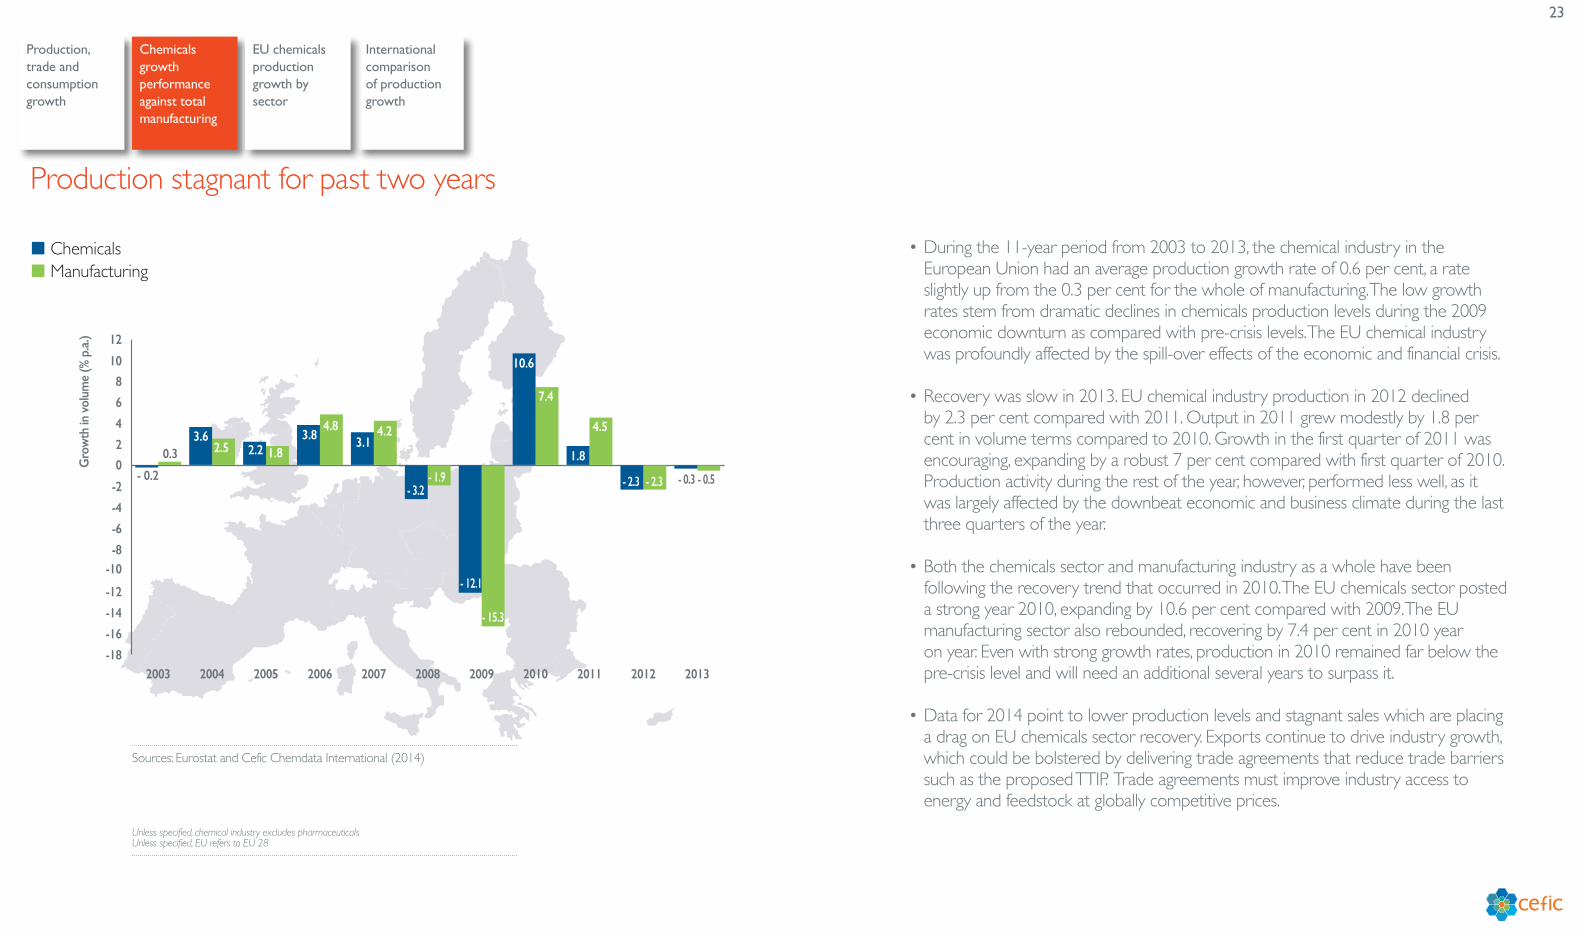
• During the 11-year period from 2003 to 2013, the chemical industry in the European Union had an average production growth rate of 0.6 per cent, a rate slightly up from the 0.3 per cent for the whole of manufacturing. The low growth rates stem from dramatic declines in chemicals production levels during the 2009 economic downturn as compared with pre-crisis levels. The EU chemical industry was profoundly affected by the spill-over effects of the economic and financial crisis.
• Recovery was slow in 2013. EU chemical industry production in 2012 declined by 2.3 per cent compared with 2011. Output in 2011 grew modestly by 1.8 per cent in volume terms compared to 2010. Growth in the first quarter of 2011 was encouraging, expanding by a robust 7 per cent compared with first quarter of 2010. Production activity during the rest of the year, however, performed less well, as it was largely affected by the downbeat economic and business climate during the last three quarters of the year.
• Both the chemicals sector and manufacturing industry as a whole have been following the recovery trend that occurred in 2010. The EU chemicals sector posted a strong year 2010, expanding by 10.6 per cent compared with 2009. The EU manufacturing sector also rebounded, recovering by 7.4 per cent in 2010 year on year. Even with strong growth rates, production in 2010 remained far below the pre-crisis level and will need an additional several years to surpass it.
• Data for 2014 point to lower production levels and stagnant sales which are placing a drag on EU chemicals sector recovery. Exports continue to drive industry growth, which could be bolstered by delivering trade agreements that reduce trade barriers such as the proposed TTIP. Trade agreements must improve industry access to energy and feedstock at globally competitive prices.
Production stagnant for past two years
Sources: Eurostat and Cefic Chemdata International (2014)
Unless specified, chemical industry excludes pharmaceuticals Unless specified, EU refers to EU 28
� Chemicals � Manufacturing
-18
-16
-14
-12
-10-8
-6
-4
-2
0
2
4
6
8
10
12
20132012201120102009200820072006200520042003
Gro
wth
in v
olum
e (%
p.a
.)
- 0.2
0.33.6
2.5 2.2 1.83.8
4.83.1
4.2
- 3.2- 1.9
- 12.1
- 15.3
10.6
7.4
1.8
4.5
- 0.3 - 0.5- 2.3 - 2.3
24
Production, trade and consumption growth
Chemicals growth performance against total manufacturing
International comparison of production growth
EU chemicals production growth by sector
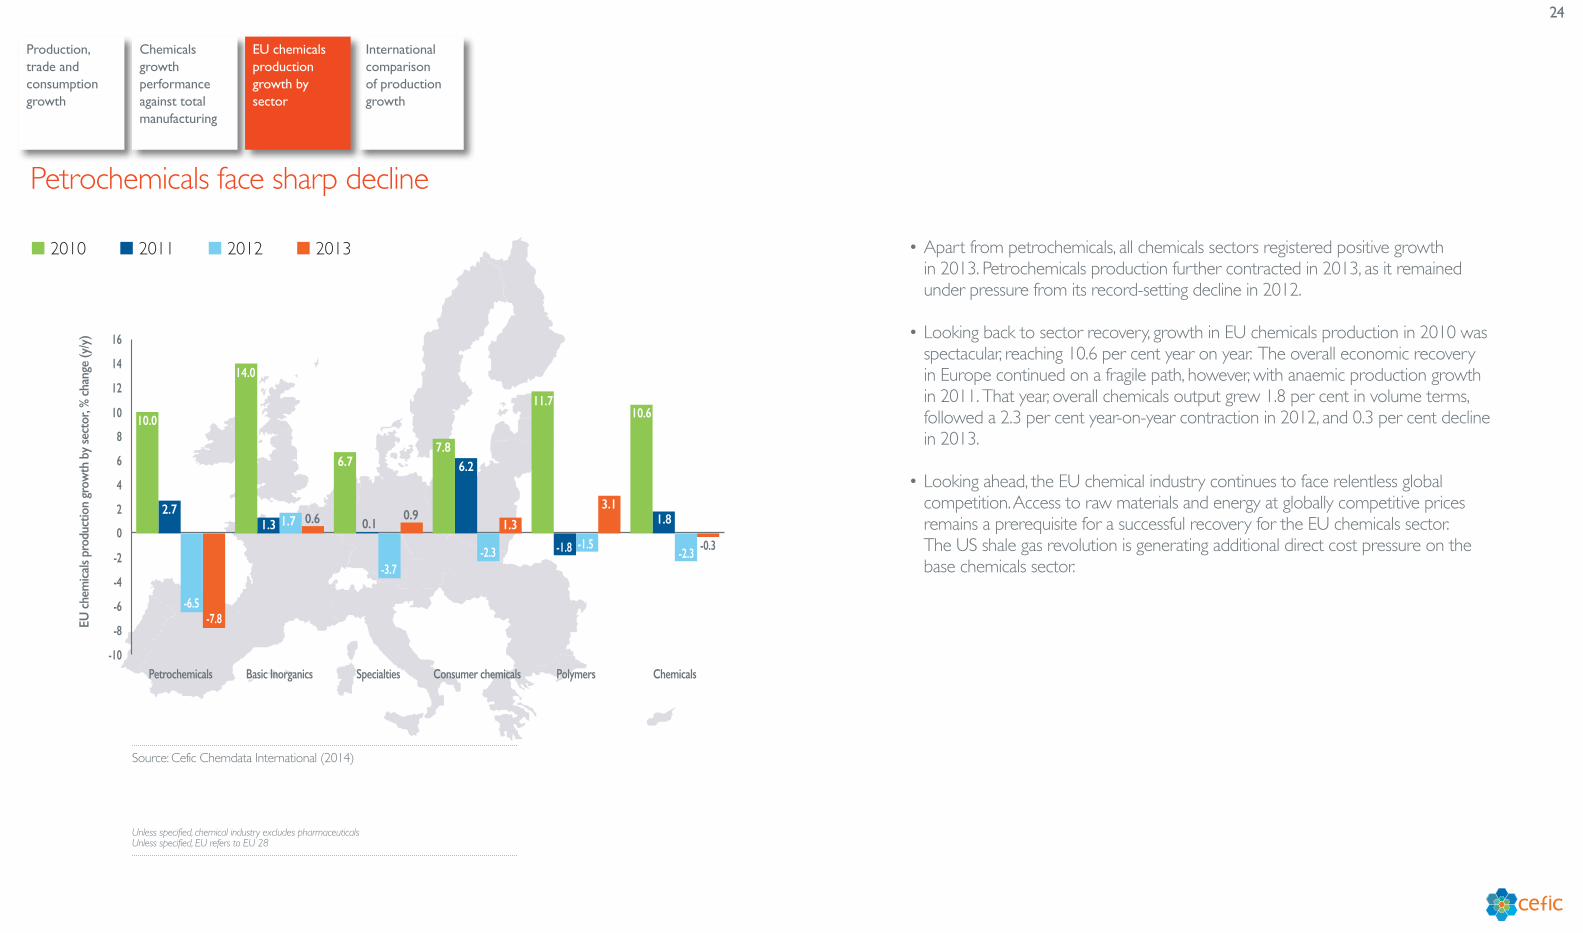
• Apart from petrochemicals, all chemicals sectors registered positive growth in 2013. Petrochemicals production further contracted in 2013, as it remained under pressure from its record-setting decline in 2012.
• Looking back to sector recovery, growth in EU chemicals production in 2010 was spectacular, reaching 10.6 per cent year on year. The overall economic recovery in Europe continued on a fragile path, however, with anaemic production growth in 2011. That year, overall chemicals output grew 1.8 per cent in volume terms, followed a 2.3 per cent year-on-year contraction in 2012, and 0.3 per cent decline in 2013.
• Looking ahead, the EU chemical industry continues to face relentless global competition. Access to raw materials and energy at globally competitive prices remains a prerequisite for a successful recovery for the EU chemicals sector. The US shale gas revolution is generating additional direct cost pressure on the base chemicals sector.
Petrochemicals face sharp decline
Source: Cefic Chemdata International (2014)
Unless specified, chemical industry excludes pharmaceuticals Unless specified, EU refers to EU 28
� 2010 � 2012� 2011 � 2013
-10
-8
-6
-4
-2
0
2
4
6
8
10
12
14
16
ChemicalsPolymersConsumer chemicalsSpecialtiesBasic InorganicsPetrochemicals
EU c
hem
icals
prod
uctio
n gr
owth
by
sect
or, %
cha
nge
(y/y
)
10.0
2.7
-6.5-7.8
14.0
1.3 1.7 0.6
6.7
0.1
-3.7
0.9
7.86.2
-2.3
1.3
11.7
-1.8 -1.5
3.1
10.6
1.8
-2.3 -0.3
25
Production, trade and consumption growth
Chemicals growth performance against total manufacturing
International comparison of production growth
EU chemicals production growth by sector
� China� Japan� Russia
Prod
uctio
n in
dex
(200
3 =
100)
by
coun
try
� EU� South Korea� India
� USA� Brazil
0
50
100
150
200
250
300
350
400
20132012201120102009200820072006200520042003
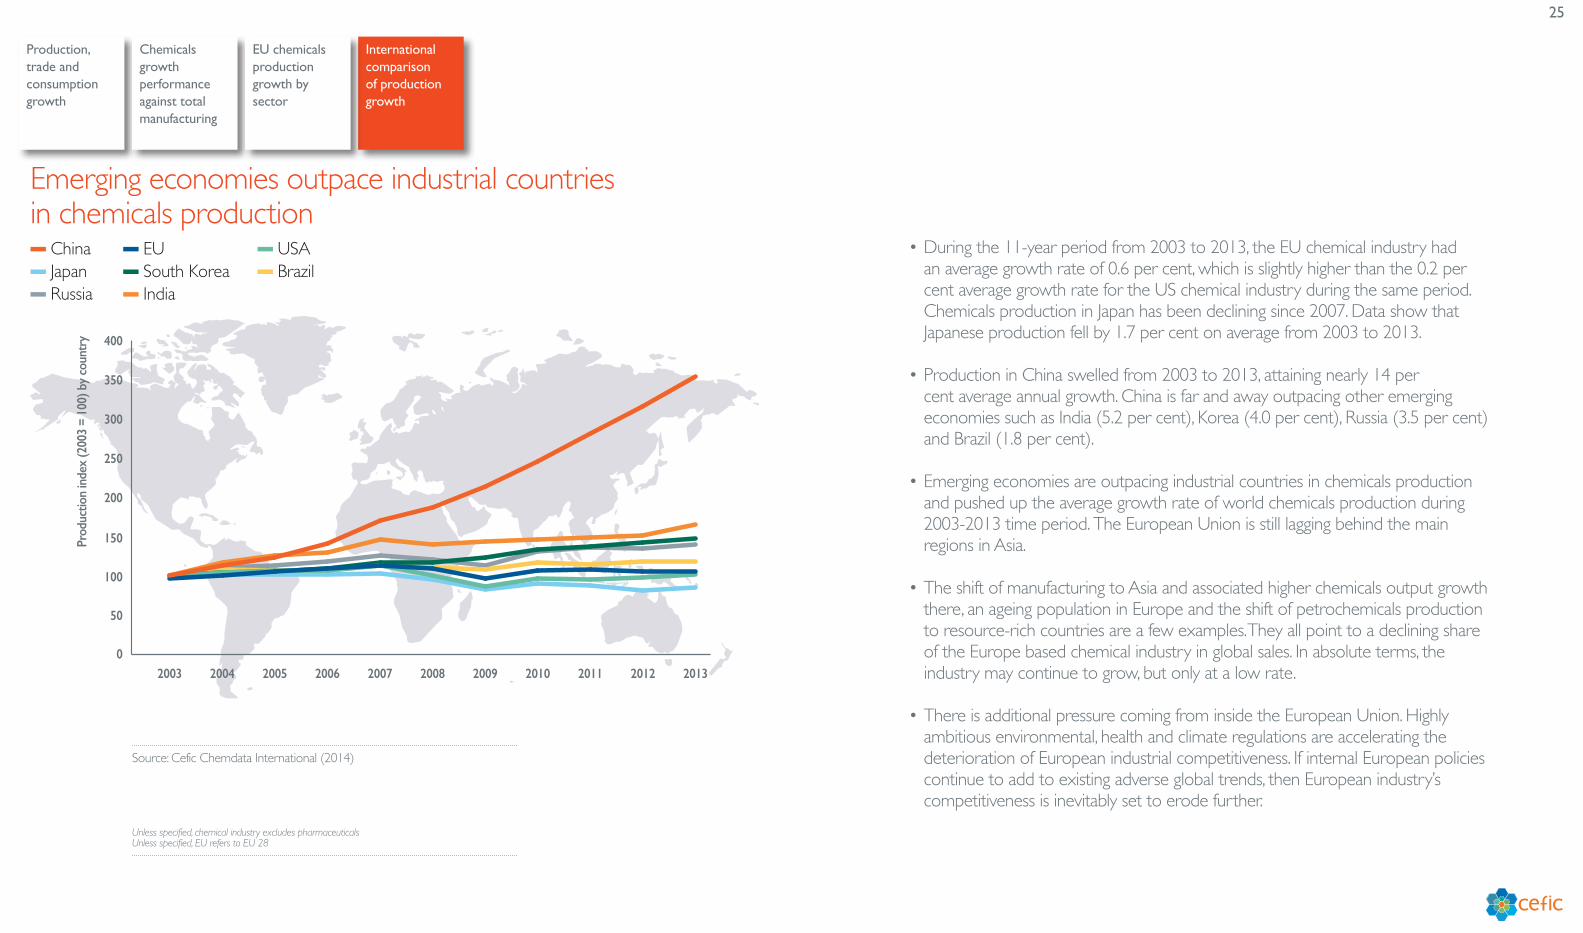
• During the 11-year period from 2003 to 2013, the EU chemical industry had an average growth rate of 0.6 per cent, which is slightly higher than the 0.2 per cent average growth rate for the US chemical industry during the same period. Chemicals production in Japan has been declining since 2007. Data show that Japanese production fell by 1.7 per cent on average from 2003 to 2013.
• Production in China swelled from 2003 to 2013, attaining nearly 14 per cent average annual growth. China is far and away outpacing other emerging economies such as India (5.2 per cent), Korea (4.0 per cent), Russia (3.5 per cent) and Brazil (1.8 per cent).
• Emerging economies are outpacing industrial countries in chemicals production and pushed up the average growth rate of world chemicals production during 2003-2013 time period. The European Union is still lagging behind the main regions in Asia.
• The shift of manufacturing to Asia and associated higher chemicals output growth there, an ageing population in Europe and the shift of petrochemicals production to resource-rich countries are a few examples. They all point to a declining share of the Europe based chemical industry in global sales. In absolute terms, the industry may continue to grow, but only at a low rate.
• There is additional pressure coming from inside the European Union. Highly ambitious environmental, health and climate regulations are accelerating the deterioration of European industrial competitiveness. If internal European policies continue to add to existing adverse global trends, then European industry’s competitiveness is inevitably set to erode further.
Emerging economies outpace industrial countries in chemicals production
Source: Cefic Chemdata International (2014)
Unless specified, chemical industry excludes pharmaceuticals Unless specified, EU refers to EU 28

26
EmploymentEmployment in the EU chemical industry
Labour cost per employee
Labour productivity
Labour cost per employee: chemicals vs manufacturing
Labour productivity: chemicals vs total manufacturing
27
Employment in the EU chemical industry
Labour cost per employee
Labour productivity
Labour cost per employee: chemicals vs manufacturing
Labour productivity: chemicals vs total manufacturing
� Direct jobs
0,0
0,2
0,4
0,6
0,8
1,0
1,2
1,4
1,6
1,8
201320122011201020092008200720062005200420032002200120001999199819971996
Empl
oym
ent (
in m
illio
ns)
1.611.56 1.54
1.49 1.46 1.42 1.39 1.371.29 1.27 1.25 1.24
1.19 1.17 1.18 1.17 1.16
1.45
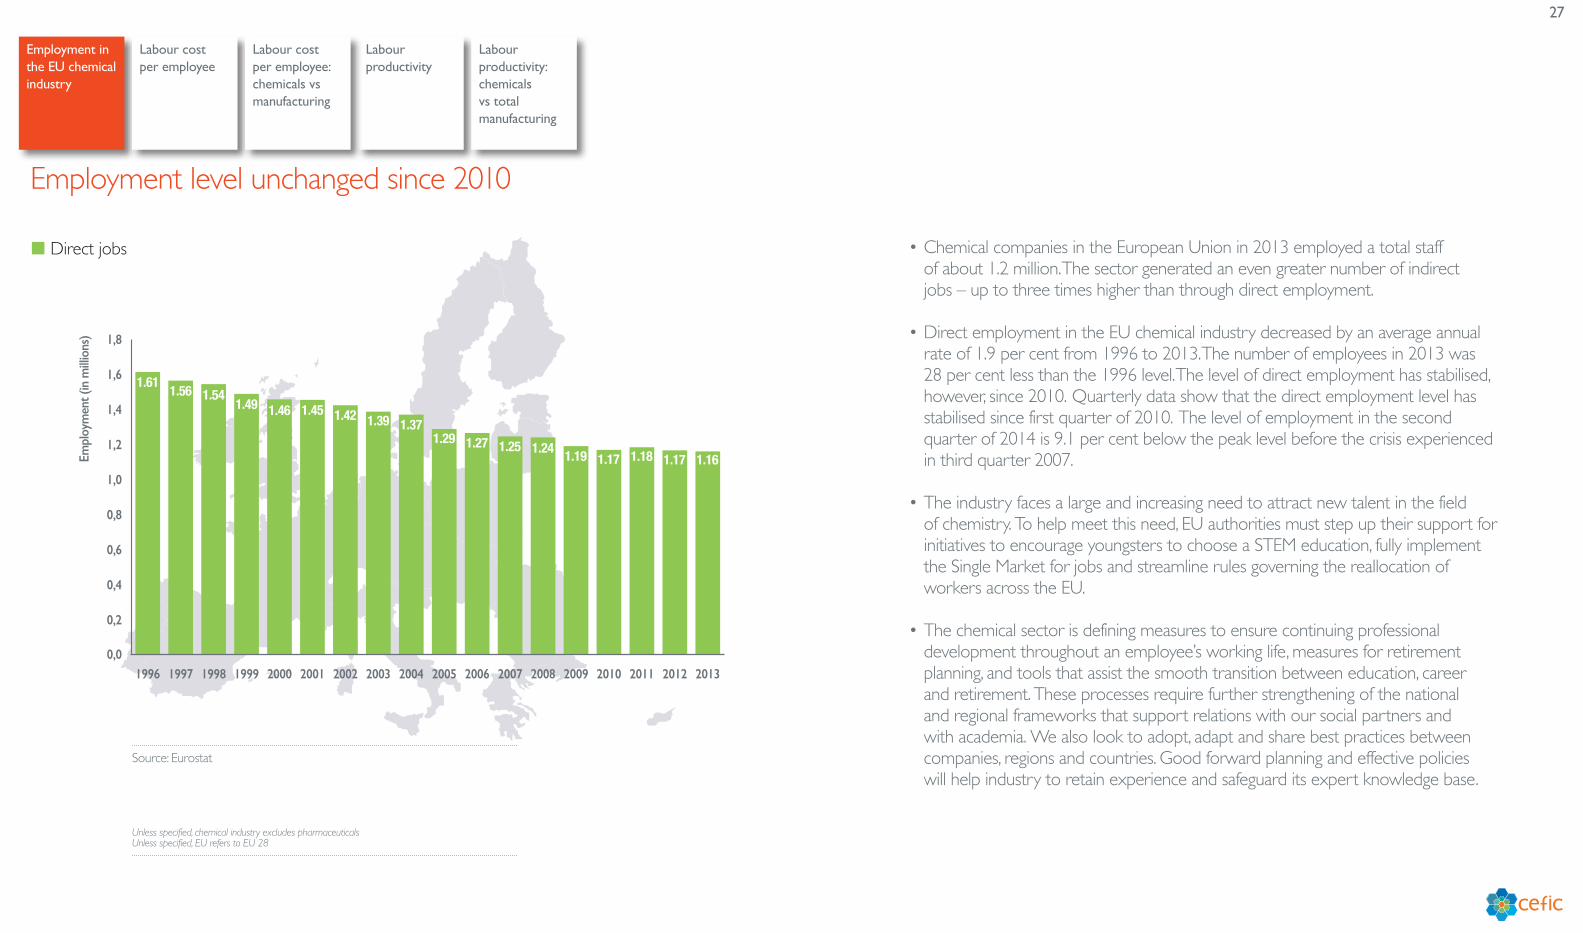
• Chemical companies in the European Union in 2013 employed a total staff of about 1.2 million. The sector generated an even greater number of indirect jobs – up to three times higher than through direct employment.
• Direct employment in the EU chemical industry decreased by an average annual rate of 1.9 per cent from 1996 to 2013. The number of employees in 2013 was 28 per cent less than the 1996 level. The level of direct employment has stabilised, however, since 2010. Quarterly data show that the direct employment level has stabilised since first quarter of 2010. The level of employment in the second quarter of 2014 is 9.1 per cent below the peak level before the crisis experienced in third quarter 2007.
• The industry faces a large and increasing need to attract new talent in the field of chemistry. To help meet this need, EU authorities must step up their support for initiatives to encourage youngsters to choose a STEM education, fully implement the Single Market for jobs and streamline rules governing the reallocation of workers across the EU.
• The chemical sector is defining measures to ensure continuing professional development throughout an employee’s working life, measures for retirement planning, and tools that assist the smooth transition between education, career and retirement. These processes require further strengthening of the national and regional frameworks that support relations with our social partners and with academia. We also look to adopt, adapt and share best practices between companies, regions and countries. Good forward planning and effective policies will help industry to retain experience and safeguard its expert knowledge base.
Employment level unchanged since 2010
Source: Eurostat
Unless specified, chemical industry excludes pharmaceuticals Unless specified, EU refers to EU 28
28
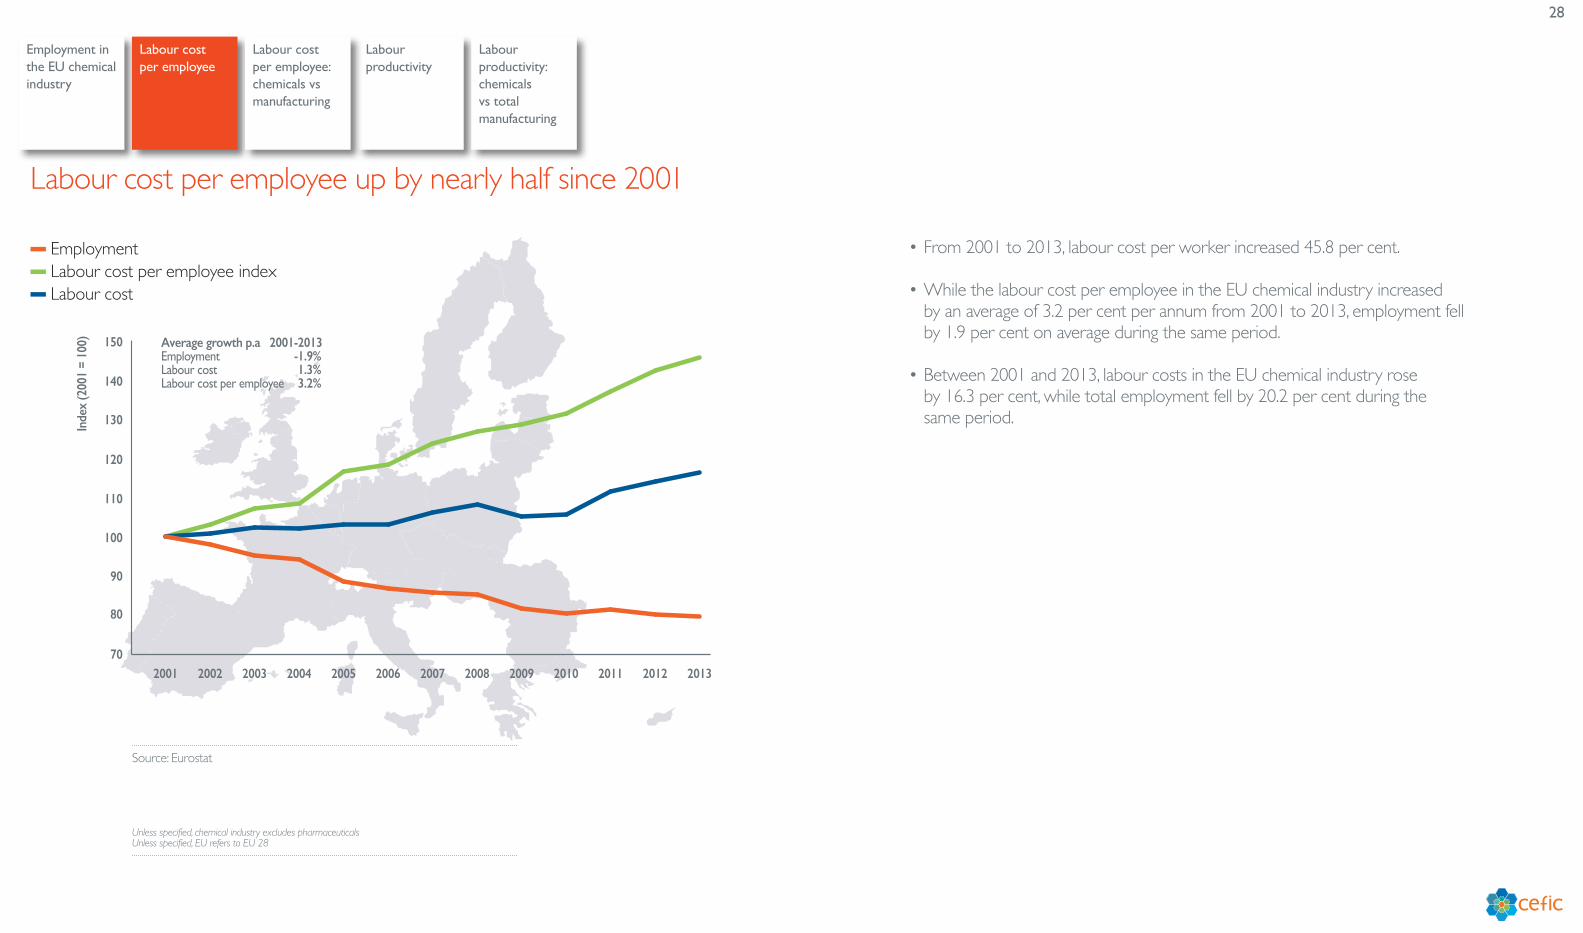
• From 2001 to 2013, labour cost per worker increased 45.8 per cent.
• While the labour cost per employee in the EU chemical industry increased by an average of 3.2 per cent per annum from 2001 to 2013, employment fell by 1.9 per cent on average during the same period.
• Between 2001 and 2013, labour costs in the EU chemical industry rose by 16.3 per cent, while total employment fell by 20.2 per cent during the same period.
Labour cost per employee up by nearly half since 2001
Source: Eurostat
Unless specified, chemical industry excludes pharmaceuticals Unless specified, EU refers to EU 28
Employment in the EU chemical industry
Labour cost per employee
Labour productivity
Labour cost per employee: chemicals vs manufacturing
Labour productivity: chemicals vs total manufacturing
� Employment� Labour cost per employee index� Labour cost
Inde
x (2
001
= 10
0) Average growth p.a 2001-2013Employment -1.9%Labour cost 1.3%Labour cost per employee 3.2%
70
80
90
100
110
120
130
140
150
2013201220112010200920082007200620052004200320022001
29
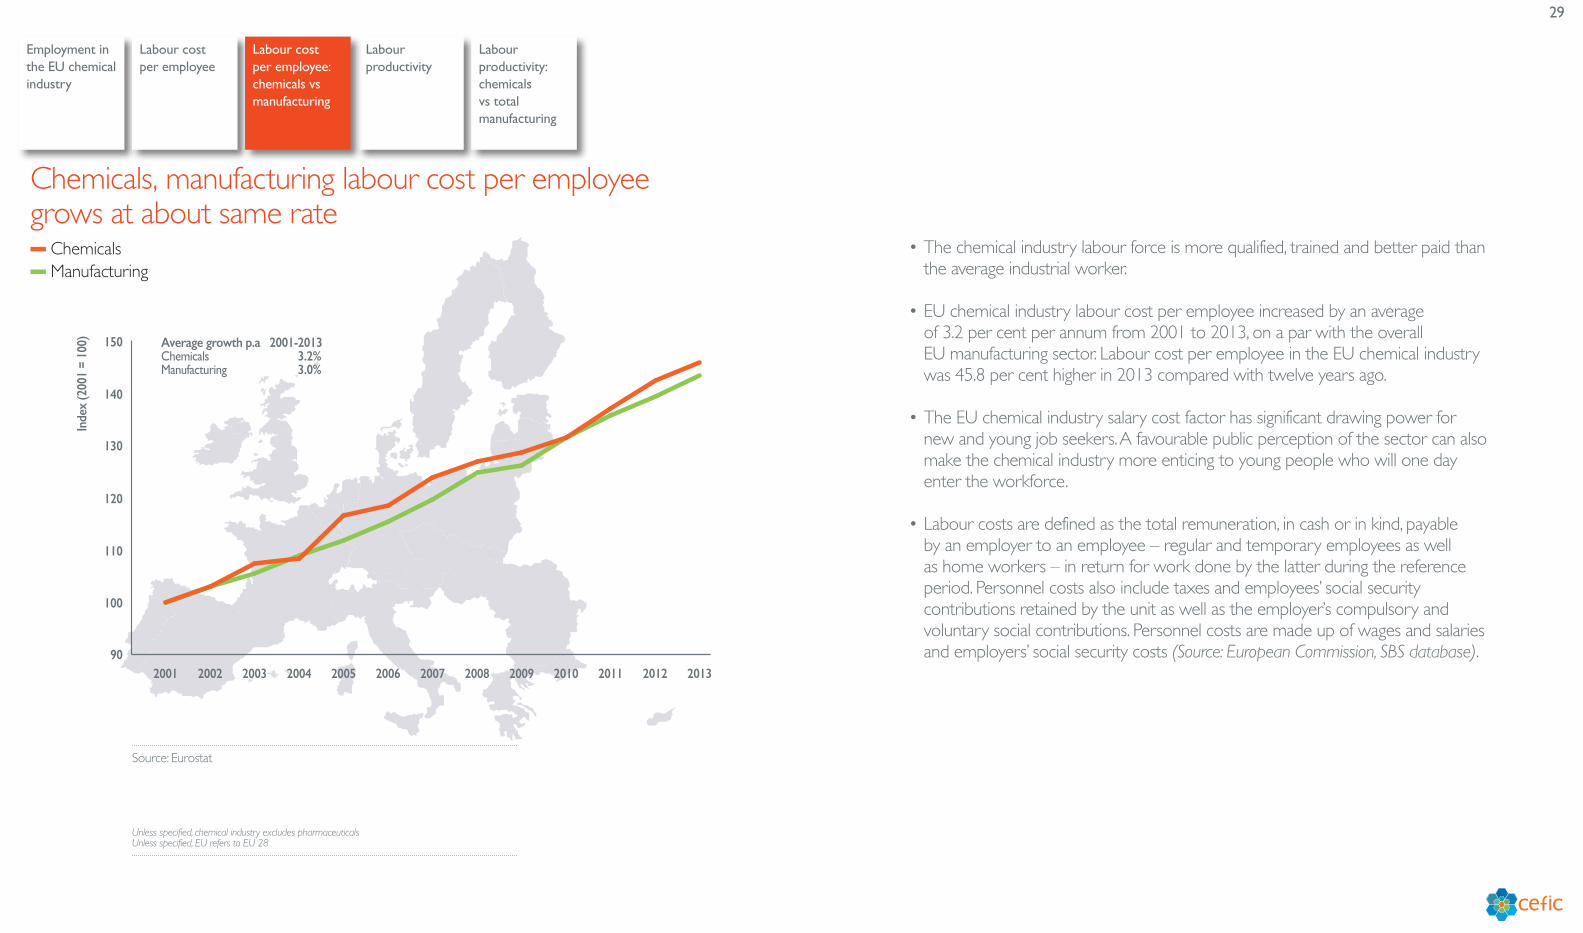
• The chemical industry labour force is more qualified, trained and better paid than the average industrial worker.
• EU chemical industry labour cost per employee increased by an average of 3.2 per cent per annum from 2001 to 2013, on a par with the overall EU manufacturing sector. Labour cost per employee in the EU chemical industry was 45.8 per cent higher in 2013 compared with twelve years ago.
• The EU chemical industry salary cost factor has significant drawing power for new and young job seekers. A favourable public perception of the sector can also make the chemical industry more enticing to young people who will one day enter the workforce.
• Labour costs are defined as the total remuneration, in cash or in kind, payable by an employer to an employee – regular and temporary employees as well as home workers – in return for work done by the latter during the reference period. Personnel costs also include taxes and employees’ social security contributions retained by the unit as well as the employer’s compulsory and voluntary social contributions. Personnel costs are made up of wages and salaries and employers’ social security costs (Source: European Commission, SBS database).
Chemicals, manufacturing labour cost per employee grows at about same rate
Source: Eurostat
Unless specified, chemical industry excludes pharmaceuticals Unless specified, EU refers to EU 28
Employment in the EU chemical industry
Labour cost per employee
Labour productivity
Labour cost per employee: chemicals vs manufacturing
Labour productivity: chemicals vs total manufacturing
� Chemicals� Manufacturing
Inde
x (2
001
= 10
0) Average growth p.a 2001-2013Chemicals 3.2%Manufacturing 3.0%
90
100
110
120
130
140
150
2013201220112010200920082007200620052004200320022001
30
� Production index � Employment index � Labour productivity
Inde
x (2
001
= 10
0) Average growth p.a 2001-2013Production 0.6%Employment -1.9%Productivity 2.5%
70
80
90
100
110
120
130
140
150
2013201220112010200920082007200620052004200320022001
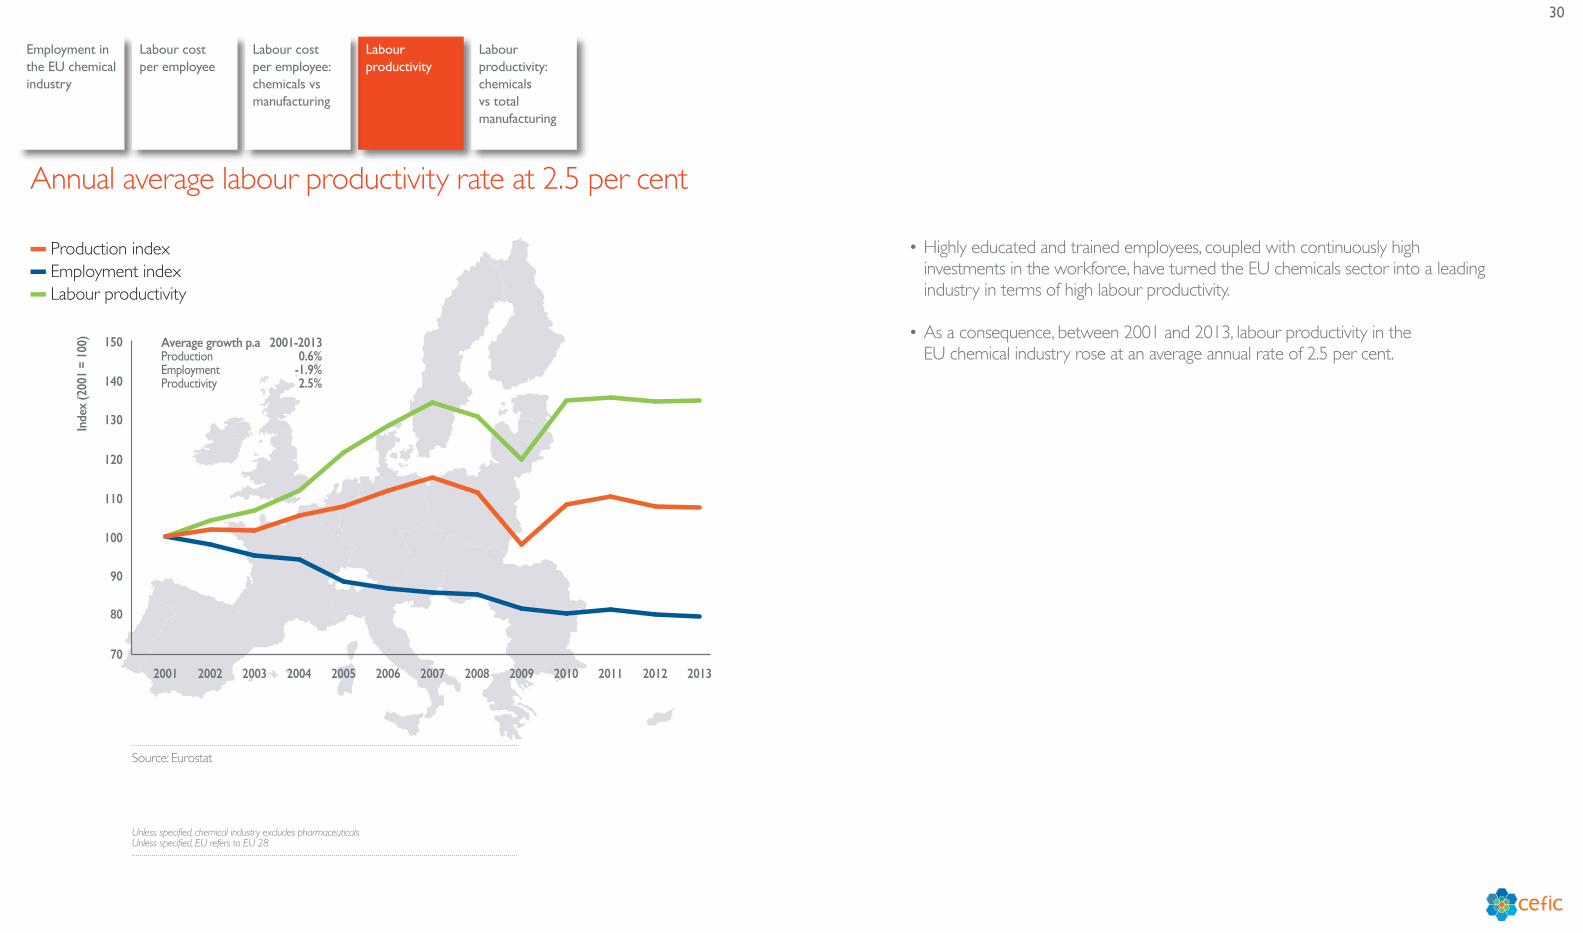
• Highly educated and trained employees, coupled with continuously high investments in the workforce, have turned the EU chemicals sector into a leading industry in terms of high labour productivity.
• As a consequence, between 2001 and 2013, labour productivity in the EU chemical industry rose at an average annual rate of 2.5 per cent.
Annual average labour productivity rate at 2.5 per cent
Source: Eurostat
Unless specified, chemical industry excludes pharmaceuticals Unless specified, EU refers to EU 28
Employment in the EU chemical industry
Labour cost per employee
Labour productivity
Labour cost per employee: chemicals vs manufacturing
Labour productivity: chemicals vs total manufacturing
31
� Chemicals� Manufacturing
Inde
x (2
001
= 10
0) Average growth p.a 2001-2013Chemicals 2.5%Manufacturing 1.9%
90
100
110
120
130
140
150
2013201220112010200920082007200620052004200320022001
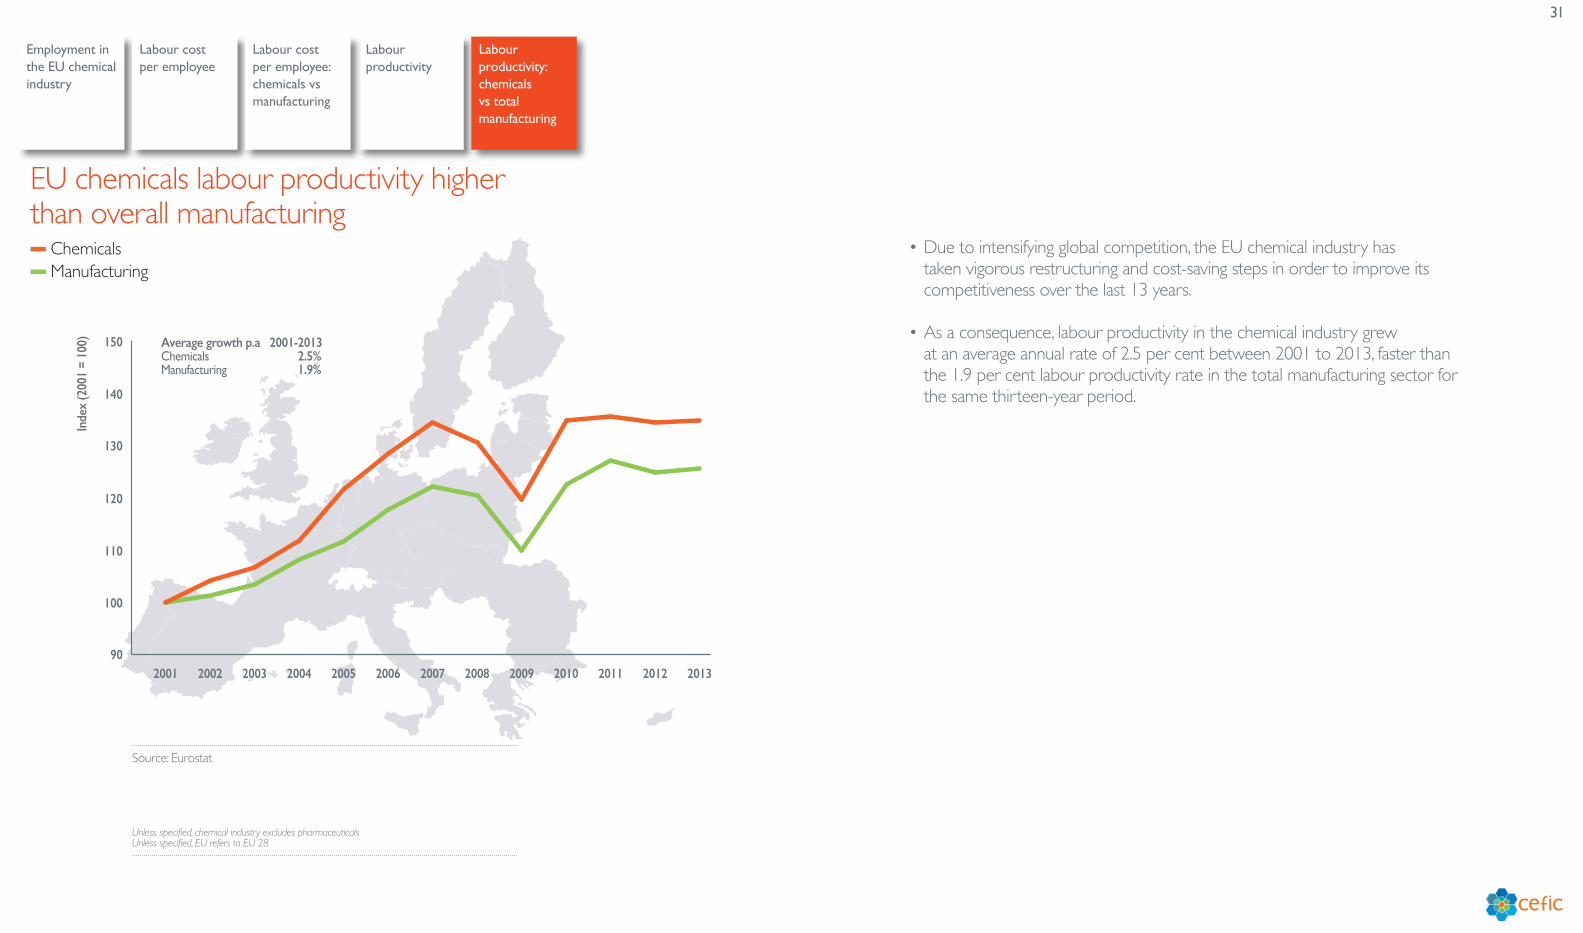
• Due to intensifying global competition, the EU chemical industry has taken vigorous restructuring and cost-saving steps in order to improve its competitiveness over the last 13 years.
• As a consequence, labour productivity in the chemical industry grew at an average annual rate of 2.5 per cent between 2001 to 2013, faster than the 1.9 per cent labour productivity rate in the total manufacturing sector for the same thirteen-year period.
EU chemicals labour productivity higher than overall manufacturing
Source: Eurostat
Unless specified, chemical industry excludes pharmaceuticals Unless specified, EU refers to EU 28
Employment in the EU chemical industry
Labour cost per employee
Labour productivity
Labour cost per employee: chemicals vs manufacturing
Labour productivity: chemicals vs total manufacturing
32
EnergyFuel and power consumption in the EU chemical industry
Fuel and power consumption by source in the EU chemical industry
Energy intensity: chemicals vs total industry
Energy intensity in the EU chemical industry
33
Fuel and power consumption in the EU chemical industry
Fuel and power consumption by source in the EU chemical industry
Energy intensity: chemicals vs total industry
Energy intensity in the EU chemical industry
44
48
52
56
60
64
68
72
2012201120102005200019951990
Mill
ions
of t
onne
s of o
il eq
uiva
lent
67.4
59.758.3 58.4
55.1
57.2 56.6
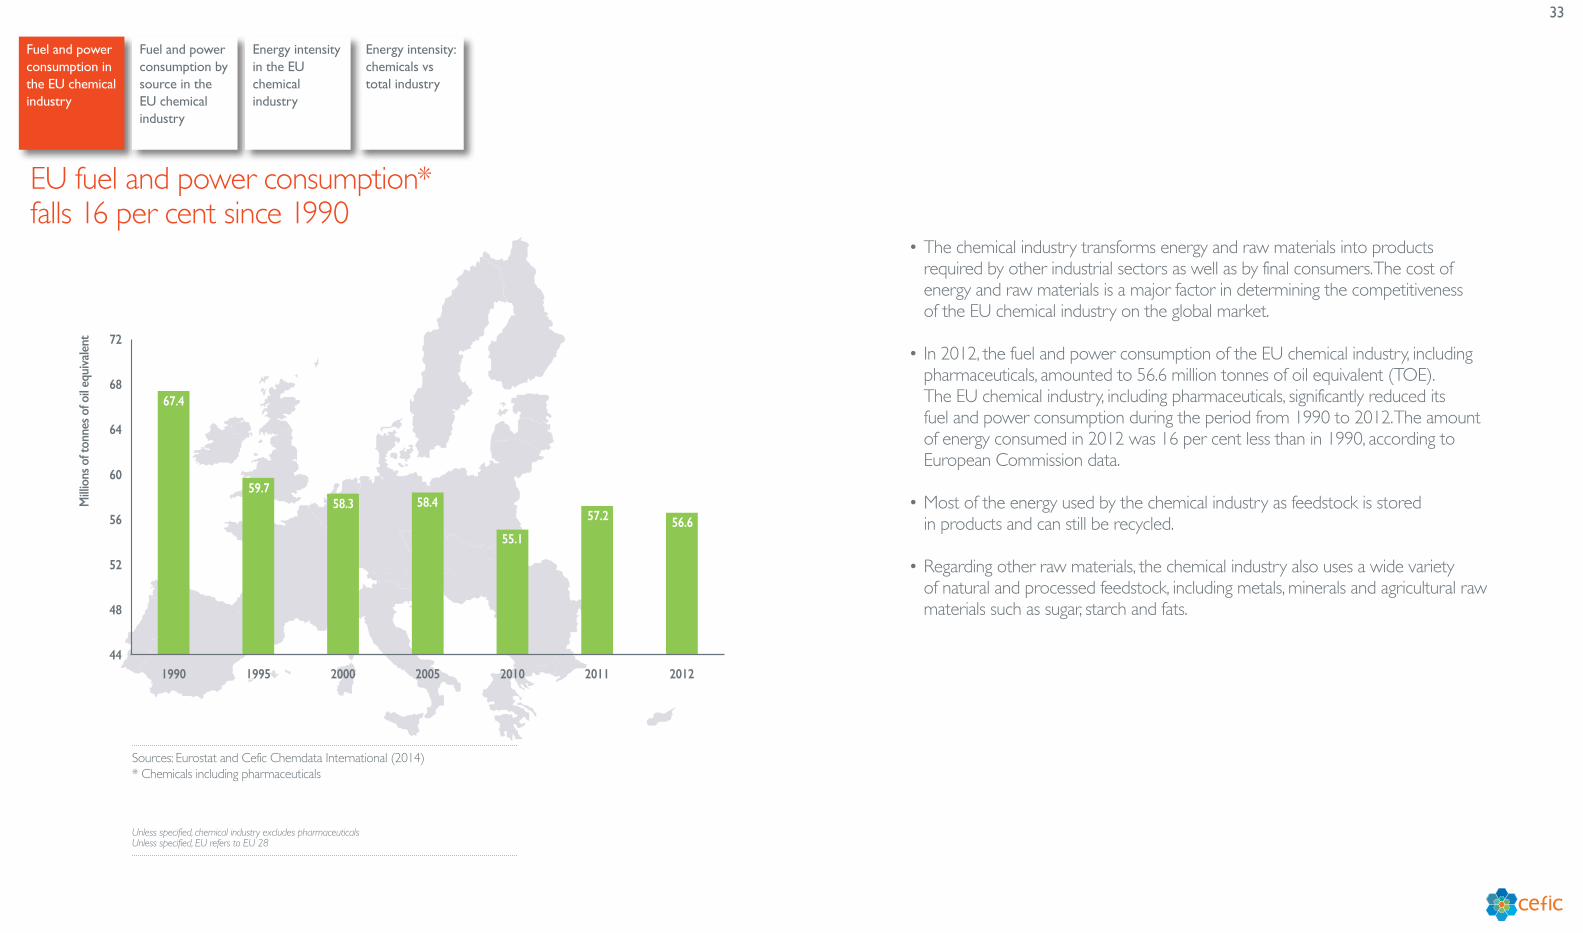
• The chemical industry transforms energy and raw materials into products required by other industrial sectors as well as by final consumers. The cost of energy and raw materials is a major factor in determining the competitiveness of the EU chemical industry on the global market.
• In 2012, the fuel and power consumption of the EU chemical industry, including pharmaceuticals, amounted to 56.6 million tonnes of oil equivalent (TOE). The EU chemical industry, including pharmaceuticals, significantly reduced its fuel and power consumption during the period from 1990 to 2012. The amount of energy consumed in 2012 was 16 per cent less than in 1990, according to European Commission data.
• Most of the energy used by the chemical industry as feedstock is stored in products and can still be recycled.
• Regarding other raw materials, the chemical industry also uses a wide variety of natural and processed feedstock, including metals, minerals and agricultural raw materials such as sugar, starch and fats.
EU fuel and power consumption* falls 16 per cent since 1990
Sources: Eurostat and Cefic Chemdata International (2014) * Chemicals including pharmaceuticals
Unless specified, chemical industry excludes pharmaceuticals Unless specified, EU refers to EU 28
34
Fuel and power consumption in the EU chemical industry
Fuel and power consumption by source in the EU chemical industry*
Energy intensity: chemicals vs total industry
Energy intensity in the EU chemical industry
� Gas � Oil � Electricity
Mill
ions
of t
onne
s of o
il eq
uiva
lent
6
8
10
12
14
16
18
20
22
24
26
28
30
201220102008200620042002200019981996199419921990
27.2
19.2
16.1
9.3
18.2
8.8
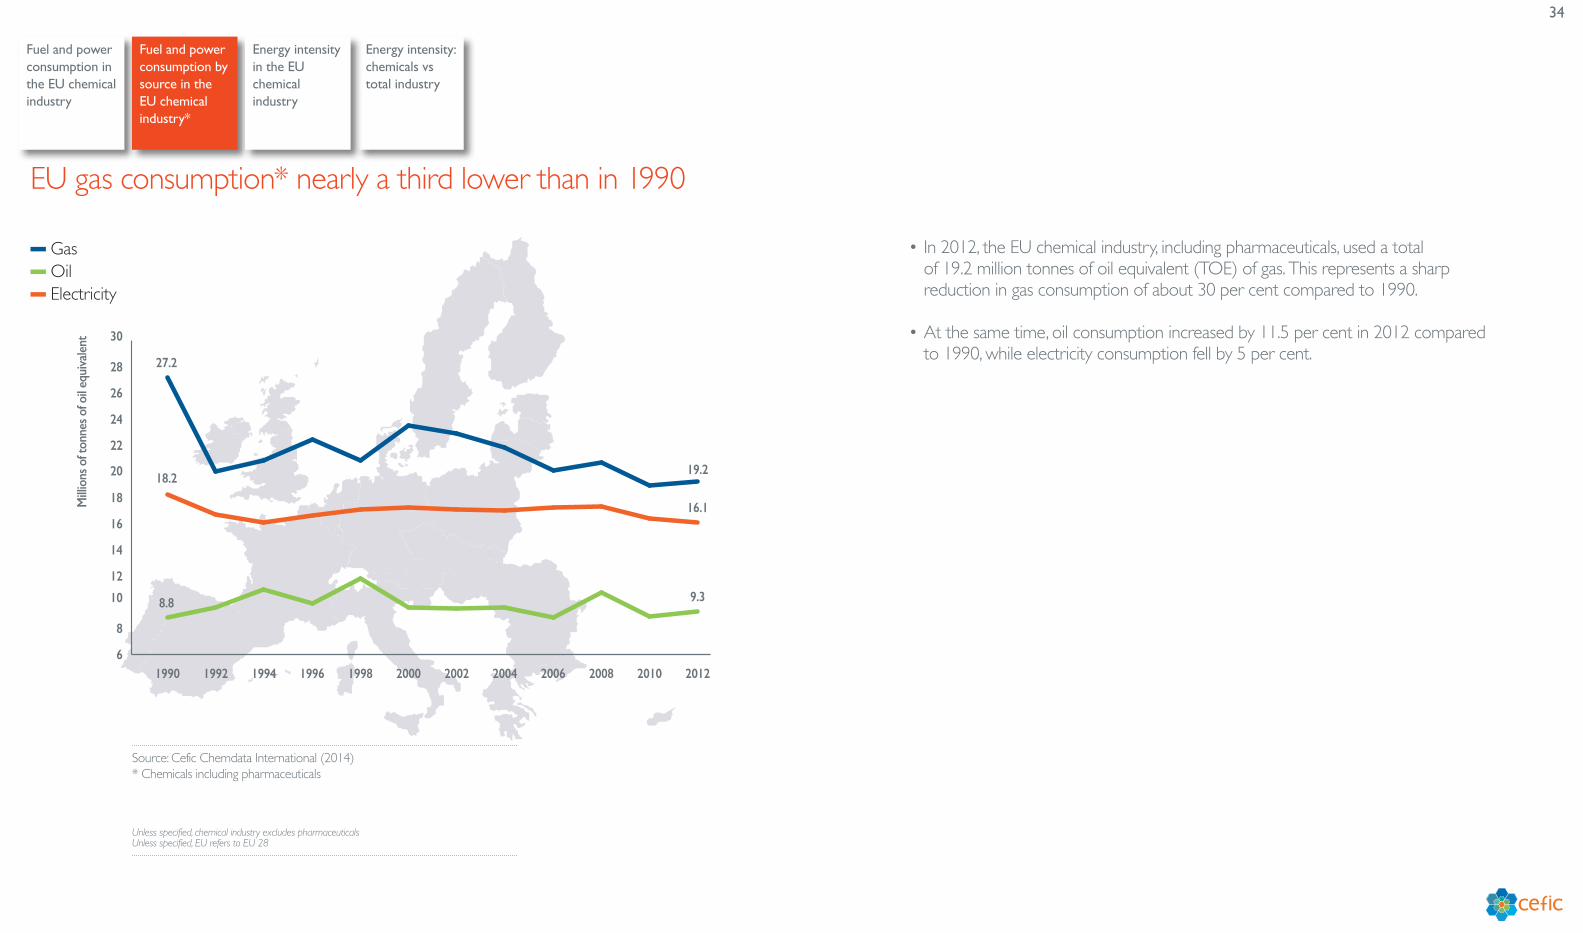
• In 2012, the EU chemical industry, including pharmaceuticals, used a total of 19.2 million tonnes of oil equivalent (TOE) of gas. This represents a sharp reduction in gas consumption of about 30 per cent compared to 1990.
• At the same time, oil consumption increased by 11.5 per cent in 2012 compared to 1990, while electricity consumption fell by 5 per cent.
EU gas consumption* nearly a third lower than in 1990
Source: Cefic Chemdata International (2014) * Chemicals including pharmaceuticals
Unless specified, chemical industry excludes pharmaceuticals Unless specified, EU refers to EU 28
35
Fuel and power consumption in the EU chemical industry
Fuel and power consumption by source in the EU chemical industry
Energy intensity: chemicals vs total industry
Energy intensity in the EU chemical industry
40
50
60
70
80
90
100
110
120
130
140
150
160
170
180
201220102005200019951990
Inde
x (1
990
=100
)
100.0
69.8
57.7 54.7 51.4 52.9
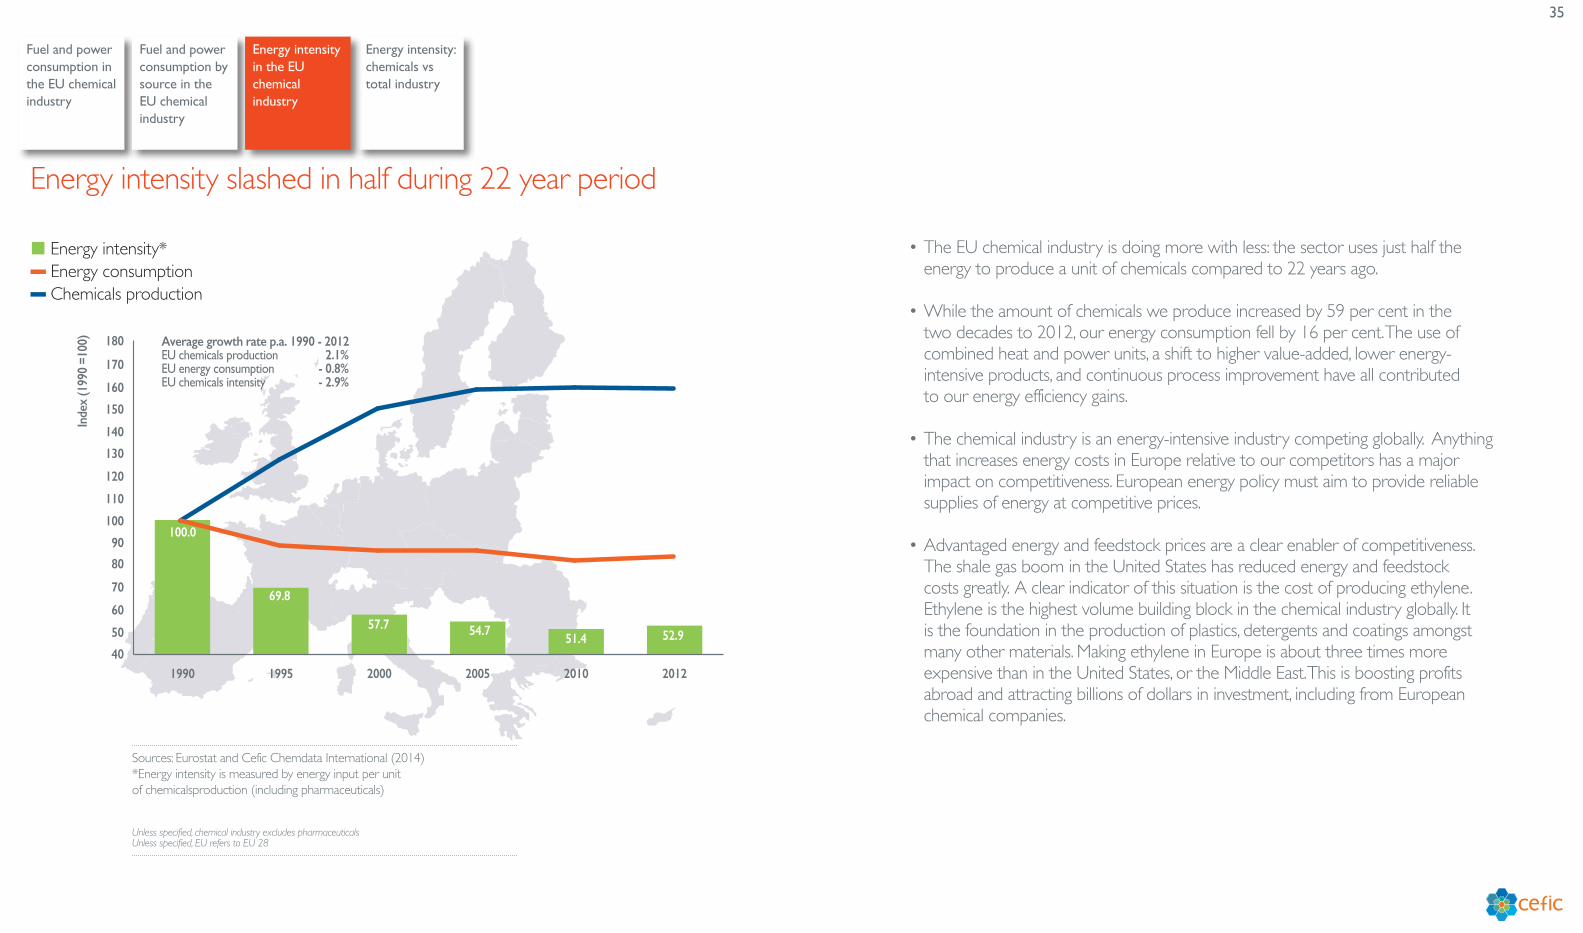
Average growth rate p.a. 1990 - 2012EU chemicals production 2.1%EU energy consumption - 0.8%EU chemicals intensity - 2.9%
� Energy intensity*� Energy consumption � Chemicals production
• The EU chemical industry is doing more with less: the sector uses just half the energy to produce a unit of chemicals compared to 22 years ago.
• While the amount of chemicals we produce increased by 59 per cent in the two decades to 2012, our energy consumption fell by 16 per cent. The use of combined heat and power units, a shift to higher value-added, lower energy-intensive products, and continuous process improvement have all contributed to our energy efficiency gains.
• The chemical industry is an energy-intensive industry competing globally. Anything that increases energy costs in Europe relative to our competitors has a major impact on competitiveness. European energy policy must aim to provide reliable supplies of energy at competitive prices.
• Advantaged energy and feedstock prices are a clear enabler of competitiveness. The shale gas boom in the United States has reduced energy and feedstock costs greatly. A clear indicator of this situation is the cost of producing ethylene. Ethylene is the highest volume building block in the chemical industry globally. It is the foundation in the production of plastics, detergents and coatings amongst many other materials. Making ethylene in Europe is about three times more expensive than in the United States, or the Middle East. This is boosting profits abroad and attracting billions of dollars in investment, including from European chemical companies.
Energy intensity slashed in half during 22 year period
Sources: Eurostat and Cefic Chemdata International (2014)*Energy intensity is measured by energy input per unit of chemicalsproduction (including pharmaceuticals)
Unless specified, chemical industry excludes pharmaceuticals Unless specified, EU refers to EU 28
36
Fuel and power consumption in the EU chemical industry
Fuel and power consumption by source in the EU chemical industry
Energy intensity: chemicals vs total industry
Energy intensity in the EU chemical industry
� Total industry� Chemicals
35
40
45
50
55
60
65
70
75
80
85
90
95
100
105
201220102008200620042002200019981996199419921990
Inde
x (1
990
= 10
0)
Average growth rate p.a. (1990 - 2012)EU chemicals* intensity - 2.9%EU industry intensity - 2.2%
- 39%
- 47%
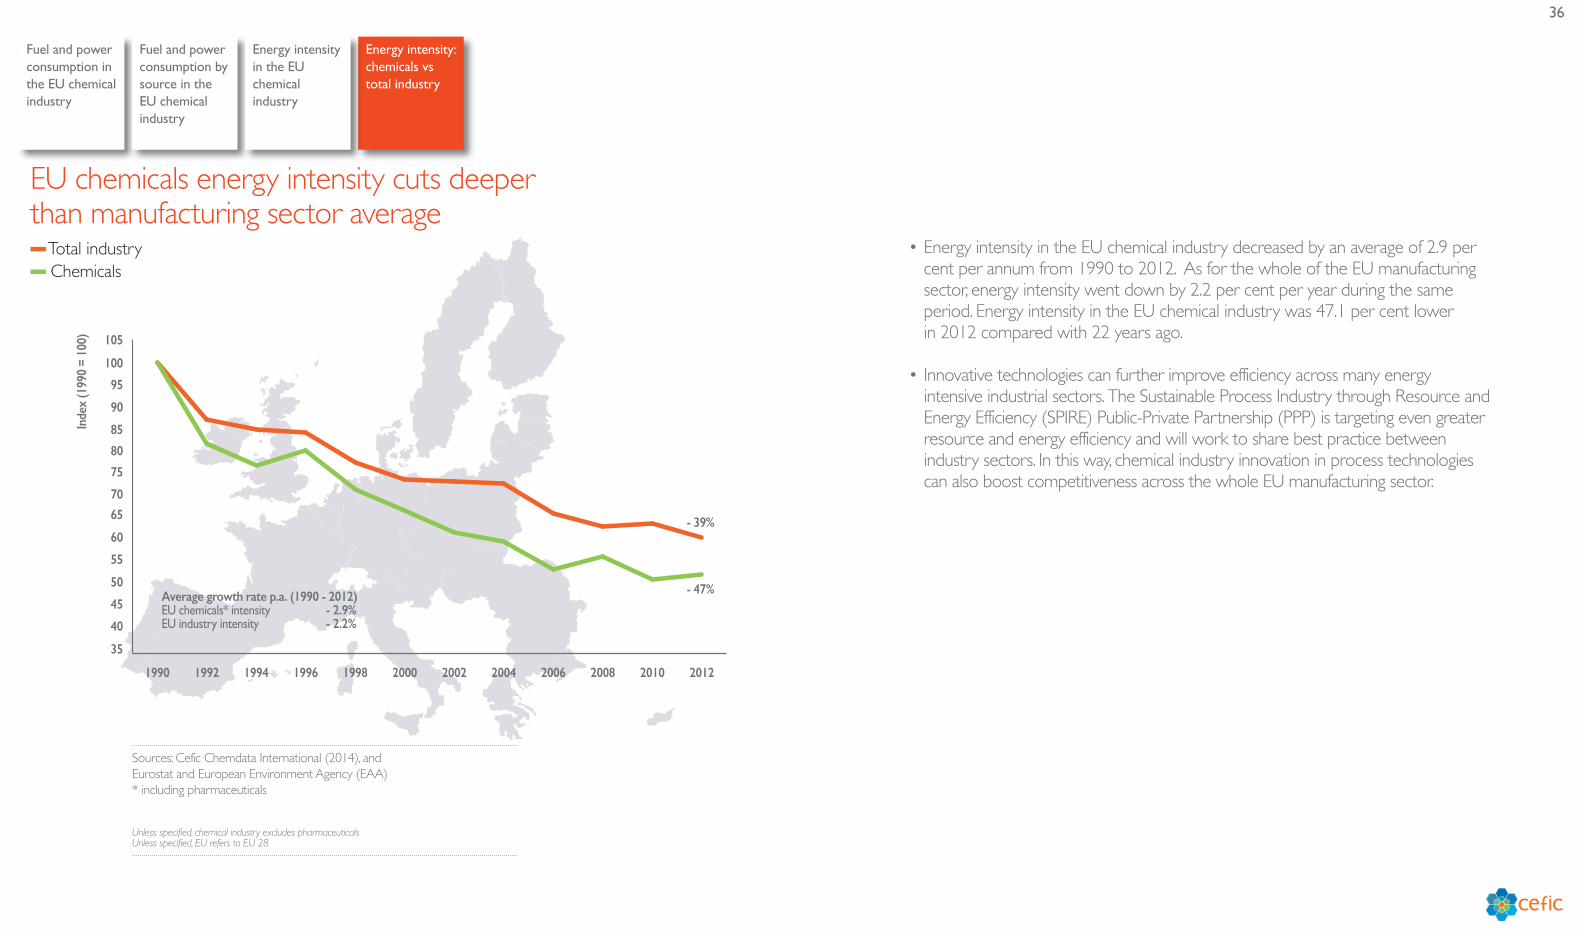
• Energy intensity in the EU chemical industry decreased by an average of 2.9 per cent per annum from 1990 to 2012. As for the whole of the EU manufacturing sector, energy intensity went down by 2.2 per cent per year during the same period. Energy intensity in the EU chemical industry was 47.1 per cent lower in 2012 compared with 22 years ago.
• Innovative technologies can further improve efficiency across many energy intensive industrial sectors. The Sustainable Process Industry through Resource and Energy Efficiency (SPIRE) Public-Private Partnership (PPP) is targeting even greater resource and energy efficiency and will work to share best practice between industry sectors. In this way, chemical industry innovation in process technologies can also boost competitiveness across the whole EU manufacturing sector.
EU chemicals energy intensity cuts deeper than manufacturing sector average
Sources: Cefic Chemdata International (2014), and Eurostat and European Environment Agency (EAA)* including pharmaceuticals
Unless specified, chemical industry excludes pharmaceuticals Unless specified, EU refers to EU 28
37
Capital spending in the EU chemical industry
Capital spending by region
Capital spending intensity by region
Capital Spending
38
Capital spending in the EU chemical industry
Capital spending by region
Capital spending intensity by region
� EU capital spending (€ billion)� EU capital spending (% sales)
€ bi
llion %
0
5
10
15
20
25
30
2013201220102008200620042002200019981996
7
6
5
4
3
2
1
0
18.8
20.8 21.2
5.6%
3.5%
19.2
15.1
18.3
21.2
16.3
19.2 18.6
Average growth rate p.a. 1996 - 2013Sales + 2.7%Capital spending - 0.1%Capital spending (% of sales) - 2.6%
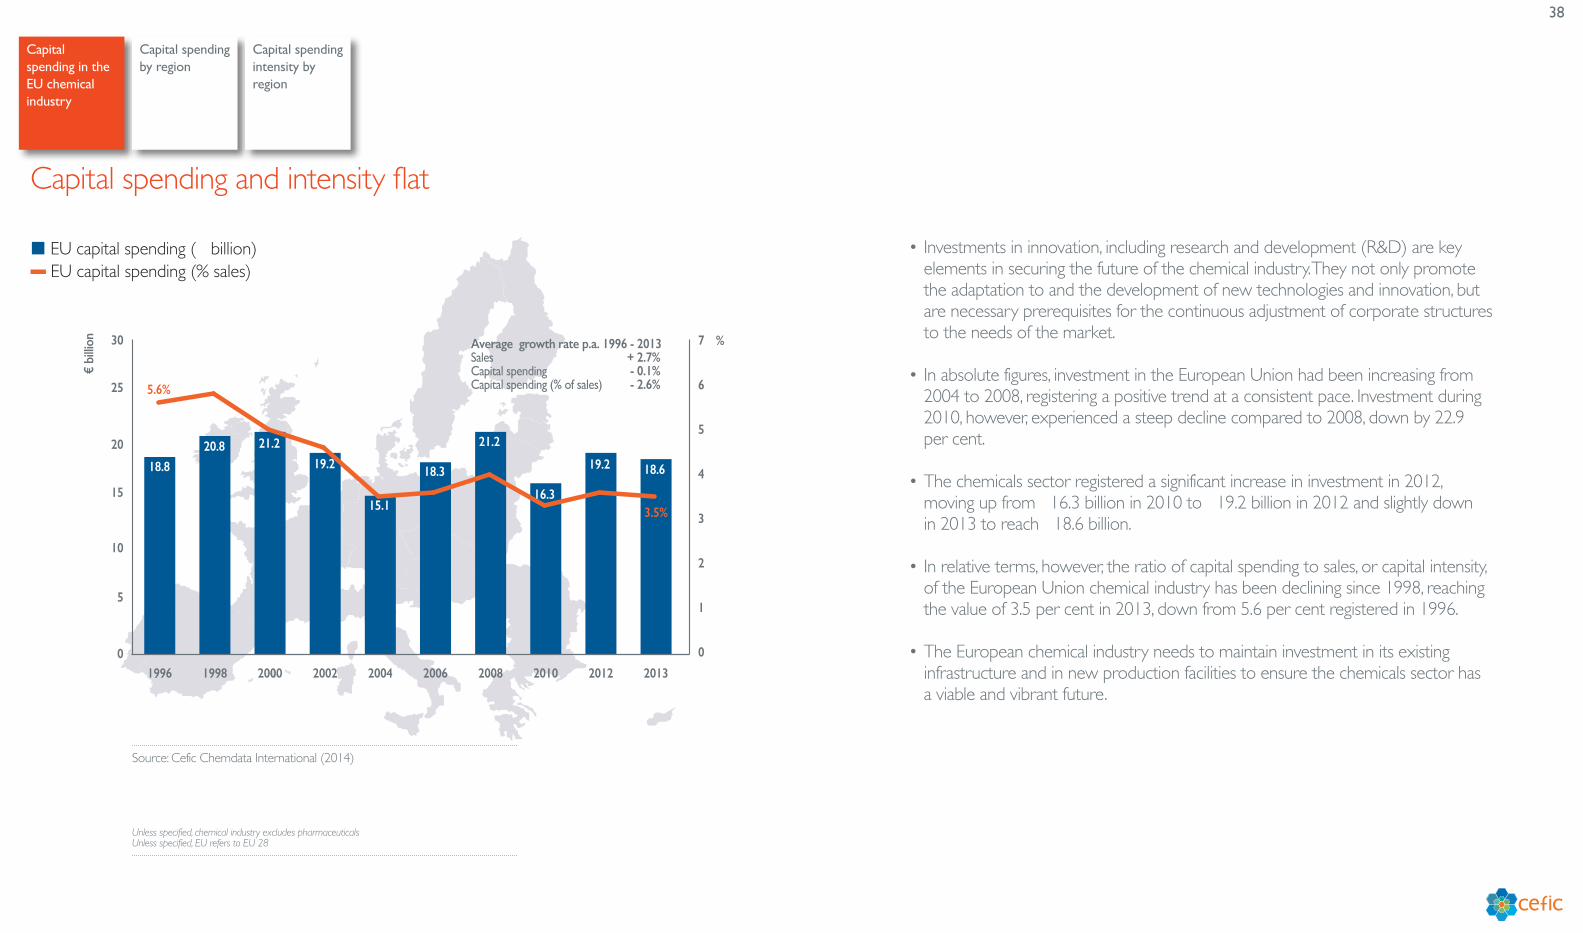
• Investments in innovation, including research and development (R&D) are key elements in securing the future of the chemical industry. They not only promote the adaptation to and the development of new technologies and innovation, but are necessary prerequisites for the continuous adjustment of corporate structures to the needs of the market.
• In absolute figures, investment in the European Union had been increasing from 2004 to 2008, registering a positive trend at a consistent pace. Investment during 2010, however, experienced a steep decline compared to 2008, down by 22.9 per cent.
• The chemicals sector registered a significant increase in investment in 2012, moving up from €16.3 billion in 2010 to €19.2 billion in 2012 and slightly down in 2013 to reach €18.6 billion.
• In relative terms, however, the ratio of capital spending to sales, or capital intensity, of the European Union chemical industry has been declining since 1998, reaching the value of 3.5 per cent in 2013, down from 5.6 per cent registered in 1996.
• The European chemical industry needs to maintain investment in its existing infrastructure and in new production facilities to ensure the chemicals sector has a viable and vibrant future.
Capital spending and intensity flat
Source: Cefic Chemdata International (2014)
Unless specified, chemical industry excludes pharmaceuticals Unless specified, EU refers to EU 28
39
Capital spending in the EU chemical industry
Capital spending by region
Capital spending intensity by region
� 2003 capital spending (€ billion)� 2013 capital spending (€ billion)
6.3
24.0
17.6
18.65.9
6.82.3
6.50.6
3.0
0.8
2.4
EU
JapanSouth Korea
India
Brazil
USA
6.5
66.7
China1.0
4.4
Russia
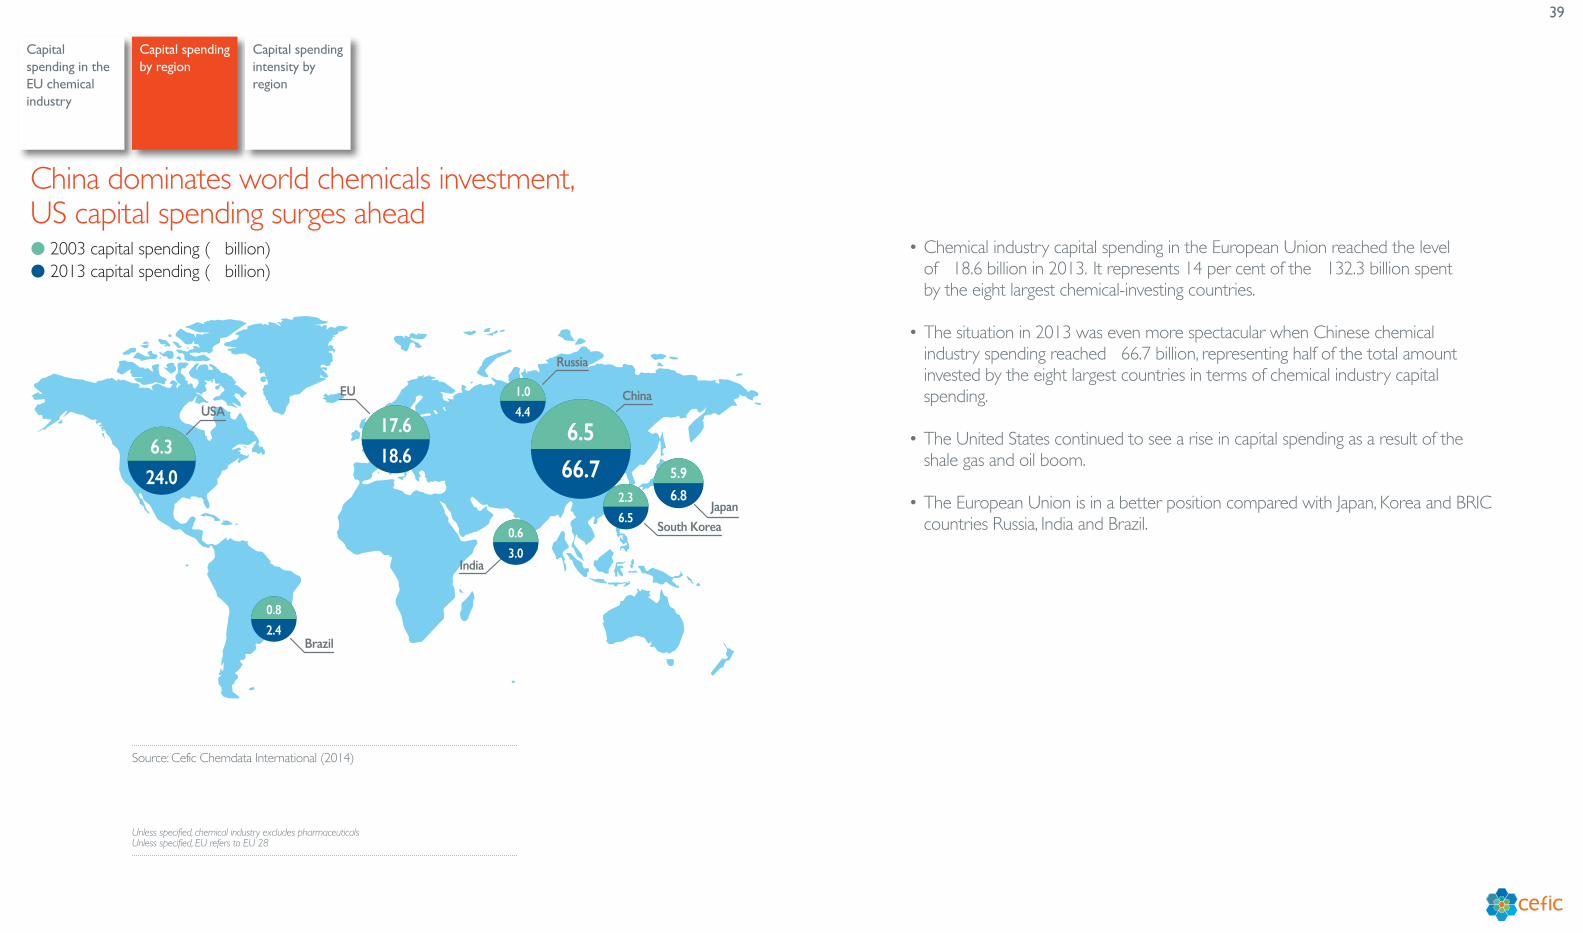
• Chemical industry capital spending in the European Union reached the level of €18.6 billion in 2013. It represents 14 per cent of the €132.3 billion spent by the eight largest chemical-investing countries.
• The situation in 2013 was even more spectacular when Chinese chemical industry spending reached €66.7 billion, representing half of the total amount invested by the eight largest countries in terms of chemical industry capital spending.
• The United States continued to see a rise in capital spending as a result of the shale gas and oil boom.
• The European Union is in a better position compared with Japan, Korea and BRIC countries Russia, India and Brazil.
China dominates world chemicals investment, US capital spending surges ahead
Source: Cefic Chemdata International (2014)
Unless specified, chemical industry excludes pharmaceuticals Unless specified, EU refers to EU 28

40
Capital spending in the EU chemical industry
Capital spending by region
Capital spending intensity by region
� 2003� 2013
Che
mica
ls ca
pita
l spe
ndin
g (%
sale
s)
0
1
2
3
4
5
6
7
8
9
10
BrazilEUIndiaJapanSouth KoreaUSAChinaRussia
5.8
7.9
5.6
6.4
2.1
5.1 5.1 4.9 4.7 4.5
2.4
4.2 4.3
3.5
2.7
3.4
• Capital spending intensity in China and other emerging economies is far higher than in the rest of the world. Capital intensity for China increased from 5.6 per cent in 2003 to 6.4 per cent in 2013. All major chemicals producing countries increased their chemicals spending intensity from 2003 to 2013 apart from two regions: South Korea and the European Union. The European Union continues to lag behind leading chemicals-producing regions and has been registering a constant decline during the past 11 years.
• A key factor affecting competitiveness is investment levels. In the EU we see declining levels of capital spending intensity compared with other regions. Capital intensity is both an indicator of loss of attractiveness as well as a driver of future competitiveness: the more investment the more competitive the region becomes and vice versa. For example, there are nearly 200 chemical investment projects in the United States totalling nearly US$130 billion, while China remains the key target of chemical investment.
• Another factor is the growing cumulative costs of implementing European legislation in the chemicals sector. This takes both personnel and capital resources away from innovation and production and into regulatory compliance.
EU capital intensity far below emerging economies
Source: Cefic Chemdata International (2014)
Unless specified, chemical industry excludes pharmaceuticals Unless specified, EU refers to EU 28
41
R&D Spending
R&D in the EU chemical industry
R&D spending by region
R&D spending intensity by region
42
R&D in the EU chemical industry
R&D spending by region
R&D spending intensity by region
� EU R&D spending (€ billion)� EU R&D spending (% sales)
%
0
1
2
3
4
5
6
7
8
9
10
11
12
201320112006200119961991
4.0
3.5
3.0
2.5
2.0
1.5
1.0
0.5
0.0
8.2
2.8%
1.6%
7.17.9 8.2 8.1 8.4
Average growth rate p.a. 1991 - 2013Sales + 2.7%R&D spending + 0.1%R&D spending (% of sales) - 2.5%
€ bi
llion
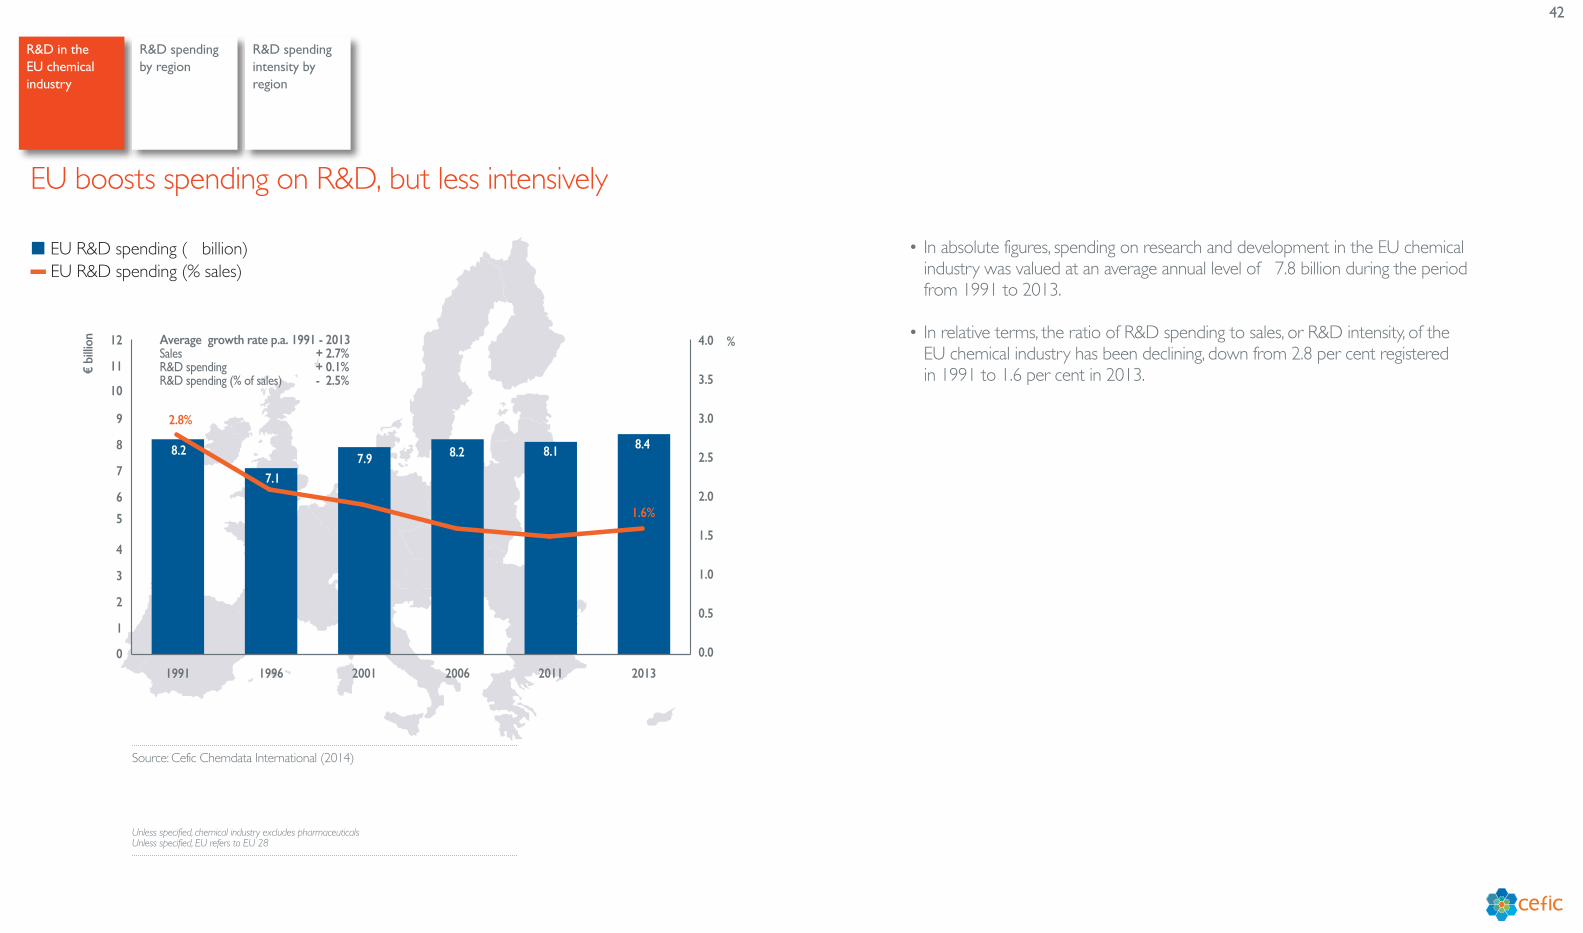
• In absolute figures, spending on research and development in the EU chemical industry was valued at an average annual level of €7.8 billion during the period from 1991 to 2013.
• In relative terms, the ratio of R&D spending to sales, or R&D intensity, of the EU chemical industry has been declining, down from 2.8 per cent registered in 1991 to 1.6 per cent in 2013.
EU boosts spending on R&D, but less intensively
Source: Cefic Chemdata International (2014)
Unless specified, chemical industry excludes pharmaceuticals Unless specified, EU refers to EU 28
43
R&D in the EU chemical industry
R&D spending by region
R&D spending intensity by region
� 2003� 2013
Che
mica
l R&
D sp
endi
ng (€
bill
ion)
0
1
2
3
4
5
6
7
8
9
10
SwitzerlandIndiaSouth KoreaJapanChinaUSAEU 28
7.6
8.4
6.1
7.9
1.3
7.6
6.36.0
0.51.7
0.4 1.2 0.4 0.4
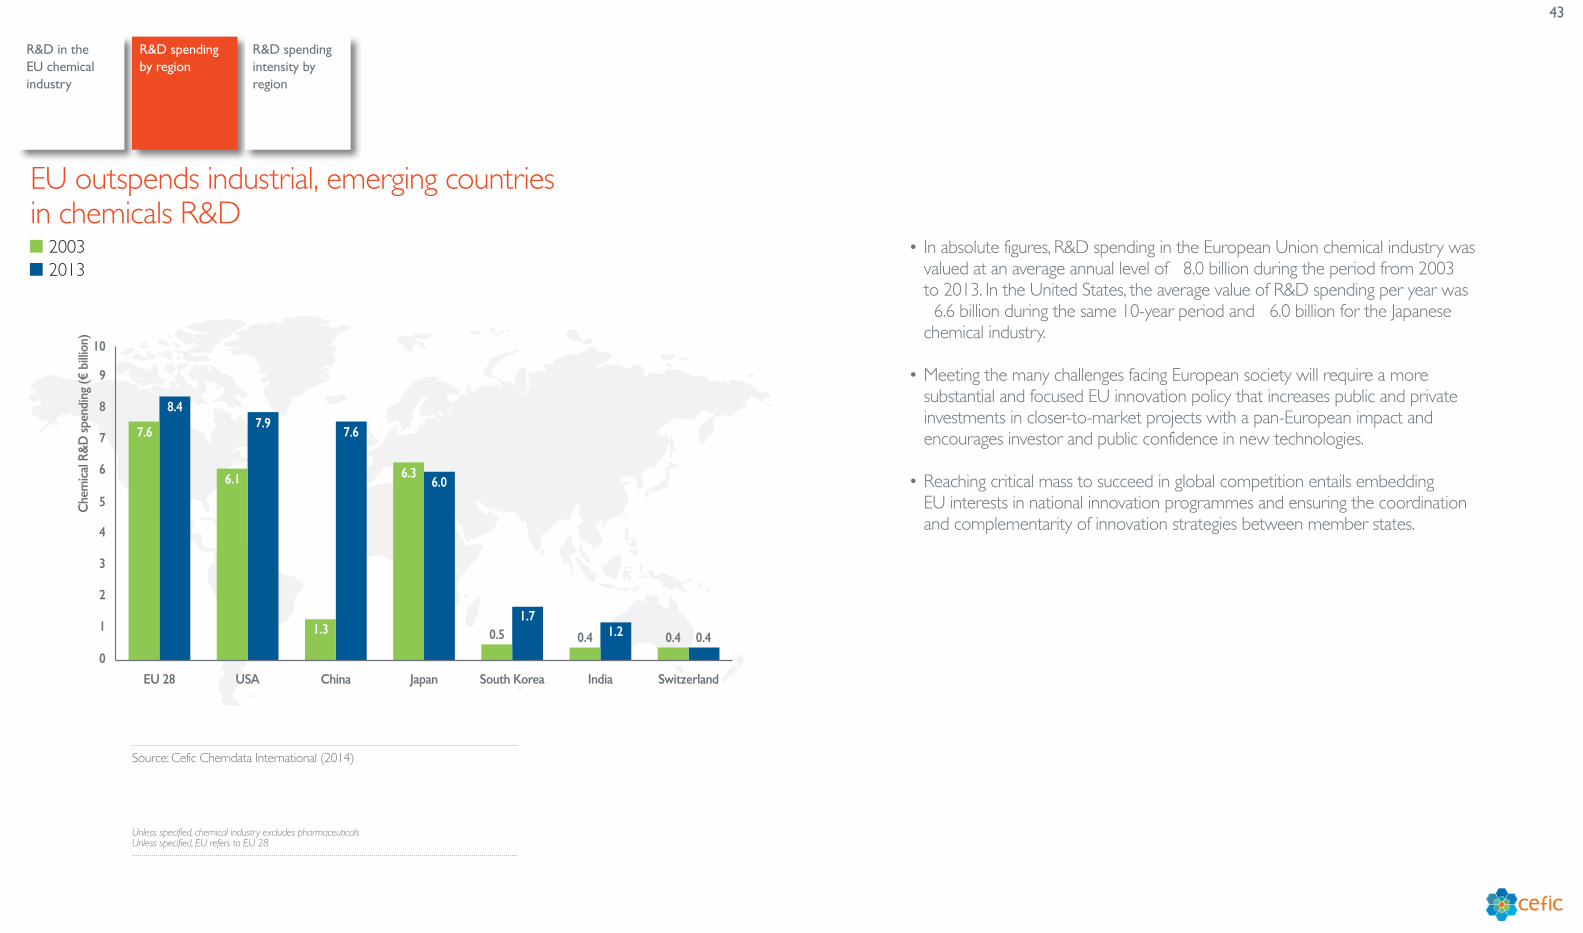
• In absolute figures, R&D spending in the European Union chemical industry was valued at an average annual level of €8.0 billion during the period from 2003 to 2013. In the United States, the average value of R&D spending per year was €6.6 billion during the same 10-year period and €6.0 billion for the Japanese chemical industry.
• Meeting the many challenges facing European society will require a more substantial and focused EU innovation policy that increases public and private investments in closer-to-market projects with a pan-European impact and encourages investor and public confidence in new technologies.
• Reaching critical mass to succeed in global competition entails embedding EU interests in national innovation programmes and ensuring the coordination and complementarity of innovation strategies between member states.
EU outspends industrial, emerging countriesin chemicals R&D
Source: Cefic Chemdata International (2014)
Unless specified, chemical industry excludes pharmaceuticals Unless specified, EU refers to EU 28
44
R&D in the EU chemical industry
R&D spending by region
R&D spending intensity by region
� R&D spending intensity 2003 (% of sales)� R&D spending intensity 2013 (% of sales)
5.1
4.01.6
1.6
1.8
1.62.1
1.7
EU
India
USA
1.1
0.7
ChinaJapan
1.2
1.3South Korea
3.7
2.8Switzerland
0.2
0.1
Russia
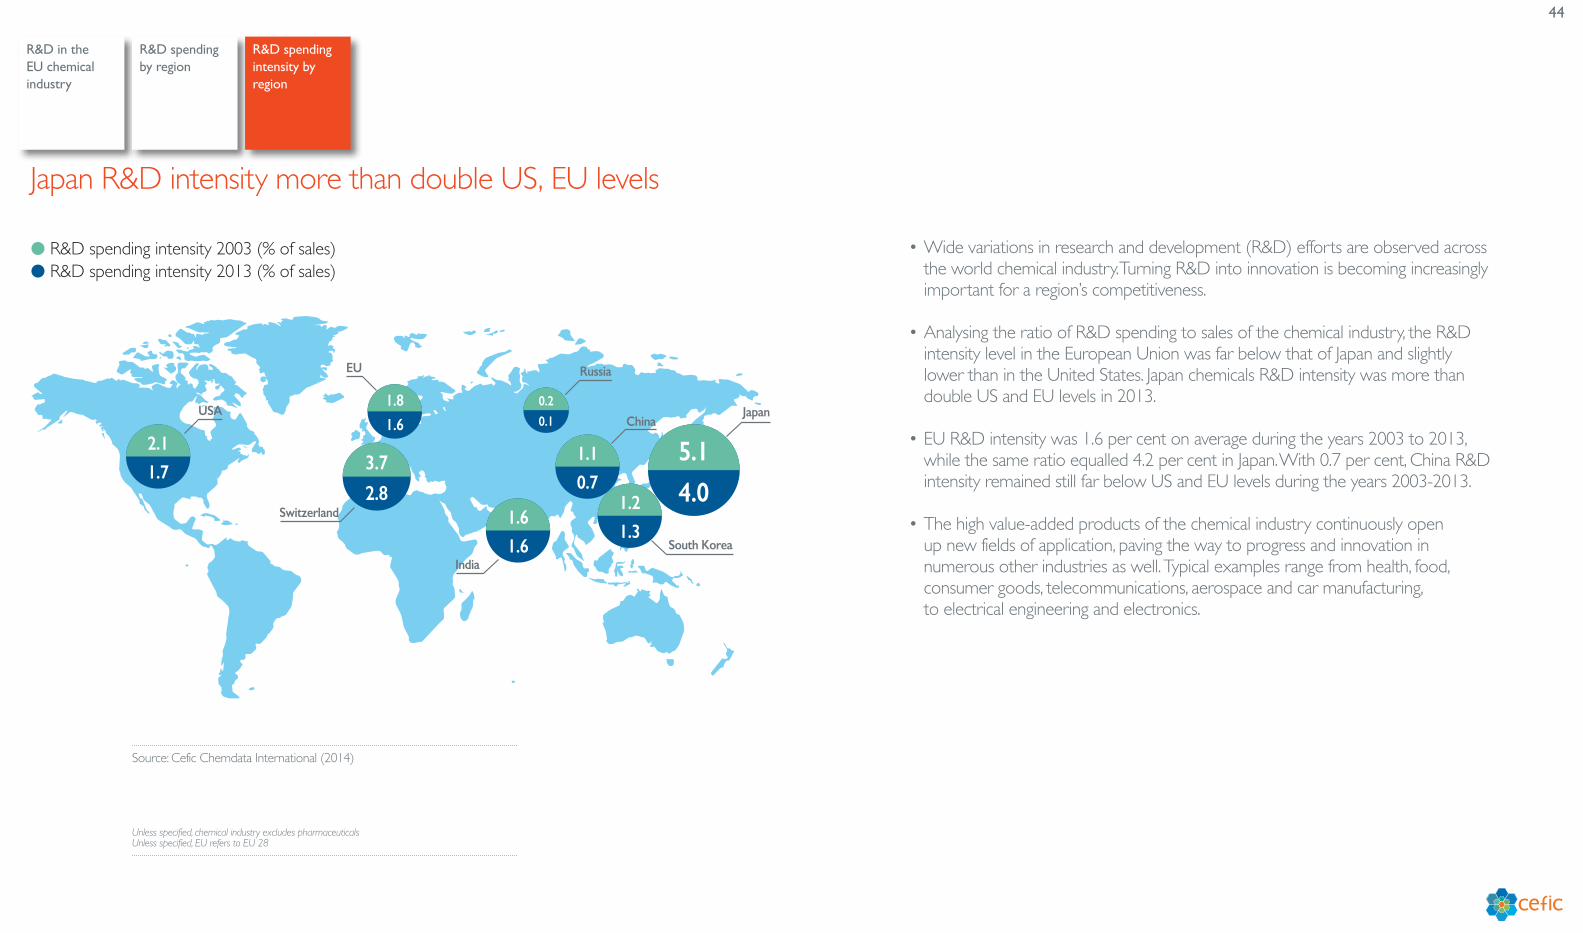
• Wide variations in research and development (R&D) efforts are observed across the world chemical industry. Turning R&D into innovation is becoming increasingly important for a region’s competitiveness.
• Analysing the ratio of R&D spending to sales of the chemical industry, the R&D intensity level in the European Union was far below that of Japan and slightly lower than in the United States. Japan chemicals R&D intensity was more than double US and EU levels in 2013.
• EU R&D intensity was 1.6 per cent on average during the years 2003 to 2013, while the same ratio equalled 4.2 per cent in Japan. With 0.7 per cent, China R&D intensity remained still far below US and EU levels during the years 2003-2013.
• The high value-added products of the chemical industry continuously open up new fields of application, paving the way to progress and innovation in numerous other industries as well. Typical examples range from health, food, consumer goods, telecommunications, aerospace and car manufacturing, to electrical engineering and electronics.
Japan R&D intensity more than double US, EU levels
Source: Cefic Chemdata International (2014)
Unless specified, chemical industry excludes pharmaceuticals Unless specified, EU refers to EU 28

45
Sustainable Development
Total greenhouse gas emissions in the EU chemical industry
Acidifying emissions
Water quality-nitrogen and phosphorous emissions
Greenhouse gas emissions and production
Non-methane volatile organic compounds emissions to air
Safety and health at work
Greenhouse gas emissions per unit of energy consumption and per unit of production
Emissions to water
46
Total greenhouse gas emissions in the EU chemical industry
Greenhouse gas emissions and production
Greenhouse gas emissions per unit of energy consumption and per unit of production
Mill
ions
of t
onne
s (C
O2 e
quiv
alen
t)
020406080
100120140160
180200220240260280300320340
201220102008200620042002200019981996199419921990
330
295 303320
275
244
218 223205
192
161151
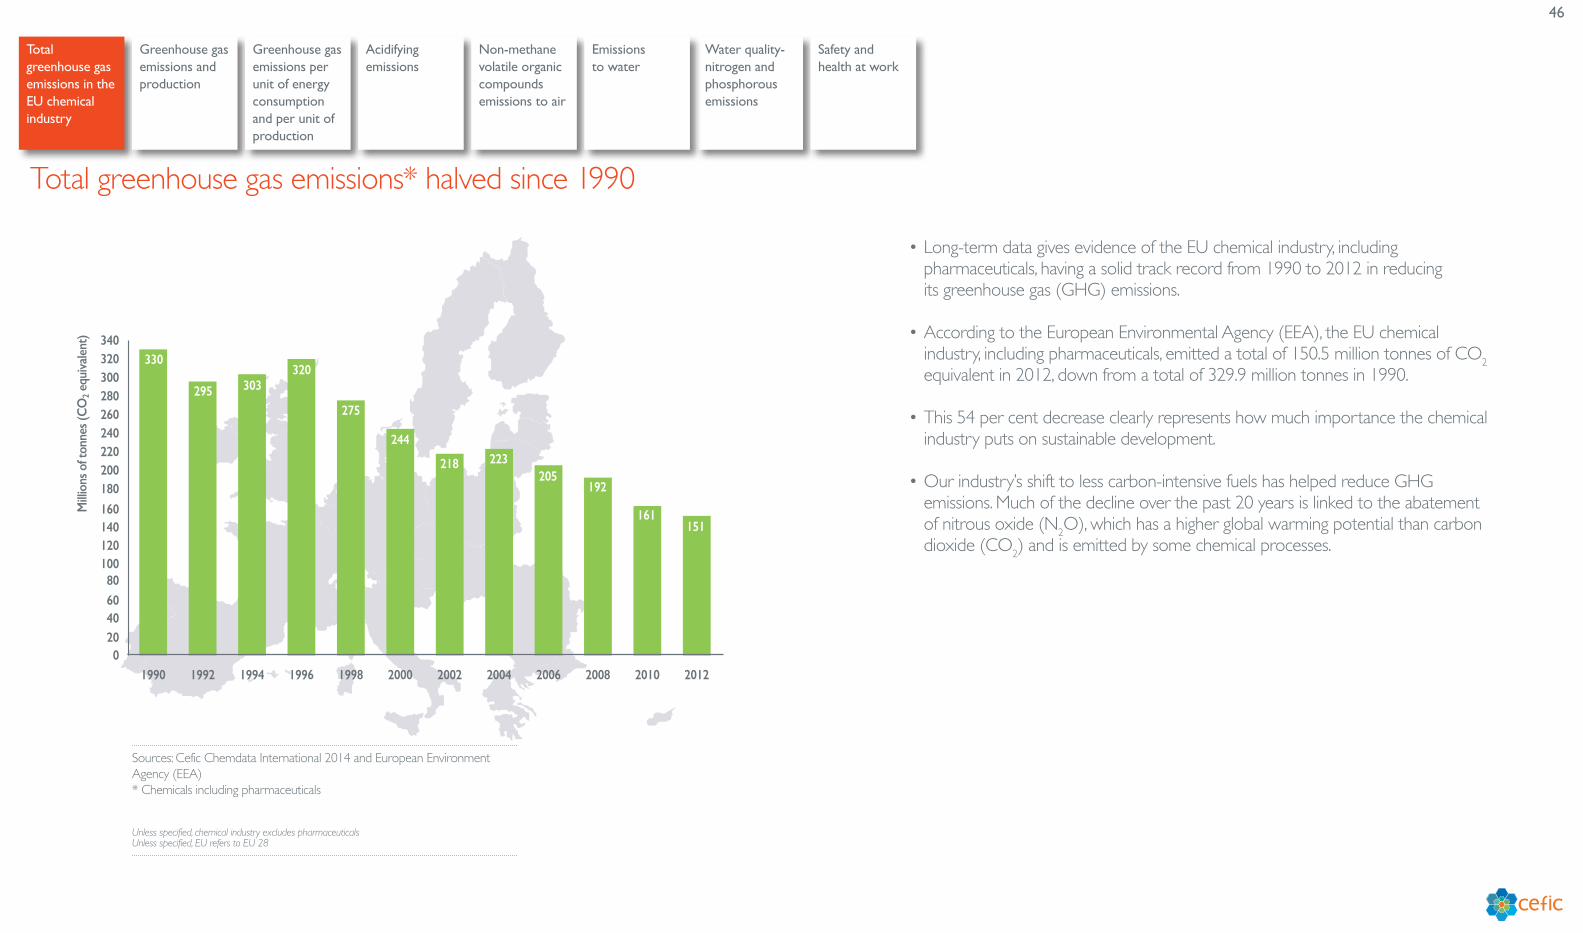
• Long-term data gives evidence of the EU chemical industry, including pharmaceuticals, having a solid track record from 1990 to 2012 in reducing its greenhouse gas (GHG) emissions.
• According to the European Environmental Agency (EEA), the EU chemical industry, including pharmaceuticals, emitted a total of 150.5 million tonnes of CO2 equivalent in 2012, down from a total of 329.9 million tonnes in 1990.
• This 54 per cent decrease clearly represents how much importance the chemical industry puts on sustainable development.
• Our industry’s shift to less carbon-intensive fuels has helped reduce GHG emissions. Much of the decline over the past 20 years is linked to the abatement of nitrous oxide (N2O), which has a higher global warming potential than carbon dioxide (CO2) and is emitted by some chemical processes.
Total greenhouse gas emissions* halved since 1990
Sources: Cefic Chemdata International 2014 and European Environment Agency (EEA) * Chemicals including pharmaceuticals
Unless specified, chemical industry excludes pharmaceuticals Unless specified, EU refers to EU 28
Acidifying emissions
Water quality-nitrogen and phosphorous emissions
Non-methane volatile organic compounds emissions to air
Safety and health at work
Emissions to water
47
Total greenhouse gas emissions in the EU chemical industry
Greenhouse gas emissions and production
Greenhouse gas emissions per unit of energy consumption and per unit of production
� Greenhouse gas emissions� Chemicals production*
Inde
x (1
990
= 10
0)
40
50
60
70
80
90
100
110
120
130
140
150
160
170
180
201320102005200019951990
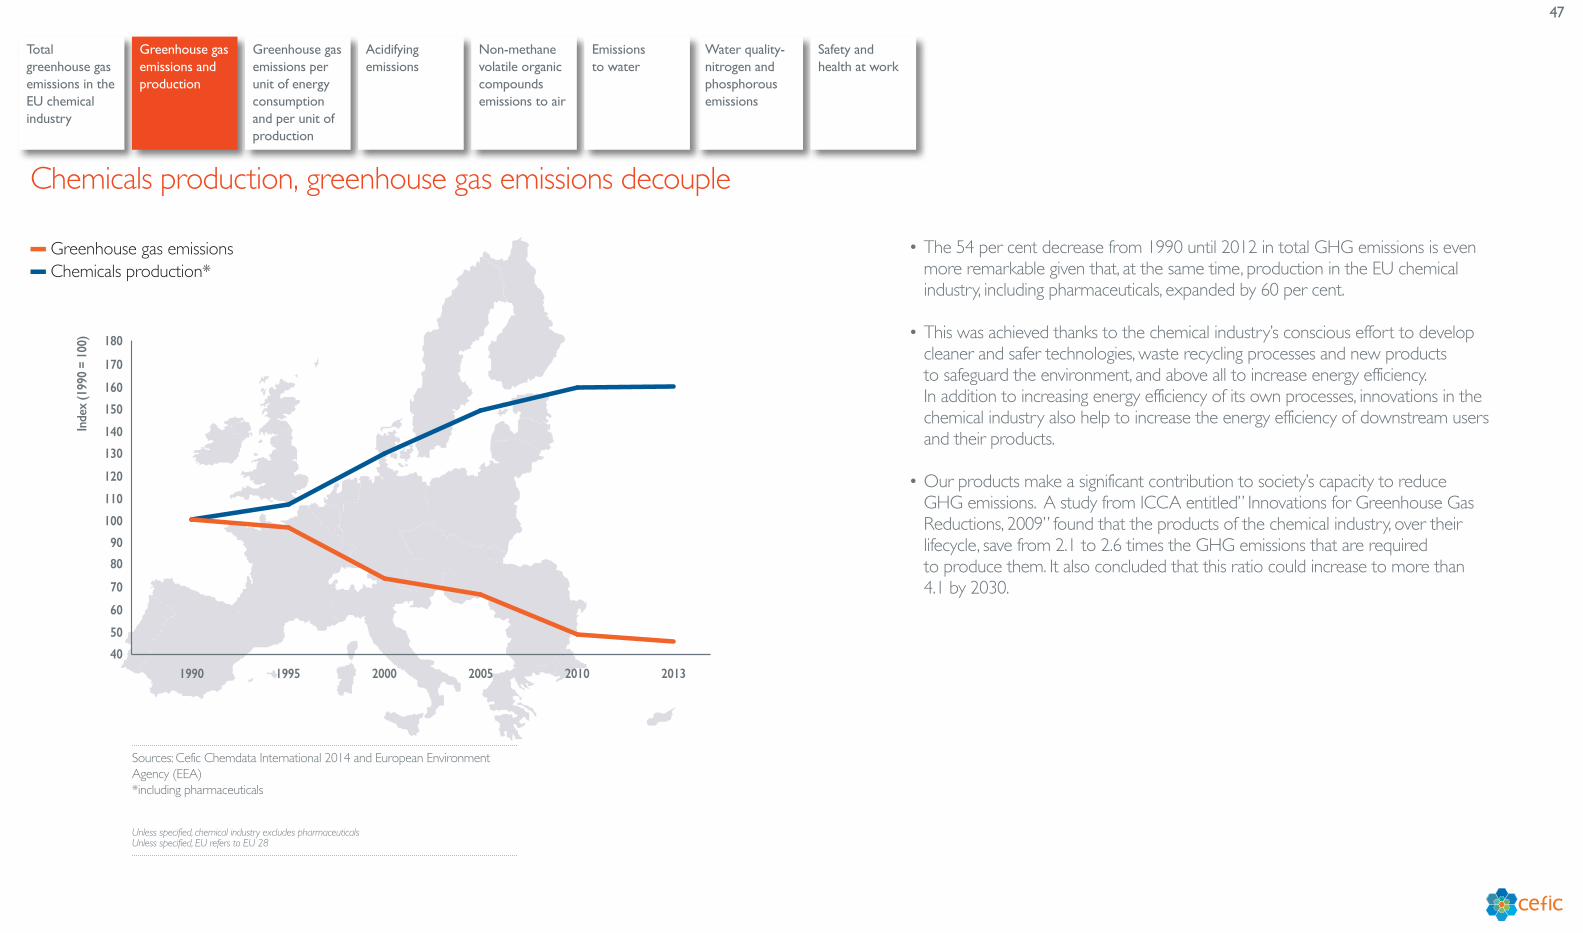
• The 54 per cent decrease from 1990 until 2012 in total GHG emissions is even more remarkable given that, at the same time, production in the EU chemical industry, including pharmaceuticals, expanded by 60 per cent.
• This was achieved thanks to the chemical industry’s conscious effort to develop cleaner and safer technologies, waste recycling processes and new products to safeguard the environment, and above all to increase energy efficiency. In addition to increasing energy efficiency of its own processes, innovations in the chemical industry also help to increase the energy efficiency of downstream users and their products.
• Our products make a significant contribution to society’s capacity to reduce GHG emissions. A study from ICCA entitled” Innovations for Greenhouse Gas Reductions, 2009” found that the products of the chemical industry, over their lifecycle, save from 2.1 to 2.6 times the GHG emissions that are required to produce them. It also concluded that this ratio could increase to more than 4.1 by 2030.
Chemicals production, greenhouse gas emissions decouple
Sources: Cefic Chemdata International 2014 and European Environment Agency (EEA) *including pharmaceuticals
Unless specified, chemical industry excludes pharmaceuticals Unless specified, EU refers to EU 28
Acidifying emissions
Water quality-nitrogen and phosphorous emissions
Non-methane volatile organic compounds emissions to air
Safety and health at work
Emissions to water
48
Total greenhouse gas emissions in the EU chemical industry
Greenhouse gas emissions and production
Greenhouse gas emissions per unit of energy consumption and per unit of production
� Greenhouse gas emissions per unit of energy consumption� GHG intensity (greenhouse gas emissions per unit of production)
Inde
x (1
990
= 10
0)
20
30
40
50
60
70
80
90
100
110
120
201320102005200019951990
- 46%
- 71%
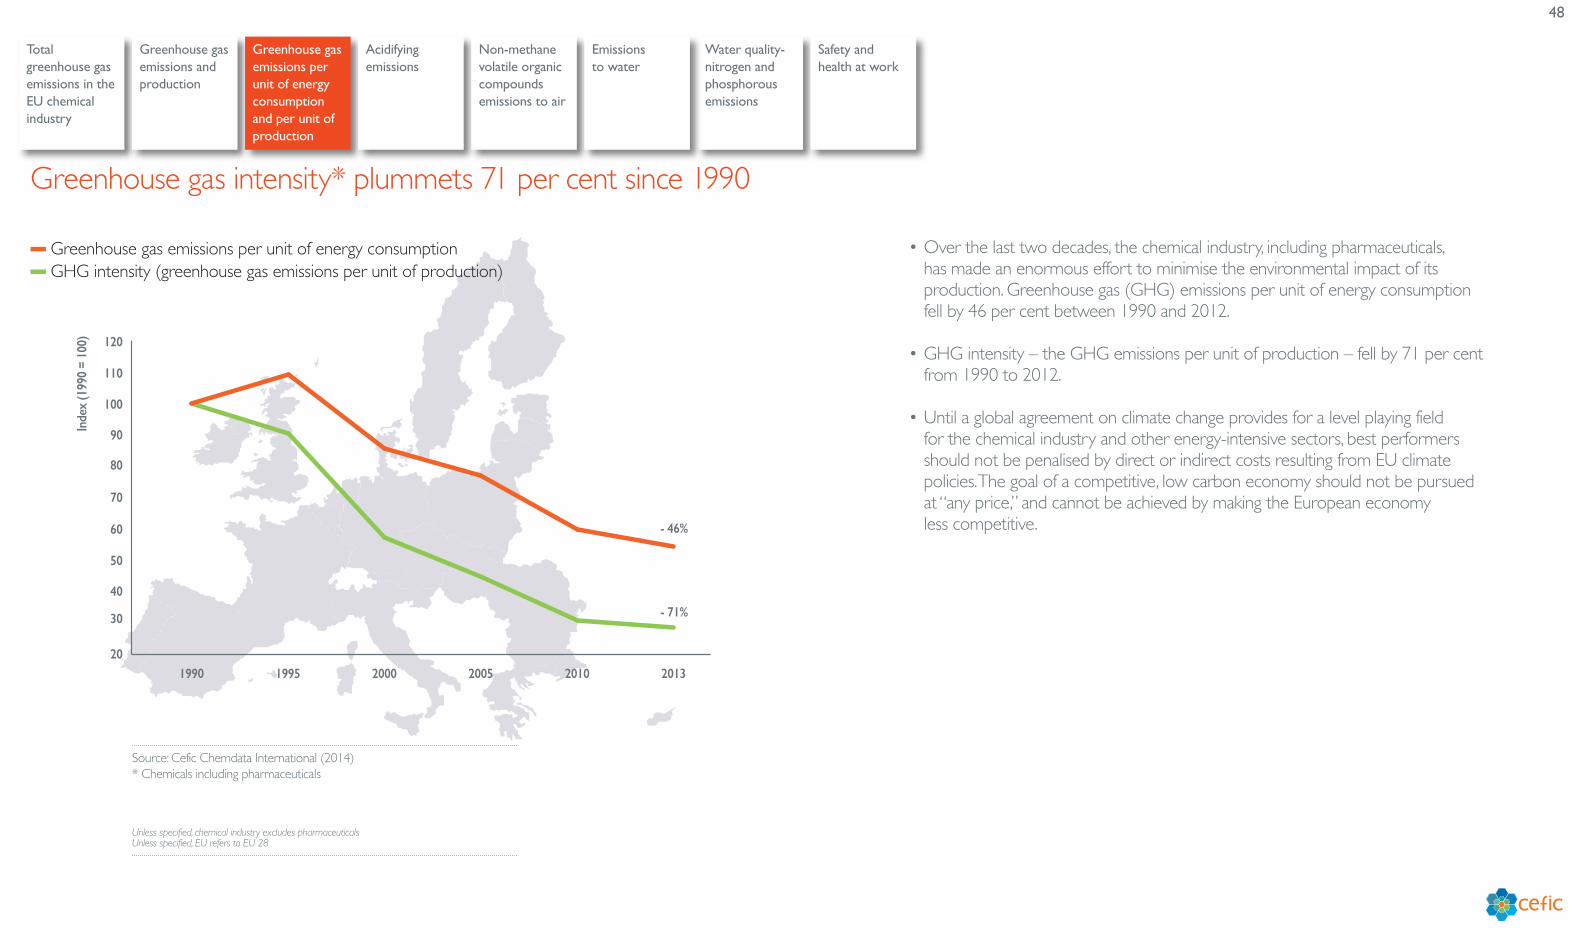
• Over the last two decades, the chemical industry, including pharmaceuticals, has made an enormous effort to minimise the environmental impact of its production. Greenhouse gas (GHG) emissions per unit of energy consumption fell by 46 per cent between 1990 and 2012.
• GHG intensity – the GHG emissions per unit of production – fell by 71 per cent from 1990 to 2012.
• Until a global agreement on climate change provides for a level playing field for the chemical industry and other energy-intensive sectors, best performers should not be penalised by direct or indirect costs resulting from EU climate policies. The goal of a competitive, low carbon economy should not be pursued at “any price,” and cannot be achieved by making the European economy less competitive.
Greenhouse gas intensity* plummets 71 per cent since 1990
Source: Cefic Chemdata International (2014) * Chemicals including pharmaceuticals
Unless specified, chemical industry excludes pharmaceuticals Unless specified, EU refers to EU 28
Acidifying emissions
Water quality-nitrogen and phosphorous emissions
Non-methane volatile organic compounds emissions to air
Safety and health at work
Emissions to water
49
Total greenhouse gas emissions in the EU chemical industry
Greenhouse gas emissions and production
Greenhouse gas emissions per unit of energy consumption and per unit of production
� EU15 Acidifying gas emissions* (Million Aeq)� EU10/12 Acidifying gas emissions* (Million Aeq)� EU Specific acidifying gas emissions (per tonne unit, 2001 = 100)
Mili
on o
f acid
equ
ival
ent (
Mill
ion
Aeq
)
Inde
x (2
001
= 10
0)
0
2,000
4,000
6,000
8,000
10,000
12,000
14,000
16,000
2012(EU 27)
2011(EU 27)
2010(EU 27)
2009(EU 27)
2008(EU 27)
2007(EU 27)
2004(EU 25)
2001(EU15)
0
20
40
60
80
100
120
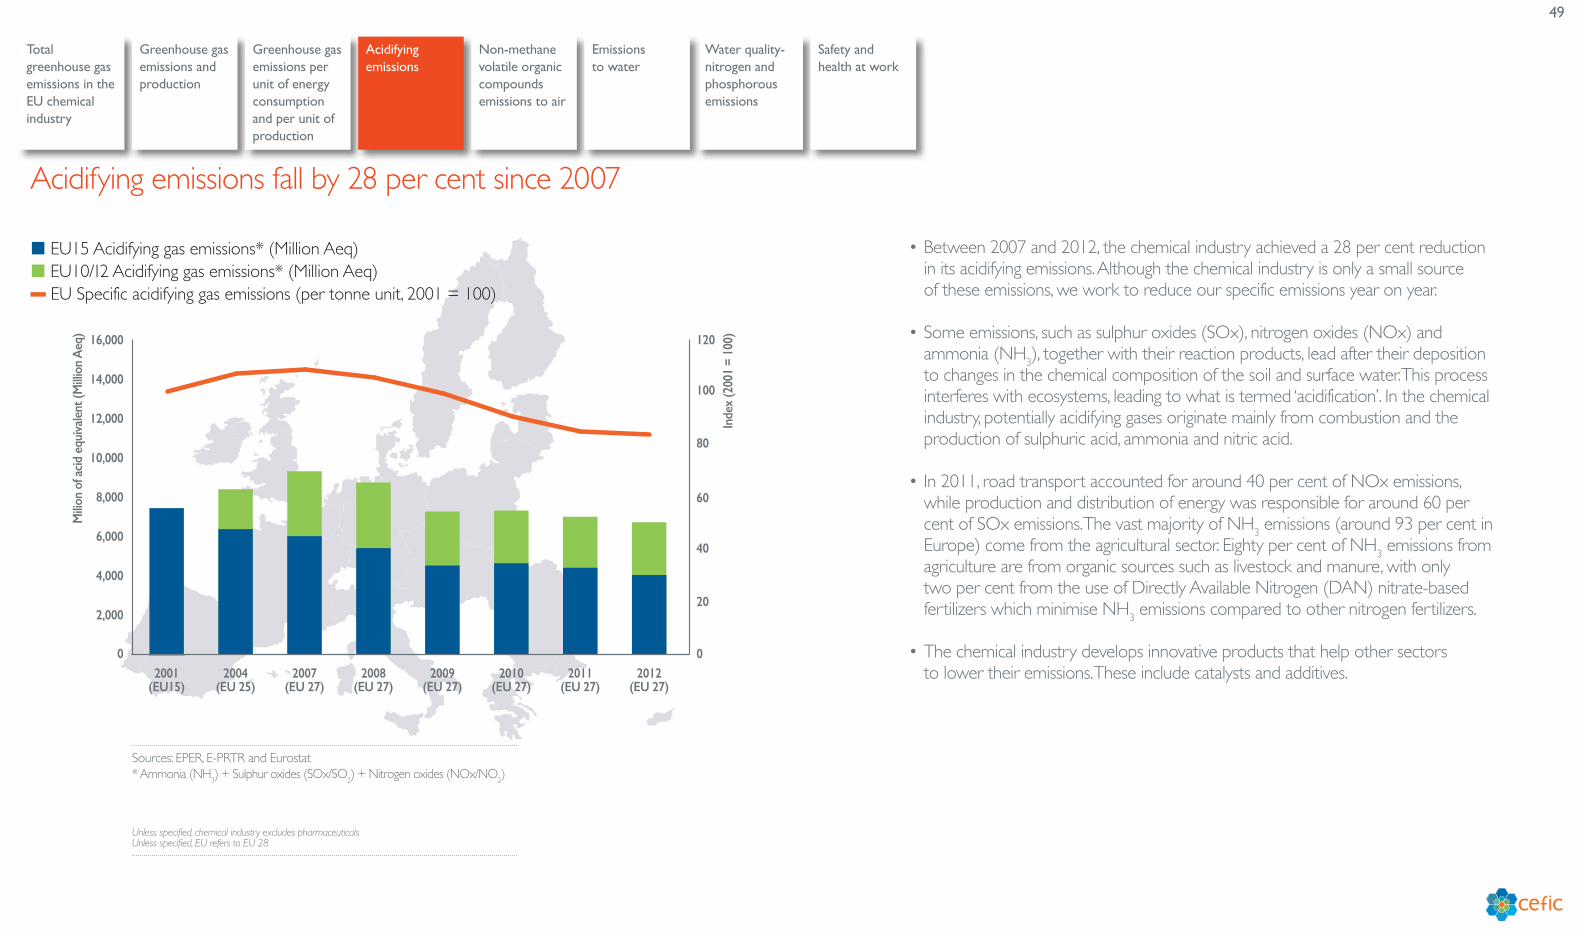
• Between 2007 and 2012, the chemical industry achieved a 28 per cent reduction in its acidifying emissions. Although the chemical industry is only a small source of these emissions, we work to reduce our specific emissions year on year.
• Some emissions, such as sulphur oxides (SOx), nitrogen oxides (NOx) and ammonia (NH3), together with their reaction products, lead after their deposition to changes in the chemical composition of the soil and surface water. This process interferes with ecosystems, leading to what is termed ‘acidification’. In the chemical industry, potentially acidifying gases originate mainly from combustion and the production of sulphuric acid, ammonia and nitric acid.
• In 2011, road transport accounted for around 40 per cent of NOx emissions, while production and distribution of energy was responsible for around 60 per cent of SOx emissions. The vast majority of NH3 emissions (around 93 per cent in Europe) come from the agricultural sector. Eighty per cent of NH3 emissions from agriculture are from organic sources such as livestock and manure, with only two per cent from the use of Directly Available Nitrogen (DAN) nitrate-based fertilizers which minimise NH3 emissions compared to other nitrogen fertilizers.
• The chemical industry develops innovative products that help other sectors to lower their emissions. These include catalysts and additives.
Acidifying emissions fall by 28 per cent since 2007
Sources: EPER, E-PRTR and Eurostat* Ammonia (NH3) + Sulphur oxides (SOx/SO2) + Nitrogen oxides (NOx/NO2)
Unless specified, chemical industry excludes pharmaceuticals Unless specified, EU refers to EU 28
Acidifying emissions
Water quality-nitrogen and phosphorous emissions
Non-methane volatile organic compounds emissions to air
Safety and health at work
Emissions to water
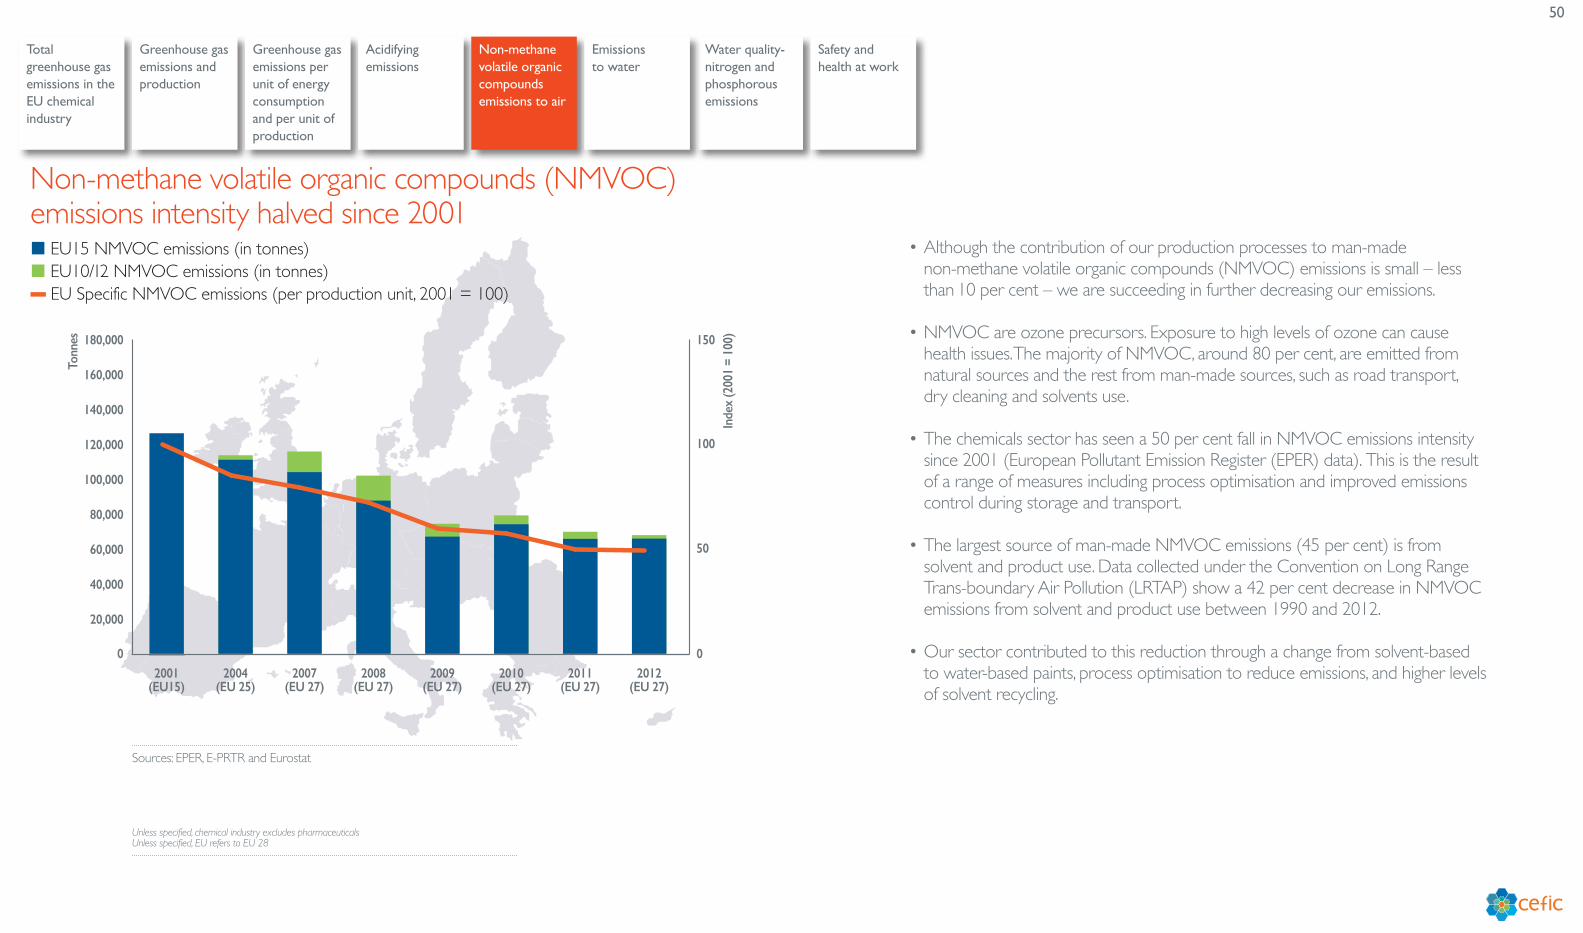
50
Total greenhouse gas emissions in the EU chemical industry
Greenhouse gas emissions and production
Greenhouse gas emissions per unit of energy consumption and per unit of production
0
20,000
40,000
60,000
80,000
100,000
120,000
140,000
160,000
180,000
2012(EU 27)
2011(EU 27)
2010(EU 27)
2009(EU 27)
2008(EU 27)
2007(EU 27)
2004(EU 25)
2001(EU15)
� EU15 NMVOC emissions (in tonnes)� EU10/12 NMVOC emissions (in tonnes)� EU Specific NMVOC emissions (per production unit, 2001 = 100)
Tonn
es
Inde
x (2
001
= 10
0)
0
50
100
150
• Although the contribution of our production processes to man-made non-methane volatile organic compounds (NMVOC) emissions is small – less than 10 per cent – we are succeeding in further decreasing our emissions.
• NMVOC are ozone precursors. Exposure to high levels of ozone can cause health issues. The majority of NMVOC, around 80 per cent, are emitted from natural sources and the rest from man-made sources, such as road transport, dry cleaning and solvents use.
• The chemicals sector has seen a 50 per cent fall in NMVOC emissions intensity since 2001 (European Pollutant Emission Register (EPER) data). This is the result of a range of measures including process optimisation and improved emissions control during storage and transport.
• The largest source of man-made NMVOC emissions (45 per cent) is from solvent and product use. Data collected under the Convention on Long Range Trans-boundary Air Pollution (LRTAP) show a 42 per cent decrease in NMVOC emissions from solvent and product use between 1990 and 2012.
• Our sector contributed to this reduction through a change from solvent-based to water-based paints, process optimisation to reduce emissions, and higher levels of solvent recycling.
Non-methane volatile organic compounds (NMVOC) emissions intensity halved since 2001
Sources: EPER, E-PRTR and Eurostat
Unless specified, chemical industry excludes pharmaceuticals Unless specified, EU refers to EU 28
Acidifying emissions
Water quality-nitrogen and phosphorous emissions
Non-methane volatile organic compounds emissions to air
Safety and health at work
Emissions to water
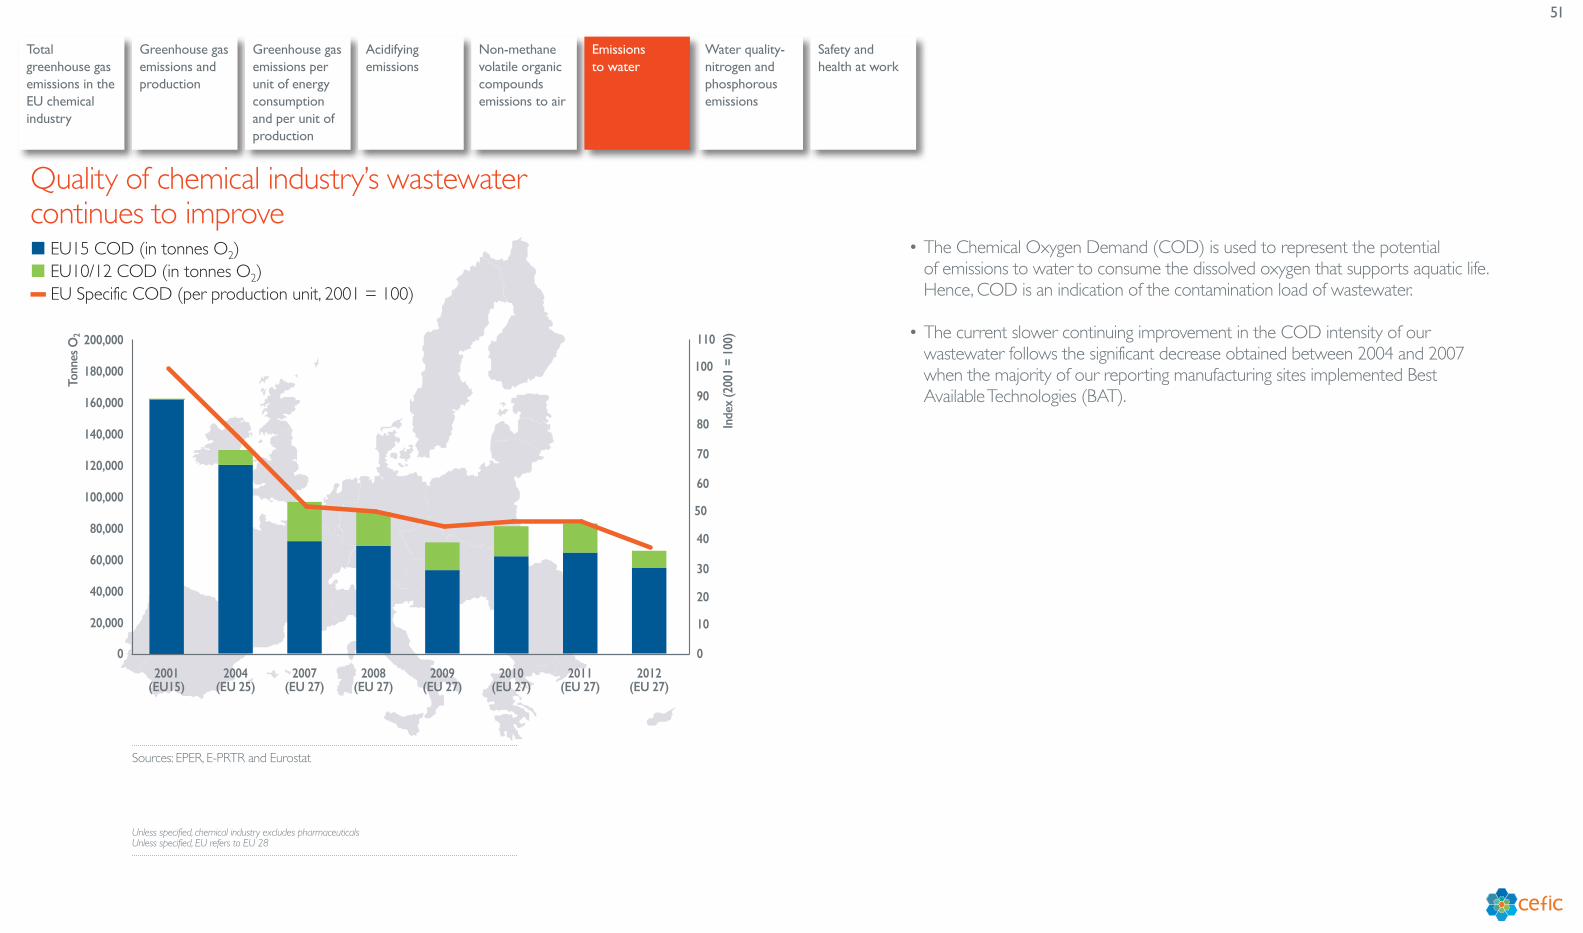
51
Total greenhouse gas emissions in the EU chemical industry
Greenhouse gas emissions and production
Greenhouse gas emissions per unit of energy consumption and per unit of production
� EU15 COD (in tonnes O2)� EU10/12 COD (in tonnes O2)� EU Specific COD (per production unit, 2001 = 100)
Tonn
es O
2
Inde
x (2
001
= 10
0)
0
20,000
40,000
60,000
80,000
100,000
120,000
140,000
160,000
180,000
200,000
2012(EU 27)
2011(EU 27)
2010(EU 27)
2009(EU 27)
2008(EU 27)
2007(EU 27)
2004(EU 25)
2001(EU15)
0
10
20
30
40
50
60
70
80
90
100
110
• The Chemical Oxygen Demand (COD) is used to represent the potential of emissions to water to consume the dissolved oxygen that supports aquatic life. Hence, COD is an indication of the contamination load of wastewater.
• The current slower continuing improvement in the COD intensity of our wastewater follows the significant decrease obtained between 2004 and 2007 when the majority of our reporting manufacturing sites implemented Best Available Technologies (BAT).
Quality of chemical industry’s wastewater continues to improve
Sources: EPER, E-PRTR and Eurostat
Unless specified, chemical industry excludes pharmaceuticals Unless specified, EU refers to EU 28
Acidifying emissions
Water quality-nitrogen and phosphorous emissions
Non-methane volatile organic compounds emissions to air
Safety and health at work
Emissions to water
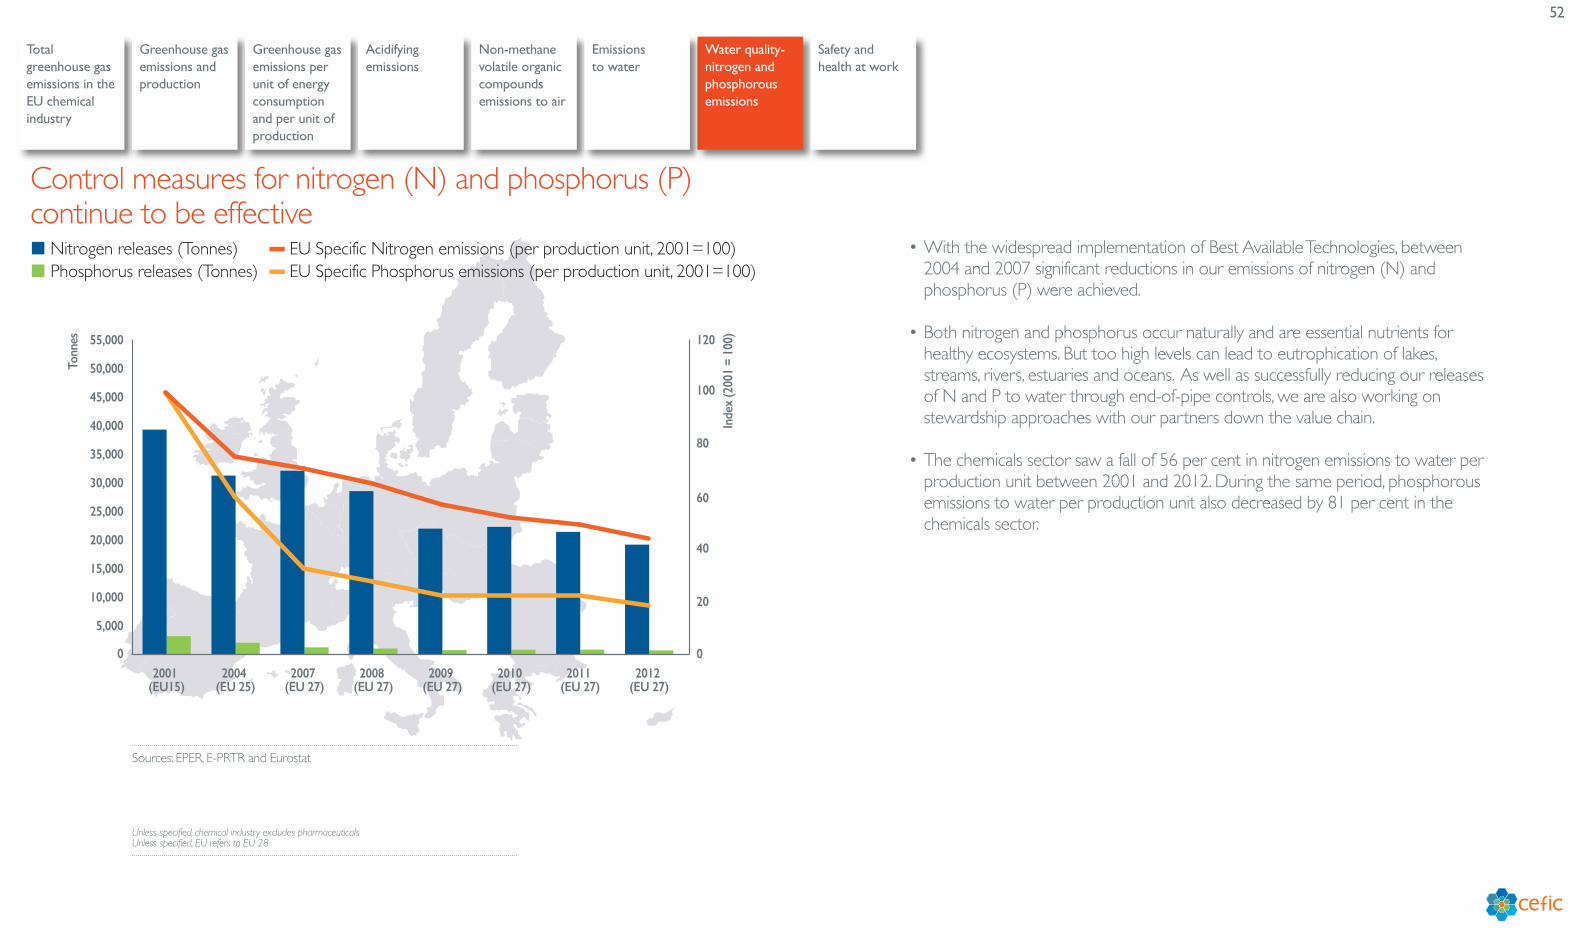
52
Total greenhouse gas emissions in the EU chemical industry
Greenhouse gas emissions and production
Greenhouse gas emissions per unit of energy consumption and per unit of production
� Nitrogen releases (Tonnes)� Phosphorus releases (Tonnes)
� EU Specific Nitrogen emissions (per production unit, 2001=100) � EU Specific Phosphorus emissions (per production unit, 2001=100)
Tonn
es
Inde
x (2
001
= 10
0)
0
5,000
10,000
15,000
20,000
25,000
30,000
35,000
40,000
45,000
50,000
55,000
2012 (EU 27)
2011 (EU 27)
2010 (EU 27)
2009 (EU 27)
2008 (EU 27)
2007 (EU 27)
2004 (EU 25)
2001 (EU15)
0
20
40
60
80
100
120
• With the widespread implementation of Best Available Technologies, between 2004 and 2007 significant reductions in our emissions of nitrogen (N) and phosphorus (P) were achieved.
• Both nitrogen and phosphorus occur naturally and are essential nutrients for healthy ecosystems. But too high levels can lead to eutrophication of lakes, streams, rivers, estuaries and oceans. As well as successfully reducing our releases of N and P to water through end-of-pipe controls, we are also working on stewardship approaches with our partners down the value chain.
• The chemicals sector saw a fall of 56 per cent in nitrogen emissions to water per production unit between 2001 and 2012. During the same period, phosphorous emissions to water per production unit also decreased by 81 per cent in the chemicals sector.
Control measures for nitrogen (N) and phosphorus (P) continue to be effective
Sources: EPER, E-PRTR and Eurostat
Unless specified, chemical industry excludes pharmaceuticals Unless specified, EU refers to EU 28
Acidifying emissions
Water quality-nitrogen and phosphorous emissions
Non-methane volatile organic compounds emissions to air
Safety and health at work
Emissions to water
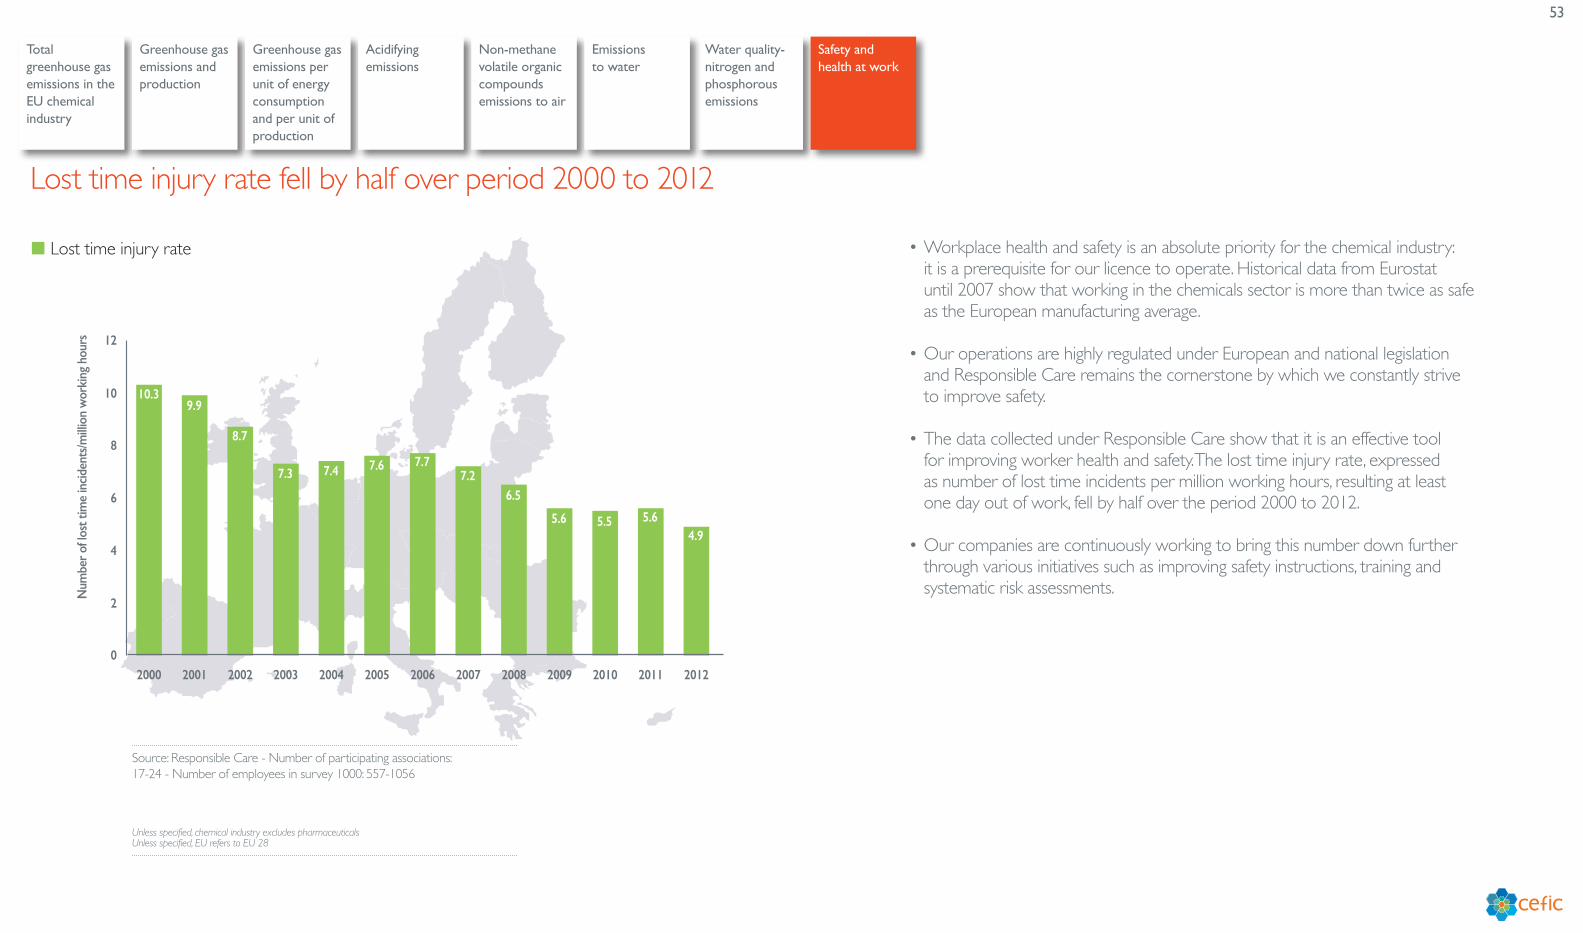
53
Total greenhouse gas emissions in the EU chemical industry
Greenhouse gas emissions and production
Greenhouse gas emissions per unit of energy consumption and per unit of production
Num
ber o
f los
t tim
e in
ciden
ts/m
illio
n w
orki
ng h
ours
0
2
4
6
8
10
12
2012201120102009200820072006200520042003200220012000
10.39.9
8.7
7.37.67.4
7.77.2
6.5
5.6 5.5 5.64.9
� Lost time injury rate • Workplace health and safety is an absolute priority for the chemical industry: it is a prerequisite for our licence to operate. Historical data from Eurostat until 2007 show that working in the chemicals sector is more than twice as safe as the European manufacturing average.
• Our operations are highly regulated under European and national legislation and Responsible Care remains the cornerstone by which we constantly strive to improve safety.
• The data collected under Responsible Care show that it is an effective tool for improving worker health and safety. The lost time injury rate, expressed as number of lost time incidents per million working hours, resulting at least one day out of work, fell by half over the period 2000 to 2012.
• Our companies are continuously working to bring this number down further through various initiatives such as improving safety instructions, training and systematic risk assessments.
Lost time injury rate fell by half over period 2000 to 2012
Source: Responsible Care - Number of participating associations: 17-24 - Number of employees in survey 1000: 557-1056
Unless specified, chemical industry excludes pharmaceuticals Unless specified, EU refers to EU 28
Acidifying emissions
Water quality-nitrogen and phosphorous emissions
Non-methane volatile organic compounds emissions to air
Safety and health at work
Emissions to water
54
Cefic aisblAvenue E. Van Nieuwenhuyse 4B - 1160 BrusselsBelgiumTel: +32 2 676 72 [email protected]
Media enquiriesJames Pieper Media Relations Manager Phone: +32 (0)2 676 73 98 E-mail: [email protected]
General enquiriesDr. Moncef Hadhri Economic Affairs Manager Phone: +32 (0)2 676 72 82E-mail: [email protected]
Chemistry making a world of differenceCefic, the European Chemical Industry Council, founded in 1972, is the voice of 29,000 large, medium and small chemical companies in Europe, which provide 1.2 million jobs and account for 17% of world chemicals production.
Cefic members form one of the most active networks of the business community, complemented by partnerships with industry associations representing various sectors in the value chain. A full list of our members is available on the Cefic website: www.cefic.org/about-us/our-members
Cefic is an active member of the International Council of Chemical Associations (ICCA), which represents chemical manufacturers and producers all over the world and seeks to strengthen existing cooperation with global organisations such as UNEP and the OECD to improve chemicals management worldwide.