Embed Size (px)
Citation preview

The EU response to the crisis
Nicolas PHILIPONNET, European Commission, DG ECFIN
1 December 2015

The objective
A procedure to capture:
• "Macroeconomic"
• "Imbalances"
Therefore:
• How do you describe the state of the macroeconomy?
• How do you identify an imbalance?
2

Outline
1. The origin of the crisis
2. The EU's response to the crisis: enhanced economic governance
3. The (long) road to recovery
4. Macroeconomic Imbalances Procedure
5. Imbalances: where do we stand?
3

1. The origin of the crisis
4

Origin of the crisis: what went wrong?

2007 - Subprime crisis
2008 – Banking crisis
2009 – Economic crisis
2010 – Sovereign debt crisis
2011 – 2012 systemic crisis of the euro
Excess credit + prolonged upswing + expectations
Defaults cause bank losses, distrust rises
Credit crunch; high risk aversion hits trade & investment
Recession hits tax revenues; welfare spending rises; GDP denominator falls
Contagion spreads crisis through financial and economic links; speculation on exit & breakup
5
Stages of the crisis: from financial to economic to institutional crises

2007-2008: the financial crisis
What we missed: the signs • Abundant global liquidity, real estate
bubble (credit backed by the value of the collateral)
• Rapid credit growth, high leveraging
• Supervisory failures : supervision too focused on individual institutions, not the global picture
What was wrong • Originate and distribute model • Complex and opaque financial products
(CDOs…)
• Conflicts of interest of rating agencies • Incentives for short-run risk taking
(Compensation schemes…) • Maturity mismatches in banks’ balance
sheets
Domino effects and feedback loops when
bubbles pop

8
GDP in the face of crisis
-6
-4
-2
0
2
4
6
t-12 t-8 t-4 t = 0 t+4 t+8 t+12
% y
ear
on
yea
r g
row
th
113 historical crises (median)
US (current crisis)
EU (current crisis)
Note: y-o-y grow th rates during tw elve quarters before and after the beginning (0) of a
f inanical stress episode. T = 0 corresponds to 2007Q4. Dotted lines refer to forecasts.
Sources: IMF, OECD, European Commission.
2008-2009: the EU experienced the deepest slump since WWII…

….Or worse
Source: US bureau of Economic Analysis; European Commission (Autumn 2015)
0
20
40
60
80
100
120
0 1 2 3 4 5 6 7 8 9 10
GD
P,
Pre-c
ris
is=
10
0
Number of years since the start of the crisis
US, 1929-392 Greece, 2008-14
GDP in volume US vs Greece


Source: European Commission. 11
Aggressive fiscal policies caused a hike in public indebtedness
General Government gross debt (% of GDP)
0
20
40
60
80
100
120
140
EU EA EL IT BE PT AT FRHUDEMTUK IE NL CY ES PLHR FI DKSE LV SK SL CZ LT ROLUBG EE
2000 2007 2009

12
FINANCIAL
STABILITY
SOVEREIGN
DEBT
ECONOMIC
GROWTH
FINANCIAL
STABILITY
SOVEREIGN
DEBT
ECONOMIC
GROWTH
The negative feedback loop

Source: European Commission.
-150
-100
-50
0
50
100
150
200
PT ES EL EE IE SK SI IT AT
CY* FR FI
MT
NL
DE
BE*
LU*
2000 2008
2013
NIIP (% of GDP)
40
50
60
70
80
90
100
110
120
20
00
20
02
20
04
20
06
20
08
20
10
20
12
Ireland Spain Germany
Housing prices (2007=100)
(*) start in 2002
13
Meanwhile, unsustainable external positions and asset bubbles contributed to divergences in the EU

2. The EU's response to the crisis: enhanced economic governance
14

The original design of EMU was incomplete
Failure to adapt to requirements of EMU
Accumulation of unsustainable debt levels, both in public and private sector
Excessive risk-taking in the banking sector
Failing market discipline
EMU led Member States to delay necessary structural reforms
Inadequate governance framework
Insufficient monitoring and enforcement tools to safeguard fiscal discipline
No instruments available to address macroeconomic imbalances
No established sovereign-debt crisis resolution mechanism for euro-area Member States
No integrated European supervisory and regulatory architecture for financial institutions
15

Stabilisation thanks to a strong policy response
What has been done so far?
•Improved crisis management (ESM / EFSF)
•Better surveillance tools: o Stronger enforcement instruments o Extended surveillance beyond fiscal dimension o Enhanced coordination
•Banking Union
•Monetary policy (OMT, LTRO, UMP)
16

Crisis management was improved through the setup of stability funds
Non-euro area
- Balance of Payments Facility
Euro area
-Temporary: - European Financial Stabilisation Mechanism
- European Financial Stability Facility
- Permanent: - European Stability Mechanism
In case of use: macroeconomic adjustment programme and intensive monitoring by so-called Troika: COM, ECB, IMF (two pack)
17
ESM instruments: - loans under a macroeconomic adjustment programme - purchase of debt in the primary and secondary debt markets - credit lines - recapitalisations of financial institutions through loans - direct recapitalisation of banks

18
FINANCIAL
STABILITY
SOVEREIGN
DEBT
ECONOMIC
GROWTH
Improved
Governance
Structural reforms
Fiscal discipline
Differentiated fiscal consolidation & quality
of public finances
Bank funding
Bank recaps
Firewalls
FINANCIAL
STABILITY
SOVEREIGN
DEBT
ECONOMIC
GROWTH
Structural reforms
Fiscal Discipline
Enhanced rules
Differentiated fiscal consolidation & quality
of public finances
Bank funding
Bank recaps
Firewalls
Breaking the negative feedback loop

Fiscal compact
ESM
Strengthened economic governance in EMU
Prevention and
correction of macro
imbalances
New surveillance
procedure and
possible sanctions
Better enforcement of
rules
-Larger range of sanctions,
starting more gradual, quasi-
automaticity (RQMV)
-Strengthened national fiscal
frameworks
More effective
preventive arm of SGP
- Expenditure benchmark
- Draft Budget Plans
- Autonomous recommendations
Focus on debt
developments
Numerical benchmark in the
corrective arm of the SGP
Structural reforms
Europe 2020 strategy
Price stability ECB
- LTRO
- OMT
- Forward guidance
Crisis
Resolution EFSM/EFSF/ ESM
Financial Stability
Sound Fiscal Policy
Sustained Economic Growth
Banking Union •Based on a single rule book for the EU 28 •Single Supervisory Mechanism •Single Resolution Mechanism
19

Key pieces of the EU-wide Financial Reform
20

Making European banks more robust
December 2011: EBA bank recapitalisation exercise
Ensuring the medium-term funding of banks to avoid a
credit crunch
ECB support: two 3-year LTROs
EUR 489bn for 523 participating banks (21/12/2011)
EUR 529bn for 800 participating banks (29/02/2012)
Enhancing the quality and quantity of bank capital to
withstand shocks
Core Tier 1 ratio of 9% to be achieved by end-June
2012
November 2014: AQR and stress tests (comprehensive
assessment. 21

Key elements of the Banking Union
Single Rulebook for EU28 (CRD IV/CRR and BRRD)
Single Supervisory Mechanism
Effective supervision based on high
common standards
Single Resolution Mechanism Effective crisis
resolution, private sector funding
• November 2014 - the ECB becomes the supervisor of all major banks in the Euro Area (around 130) and the MS that 'opted-in'
• AQR and stress tests
• IGA Finally signed in May 2014
• MS have time to ratify until the beginning of 2016
Single Deposit Guarantee Scheme
Harmonised system for depositors
protection
• Final arrangement in 5 PR
22

Extraordinary measures by the ECB
"Securities Market Programme" (SMP)—from May 2010—limited sterilised interventions
Long-term repurchase operations (LTRO)—End 2011
OMT – 2012 - Secondary market purchase of government debt, Response to fears on the reversibility of the euro.

Stability and Growth Pact
• Each Member State required to stay within the limits of (defined in the TFEU):
o government deficit (3% of GDP) & debt (60% of GDP)
• Preventive Arm
o Submission of Annual Stability and Convergence Programmes
o Country-Specific Medium-Term Budgetary Objectives – MTO
• Corrective ('Dissuasive') Arm
o Excessive Deficit Procedure – EDP
o Sanctions
Two Arms to ensure fiscal discipline in the EMU
24

Six Pack, Two Pack & Fiscal Compact
• Preventive arm o Expenditure benchmark to prevent that spending rises faster than medium-term potential GDP
o Balanced Budget Rule - structural deficit must not exceed 0.5% of GDP (or 1.0% of GDP if debt significantly < 60% of GDP)
• Corrective arm
o Debt criterion became enforceable
→ EDP can be launched on deficit and debt criterion
→ 1/20th target - debt must decrease by 1/20th of GDP annually if > 60%
• Strengthened budgetary surveillance
o Draft budgetary plans submitted to the Commission
o Common budgetary timeline for an enhanced coordination
o Independent Fiscal Councils established in the Member States
• Strengthened enforcement o For MS in EDP the deposits and fines kick in earlier
o Reverse QMV for graduated financial sanctions
25

Lessons for economic governance
•Scope and nature of surveillance
• Wider, especially on macro-financial issues and competitiveness/imbalances
• Deeper, especially on debt sustainability and key growth-enhancing reforms
• Better integrated, avoiding partial and fragmented approaches
•Follow-up and enforcement
• Stronger enforcement instruments
• Influence on economic policy debates at national level
• Taking account of Euro area dimension
• Deepening EMU: 4 Presidents' report + Commission's Blueprint
6

3. The (long) road to recovery
27

Policy response has led to a gradual stabilisation of financial markets
28

Financial sector repair – work in progress
0
5
10
15
20
25
EL SI BG CY IE HR
HU IT LT PT
LV CZ ES PL
BE
AT
FR DK SK EE NL
UK
DE
MT SE FI
June 2013
EA (June2013)
2008
Source: ECB consolidated banking data
Gross total doubtful and non-performing loans [% of total debt instruments and total loans and advances)
75
95
115
135
155
175
195
Jan
-04
Oct
-04
Jul-
05
Ap
r-0
6
Jan
-07
Oct
-07
Jul-
08
Ap
r-0
9
Jan
-10
Oct
-10
Jul-
11
Ap
r-1
2
Jan
-13
Oct
-13
EA
DE
IE
ES
IT
PT
Loan to deposit ratio
Source: ECB
Changes in euro area banks' aggregate CT1 ratios, 2011-2013 (% and pps)
Source: ECB, SNL Financial
29

Banking Union – work in progress Financial fragmentation & 'creditless' recovery
Source: Winter Forecast 2014
Interest rates on loans to enterprises (new business, maturity up to 1 year)
Economic and credit cycles, euro area (year-on-year %)

Budget deficits have improved since the crisis
Source: Commission services
-10%
-8%
-6%
-4%
-2%
0%
2%
4%
2002 2003 2004 2005 2006 2007 2008 2009 2010 2011 2012 2013
Government deficit (% of GDP)
75th percentile EU-27 median
25th percentile EU-27 average
31

Government debt is high across the EU and some countries need substantial further fiscal adjustment by 2020
32
-5.00
-3.00
-1.00
1.00
3.00
5.00
7.00
9.00
EE LV DK SE BG LT HU
RO SK DE PL
ES LU CZ
NL IT
MT
AT SI FI HR FR PT
UK IE BE
Autumn 2010
Spring 20140%
20%
40%
60%
80%
100%
120%
140%
160%
180%
EE BG LU LV RO SE LT CZ
DK PL
SK FI HR
MT
NL
DE
HU AT SI EU UK FR EA ES BE IE CY
PT IT EL
2009 2014-2009
S1 indicator: required fiscal adjustment by 2020 to reach a 60% debt-to-GDP ratio in 2030
Government debt (% of GDP)

33
Recovery takes hold, but fragile and uneven
Source: Autumn Forecast 2014
Real GDP, the whole of EU Real GDP, Selected countries 2008=100
60
70
80
90
100
110
120
130
140
BE DE IE EL ES
FR IT UK PT
0.5 2.1
1.8
-0.5
0.2 1.4
1.9 2.0
2.1
-3
-2
-1
0
1
2
3
80
85
90
95
100
105
110
Quarterly GDP growth GDP quarterly (index)
GDP annual (index) Column3
-4.4

What are the economic prospects for the upcoming five years?
34
o Signs of a turnaround in the euro area, including in vulnerable economies
o More weight of domestic demand in the core and external demand in the periphery
o But growth is still weak due, notably, to EA specific factors
96
98
100
102
104
106
108
0 1 2 3 4 5 6 7 8 9 10
previous recoveries
current recovery
index
quarters
Current recovery against past average* (GDP, euro area)

35 35
Case No 1: Full return to earlier path
Case No 2: Permanent loss in GDP level
Case No 3: Permanent loss on growth rates
Slope = long-term potential growth
No loss in potential output level after some
time
Potential output level
Same long-term potential growth after the crisis (same slope)
Potential output level
Years
Permanent loss in potential output level
Lower long-term output growth after the crisis (e.g. 1.5%)(lower post-crisis slope)
Potential growth before crisis (e.g. 2%)
Years
Potential output level
Potential output loss increasing
overtime
The medium- to long-run: possible trajectories for growth

36
4. MACROECONOMIC IMBALANCES PROCEDURE : Aiming to prevent the
next crisis

37
The macroeconomic imbalance procedure Context: Enhancing economic governance in the EU and the euro area, six-pack
Macroeconomic surveillance New regulation on prevention and correction of macroeconomic imbalances
Enforcement New regulation on effective enforcement of macroeconomic surveillance Sanctions in case of persistent inaction/insufficient action
Enforcement New regulation on effective
enforcement of budgetary surveillance
Stronger incentives & sanctions
Fiscal surveillance
- Prudent fiscal policy
- Debt criterion
- Minimum standards for fiscal frameworks

Autumn forecast
Winter forecast
Spring forecast
15 October
In-Depth Reviews
May/June
November
Annual Growth Survey
15 April
Stability/Convergence Programmes National Reform Programmes
Country-Specific Recommendations
Alert Mechanism Report
The European Surveillance Cycle
Governance architecture
Commission's opinions on Draft Budgetary Plans
Euro-area Member States: Draft Budgetary Plans
38

Challenge 1: complexity of the surveillance mechanisms
• A multiplicity of legal acts which is hard for experts to follow and emphasises process over substance
• The problem of the "complete contract": rules versus discretion
• Communication with stakeholders, especially at national level: ownership
39

Challenge 2: economic analysis in practice
• More difficult to identify problems earlier in the economic cycle, e.g. credit growth, house prices?
• Economic literature is not so conclusive on policy diagnosis and responses, especially in the aftermath of a balance-sheet crisis.
• Requires a lot of country specific knowledge. • Overall, it requires qualitative judgement to
complement quantitative analysis which is contestable.
40

Challenge 3: political economy accountability and ownership
• Respect the subsidiarity principle: when macroeconomic problems at the level of the Euro area require microeconomic actions at MS level.
• Democratic accountability and transparency at both EU and national level.
• The ins and the outs
41

The two arms of the MIP
• PREVENTIVE ARM: Ensure efficient and timely surveillance of macro imbalances where needed and bring the issues to the table. Integrated in European semester.
• CORRECTIVE ARM: Ensure efficient and timely policy action and correction when required. Follow-up by own time line.

a. Alert mechanism
report
Economic reading of the MIP
Scoreboard
November
Programme
countries
have their own
enhanced
surveillance
No risk
identified
Procedure stops
b. In-depth reviews
Commission prepares in-depth country
reviews (IDR), using a wide set of
indicators and analytical tools.
February/March
No problem
Procedure stops
Excessive
imbalances
Decision to
trigger (or not)
the corrective
arm
Imbalances
Recommendatio
ns under
European
Semester
May
The MIP procedure : a 2-step process to detect imbalances
Potential imbalance

The Corrective Arm
Member State is
placed in “Excessive Imbalance Position”
Corrective Action Plan
Surveillance of compliance with
reform commitments
Sufficient abeyance
Insufficient:
interest bearing deposit
Insufficient: Fine
0.1% of GDP
Insufficient fine 0.1% of
GDP

Reverse Qualified Majority Voting
Member State is
placed in an
Excessive Imbalance Position
Corrective Action Plan
Surveillance of compliance with
reform commitments
Sufficient abeyance
Insufficient: interest bearing deposit
Insufficient: Fine
0.1% of GDP
Fine 0.1% of GDP

a. The alert mechanism report and the
MIP scoreboard
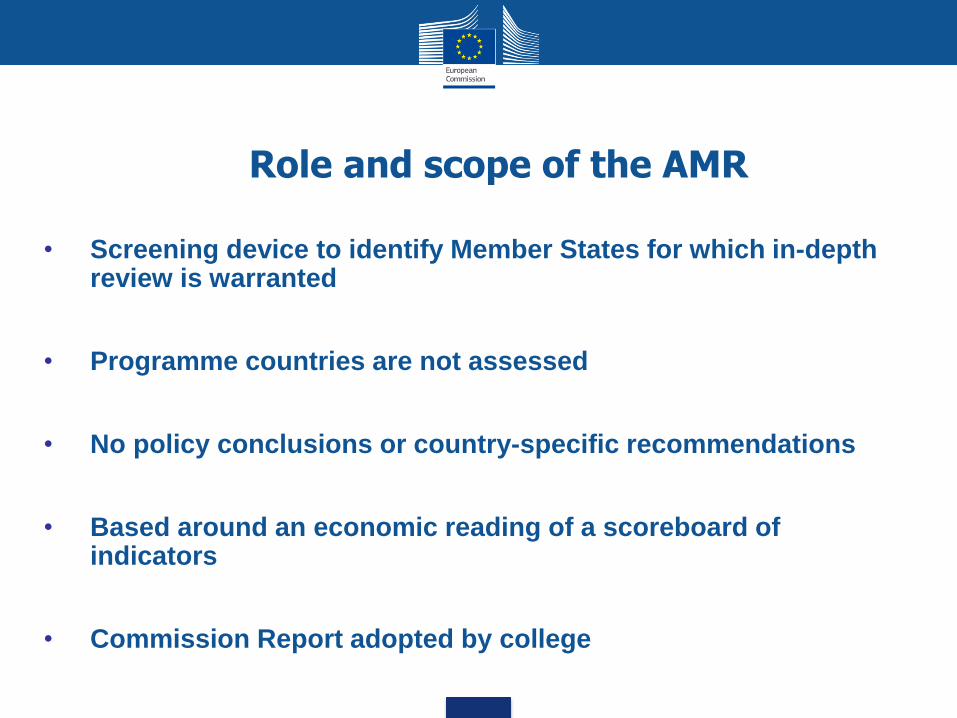
Role and scope of the AMR
• Screening device to identify Member States for which in-depth review is warranted
• Programme countries are not assessed
• No policy conclusions or country-specific recommendations
• Based around an economic reading of a scoreboard of indicators
• Commission Report adopted by college

48
• Headline scoreboard: selected 14 indicators with indicative alert thresholds: alert thresholds based on historical data
• Scoreboard complemented by set of additional 28 "reading indicators" (including 9 of social character)
• Presented on t-1 annual statistics but the economic reading considers latest data available at any frequency
• Scoreboard may be adjusted over time (AGS 2015: possible promotion of some social indicators for AMR-2016)
MIP scoreboard: an analytical tool

49
It is:
• A first step (an initial filter) in the procedure
• An instrument of communication and accountability (COM needs to explain its decision taking into account the scoreboard)
• A set of indicators that helps identifying macroeconomic risks (but needs to be complemented by detailed analysis) ____________________________________________________
It is not:
• A tool for a mechanic decision on the existence of imbalances
• A tool to identify progress in reforms and developments in macro risks
What the scoreboard is and what is not

50
The scope of the scoreboard • External positions (current accounts, net international
investment positions)
• Competitiveness developments (REERs, ULCs)
• Export performance (export market shares)
• Private sector indebtedness (credit, debt)
• Public sector indebtedness
• Assets markets (housing)
• Financial sector developments (fin. Sector liabilities)
• Unemployment
• Activity rates
• Long-term unemployment
• Youth unemployment
Exte
rnal
imb
ala
nces
Inte
rnal
imb
ala
nces
New
em
plo
ym
en
t
ind
icato
rs

Results of the AMR 2016
• The 16 countries for which imbalances were identified in 2015 (FR, HR, BG, IT, PT, SI, IE, ES, HU, DE, BE, NL, FI, SE, RO, UK)
• An IDR will be prepared for the first time for 2 Member States:
• Estonia: risks and vulnerabilities linked to a renewed build-up of demand pressures
• Austria: issues related to the financial sector, notably its high exposure to developments abroad and the impact on credit provided to the private sector
• Programme countries are not under MIP surveillance.
• As was previously the case for Member States expected to exit their financial assistance programme, the situation of Cyprus will be assessed in the context of the MIP only after the on-going financial assistance programme, which is expected to finish by March 2016.

b. In-depth reviews

IDRs in general
• Broad assessment of imbalances complemented with focused
analysis (building on AMR)
• Common framework but assessments are by nature country
specific drawing on common and national sources as well as on
relevant empirical evidence.
• Fact finding missions to Member States (ECFIN, other services,
ECB (EA), ESO)
• Use of widely available and transparent data, analytical tools and
descriptive statistics
• Methodological work progress in tandem (LIME, surplus study,
deleveraging report)

Broad structure of IDRs
• Executive summary and conclusions
• Macroeconomic developments
• Analysis of the nature and causes of imbalances
• Focused sections on key issues
• Policy challenges

55
Spillovers
• Trade linkages
• Financial linkages
EIP
Adjustment capacity
• Price and wage flexibility
• Labour market flexibility
• Financial market intermediation
• Balance sheet adjustment
Policy options and
implementation
• Wage bargaining system
• Financial market regulation
• Fiscal policy
• Growth and structural reforms
Sustainability of macro-trends
• Early warning
• Deviation from equilibrium (competitiveness, credit growth, housing prices)
• Other factors (GDP growth, demography, catching-up,
global imbalances, saving and investment imbalances,
housing and other asset markets, shocks)
• Policy determinants (fiscal policy, financial regulation, labour market institutions)
Identification
of
problematic
imbalances
Policy
Response

56
What is an imbalance? (no numerical benchmark)
• Nature of MIP
• Medium term horizon
• Pre-emptive
• Approach
• Snapshot
• Dynamics
• Reform implementation
• Objective
• Risk assessment and impact

Challenges vary significantly across
Member States
Large stocks of net liabilities concerning a wide range of sectors, both external and internal:
PT, ES, CY, EL, IE, SI, HU, HR, BG
Large and persistent current account surpluses:
DE, NL
Combination of high public debt and declining trend in potential growth or competitiveness:
IT, FR, BE
Vulnerabilities confined to a particular sector:
NL, SE, UK, AT, EE, FI
Large negative NIIP:
RO

58
Analytical tools
• External positions (CACA, CA benchmarks, NIIP stabilising CA)
• Trade performance and competitiveness (allocative
efficiency, access to finance, productivity and export performance)
• Wages and productivity (wage benchmarks)
• Deleveraging pressures
• House price cycle assessment (equilibrium, overvaluations)
• QUEST simulations (impact structural reforms)

59 0% 10% 20% 30% 40% 50% 60%
labour markets
other
financial sector
housing market
external sustainability
public indebtedness
private indebtedness
external competittiveness
average (2012-2014)
% of countries with identified imbalance in the MIP
Source: Commission services; other includes: imbalances stemming from weak domestic demand, weak corporate governance and high level of state involvement in the economy
The MIP identifies competitiveness and indebtedness as the most prevalent imbalances
59

60
Number of CSRs in 2013 and 2014, by policy area
Source: Commission services
CSRs addresses the major reform priorities
Macro imbalances & structural reforms
60
0 5 10 15 20 25 30
Fiscal Consolidation
Long-term sustainability
Taxation
Banking
Housing
Access to finance
ALMP & participation
Wage setting
Education
Social polices
Health care
Childcare
Innov. & competitiveness
Competition
Energy, networks
Public administration
Pu
blic
fin
ance
Fin
anci
al s
ecto
r
Lab
ou
rm
arke
tre
form
sH
um
an c
apit
al a
nd
soci
al p
olic
ies
Pro
du
ct m
arke
tre
form
s.
2013
2014

Specific monitoring
• The corrective arm was not initiated either in 2013 or 2014 despite finding of excessive imbalance
• This is formally in line with legislation ("may")
• EA CSR asks for "specific monitoring" of implementation of reform commitments for countries with excessive imbalances and EA countries with imbalances requiring decisive action.
• Was done for ES and SI (first time) and HR, IT, SI and FR, IE, ES
• COM can at any moment initiate corrective arm

62
4. Imbalances: where do we stand (AMR 2016) ?

Novelties in this year's AMR
• A greater emphasis is put on the euro-area dimensions of imbalances through:
• A dedicated box presenting the main euro-area considerations
• A more systematic analysis of the euro-area wide implications of countries' imbalances and how such implications require a coordinated approach to policy responses.
• The social dimension is strenghtened
• Inclusion of 3 new employment indicators to the main scoreboard with thresholds (activity rate, youth and long-term unemployment)
• Rationale: social consequences of the crisis; impact on potential GDP of long, drawn-out negative employment and social developments with risk of compounding macroeconomic imbalances
• Focus unchanged: flashes of the new indicators do not imply, by themselves, an aggravation of the macro-financial risks, and consequently are not used to trigger any steps in the MIP

Large current account deficits have
adjusted while large surpluses persist
Th
e e
uro
area c
urren
t acco
un
t b
ala
nce
-4
-3
-2
-1
0
1
2
3
4
99 00 01 02 03 04 05 06 07 08 09 10 11 12 13 14 15 16
% o
f G
DP
DE NL ES FR IT Other Euro Area

The growing current account surplus in the
euro area reflects weak domestic demand
The euro area surplus is now one of the world's largest and is forecast to remain large
It largely reflects an excess of domestic savings over investment, as a consequence of deleveraging pressures in all sectors, including in countries with low deleveraging needs
It is above what fundamentals would imply, notwithstanding oil and FX effects
In general, cyclically-adjusted figures are lower than the headline balances. One exception is Germany.
Scoreboard indicator flashes in four surplus countries (like last year: DE, NL, DK, SE) and two deficit countries: CY and for the first time UK.

Large net external liabilities persist despite
the adjustment in flows
Net
In
tern
ati
on
al In
vestm
en
t P
osit
ion
s
an
d N
et
Exte
rn
al
Deb
t in
20
14
-150
-100
-50
0
50
100
150
CY EL PT IE* ES SK LV LT SI EE IT FR FI AT LU* MT* DE BE NL HR HU BG PL RO CZ UK SE DK
Net external debt (neg. sign)
Other net assets
Net international investmentposition (NIIP)
In % of GDP
Euro Area Non-Euro Area

Vulnerabilities linked to external debt
remain significant
In general, higher current account surpluses would be needed in order to reduce the net external liabilities in a timely fashion
Valuation effects also have weighed on the rebalancing of stocks
The contribution of nominal GDP growth has generally been either small or negative (highlight risks linked to low inflation environment)
Scoreboard indicator reflects this inertia with 16 countries flashing like in the AMR 2015, 2014 and 2013.
The fast and continuous accumulation of net creditor risks should not be overlooked.

Cost competitiveness developments have been
broadly consistent with adjustment needs
-8%
-6%
-4%
-2%
0%
2%
4%
6%
8%
10%
CY EL IE SI ES PT
BE SK NL FI
EA1
9
MT IT LU FR DE
AT LT EE LV HR
UK PL
CZ
RO
BG SE DK
HU
Of which: labour productivity (neg. sign) - contribution of total factor productivityand capital accumulationOf which: labour productivity (neg. sign) - contribution of hours worked
Of which: real hourly compensation per employee
Of which: inflation (GDP deflator growth)
ULC growth in 2014
Euro Area Non-Euro Area
Deco
mp
osit
ion
of
ULC
gro
wth
in
20
14

The decline in export market shares has
eased in most EU countries
-40
-30
-20
-10
0
10
20
30
40
50
CY FI
MT
HR
EL
DK
AT
HU IT FR SI
ES
NL
BE
SE
UK
DE IE CZ
PT
SK
PL
BG LV
LU
RO
EE
LT
Gains within Extra-EU market
Gains within EU market
Exposure to Extra-EU
Exposure to EU
Scoreboard indicator 2014 (5 year change)
-10
-5
0
5
10
15
20
25
CY FI
MT
HR
DK
AT
HU IT FR
EL SI
ES
NL
BE
SE
UK
DE IE CZ
PT
SK
PL
BG LV
LU
RO
EE
LT
Gains within Extra-EU market
Gains within EU market
Exposure to Extra-EU
Exposure to EU
Cumulated change in 2013 and 2014
5 year change in export market shares in 2014 2 year change in export market shares in 2014

Private debt reduction is dwarfed by
pre-crisis accumulation
0
20
40
60
80
100
120
140
160
DK
CY
NL IE UK
PT
ES
SE
DE FI
EL
MT
BE
EE
LU
FR
AT
LV IT
HR
HU
PL
LT
SK
CZ SI
BG
RO
09 14 10 09 09 09 09 14 00 14 13 14 14 09 14 14 10 09 12 10 10 14 09 14 13 12 09 10
% o
f G
DP
Country | Peak year
2000 incr. to peak 2014
0.0
50.0
100.0
150.0
200.0
250.0
CY IE BE
SE
NL
PT
ES
BG
MT
EE
DK
UK FI
FR SI
HR
LV IT
HU
AT
EL
DE
RO LT
CZ
SK
PL
00 12 12 09 00 12 09 13 09 09 08 09 10 14 09 10 10 12 09 09 10 01 10 09 00 09 14
% o
f G
DP
Country | Peak year
2000 incr. to peak 2014
Household debt, consolidated Corporate debt, consolidated

Recent progress in deleveraging has been
mixed
Drivers of 1 year change in household debt Drivers of 1 year change in corporate debt
-10
-8
-6
-4
-2
0
2
4
IE PT ES HULV NL EL RO SI IT UKDK CZ DE LT EE LU HR CY FR AT PLMTSE FI BE SK
Active deleveraging Passive Unsucc. No deleveraging
pp
.
Credit flows
Writeoffs, reclass., val. changes
Nom. GDP growth
D/GDP, ch.
-25
-20
-15
-10
-5
0
5
10
SI PT ES ROHU IE FI LT IT LV DKMTUK CZ HR EL CY EE DE SE PL AT BE SK FR NL
Active deleveraging Passive Unsucc. No deleveraging
% o
f G
DP
Credit flows
Writeoffs, reclass., val. changes
Nom. GDP growth
D/GDP, ch.

Vulnerabilities in the banking sector persist
0
5
10
15
20
25
30
35
40
45
50
CY
EL IE
RO
BG
HU IT
HR SI
LT
PT
ES
MT
LV
CZ
SK
PL
DK
FR
BE
NL
UK
AT
DE
EE FI
SE
LU
2013Q4
2014Q4
Non-Performing Loans (NPLs)

House prices developments reflect different
positions in housing cycles across the EU
House prices: valuation levels in 2013 and variations in 2014
BE
DE
IE
EL
ES
FRIT
CY
LUMT
NL
AT
PT
SI
SK
FI
BG
CZ DK
EE
LVLT
HU
PL
RO
SEUK
HR
-20
-15
-10
-5
0
5
10
15
20
-30 -20 -10 0 10 20 30Deflate
d h
ouse p
rices 1
year
% c
hange,
2014 (
%)
Estimated valuation gap, 2013 (%)
Correcting from overvalued levels
Overvalued and still growing
Recovering from undervalued levels
Undervalued and still falling

Labour market conditions are converging
but social distress remains too high
BE
BG
CZ
DKDE
EE
IE
EL
ES
FR
HR
IT CY
LVLT
LU
HU
MT
NL
AT
PL
PT
RO
SI
SK
FI
SE
UK
-6.0
-5.0
-4.0
-3.0
-2.0
-1.0
0.0
1.0
2.0
0.0 5.0 10.0 15.0 20.0 25.0 30.0
Change in
unem
plo
ym
ent ra
te b
etw
een 2
013Q
1 a
nd
2015Q
2
Unemployment rate in 2013Q1
Evolution of the unemployment rate since 2013

Long and negative social developments
may hamper potential output and
compound macroeconomic imbalances
Unemployment rate has reached historically high levels and the number of flashes is still high (12 this year compared to 14 in the last AMR)
Activity rates remains resilient in most countries, with flashes observed only in two Member States
Over the past three years, long-term unemployment has strongly increased in 11 Member States (incl. EL, ES, PT, CY, IT).
Despite improvements, youth unemployment is close to historically high levels with the 3-year pp change indicator flashing for 13 countries.

Euro area spillovers call for coordinated
approach to macro policies
Domestic demand and investment need to be boosted particularly in countries with sufficient fiscal space, a large current account surplus or low deleveraging, so as to mitigate the risk of protracted low growth and low inflation.
Structural reforms aimed at unlocking growth potential must continue or be stepped up, in particular in countries of systemic relevance
Countries whose capacity to sustain demand is constrained by debt overhang and a high level of NPLs should also focus on growth enhancing reforms, ensuring that their insolvency frameworks are also adequate to address the stocks of non-viable debt, free up economic resources, and reallocate capital efficiently.

77
6. Conclusion and next steps

Next steps
• The AMR conclusions to be discussed in the Council and Eurogroup;
• IDRs planned to be published in February, ahead of CSR package as last cycle;
• IDRs embedded in country reports
• After IDR, for some countries imbalances may not any longer be identified
• Specific monitoring for 8 Member States (FR, HR, BG, IT, PT, SI, IE, ES)

Opportunities
• Earlier detection of imbalances
• Ability to communicate and have impact on domestic policy debates
• Evolving over time to capture macroeconomic priorities: adjustment of flows but outstanding stocks
• Shifting emphasis to reflect topical policy issues: e.g. current account surpluses or social implications of adjustment
• Improved analytical tools
Challenges
• Given the nature of imbalances, less rules-based, more judgement
• Corrective arm not used yet
• Exploit the existing framework (repeated game with potential stigma effects) to ensure its effectiveness
• IDRs for all Member States or more selective?
• Is the framework capturing the main challenges and is it adapting in an adequate manner?
The MIP is now well-established but the full set of instruments has not yet been used
79