Embed Size (px)
Citation preview

Vo lume 11 Number 2 2010 /p .41 7 -435 es tey j ou rn a l . com
Editorial Office: 410 22nd St. E., Suite 820, Saskatoon, SK, Canada, S7K 5T6. Phone (306) 244-4800; Fax (306) 244-7839; email: [email protected] 417
Market Structure Impacts on Market Distortions from Domestic Subsidies: The U. S. Cotton Case Suwen Pan Research Scientist, Cotton Economics Research Institute, Department of Agricultural and Applied Economics, Texas Tech University
Darren Hudson Professor and Larry Combest Chair for Agricultural Competitiveness; Director of Cotton Economics Research Institute, Department of Agricultural and Applied Economics, Texas Tech University
Don Ethridge Emeritus Professor, Department of Agricultural and Applied Economics, Texas Tech University
This analysis uses a residual demand elasticity model to measure market power in the international cotton market. The results indicate that China exerts significant market power and affects cotton prices. Those results, combined with a partial equilibrium model of the international cotton market, are used to evaluate the welfare consequences of U.S. cotton subsidy policies for major cotton exporters under alternative assumptions about global market structure. The results indicate that the effects of U.S. subsidies on the world cotton price are much smaller under an imperfectly competitive international market than under a perfectly competitive market scenario; the former appears to be a realistic case.
Keywords: global market structure, international trade, U.S. cotton commodity programs
The Es tey Cent re Journa l o fInternational Law
and Trade Policy

S. Pan, D. Hudson, D. Ethridge
Estey Centre Journal of International Law and Trade Policy 418
1. Introduction otton is the primary natural fibre, accounting for around 40 percent of the world’s annual textile fibre production, and has served as a source of economic
growth, especially when combined with textile and apparel production (MacDonald, 2000). Cotton provides income to millions of farmers in both industrial and developing countries worldwide. For example, one to two million households produce cotton in West Africa, with up to 16 million people deriving income from cotton indirectly (Hussein, Perret, and Hitimana, 2005). Cotton provides 3 to 5 percent of GDP in Benin, Burkina Faso, Mali, and Chad, and the cotton export shares of total exports are 51.4 percent, 37.6 percent, 36.2 percent, 25 percent, and 11.2 percent for Burkina Faso, Benin, Chad, Mali, and Togo, respectively, further illustrating the importance of cotton to these economies (Hussein, Perret, and Hitimana, 2005).
Because of the reliance of developing countries on cotton, allegations were levied against the U.S. and other developed countries that their domestic and export subsidies caused significant impacts on world markets by encouraging excess production and trade and depressing world prices. Following these arguments, Brazil, with the support of Australia and the Western and Central African (WCA) countries, filed a petition challenging the U.S. cotton programs1 at the September 2002 meeting of the World Trade Organization Settlement Body. Brazil alleged that U.S. cotton subsidies were depressing world prices and were injurious to their farmers, and the WCA countries (Benin, Burkina Faso, Chad, and Mali) claimed to be losing export earnings of US$ 1 billion a year, including both direct and indirect costs, as a result of the subsidies paid by the United States and the EU (BBMC, 2003).
The issue of U.S. cotton subsidies has been studied and debated since it was first raised by Brazil in 2002 (ICAC, 2002; Sumner, 2003; Goreux, 2004; Pan et al., 2006). Empirical estimates, summarized in table 1, vary with type of analytical model, time period analyzed, and key assumptions; world price effect estimates of removing U.S. cotton programs on global prices ranged from +2 percent to +11 percent. Table 1 also provides some estimated effects of the complete removal of all domestic subsidies, export subsidies, and tariffs across countries (FAPRI, 2002; Poonyth et al., 2004; Pan et al., 2007a).
A key feature of most of these modeling efforts is the assumption of a perfectly competitive global market structure. However, at least one analysis (Ethridge, 2007) raises questions about the validity of that assumption. Because the United States is the dominant exporter of cotton and China is the dominant importer, the possibility exists that prices are influenced by oligopoly and/or oligopsony power. Size alone does
C

S. Pan, D. Hudson, D. Ethridge
Estey Centre Journal of International Law and Trade Policy 419
offer the opportunity, but does not guarantee the exertion of market power. There is no empirical evidence of the impacts of changes in market structure on the global cotton market and/or the impacts of market structure on the distribution of the effects of U.S. policy. This article extends previous studies by beginning to develop an understanding of how alternative market structures alter the impact of domestic farm programs on global cotton markets by establishing the impacts under different scenarios—perfect competition and monopsony.
The potential impact of alternative market structure assumptions on modeling results is not one simply of academic interest. Rather, major conclusions in an international dispute (and the subsequent penalty phase estimates of damages) were based primarily on estimates from models that may or may not be based on valid assumptions. Understanding the impact of market structure assumptions, therefore, is of paramount policy importance for future dispute resolution and/or policy formation processes.
2. Global Cotton Market Structure he central condition for enabling market power to influence market prices is that there be a sufficiently small number of sellers/buyers that some entity in the
market is able to impact the price. There may or may not be a dominant entity (much larger or more influential than the rest); and the condition enables the exertion of market power rather than dictates it. In recent years, cotton mill use has become more concentrated in several countries: China (43 percent), India (15 percent), Pakistan (10 percent), Turkey (4 percent), and United States (4 percent). As a result, China imports around 31 percent of global cotton trade, while Pakistan and Turkey each import around 10 percent. Exports are slightly less concentrated: United States (36 percent), India (17 percent), Uzbekistan (11 percent), Brazil (7 percent), Western and Central African countries (6 percent), and Australia (3 percent) (USDA, 2008). The trend toward buyer concentration is a manifestation of expanded textile capacity in China and Southeast Asia, particularly since the expiration of the Multi Fibre Agreement in 2005. China’s dominance in that industry has increased, with a strong growth in formerly restricted textile categories in 2007, while China’s share of global imports had already reached 40 to 50 percent in non-restricted categories (Emergingtextile, 2008).
The concentration in international cotton markets may mean that previous analyses of the global cotton market yielded biased estimates. The issue is important because structure affects market behaviour (conduct), which in turn affects market outcomes (performance). Other studies have also recognized that there are possible
T

S. Pan, D. Hudson, D. Ethridge
Estey Centre Journal of International Law and Trade Policy 420
strategic reasons for government intervention based on imperfect competition (Corden, 1991). The potential role of market structure and strategic behaviour in international markets is not a new idea, but it is often forgotten in applied analyses. Also, the market impact of state trading agencies in cotton is a priority item in the next round of WTO negotiations (e.g, China’s cotton imports are still controlled by several state-owned companies) (FAS, 2008).
3. Economic Analysis of Domestic Price Supports o analyze how the world cotton sector would be impacted by the complete elimination of U.S. domestic support mechanisms under different market
structures, a multi-country, partial equilibrium model based on comparative advantage considerations was constructed. The analysis considers three different scenarios under which all the U.S. domestic price subsidies directly affecting cotton supply and demand were examined: (i) scenario 1: the United States and rest-of-the-world maintain current cotton policies, while China does not use its tariff-rate quota program (TRQ); (ii) scenario 2: the United States and rest-of-the-world maintain current cotton policies, while China implements its TRQ; and (iii) scenario 3: complete “monopsony” (China as a monopsony buyer), with the United States and rest-of-the-world maintaining current cotton programs. The first scenario represents a case where Chinese import policies are not implemented. This scenario can be compared with scenario 2 to isolate the impacts of the Chinese TRQ on world markets. However, scenario 2 assumes only that China implements a TRQ but does not necessarily exert complete market power. The third scenario, while unrealistic, represents the complete exercise of market power by China (all other countries are price takers). If, as hypothesized, China does use a TRQ to exercise market power, the real impact of U.S. programs can be viewed as falling between the estimated impacts in scenarios 2 and 3.
Viewing the United States as an oligopoly seller was considered but rejected, because U.S. behaviour is inconsistent with oligopoly; an oligopolist would restrict the quantities of cotton offered for sale in order to increase prices and capture oligopoly rents. Instead, the U.S. policy attempts to increase the amount of cotton on the world market, thereby theoretically lowering price. The United States is a large exporter of cotton, and therefore has influence on price, as do other major exporters, but U.S. policies are not consistent with the exertion of market power. China uses its tariff-rate quota on cotton as well as acting as a state trading enterprise/single desk trader in order to exercise its market power, which results from the combination of its relatively dominant size in the world market and its managing imports through central trading and import quotas, thereby lowering its cotton import price (and supporting its
T
S. Pan, D. Hudson, D. Ethridge
Estey Centre Journal of International Law and Trade Policy 421
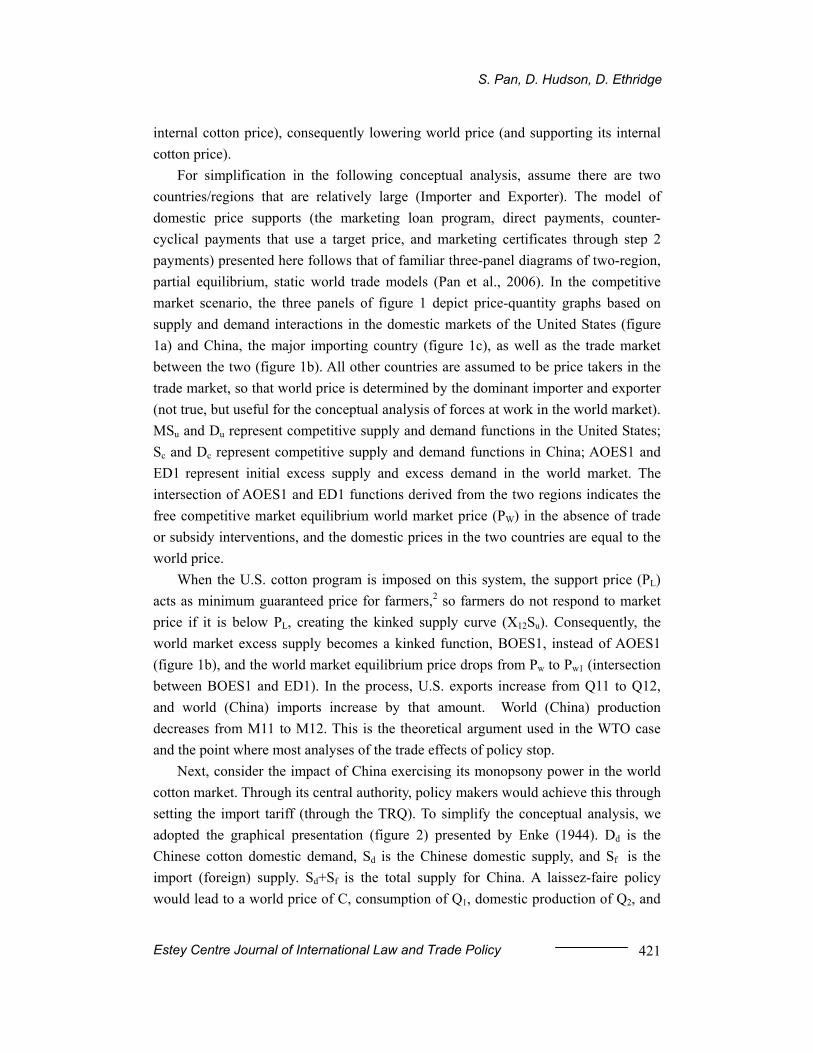
internal cotton price), consequently lowering world price (and supporting its internal cotton price).
For simplification in the following conceptual analysis, assume there are two countries/regions that are relatively large (Importer and Exporter). The model of domestic price supports (the marketing loan program, direct payments, counter-cyclical payments that use a target price, and marketing certificates through step 2 payments) presented here follows that of familiar three-panel diagrams of two-region, partial equilibrium, static world trade models (Pan et al., 2006). In the competitive market scenario, the three panels of figure 1 depict price-quantity graphs based on supply and demand interactions in the domestic markets of the United States (figure 1a) and China, the major importing country (figure 1c), as well as the trade market between the two (figure 1b). All other countries are assumed to be price takers in the trade market, so that world price is determined by the dominant importer and exporter (not true, but useful for the conceptual analysis of forces at work in the world market). MSu and Du represent competitive supply and demand functions in the United States; Sc and Dc represent competitive supply and demand functions in China; AOES1 and ED1 represent initial excess supply and excess demand in the world market. The intersection of AOES1 and ED1 functions derived from the two regions indicates the free competitive market equilibrium world market price (PW) in the absence of trade or subsidy interventions, and the domestic prices in the two countries are equal to the world price.
When the U.S. cotton program is imposed on this system, the support price (PL) acts as minimum guaranteed price for farmers,2 so farmers do not respond to market price if it is below PL, creating the kinked supply curve (X12Su). Consequently, the world market excess supply becomes a kinked function, BOES1, instead of AOES1 (figure 1b), and the world market equilibrium price drops from Pw to Pw1 (intersection between BOES1 and ED1). In the process, U.S. exports increase from Q11 to Q12, and world (China) imports increase by that amount. World (China) production decreases from M11 to M12. This is the theoretical argument used in the WTO case and the point where most analyses of the trade effects of policy stop.
Next, consider the impact of China exercising its monopsony power in the world cotton market. Through its central authority, policy makers would achieve this through setting the import tariff (through the TRQ). To simplify the conceptual analysis, we adopted the graphical presentation (figure 2) presented by Enke (1944). Dd is the Chinese cotton domestic demand, Sd is the Chinese domestic supply, and Sf is the import (foreign) supply. Sd+Sf is the total supply for China. A laissez-faire policy would lead to a world price of C, consumption of Q1, domestic production of Q2, and

S. Pan, D. Hudson, D. Ethridge
Estey Centre Journal of International Law and Trade Policy 422
imports of Q1 – Q2 units. This would be an equilibrium, but not an optimum arrangement for the monopsonist, because the marginal cost of the imported supply (MCf) is greater than its unit cost. With China’s government exercising its monopsonist power, the marginal cost of importation (MCf) in the left side of the diagram is added to Sd, and China optimizes its benefits by equating (Sd + MCf) with Dd to produce an internal (domestic) price of I and an import (world) price of H. China is benefited by importing cotton only when the marginal cost of the “last” unit from aboard is just less or equal to the supply price asked by domestic producers for their marginal output. This is because the marginal cost of cotton imports will eventually have to be paid by the textile exports, and the supply price asked by producers at home is the long-run marginal cost of production. Because China has the monopsony market power in the cotton market, the Chinese government would regulate the consumption, production, and imports so that the marginal cost to the economy of obtaining cotton (Sd+MCf) is equal to its marginal value in consumption (cotton mill use, Dd). Therefore, China would impose an import tariff IH to force its import level from Q2Q1 to Q4Q3 (or they could simply restrict imports directly3), domestic production to OQ4 instead of OQ2, and domestic consumption to OQ3 instead of OQ1.
A main point is that, following the hypothesis that China is exerting monopsony power in the market, there is an additional impact on the global price of cotton (in addition to the influence of U.S. cotton programs).4 This result implies that while there are clearly effects from domestic subsidies on world markets, those effects are unambiguously altered by the import policies of large importers with oligopsony/monopsony power in the market. The relative impact of these different effects is an empirical question.
4. Methods and Procedures
4.1 Cotton Market Power Test With the first development of residual demand elasticity (RDE) to measure market power of a single firm in an imperfect market by Baker and Bresnahan (1988), the residual demand elasticity (RDE) model is broadly used to measure market power in an imperfect market: Goldberg and Knetter (1999) adopted the model to measure the degree of competition in segmented export markets; Carter, MacLaren and Yilmaz (1999) tested the world wheat market using the model. The RDE model generally assumes that each country behaves as a firm and that parameters can be interpreted as share-weighted industry averages for all firms within one country; Poosiripinyo and Reed (2005) applied the RDE model to the Japanese chicken meat market, and Song

S. Pan, D. Hudson, D. Ethridge
Estey Centre Journal of International Law and Trade Policy 423
et al. (2007) used it to test U.S.-China market power in the soybean trade. To evaluate whether there is market power in the cotton trade market, following their approaches, we assume that both China and the United States are the primary countries in the market. A two-country, partial equilibrium trade model is applied to U.S.-China cotton trade. The specific equations include
(1) USUSCirn
USOTH
USUSCHUS
XPTU STKPXPTTINCRSP εβββββββ +++++++= 543210
(2) CHCH
cornCH
OTHCH
INCH
AuCHCH
USCH
IMPCH
WTOP
IMPIMPIMPTINCRDP
εαα
ααααααα
+++
++++++=
76
543210
(3) PXPT
USIMP
CH PddP ε++= 10
(4) CHUS
USCH RSRD =
where USUSCirn
USOTH
USUSCHUS
XPTU STKPXPTTINCRSP ε,,,,,,, are the natural logarithms of
U.S. cotton export price to China ($/mt); U.S. residual cotton supply for China (mt); U.S. personal disposable income per capita ($); time trend (Jan 1995 = 1); U.S. cotton exports to other countries (mt); U.S. corn price ($/mt); U.S. cotton beginning stocks (bales); and error term, respectively.
CHCHcorn
CHOTH
CHIN
CHAu
CHCHUSCH
IMPCH WTOPIMPIMPIMPINCRDP ε,,,,,,,, are the natural
logarithms of China’s cotton import price from the United States ($/metric ton); China’s cotton import quantity from the United States (mt); China’s personal disposable income per capita ($); China’s cotton imports from Australia (mt); China’s cotton imports from India (mt); China’s imports from other countries (mt); corn price in China ($/metric ton); a dummy variable for Chinese World Trade Organization membership (0 before 2002 and 1 otherwise); and error term, respectively. Equation (3) is the price transmission between the U.S. export price and the Chinese cotton import price, while equation (4) is the equilibrium between Chinese cotton imports from the United States and U.S. cotton exports to China. All the ’s are parameters to be estimated.
The parameter of interest is β in equation (1), which is interpreted as the residual
demand elasticity. An estimate of zero indicates that China does not exert market power in the cotton export market. In this case, the import prices do not depend on the quantity imported by China, but rather are completely determined by the exporters’ costs. The larger β in absolute value, the larger the deviation from marginal cost
pricing, and the more power the importers exert over prices.

S. Pan, D. Hudson, D. Ethridge
Estey Centre Journal of International Law and Trade Policy 424
4.2 Estimation of the Policy Effects A partial equilibrium world fibre model was used to estimate the effects of U.S. cotton subsidy programs on the world market. This model incorporates the regional supply response of cotton, different competing goods in different producing regions, substitutability between cotton and competing fibres, and the linkage between raw fibre and textile sectors (Pan et al., 2004). The China and U.S. textile models include supply, demand, ending stocks, and market equilibrium for cotton and man-made fibres. Cotton A-index, Chinese domestic cotton price, U.S. cotton textile price index, U.S. non-cotton price index, U.S. farm price, and polyester price are endogenously solved in the models by respectively equalizing world exports and imports, Chinese domestic cotton supply and demand, U.S. cotton and non-cotton textile supply and demand, U.S. domestic cotton supply and demand, and man-made fibre supply and demand.
Chinese cotton mill use was estimated following a two-step process in which total textile fibre mill use was first estimated as a residual of textile fibre consumption and the net trade of textile fibre, followed by allocations among fibres—cotton, wool, and man-made fibres (represented by polyester)—based on their relative prices. U.S. cotton and non-cotton textile mill use was solved endogenously with the domestic textile demand and textile net trade (net imports). All these equations were estimated based on the cotton textile price index, non-cotton textile price index, cotton domestic price, and non-cotton domestic price.
U.S. cotton production was modeled using separate acreage and yield equations. Cotton production is a function of last year’s cotton net returns and the relative net return(s) of competing crops. As part of the total U.S. cotton supply, imports and exports are functions of domestic price, international price (A-index), exchange rates, tariff rates, and quota restrictions. U.S. man-made fibre is modeled using capacity and utilization. The capacity and utilization equations are functions of the man-made fibre price and petroleum spot price. Western and Central African countries and other countries were assumed to be price takers in the cotton market.
The income and price elasticities of cotton mill use used in the study are presented in table 2. For the supply side, the short-run elasticities of cotton acreage response range from 0.10 to 0.54, with Mexico having the highest value. The long-run acreage response elasticities range from 0.21 to 1.15, with the highest in Australia (Pan et al., 2006). These elasticities have also been used in several studies, such as Chinese currency evaluation (Pan et al., 2007b) and cotton in a free trade scenario (Pan et al., 2007a).

S. Pan, D. Hudson, D. Ethridge
Estey Centre Journal of International Law and Trade Policy 425
5. Results
5.1 Empirical Estimation of Cotton Market Structure Table 3 reports the parameters of the simple two-country, partial equilibrium model estimated by the SAS seemingly unrelated regression (SUR) method. For the U.S. inverse residual cotton supply function (upper portion of table 3), only the U.S. cotton residual supply for China, U.S. corn price, and time trend variables are statistically significant. The estimated parameter of the U.S. cotton export to China is the price flexibility of the U.S. cotton inverse residual supply function and measures the market power of Chinese cotton importers. The implies that the marketing margin for Chinese cotton importers (the difference between the Chinese domestic cotton price and the cotton import price from the United States) is 5 percent of the import price from the United States or other countries plus tariffs and transaction costs of Chinese cotton importers.
For the Chinese inverse demand function (centre portion of table 3), Chinese disposable income per capita, time trend, and Chinese domestic corn price are statistically significant. The results did not support any significant effects from major cotton exporters such as the United States, Australia, and India. These empirical results indicate that the price flexibility of China’s residual demand, which can be used to measure the market power of all cotton exporters, is not statistically significant.
Thus, these test results suggest two major findings: (1) China appears to be exercising significant market power over cotton exporters (reducing prices by around 5 percent), and (2) the United States and other exporters do not appear to be exerting significant market power (although some might conceivably be able to do so if they wished).
5.2 Effects of U.S. Cotton Programs Table 4 presents estimated effects of eliminating the three U.S. cotton programs (target price, direct payments, and loan rate) on the world A-index, Chinese cotton import expenditures, and export income in the United States and WCA countries under different market structure assumptions. The results represent the percentage changes in the selected variables between (1) a market with the current U.S. cotton program in effect and (2) removing those programs. For example, eliminating the U.S. cotton program, but keeping the competitive market assumption (scenario 1) would raise world price (A-index) by 8.1 percent in 2008/09, 6.9 percent in 2009/10, etc., and by an average of 4.76 percent over the five-year projection period; it would

S. Pan, D. Hudson, D. Ethridge
Estey Centre Journal of International Law and Trade Policy 426
decrease China’s imports by an average 0.22 percent, decrease U.S. export income by 1.62 percent, and raise WCA export income by 3.13 percent.
Scenario 2 in table 4 shows the impacts of adding the Chinese TRQ. Focusing on the price effects, the introduction of the TRQ has the effect of diminishing the overall impact of U.S. farm programs. That is, in the presence of the Chinese TRQ, U.S. agricultural programs have roughly half of their effect on world price as compared to their effect in the competitive market case. Likewise, WCA income is half of the competitive market case. The results suggest, then, that estimates presented in the literature that do not properly account for the effects of the Chinese TRQ likely overestimate the impacts of the U.S. cotton program by a factor of at least two.
The monopsony case (scenario 3), of course, places a lower bound on the impact of U.S. cotton programs on world markets. Because China is a monopsony, its policies completely offset everything else in the world. While this is unrealistic, we have clear evidence from the residual demand elasticity analysis that China does exert market power. Therefore, the most likely representation of the overall world market lies somewhere between scenarios 2 and 3.
Overall, this analysis indicates that if a competitive world market and the underlying macroeconomic conditions of this study are assumed, eliminating the three U.S. cotton programs would increase the world price of cotton by an average of 4.75 percent over the five-year projection period of the study, decrease China’s imports of cotton very slightly (by 0.22 percent), reduce U.S. cotton exports by 1.62 percent, and increase the export income from cotton for the West and Central African countries by 3.13 percent. On the other hand, if China is assumed to exercise monopsony buying power, ceteris paribus, eliminating U.S. cotton programs has no impact on world price, China’s cotton imports, U.S. cotton exports, or WCA countries’ exports. We know that China is not a pure monopsonist, so the impact of U.S. programs must be greater than zero. On the other hand, if China (and perhaps other countries) is exercising some oligopsony power, which appears to be the case, then the impact of U.S. programs falls short of a 4.75 percent reduction on world price as suggested by the competitive world market structure.
While more specific estimates of the effects of U.S. programs are difficult to obtain because they would require specific estimates on strategic behaviour between oligopsony countries, these results bracket the impacts of U.S. programs at a level well under what would occur under a competitive market assumption. Further, these results suggest that WCA countries have less to gain from the dismantling of U.S. cotton programs than previous estimates may suggest, and may have as much or more

S. Pan, D. Hudson, D. Ethridge
Estey Centre Journal of International Law and Trade Policy 427
to gain from dismantling or otherwise eliminating Chinese import market power exertion.
6. Summary and Conclusions his study used a residual demand elasticity model to measure market power in the international cotton market and then evaluated the effects of
U.S. cotton subsidy programs on the global cotton market based on different market structure assumptions. The results of market power estimation support the proposition that the international cotton market is imperfectly competitive. China is shown to exert market power over key cotton exporters, including the United States.
The effects of U.S. cotton subsidy programs have been a topic of international contention. Most studies agree that these programs caused the world cotton price to decline, ceteris paribus. However, there is little consensus on the magnitudes of the effects. This study indicates that the impact of removal of the programs is related to global market structure: their effects are much smaller under imperfectly competitive market structure than under competitive market structure. The study also presents the possibility that the developing countries may have at least as much concern with the effects of the exercise of market power by the dominant countries in the cotton industry as they have with the impacts of U.S. cotton programs alone.
T

S. Pan, D. Hudson, D. Ethridge
Estey Centre Journal of International Law and Trade Policy 428
References Benin, Burkina Faso, Mali, and Chad (BBMC) (2003). Poverty Reduction: Sectoral
Initiative in Favor of Cotton. World Trade Organization, May. Baker, J. B., and T. F. Bresnahan (1988). Estimating the residual demand curve facing
a single firm. International Journal of Industrial Organization 6: 283-300. Carter, C. A., D. MacLaren, and A. Yilmaz (1999). How Competitive is the World
Wheat Market? Working Paper no. 99-002, July, Department of Agricultural and Resource Economics, University of California Davis.
Corden, W. M. (1991). Strategic trade policy. In Companion to Contemporary Economic Thought, eds. D. Greenaway, M. Bleaney, and I. Stewart. London: Routledge.
Economic Research Service, U.S. Department of Agriculture (ERS/USDA). Briefing Rooms: Cotton Policy. Available at http://www.ers.usda.gov/Briefing/cotton/policy.htm.
Emerging Textile (2008). US Apparel Imports from China in 2004-2007 (Statistics Report). Available at http://www.emergingtextiles.com/?q=art&s=080226-apparel-us-import-china.
Enke, S. (1944). The monopsony case for tariffs. Quarterly Journal of Economics 58: 229-245.
Ethridge, D. (2007). Changes in Global Cotton Markets: Causes and Effects. Plenary paper, World Cotton Research Conference 4, Sept 10-14. International Cotton Advisory Committee, Wash., DC, 26 pp. (on CD).
FAPRI (2002). The Doha Round of the World Trade Organization: Appraising Further Liberalization of Agricultural Markets. Working Paper 02-WP 317, Center for Agricultural and Rural Development, Iowa State University, November.
Foreign Agricultural Service, U.S. Dept. of Agriculture (FAS) (2008). China, Peoples Republic of, Cotton and Products Annual 2008. Available at http://www.fas.usda.gov/gainfiles/200805/146294733.pdf.
Goldberg, P., and M. M. Knetter (1999). Measuring the intensity of competition in export markets. Journal of International Economics 47: 27-60.
Goreux, L. (2004). Cotton after Cancun. Mimeo, World Bank, March 2004. Available at http://www.oecd.org/dataoecd/38/48/30751318.pdf.
Hussein, K., C. Perret, and L. Hitimana (2005). Cotton in Western Africa. Available at \http://books.google.com/books?id=Py5pPZKeRvcC&pg=PA106&lpg=PA106&dq=Hussein,+Perret,+and+Hitimana+2005&source=bl&ots=xWbLVx0o37&sig=7gkT155feqGBbo_1j5pZlUyeGxk&hl=en&sa=X&oi=book_result&resnum=1&ct=result#PPA5,M1.
International Cotton Advisory Committee (ICAC) (2002). Production and Trade Policies Affecting the Cotton Industry. Available at

S. Pan, D. Hudson, D. Ethridge
Estey Centre Journal of International Law and Trade Policy 429
http://www.icac.org/icac/Meetings/cgtn_conf/documents/icac_ccgtn_report.pdf.
MacDonald, S. (2000). The New Agricultural Trade Negotiations: Background and Issues for the U.S. Cotton Sector. Economic Research Service, U.S. Department of Agriculture, CWS-2000, November.
Pan, S., M. Fadiga, S. Mohanty, and D. Ethridge. (2004). Structural Models of the U.S. and the Rest-of-the-World Natural Fiber Market. CER # 04-03, Cotton Economics Research Institute, Texas Tech Univ., March.
Pan, S., S. Mohanty, D. Ethridge, and M. Fadiga (2006). The impacts of U.S. cotton programs on the world market: An analysis of Brazilian WTO petitions. Journal of Cotton Science 2006(10): 180-192.
Pan, S., M. Fadiga, S. Mohanty, and M. Welch (2007a). Cotton in a free trade world. Economic Inquiry 2007(45): 188-197.
Pan, S., S. Mohanty, M. Welch, D. Ethridge, and M. Fadiga (2007b). The effects of Chinese currency appreciation on world cotton market. Contemporary Economic Policy 2007 (25): 185-205.
Poonyth, D., A. Sarris, R. Sharma, and S. Shui (2004). The Impact of Domestic and Trade Policies on the World Cotton Market. Food and Agriculture Organization of the United Nations, Commodity and Trade Policy Research Working Paper No. 8, 2004.
Poosiripinyo, R., and M. Reed (2005). Measuring market power in the Japanese chicken meat market. Journal of International Agricultural Trade and Development 1: 135-48.
Reeves, G., D. Vincent, and D. Quirke (2001). Trade Distortions and Cotton Markets: Implications for Australian Cotton Producers. Narrabri, New South Wales, Australia: Cotton Research and Development Corporation.
Song, Baohui, M. A. Marchant, M. R. Reed, and S. Xu (2007). Market Power and Competitive Analysis of China’s Soybean Import Market. Contributed paper presentation for the International Agricultural Trade Research Consortium, July 8-9, 2007, Beijing, P. R. China.
Sumner, D. A. (2003). A quantitative simulation analysis of the impacts of U.S. cotton subsidies on cotton prices and quantities. Department of Agricultural and Resource Economics, University of California, Davis. Available at http://www.fao.org/es/esc/common/ecg/47647_en_.pdf .
Tokarick, S. (2003). Measuring the Impact of Distortions in Agricultural Trade in Partial and General Equilibrium. IMF Working Paper WP/03/110, International Monetary Fund.

S. Pan, D. Hudson, D. Ethridge
Estey Centre Journal of International Law and Trade Policy 430
Table 1 Literature Summary of the Effects of Trade-distorting Support on the World Cotton Price Study
Method World price effects of removing U.S. subsidies (domestic support and export subsidies)
World price effects of removing all trade-distorting support (domestic support, tariffs, and export subsidies)
FAPRI (2002) partial equilibrium +11.44% average from 2002/2003 to 2011/12
Goreux (2004) partial equilibrium +12% in 2000/01 ICAC (2002) partial equilibrium +70% in 2001/02
and +15% in 2002/03
Pan et al. (2004) partial equilibrium +2.14% in 2005/06 to +0.86% in 2013/14
Pan et al. (2007a) partial equilibrium average +10.79% between 2006/07 and 2010/11
Poonyth et al.( 2004)
partial equilibrium +3.1% from baseline average (1996-2000)
Reeves, Vincent, and Quirke (2001)
partial equilibrium +2.2% in 1999
Sumner (2003) partial equilibrium +12.6% in 1999-2002 and +10.8% in 2003-2007
Tokarick (2003) partial equilibrium +2.8% and +2.0% (remove production subsidies only)

S. Pan, D. Hudson, D. Ethridge
Estey Centre Journal of International Law and Trade Policy 431
Figure 1 Effects of U.S. cotton programs on world cotton price under competitive market structure. Source: Enke (1944)
Figure 2 Effects of Chinese monopsony on world cotton market.
Pw
Pw1
Du
Su
(a) U. S. (b) World Market (c) China
ED1
ES1
Dc
Sc
X12 Q11 Q12 M12 M11
PL
X4
A
B
O
M
Sf
MCf
Sd
Sd+MCf
Sd+SfI
H
O Q2 Q4 Q3 Q1
Dd
C

S. Pan, D. Hudson, D. Ethridge
Estey Centre Journal of International Law and Trade Policy 432
Table 2 Elasticity of Income from Textile Consumption and Elasticity of Price from Cotton Mill Use for Major Countries
Country Income elasticities Price elasticities Textiles Cotton Polyester
U.S. 0.15 -0.24 0.07 Australia 0.13 -0.05 0.00 South Korea 0.11 -0.57 0.24 Taiwan 0.11 -0.50 0.35 Japan 0.14 -0.57 0.37 E.U.-15 0.12 -0.39 0.15 Mexico 0.58 -0.27 0.10 Brazil 0.53 -0.15 0.12 China 0.69 -0.57 0.16 India 0.56 -0.44 0.10 Pakistan 0.52 -0.28 0.18 Africa 0.55 -0.74 0.24 World 0.30 -0.28 0.15 Source: Pan et al. (2006).

S. Pan, D. Hudson, D. Ethridge
Estey Centre Journal of International Law and Trade Policy 433
Table 3 Estimation Results of the Two-country Partial Equilibrium Model Equation Variable Parameter Standard error U.S. Intercept 18.64 10.48 0.05* 0.02 -1.17 1.04 0.002 0.008 -0.016 0.02 0.34* 0.12 -0.18* 0.10 China Intercept 0.29* 2.70 0.02 0.02 0.93* 0.47 -0.03* 0.01
0.007 0.01
-0.005 0.02 0.03 0.02 0.17* 0.07 0.10 0.08 Price relationship
Intercept 2.82* 0.63
0.61* 0.09 * Statistically different from 0 at the .10 level of significance.

S. Pan, D. Hudson, D. Ethridge
Estey Centre Journal of International Law and Trade Policy 434
Table 4 Effects of U.S. Cotton Programs on Selected Economic Variables
2008/09 2009/10 2010/11 2011/12 2012/13 Average A-Index % change
Effects of U.S. program removal under scenario 1 8.10% 6.94% 3.77% 3.31% 1.69% 4.76%
Effects of U.S. program removal under scenario 2 3.25% 3.27% 2.11% 0.95% 0.95% 2.11%
Effects of U.S. program removal under scenario 3 0.00% 0.00% 0.00% 0.00% 0.00% 0.00%
China Import
Effects of U.S. program removal under scenario 1 -0.55% -0.25% -0.12% -0.11% -0.08% -0.22%
Effects of U.S. program removal under scenario 2 -0.22% -0.05% -0.02% 0.00% 0.00% -0.06%
Effects of U.S. program removal under scenario 3 0.00% 0.00% 0.00% 0.00% 0.00% 0.00%
U.S. Export Income
Effects of U.S. program removal under scenario 1 -2.94% -1.95% -1.10% -1.09% -1.01% -1.62%
Effects of U.S. program removal under scenario 2 -1.21% -1.12% -1.10% -0.90% -0.82% -1.03%
Effects of U.S. program removal under scenario 3 0.00% 0.00% 0.00% 0.00% 0.00% 0.00%
WCA Countries’ Export Income
Effects of U.S. program removal under scenario 1 4.98% 4.37% 2.80% 2.21% 1.28% 3.13%
Effects of U.S. program removal under scenario 2 1.81% 1.60% 1.35% 1.31% 1.23% 1.46%
Effects of U.S. program removal under scenario 3 0.00% 0.00% 0.00% 0.00% 0.00% 0.00%

S. Pan, D. Hudson, D. Ethridge
Estey Centre Journal of International Law and Trade Policy 435
Endnotes 1. Three major commodity programs (ERS, 2008) used in the United States to support
cotton production are discussed in the article:
Direct payments Under the 2002 Farm Act, farmers and eligible landowners receive annual fixed payments. The amount of the direct payment is equal to the product of the payment rate (6.67 cents/lb. for cotton during 2002-2012), payment acres, and payment yield.
Counter-cyclical Payments (CCP) CCP were developed to provide a counter-cyclical income safety net to replace most ad hoc market loan assistant payments that were provided to farmers during 1998-2001. Payments are based on historical production and are not tied to current production. This program is available for covered commodities whenever the effective price is less than the target price (71.25 cents/lb.). The payment amount is equal to the product of the payment rate, the payment acres (85 percent of base acres in crop years 2008 and 2012 and 83.3 percent in crop years 2009-11), and the payment yield. The effective price is equal to the sum of (1) the higher of the national average farm price for the marketing year or the national loan rate for the commodity and (2) the direct payment rate for the commodity. The upland cotton target price is 71.25 cents/lb. for 2008-2012.
Marketing Assistance Loan and Loan Deficiency Payment programs The Farm Service Agency administers commodity loan programs with marketing loan provisions for upland cotton through the Commodity Credit Corporation (CCC). CCC loan programs allow producers of designated crops to receive a loan from the government at a commodity-specific loan rate per unit of production by pledging production as loan collateral. After harvest, a farmer may obtain a loan for all or part of the new production. These loans may be repaid in three ways: at the loan rate plus interest costs (CCC interest cost of borrowing from the U.S. Treasury plus 1 percent); by forfeiting the pledged crop to the CCC at loan maturity; or at the alternative loan-repayment rate. The marketing loan rate for upland cotton is 52 cents/lb. for 2008-2012.
2. It is important to note that PL is derived through all the three programs combined, not one individual program.
3. While they have nominally increased import quotas and adopted other market-access provisions in relation to their accession into the WTO, they still control import flow through rejecting shipments for “contamination” and other non–tariff quota control measures. They can accomplish this due to the single-desk status of importing.
4. Technically speaking, if China were a pure monopsony, there would be no impact of U.S. programs, because China would set the world price. We recognize that the Chinese monopsony is the extreme case and serves as the maximum impact on world price.