Embed Size (px)
Citation preview

REVIEW ARTICLE
The epidemiology of multiple sclerosis in Europe
M. Pugliattia,b, G. Rosatia, H. Cartonc, T. Riiseb, J. Drulovicd, L. Vecseie and I. MilanovfaIst. Clinica Neurologica, Facolta di Medicina e Chirurgia, Universita di Sassari, Viale San Pietro 10, 07100 Sassari, Italy; bDepartment of
Public Health and Primary Health Care, Section for Occupational Medicine, University of Bergen, Kalfarveien 31, 5018 Bergen, Norway;cDepartment of Neurology, Universitaire Ziekenhuizen, 3000 Leuven, Belgium; dDepartment of Neurology, School of Medicine, University of
Belgrade, Dr. Subotica 6, 11000 Belgrade, Yugoslavia; eDepartment of Neurology, Faculty of Medicine, University of Szeged, Semmelweis u.
6, 6725 Szeged, Hungary; fIIII Neurological Clinic, University Hospital, Boulevard Tzarigradsko shosse - IV km, 1113 Sofia, Bulgaria
Keywords:
burden, course, disability,
Expanded Disability
Status Score, epidemiol-
ogy, Europe, incidence,
multiple sclerosis,
prevalence
Received 6 February 2005
Accepted 30 July 2005
Multiple sclerosis (MS) is a chronic and potentially highly disabling disorder with
considerable social impact and economic consequences. It is the major cause of non-
traumatic disability in young adults. The social costs associated with MS are high
because of its long duration, the early loss of productivity, the need for assistance in
activities of daily living and the use of immunomodulatory treatments and multidis-
ciplinary health care. Available MS epidemiological estimates are aimed at providing a
measure of the disease burden in Europe. The total estimated prevalence rate of MS
for the past three decades is 83 per 100 000 with higher rates in northern countries and
a female:male ratio around 2.0. Prevalence rates are higher for women for all countries
considered. The highest prevalence rates have been estimated for the age group 35–
64 years for both sexes and for all countries. The estimated European mean annual
MS incidence rate is 4.3 cases per 100 000. The mean distribution by disease course
and by disability is also reported. Despite the wealth of epidemiological data on MS,
comparing epidemiological indices among European countries is a hard task and often
leads only to approximate estimates. This represents a major methodological concern
when evaluating the MS burden in Europe and when implementing specific cost-of-
illness studies.
Introduction
Multiple sclerosis (MS) is a chronic progressive poten-
tially disabling disorder with considerable social impact
and economic consequences despite its relatively limited
prevalence. It is the major cause of non-traumatic dis-
ability in young adults [1].
The social costs of MS are high. They are higher than
those for stroke and Alzheimer’s disease because of the
disease’s long duration, the higher prevalence and
incidence among young adults, the subsequent early
loss of productivity because of physical disability,
fatigue and comorbidity, the need for assistance in
activities of daily living and the cost of immuno-
modulatory treatments and multidisciplinary health
care [2]. Till date, no cost-of-illness studies based on
consistent methodology are available for MS in Europe.
The present overview is an updated collection of the
best available estimates of current prevalence and
incidence rates, and of the MS distribution by course
and disability in Europe. The review is specifically
aimed at providing a source of epidemiological data for
evaluating the current socioeconomic burden of the
disease in European countries.
MS: relevant definitions
Multiple sclerosis is an acquired inflammatory and
neurodegenerative immuno-mediated disorder of the
central nervous system, characterized by inflammation,
demyelination and primary or secondary axonal
degeneration [3]. It clinically manifests with signs of
multiple neurological dysfunctions (e.g. visual and
sensory disturbances, limb weakness, gait problems and
bladder and bowel symptoms) followed by recovery or
by an increasing disability because of irreversible
functional disability over time [4]. However, more
aspecific symptoms can be detected, such as fatigue,
which is experienced by nearly 80% patients as inter-
fering with their quality of life and productivity,
regardless of the degree of disability and course status
[5,6].
Immunoprophylactic therapies have not yet proven
to be highly efficacious in modifying the disease course,
and are often associated with side effects further wor-
sening patients� quality of life and productivity. The
disease shows heterogeneity with respect to its patho-
Corrrespondence: Maura Pugliatti, MD, Ist. Clinica Neurologica,
Facolta di Medicina e Chirurgia, Universita di Sassari, Viale San
Pietro 10, 07100 Sassari, Italy (tel.: + 39 079 228 231; fax: + 39 079
228 423; e-mail: [email protected]).
700 � 2006 EFNS
European Journal of Neurology 2006, 13: 700–722 doi:10.1111/j.1468-1331.2006.01342.x
genesis, clinical manifestations, prognosis and, most
interestingly, with respect to its pathology [7]. The eti-
ology of MS is unknown. It is a complex multifactorial
disorder, in which environmental factors are hypo-
thesized to interact with genetically susceptible indi-
viduals [8]. Pediatric MS and late-onset MS (i.e. clinical
onset over the fifth decade) are rare.
Diagnostic criteria
There are no pathognomonic tests for the diagnosis of
MS, which remains clinical despite the many paraclin-
ical markers. Diagnostic criteria require evidence of
dissemination of neurologic signs and symptoms in
space and time, based on anamnestic, clinical and
paraclinical evidences. The most widely used criteria in
MS epidemiological research over the past two decades
were the Poser Committee criteria [9]. Based on the
number of relapses (attacks), clinical and paraclinical
evidences (evoked potentials) and the increased number
of oligoclonal bands and/or IgG patients are assigned
to the following categories: (i) clinically definite MS
(CDMS), (ii) laboratory-supported definite MS (LSD-
MS), (iii) clinically probable MS (CPMS) and (iv)
laboratory-supported probable MS (LSPMS). Subcat-
egories are applied to (i), (ii) and (iii), which, however,
are seldom taken into account in epidemiological des-
criptive studies of MS. Magnetic resonance imaging
(MRI) has been recently integrated into new criteria for
the diagnosis of MS [10]. According to these new
indications, patients can receive a diagnosis of MS or
possible MS. MRI findings must themselves meet
specific criteria to be considered attributable to MS
[11–13]. When comparing all categories of Poser
Committee diagnostic criteria with McDonald’s cri-
teria, MS rates appear to be overestimated when the
latter are used [14]. Finally, the lack of �attacks� and of
recurrent episodes in primary progressive forms may
lead to an underestimation of such forms when the
Poser Committee criteria are used [15].
Clinical course
The clinical course of MS shows heterogeneity among
patients and within the same patient. The following
categorization of the clinical course of MS has been
reported to reduce the confusion in terminology [16]:
(i) relapsing–remitting MS (RR-MS), a clearly defined
disease with relapses with full recovery, or with
sequelae upon recovery and periods between relapses
characterized by a lack of disease progression, (ii)
progressive–relapsing MS (PR-MS), progressive dis-
ease from onset, with clear superimposed relapses,
with or without full recovery, and periods between
relapses characterized by continuing progression; (iii)
secondary-progressive MS (SP-MS), initial RR course
followed by progression with or without occasional
relapses, minor remissions and plateaus; (iv) primary-
progressive MS (PP-MS), disease with progression
from onset with plateaus and temporary minor
improvements.
Because of the cross-sectional or historical design of
most epidemiological studies on MS, the disease course
is often more simply categorized into RR-MS, SP-MS
and chronic progressive (CP)- or PP-MS [4], and it is
based on prevalent cases. It is often unclear whether PR
courses are lumped to RR or PP courses.
Disability
Several scales are used to measure disability in MS, with
special regard to longitudinal studies aimed at evaluating
the efficacy of interventional programs (the use of
immunomodulatory and symptomatic drugs, rehabilit-
ation, etc.). However, because of the retrospective or
cross-sectional nature of assessments, in MS epidemio-
logical descriptive research, the burden of disability is
most frequently presented as Kurtzke’s Expanded Dis-
ability Status Score (EDSS) for prevalent cases [17].
Disability because of MS can be measured within func-
tional neurological systems (pyramidal, cerebellar,
brainstem, sensory, bowel and bladder, visual, cerebral,
other) by assigning each a score. The distribution of the
scores over the functional systems combined with their
degree is then assigned to one of the 20 categories (0, 0.5,
1,…,10), which indicate the level of disability. Further
lumping is often needed when precise scores cannot be
assessed in historical or cross-sectional studies so that
EDSS 0–3.5 refers to fully ambulatory with at most
moderate disability in at least one functional system, 4.0–
6.5 refers to fully ambulatory, although relatively severe
disability, eventually constant bilateral assistance needed
to walk 20 m, 7.0–9.5 refers to patients restricted to
wheelchairs, confined to bed and totally dependent and
10 is death caused by MS.
Material and methods
The list of European countries considered was derived
from the European Union (EU) website including sites
for EU Member States, Applicant Countries and Other
Countries [18]. For the study purposes and because of
the very small population sizes, Andorra, Liechtenstein,
Luxembourg, Monaco, San Marino and Vatican City
were not considered in the review.
When existing, estimates from the former Yugoslavia
assessed prior to 1991 were assigned to the newly
formed countries, Slovenia, Croatia, Bosnia and
Epidemiology of MS in Europe 701
� 2006 EFNS European Journal of Neurology 13, 700–722

Herzegovina, Serbia and Montenegro and to the former
Yugoslavia-Republic of Macedonia on a geographic
basis.
At the time of the literature search for the present
review, no epidemiological studies had been conducted,
which used the diagnostic criteria of McDonald et al.
[10] for MS.
The distribution of MS prevalence rates in Europe
was recently reviewed by selecting articles published in
the international scientific peer-reviewed literature and
reporting on surveys conducted in the past three dec-
ades [19,20]. An extensive collection of epidemiological
data on MS in Europe by Firnhaber and Lauer [21] also
served as a source for the present review.
With the aim of depicting the current burden of MS
in Europe, previous epidemiological information was
updated and integrated by reviewing the impact of
disability, disease course and incidence rates. Toward
this purpose, large population-based studies (i.e. 50 000
population and over, registry-based and nation-wide
surveys) were preferably considered. For those coun-
tries where multiple epidemiological assessments on MS
had been carried out over time, data from the largest
populations and from the most recent studies were
selected. Nevertheless, reliable evidences reported in
non-English scientific literature or from local small
population surveys were also used when the search on
international peer-reviewed literature failed to produce
any result for a specific country.
Age categorization for prevalence and incidence dif-
fers from study to study. Toward the study purpose, as
more pertinent to the �burden of disease� nature of the
review, the following age classification was chosen for
age-specific prevalence rates: <17, 18–34, 35–49, 50–64,
65–74, ‡75 years. When feasible, i.e. when age-specific
prevalence rates were given, the total prevalence rate
was standardized using the 1966 European population
[22]. The distribution of disability was categorized into
mild (EDSS 0–3.5), moderate (4.0–6.5) and severe (7.0–
9.5).
For practical purposes and given the heterogeneity
and unclearness of the classifications used, SP-MS and
RP-MS were lumped together into RP-SP-MS, so that
the distribution of the disease course consisted of the
three categories RR-MS, RP-SP-MS and PP-MS. As
the proportion of both disability and disease course is
reported based preferentially on the prevalent cases,
prevalence studies were used for this specific purpose,
and it was indicated otherwise if based on incidence.
Results
Nearly 200 surveys on MS epidemiology in Europe
published in the past three decades were scrutinized, of
which a third turned out to be informative with regard
to disease burden. More recent and population-based
surveys on larger population sizes were preferably
considered. The distribution of the population sizes
included had a mean of 523 000 and a median of
318 000, with a range of 54 000–3 100 000, and an
interquartile range of 172 000–503 000 (not including
nationwide surveys).
Prevalence
The UK and the Republic of Ireland
The epidemiology of MS in the British Isles in the past
few decades has been characterized by three main
trends, i.e. a north-to-south gradient (north-east main-
land and the Scottish off-shore islands versus southern
England and Wales), a marked increase of prevalence
with repeated assessments over time especially in
southern regions and the subsequent tendency for the
latitudinal gradient to level off [23]. A prevalence rate of
187 per 100 000 was reported for the year 1995 in
south-east Scotland [24], which is at least twofold that
for England and Wales [25–29]. Even higher rates of
nearly 200 cases per 100 000 were found for Scotland
offshore islands (Shetlands and Orkneys), but they were
based on the small populations and older diagnostic
criteria [30,31]. The north-to-south latitudinal gradient
of MS prevalence throughout Great Britain and Ireland
is undisputed. By designing a prevalence study in east-
ern Scotland on a large population that had not been
previously investigated and comparing the use of more
or less inclusive diagnostic criteria (i.e. Allison and
Millar [32] versus Poser et al. [9]), Forbes et al. ruled out
any north-to-south gradient of MS prevalence in Scot-
land. Their data were consistent with those reported for
south-eastern Scotland [24]. The sharp change of MS
prevalence over the English border suggests that having
a Scottish ancestry is a risk factor for MS [24]. None-
theless, other surveys indicate that MS is more preval-
ent in northern Great Britain and Ireland than in the
respective southernmost regions [33,34]. However,
methodological differences between surveys must be
taken into account as well as the difference in preval-
ence being on a regional rather than latitudinal basis
[33]. The most recently reported prevalence estimate of
MS for northern Ireland was 168 per 100 000, indica-
ting a risk similar to that in Scotland, probably because
of the close genetic composition and ethnicity between
the Scottish and the northern Irish population [35]. In
England and Wales, the prevalence reported from dif-
ferent areas over the last two decades has varied from
84 to 112 MS cases per 100 000 [25–29,36–38]. No
latitudinal gradient between northern and southern
England was disclosed by Ford et al. [38] by means of a
702 M. Pugliatti et al.
� 2006 EFNS European Journal of Neurology 13, 700–722

prevalence study conducted in the Leeds Health
Authority in northern England for the year 1996 and
showing a total crude prevalence rate of 97 per 100 000.
In Great Britain, the female:male ratio for MS preval-
ence varied between 2.2 and 2.8 in Scotland and nor-
thern England [24,33,35,36,38].
Multiple sclerosis is more prevalent in the age group
of 50–64 years for Great Britain and northern Ireland
[24,33,35,36,38]. The highest annual MS incidence rates
ever reported was 12.0 per 100 000 for Scotland [24],
whereas mean incidence rate for England was 5.1 per
100 000 [36].
In northern England, the proportion of progressive
forms SP- and RP-MS (55%) appears to be greater than
RR- and PP-MS (31% and 14%, respectively) [38].
However, as most of these patients have been assessed
in hospital settings, the proportion of the progressive
course might be an overestimation. A study conducted
in Leeds showed that, in 1999, 38% of patients had RR-
MS or benign MS, 47% had SP-MS and RP-MS, and
15% had PP-MS [39]. The distribution of MS by dis-
ease course in northern Ireland shows that 48% of
patients have RR-MS, 40% have SP-MS and 12% have
PP-MS [35]. The PP-MS forms, demographically and
clinically characterized by the same authors, showed a
female:male ratio of 1.3 and a skewed EDSS distribu-
tion toward the scale higher scores [15,35]. The distri-
bution of prevalence cases by EDSS reported for
northern Ireland showed that 32% had a score of 0–3.5
and 20% of 7–9.5 [40].
As for the Republic of Ireland, MS prevalence was
recently investigated by McGuigan et al. [34] for two
different counties showing rates similar to those from
the UK at comparable latitudes, i.e. between 121 and
185 cases per 100 000 in year 2001. A gradient of the
female:male ratio was also observed: 1.7 in southern
versus 3.4 in northern Ireland. The highest prevalence
rates were found in the age group of 35–44 years in the
County of Donegal, north of Ireland [34].
Incidence was 4.5/100 000/year for Ireland [34]. As for
Ireland, the proportion of RR-MS is about 50%, that of
SP- and RP-MS is 38%, and 12% for PP-MS [34].
Scandinavia
Scandinavian countries are not homogeneous with
respect to the distribution of MS. In Norway, the
highest prevalence rate ever reported was of 164 per
100 000 in the Nord-Trøndelag County in the central
part [41]. However, the study was based on a small
population and hospital records. A prevalence rate of
120 per 100 000 was found in Oslo for the year 1995
[42]. Such rate is higher when only the native Norwe-
gians of Oslo are considered (136 per 100 000). Only
Poser definite MS was considered in the Oslo study and
the 1995 prevalence rate is therefore underestimated.
No significant differences in prevalence among the Oslo
patients of different areas of origin were observed,
pointing to some environmental factor sustaining MS in
the Oslo area [42]. These rates are higher than was
previously reported in Vestfold County, Norway (86
per 100 000 in 1983) [43], but comparable with more
recent Danish data (112 per 100 000) [44]. The increase
in prevalence rates is hypothesized to be partly because
of methodological differences in ascertainment over
time, and to an increased incidence because of biolo-
gical factor as well. In fact, MS clinical features also
seem to change over time and an increased proportion
of RR- versus PP-MS [45] or in females versus males
[43] is observed. An uneven distribution of prevalence
rates is observed throughout Norway. The prevalence
in north Norway was around 21 per 100 000 in 1973
[46]. A recent survey in the same region showed a rate
of 73 per 100 000 in 1993 but still lower than in the
rest of the country [47]. Such south-to-north decreasing
gradient in MS prevalence might be attributed to
either Sami’s genetic resistance to MS, or to the small
population size, or both. The mean age of prevalent
cases, mean age at onset, mean age at diagnosis, fe-
male:male ratio and the mean time from onset to
diagnosis was comparable with other data from the
studies conducted in Norway [43,48], Great Britain
[24,28,36,38] and Switzerland [49]. South-eastern Nor-
way appears therefore to be at especially higher risk for
MS. Prevalence is higher in the age group of 50–
59 years for both sexes in the south-east and western
regions [41,42] and between 40 and 49 years among the
Sami population [47].
Multiple sclerosis incidence rates in Norway
increased from 2.6 to 4.3 per 100 000 in the western and
northern regions in the past three decades [42,45,47],
whereas a fluctuating pattern was reported for Vestfold
with the highest rates in 1953–1957 (4/100 000/year)
and a more recent peak rate of 3.8 in 1973–1977 [43],
Nord-Trøndelag County [41] and Møre-Romsdal [48]
with a peak of 8.1 per 100 000 in the years 1984–1988
and among women, similar to that reported for Finland
[50]. The highest crude incidence of MS in Europe after
that reported for Scotland was observed in south-east-
ern Norway with a rate of 8.7/100 000/year [42]. Again,
such rate was based only on Poser definite cases and is
thus underestimated when compared with other sour-
ces. Moreover, the incidence rates might be biased
toward lower values because of the influx of young
second-generation immigrants who contribute to the
rate denominator, but are still too young to be at risk
[42]. The increase of incidence in Norway over time has
been more evident for RR-MS and in women, and thus
for more benign cases [42,43,51].
Epidemiology of MS in Europe 703
� 2006 EFNS European Journal of Neurology 13, 700–722

A proportion of 85% of relapsing and 15% of pro-
gressive onset was reported for the time-period 1950–
1984 in a study of prognostic factors for survival in MS
in Norway [52]. The distribution of cases by EDSS
shows that 77% have a score of 0–4.5 and 6% a score of
8.0–9.5 [51].
The most recent epidemiological data for Sweden are
based on multiple assessments carried out in the
Vasterbotten County, northern Sweden, which showed
an increase in the prevalence rates from 125 per 100 000
in 1990 to 154 in 1997 [53,54] with a more recent
female:male ratio of 1.9. Higher prevalence rates were
observed for the age group of 35–54 years for both men
and women in 1997 [54]. A prevalence rate of 96 per
100 000 in 1988 was previously assessed in Goteborg,
south-western Sweden, where an MS register has exis-
ted since the early 1950s [55]. An incidence rate of 5.2
per 100 000 was estimated for Vasterbotten County in
the time-period 1988–1997 [54]. The distribution of
patients by EDSS was 0–2.5 in 36%, 3.0–5.5 in 27%
and 6–9.5 in 37% of prevalent cases between 1997 and
1998 [56]. A proportion of 84% of RR-MS, 4% of
progressive-relapsing MS and 13% of PP-MS was
reported [53].
In Finland, the ethnic composition shows hetero-
geneity from the rest of Scandinavia. Data from the
western province of Vaasa and the southern province of
Uusimaa reveal an uneven distribution of MS in this
country, with a prevalence rate of 93 per 100 000 in
1993 (only definite cases according to Poser criteria
were considered) in a large population of Uusimaa, the
southernmost region of Finland where the diagnostic
facilities are provided by the University Hospital of
Helsinki [57]. MS prevalence was investigated in the
western part of Finland (Seinajoki and Vaasa districts)
for the same year but in smaller populations, and
showed rates of 188 and 107 per 100 000, respectively.
An increase of prevalence rates was found in Seinajoki
and Uusimaa districts for the period 1983–1993 and in
Vaasa especially among women [57]. MS was nearly
twofold more frequent among women than men, and in
the age group of 40–59 years in women and 50–59 years
in men. Incidence rates also differed from 8.7/100 000/
year in the western districts to 5.1 in the south, with the
highest rate of 11.6 in the Seinajoki district in western
Finland [50]. The increased incidence rate over time was
clearly shown to account for the high prevalence rates
in Seinajoki district. Such rates also appear to account
for the remarkable difference of MS frequency between
western and southern Finland [57]. Based on the evi-
dence of frequent familial MS occurrence in western
Finland, a higher genetic susceptibility to the disease
because of genetic drift phenomena related to the geo-
graphic isolation of many rural communities was
hypothesized to explain the difference in the absolute
high rates between regions [58], but environmental
factors are probably responsible for the increase of MS
over time in Seinajoki district [57].
Data on the distribution of disease course reported
based on the incident cases and modality of onset,
showed that, on average, 78% of incident cases were
relapsing and 22% progressive with no significant
change in the proportion over the time period 1979–
1993 [59].
The Danish MS Registry which was established in
Denmark in 1948 based on a nationwide survey on MS
has allowed the analysis of prevalence, incidence and
mortality trends through a 50-year follow-up. The
latest updates on MS prevalence showed a rate of 112
per 100 000 in 1990 [44] and 122 per 100 000 in 1996
(H. Brønnum-Hansen and N. Koch-Henriksen, pers.
obs.). Consistently with the Norwegian and Swedish
findings, these data point to a similar ethnic and
environmental background for the susceptibility to the
disease. Prevalence is higher in the age group of 35–
59 years [44]. The average annual incidence rate was
5.0 per 100 000 in 1980–1989 and the highest ever
reported for Denmark over a 40-year time interval
[44]. The distribution by sex and based on the cumu-
lative life-time incidence showed a female:male ratio of
1.4 [60].
In Iceland, recent epidemiological data on MS come
from a 50-year observational period of the disease in a
well-defined and stable population [61]. A threefold
increase of the MS prevalence was reported from 1950
to 1999 when the rate was 119 per 100 000, with a
female:male ratio of 2.2. However, such increase might
be largely due to the detection of relatively more benign
cases and the MS natural history in this country
appears to be more favorable than elsewhere. Improved
case ascertainment and the increased number of trained
neurologists over time could explain such a trend. The
risk is similar to that in England, Denmark, Sweden
and southern Norway in the early 1990s. Interestingly,
although Vikings from the west coast of Norway settled
in Iceland in the ninth and 10th centuries, studies on the
frequency of blood groups have shown that Icelanders
are genetically closer to the British and Irish popula-
tions than to the Norwegians [62].
Fluctuating patterns of incidence rates were observed
in Iceland in the time interval 1900–2000 ranging from 0
to 5/100 000/year, the latter peak rate was reported for
1981–1990 [61]. As for disease course and disability,
after a 15-year disease duration, 70% have an EDSS
score <4, 20% have a score between 4 and 6.5 and 10%
have a score of ‡7. After 30 years, 50% still have mild
disability and the remaining are in the moderate-to-
severe EDSS group. Progression in disability over a
704 M. Pugliatti et al.
� 2006 EFNS European Journal of Neurology 13, 700–722

15-year observational period occurs in 80% of PP- and
RP-MS versus 20% in RR- and SP-MS with initial low
EDSS score [61].
Germany, Switzerland and Austria
The most recent large population-based studies con-
ducted in Germany disclosed prevalence rates of 83 in
Gottingen in 1986 [63], 85 per 100 000 in southern
Hesse (onset-adjusted prevalence rates; 64] and 108 for
southern Lower Saxony, with no latitudinal gradient
but, rather, a homogeneous distribution. A total rate of
95 per 100 000 with a female:male ratio of 1.8 was
reported for the city of Bochum. More recently, based
on the representative samples of MS-treated patients
taken from physicians, the prevalence rate in Germany
was estimated as 127 per 100 000 [65]. The highest
prevalence was observed for the 40–59-year age group.
Incidence rates of 4.6/100 000/year were found in south
Lower Saxony [66] in the period 1975–1985 and 6.1/
100 000/year in the city of Bochum in similar time
interval [67], with some fluctuation over time [68]. An
incidence rate of 4.2 per 100 000 was found for the
period 1979–1992 (K. Lauer, Griesheim, pers. obs.).
The proportion of disease course has been reported for
the area of Rostock, Germany in the 1980s according to
which 20% of prevalent cases were RR-MS, 45% were
RP- and SP-MS and 35% were PP-MS, this last figure
being significantly higher than the European average.
The distribution of MS cases by disability approxi-
mately shows that 46% of patients have low EDSS
scores and 15% have high EDSS scores (K. Lauer, pers.
obs.).
In Switzerland, the most recent epidemiological sur-
vey reported a prevalence rate of 110 per 100 000 for
the Canton of Berne in 1986, with a female:male ratio
of 1.8 [69], a risk similar to that found in Germany in
the early 1990s. The distribution of total rates by age
indicated that the highest rates in the 40–50-year age
group [69]. The estimated total mean incidence for the
period 1961–1980 was 4/100 000/year, its trend showing
no significant fluctuations [69].
The most updated prevalence data for Austria have
been analyzed by using an extrapolation model in which
the frequency of patients� visits at MS clinics was
merged with findings from questioning patients [70]. A
total rate of 98 per 100 000 was estimated in 1999, with
a female:male ratio of 2.5. No recent data on incidence
are available. The clinical course based on the clinical
dataset, and therefore not fully representative of the
general MS population, was RR-MS in 64% of cases,
RP- and SP-MS in 28%, PP-MS in 4% and not defined
in 4% [70]. The same authors reported that 69% of
patients presented with a mild, 26% a moderate and
5% a severe disability.
The Netherlands, Belgium and France
In the Netherlands, MS frequency was assessed for the
province of Groningen in 1992, giving a prevalence of
76 per 100 000 [71] with higher estimated rates in the
age group of 50–64 years and an estimated female:male
ratio of 1.7. A mean total incidence rate of 3.0 was
reported for the province of Groningen for the period
1985–1990 [71]. Data on the distribution of prevalent
cases from the Groningen population in 1982 showed
that 24% patients had RR-MS, 47% had RP- or SP-
MS and 29% had PP-MS. As for disability, 43% of
cases had a mild course, whereas 18% and 39% a
moderate and severe course, respectively [72]. The
proportion of severe cases is the highest estimated in
Europe.
In Belgium, the prevalence in southern Flanders was
88 per 100 000 in 1991, 74 for men and 101 for women,
with a female:male ratio of 1.4 [73]. Probably, because
of the similar Germanic descent and exposure to envi-
ronmental risk factors, these rates do not appear to
differ from those from similar latitudes. In the same
survey, the highest total rates were estimated for the age
groups of 35–49 and 50–64 years, with women contri-
buting mostly in the first and men in the second group.
No data on incidence rates are available in the recent
literature. Disease course based on the incident cases
showed a relapsing–remitting onset in 85% and a pro-
gressive onset in 15% [73]. The distribution of prevalent
cases by disability was 54%, 23% and 23% for mild,
moderate and severe MS, respectively (H. Carton, pers.
comm.).
Multiple sclerosis prevalence in France is lower than
in other European countries at comparable latitudes. In
the 1980s, the rates reported for different French
regions varied from 37 to 58 per 100 000 [74–77], and
were similar to those found in Spain and mainland
Italy. Higher rates were observed for Chalon sur Saone
and Avignon in south-eastern France [75] and lower
ones were observed for Cote-d’Or in the north-east [74]
and the Pyrenees-Atlantiques in the south-west [77]. A
total mean prevalence rate of about 50 per 100 000 and
spatial aggregation of MS cases in the north-east were
reported from the nationwide survey conducted by
INSERM in 1986, which was based on the question-
naires returned by MS patients in reply to a television
announcement [78]. As the response rate varied among
different departments and regions, an inference bias
cannot be ruled out. A female:male ratio of 2.4 is
reported in the study from Pyrenees-Atlantiques [77]
and of 2.5 based on the incident cases from Dijon [79].
A northeast-to-southwest gradient was found for MS
mortality by Alperovitch and Bouvier (1982) [80] and
more recently by means of a survey conducted on the
whole French farming population with rates varying
Epidemiology of MS in Europe 705
� 2006 EFNS European Journal of Neurology 13, 700–722

from 100 to 50 per 100 000 and a mean of 65 per
100 000 [81]. A mean total incidence rate of 4.3/
100 000/year was reported for Dijon in the period
1993–1997 [79]. The same study shows that major dif-
ferences are observed for prevalence but not for inci-
dence, which is probably attributable to the focal
distribution of MS in ethnic groups at different risk for
the disease who reside in France. As for the disease
course, based on EDMUS, 58% of cases were RR-MS,
27% were SP-MS and 15% PP-MS [82]. No crude
recent data on prevalence distribution by age, or by
disease disability are available in the recent literature.
Poland, the Czech Republic and Hungary
The most recent prevalence and incidence survey on MS
in Poland was carried out for the region of Szczecin in
1995 and published in local scientific literature in Polish
[83]. The author found a prevalence of 55 per 100 000
with a peak of 110 in a region southern focus. An MS
prevalence was 51 per 100 000 in the Poznan area in
1982 with the highest rates in the age group of 45–
59 years [84]. However, in this study, arbitrarily selec-
ted criteria of �definite� and �possible� were used, thus
making comparisons and standardizations with other
population unreliable. The mean annual incidence rate
for the period 1993–1995 was 2.2 per 100 000 [83] in the
Szczecin region where a rate of 3.4/100 000/year had
been estimated for the time period 1960–1992 with a
decreasing trend over time leading to a mean rate of 1.4
in 1987–1992 [85]. Based on the incident cases, a
female:male ratio of 1.2 was reported for the Szczecin
region in 1960–1992. A recent local report from Lodz
shows that of 2500 patients followed at the MS center,
60% have a RR-MS, 32% an SP-MS and 8% a PP-MS
[86]. No recent data are available for prevalence by age
and sex, and by distribution by EDSS and disease
course.
Prevalence rates for MS in the Czech Republic are
unevenly distributed. The most recent surveys show a
prevalence of 71 per 100 000 in western former Cze-
choslovakia in 1984 [87] and between 78 and 160 in
smaller populations for three Bohemian districts in the
northern part of the Czech Republic in 1992 [88]. A 1.5
female:male ratio has been reported [89]. Mean annual
incidence rates between 4 and 8 per 100 000 were
reported for the years 1985–1990 [88]. No prevalence
data by age nor data on the distribution by disease
severity are available, but as for the disease course local
Czech data show that 55–70% are RR-, 28–35% are
RP- and SP- and 2–10% are PP-MS [90,91].
The MS prevalence rates found in Hungary in the
years between 1992 and 1996 ranged from 32 to 79 per
100 000, with lowest rates in Baranya County and
highest rates in Fejer County [92–94]. In the Gipsies,
prevalence varied between 5 per 100 000 in Baranya
County and 98 in Fejer County. More recent data
obtained for the the Csongrad County show a total
prevalence rate of 62 per 100 000 in 1999, with a fe-
male:male ratio of 2.7 [95]. No recent data are avail-
able on the distribution of prevalence rates by age.
Mean total incidence rate was estimated of 5.5/100 000
for the year 1997–1998. The distribution according to
disease course was 69% for the RR-MS and benign
forms, 20% for the RP- and SP-MS and 11% for PP-
MS. From the same study, 58% of patients were mild
cases, 22% were moderately and 20% were severely
disabled patients.
The Iberian peninsula, continental and insular (Sicily,
Sardinia) Italy and Malta
Prior to the late 1980s and based from information
from hospital records and mortality data, Spain and
Portugal had been included in the low–medium fre-
quency zone for MS [96]. From the beginning of 1990s,
along with the modernization of the public health sys-
tem, multiple population-based surveys were conducted
in Spain [97–103] that revealed rates ranging from 32
per 100 000 in the province of Teruel [99] to 65 in the
Gijon health district [100]. The most recent prevalence
investigations on larger populations were conducted for
northern, eastern and central Spain. Prevalence was 58
per 100 000 in 1997 in the health district of Valladolid
in the north [103], 32 in 1996 in the province of Teruel,
eastern Spain [98] and 43 in 1998 in the municipality of
Mostoles, central Spain [101]. The female:male ratio
was 2.0, 1.7 and 1.6, respectively. Spain can be now
considered a medium-risk area for MS and a latitude
gradient of prevalence can be reasonably ruled out. The
highest prevalence rates were observed in the age group
of 35–49 years for Teruel and Mostoles and in the ages
between 18 and 34 years for Valladolid. The average
annual incidence rate ranged from 2.2 per 100 000 in
the period 1992–1996 [99] to 3.8 in the period 1994–
1998 [101]. The distribution by disease course showed
that between 68% and 82% of patients have RR-MS,
9% and 12% have RP-SP-MS and between 9% and
20% have a PP-MS [101; 103]. The distribution by
disease severity has been multiply assessed, 58–80% of
cases being estimated to be mildly, 15–29% moderately,
and 5–18% severely disabled [99,101,103].
Data on MS in Portugal have recently been published
in the form of an abstract, which showed a prevalence
of 47 per 100 000 in Santarem in 1998 [104], a risk
similar to that in Spain.
Multiple and detailed epidemiological assessments on
MS have been conducted in Italy in the past two dec-
ades. For the Italian mainland, prevalence rates range
from 40 to 70 per 100 000 [105–109], with the exception
706 M. Pugliatti et al.
� 2006 EFNS European Journal of Neurology 13, 700–722

of Salerno with 35 per 100 000 in 1998 [110] and Valle
d’Aosta with 90 per 100 000 [111]. The most recent
population-based studies conducted on larger popula-
tions yielded different rates throughout the country. MS
prevalence rates from most significant studies in nor-
thern Italy varied from 81 per 100 000 in 1999 in the
province of Padova [112], 69 per 100 000 in 1993 in the
province of Ferrara [107], and 53 per 100 000 in 1996 in
the district of L’Aquila, central Italy [109]. As for
insular Italy, a prevalence rate of 59 per 100 000 in 1995
was found for the city of Catania in Sicily [113] and of
144 and 152 in the provinces of Nuoro and Sassari,
Sardinia, in 1994 and 1997, respectively [114; 115].
Female:male ratios varied from 1.2 to 2.3 and the
highest prevalence rates were found in the age group of
35–49 years all throughout the country and isles. The
increase of prevalence rates observed over time in all
surveys considered was ascribed to the better diagnostic
accuracy, the improvement of epidemiological metho-
dology and increased survival over time. Incidence
trend either remained stable [107] or its increase was
concomitant to the introduction of new diagnostic
procedures, i.e. oligoclonal band testing in CSF and
MRI [112]. However, when comparing incidence trends
among different Italian populations, better ascertain-
ment could not fully account for the observed increased
prevalence in Sardinia where rates are among the
highest worldwide [115]. Because of their peculiar gen-
etic structure and different environmental exposures,
Sardinians are probably more susceptible to the disease
when compared with mainland Italians or other
Mediterranean populations [116].
For the whole country, the mean annual incidence
tended to increase over time from 2.4 and 3.9 per
100 000 in 1990–1993 [107; 113] to 4.2 per 100 000 in
1995–1999 [112]. Incidence was significantly higher in
Sardinia with a rate of 6.8 per 100 000 in 1993–1997
[115].
According to the disease course, the proportion of
patients with RR-MS was 51–75%, it was 18–35% with
RP-SP-MS and 5–19% with PP-MS. The distribution
by EDSS showed that 62%, 15% and 24% of patients
present with the mild, moderate and severe form,
respectively.
Prevalence was recently updated for Malta, which
disclosed a rate of 17 per 100 000 in 1999 with a
female:male ratio of 1.5. The highest rates were observed
for the age group of 35–49 years [117]. The prevalence
increase in the Maltese-born population over time was
ascribed to a change in the population age structure, the
increased life expectancy in the general population and
earlier diagnoses. The genetic influence from northern
Africa, an area at low risk for MS, seems to account for
the low absolute MS frequency among the Maltese.
Mean incidence rate was 0.8/100 000/year in the period
1989–1998 [117]. No data are available for the distribu-
tion of prevalent cases by disease course and severity.
Former Yugoslavia (Slovenia, Croatia, Bosnia and
Herzegovina, Serbia and Montenegro, Rep. of
Macedonia) and Romania
A national survey carried out in Slovenia in 1992
revealed a prevalence rate of 83 per 100 000 [118],
similar to that reported in Germany, probably because
of Slovenians� strong Germanic admixture. A total
incidence rate of 2.9/100 000/year was estimated in the
early 1990s [118]. No data on the prevalence distribu-
tion by sex, age, disease course and severity are cur-
rently available for Slovenia.
A review of MS prevalence studies in Croatia con-
ducted in the time period 1969–2000 and published as
local reports was recently carried out [119]. The mean
total prevalence rates obtained by multiple assessments
in the past 10 years and with population sizes greater
than 50 000 showed a range of rates from 25 to 53 per
100 000; prevalence was 50 per 100 000 in 1998 in a
study conducted in Osijek-Baranya (approximately
300 000 population). An exception to these observa-
tions was the rate of 125 per 100 000 in 1999 reported
for the community of Gorski Kotar (population
56 050). Germanic ethnicity, a higher rate of consan-
guinity and the relatively small population size, could
account for such high rate in this isolated mountainous
community. The distribution of prevalence by sex also
varied from region to region, but a mean female:male
ratio of 1.8 was estimated. The annual mean incidence
in most recent studies varied from 1.3 (Northern
Adriatic Islands, 1956–1998) to 3.5 (Osijek-Baranya,
1991–1998) per 100 000; an incidence rate of 4.1 was
reported for Gorski Kotar in the time-period 1948–
1987 [119]. No data are available on the prevalence
distribution by age, and by disease course and severity.
The most recent prevalence data for Serbia were
assessed for the region of Belgrade in 1996 showing a
crude prevalence rate of 51 per 100 000 with a female:
male ratio of 1.9 [120]. The distribution of prevalence
rates by age was reported for two groups based on early
versus late onset. The highest rates were reported among
patients in the former group, in women and especially for
the age group of 21–50 years. The distribution according
to disease course showed a proportion of 51% RR-MS
cases, 36% RR- and SP-MS and 13% PP-MS. No data
are currently available for incidence and prevalence dis-
tribution according to disease severity.
In the Republic of Macedonia, the MS overall pre-
valence based on the patients treated at the Neurolog-
ical Clinic of Skopje was reported as 16 per 100 000 in
1991 with a female:male ratio of 1.7 [121]. Incidence
Epidemiology of MS in Europe 707
� 2006 EFNS European Journal of Neurology 13, 700–722

rates were reported to range between 0.2 and 1.2 per
100 000. No other data are currently available for this
country.
Only data published in local scientific literature are
available for MS epidemiology in Romania. In 1984, a
hospital-based epidemiologic survey conducted in a
large county by means of reviewing hospital medical
records in 34 Romanian counties (76% of the whole
Romanian population) estimated a mean prevalence
rate of 26 per 100 000 with a female:male ratio of 1.2
and the highest prevalence rates in the age group of 31–
50 years for both sexes [122,123]. More recently, a rate
of 21 per 100 000 was reported for the region of
Transylvania in 1986, with a female:male ratio of 1.3
[124]. A mean incidence rate of 0.9/100 000/year for the
time interval 1977–1986 was also found. As from a local
report on the distribution of MS-treated patients by
disease course, 61% of them had RR-MS, 24% had SP-
MS and 15% had PP-MS [125]. No data on the dis-
tribution of prevalent cases by disease severity are
currently available for Romania.
Bulgaria, Albania, Greece, Cyprus and Turkey
Several epidemiological assessments on MS in Bulgaria
are reported in literature. The most recent ones are
population-based studies conducted in two small com-
munities adding up to nearly 55 000 population show-
ing a mean total prevalence rate of 39 per 100 000 in
1995, and a female:male ratio of 2.0 [126]. In the urban
area of Sofia and the rural town of Somokov, the pre-
valence of MS was lower in Gipsies [127], similarly to
that reported for the Hungarian Baranya County [92].
The distribution of prevalent cases by age was reported
in an older population-based study conducted in the
Plovdiv area based on the rates in 1992, when the total
prevalence was 18 per 100 000 and highest rates were in
the age group of 40–49 years [128]. No updated inci-
dence data are currently available as well as the distri-
bution by disease severity. The disease course shows
that 32%, 50% and 18% are RR-MS, RP-SP-MS and
PP-MS, respectively [126].
The first survey of MS prevalence in Albania was
carried out for the year 1988, but it was based on the
criteria of Rose et al. [129] for definite and probable
MS. A prevalence rate of 10 per 100 000 with a fema-
le:male ratio of 1.1 and highest rates in the age group of
40–49 years were reported [130]. The mean annual
incidence rate was 0.5 per 100 000 for the period 1968–
1987. No data for the distribution by disease course and
severity are available for Albania.
The most recent prevalence rates of MS for Greece
were of 39 per 100 000 for the provinces of Evros in 1999,
with a female:male ratio of 2.8 [131]. The authors report
the highest prevalence rates for the age group of 25–
45 years for both sexes. The mean annual incidence rate
increased from0.7per 100 000 in the period 1974–1978 to
2.4 per 100 000 in the period 1994–1999.According to the
distribution by disease course, 63% had RR-MS, 25%
had RP-SP-MS and 12% PP-MS. No data on the dis-
tribution of prevalence by severity were presented.
Multiple sclerosis prevalence rates in Cyprus vary
according to whether the studies are conducted in the
whole population, or in the Greek or Turkish Cypriot
populations [132,133]. A total prevalence rate of 45 per
100 000 was reported for 1988 in the native Cypriots
residing in the districts of Paphos and Famagusta, and
in an inner montaneous area [132]. An MS prevalence
in Cypriots in the Republic of Cyprus (Greek part) does
not differ from northern Cyprus (Turkish part), but is
considerably lower in the Turkish immigrant popula-
tion of northern Cyprus. When the population of
refugees was included, the prevalence rate was 39 per
100 000. A female:male ratio of 1.1 was reported
whether only the native Cypriots or also the refugees
were included. No crude data on the prevalence distri-
bution by age can be extrapolated from this study;
however, 93% of prevalent cases appear to be distri-
buted between age 20 and 59. No incidence data are
available. An RR-MS was estimated to be 95% of
cases, the remaining being transitional forms to pro-
gressive cases. As for disease severity, 56% patients
were estimated to have mild disability, 23% a moderate
and 21% a severe one.
Epidemiological data on MS in Turkey have been
reported recently for the metropolitan area of Edirne
city, in the north-western part [134]. Prevalence was 30
per 100 000 in 2003, with a 2.3 female:male ratio and
76% of prevalent cases being RR-MS.
Estonia, Latvia, Lithuania, Belarus, Ukraine and Russia
The prevalence studies of MS carried out in Russia and
other countries of the former Soviet Union after 1970
were reviewed by Boiko et al. [135,136]. The inter-
pretation of such data from this vast territory is
particularly difficult because of relevant differences in
the population ethnicity, to the variability in the
geographic and social features of the surveyed areas, to
the high rate of migration and to the poor organization
of the epidemiological studies. Rates within each of
these countries are therefore probably to be underesti-
mated and a simple west-to-east gradient can be ruled
out.
The best estimate of the total prevalence rate in
Estonia based on a mean of rates among native Esto-
nians, Russians and other nationality and based on the
mean among different counties was 51 per 100 000 in
1989 (55 in Estonians and 29 in Russians) with a 2.0
female:male ratio and highest rates observed in the age
708 M. Pugliatti et al.
� 2006 EFNS European Journal of Neurology 13, 700–722

group of 35–49 years for both sexes [137]. The Schu-
macher Committee diagnostic criteria were used in this
study. No data on incidence, the distribution by disease
course or severity, have been reported for Estonia.
For Latvia, prevalence rates were reported to range
between 38 and 85 per 100 000 in the late 1960s and 55
per 100 000 in the Pskov region in 1980 [135]. No fur-
ther epidemiological data are currently available in the
international literature on Latvia. A prevalence rate of
35 per 100 000 was registered for Lithuania and a range
from 20 to 55 per 100 000 in Belorus around the early
1980s [135].
From the recent and local epidemiological surveys, it
is possible to estimate an MS prevalence rate of 41 per
100 000 for central and south-western Ukraine for year
2001 with a female:male ratio of 2.1 [138]. In a previous
survey in the same area, the highest prevalence rates
were reported in the age group of 30–49 years [139]. In
the same study, the mean annual incidence rate for the
period 1990–1994 was 0.7 per 100 000. As for the dis-
tribution by disease course, 52%, 37% and 11% pre-
sented with RR-, RP-SP, and PP-MS, respectively
[138].
In Russia, prevalence rates were estimated to be
around 30 per 100 000 between the 1970s and 1990s
[135]. A new extended study on MS prevalence was
carried out in the whole country, showing prevalence
ranging from 31 in Ufa to 60 per 100 000 in Novosib-
irsk [140]. The same study showed incidence rates of
3/100 000/year in Iaroslavl in 1996–2001.
Summary
MS prevalence rates
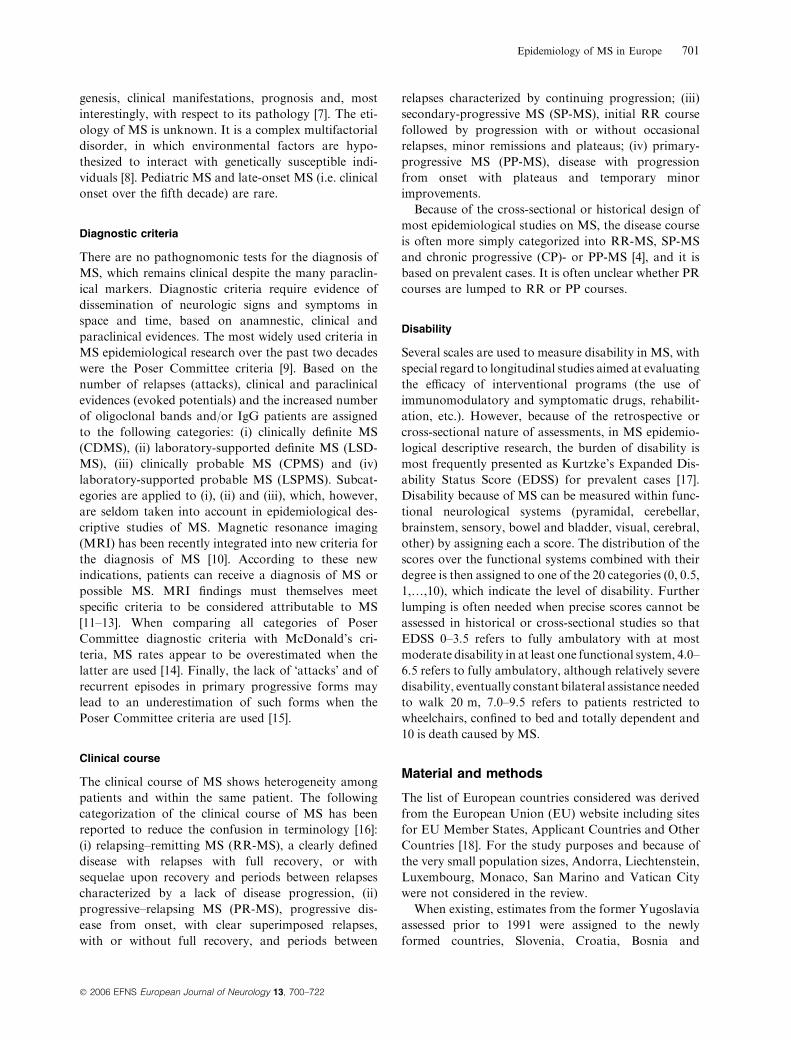
The distribution of total prevalence rates for each of the
country with available reliable data is reported in Fig. 1
and Table 1. Mean rates are higher in northern coun-
tries, also likely ascribed to a better degree of disease
ascertainment, i.e. better accuracy in survey metho-
dology (nationwide investigations and the use of
registry systems) and repeated assessments over time.
Nevertheless, a certain extent of prevalence hetero-
geneity was found within countries, such as in Sardinia
(Italy), Scotland (UK), or southern Norway. Therefore,
the role of environmental factors and their interaction
with the population specific genetic susceptibility in
119(119)
(112)
110
(76)
88
50
55
71
62
47
8337
51
3916
1039
(39)
51
55
36
21
99
140
154
65
50
113
95
35
96
55
156
186
17
55
3639(47)
140
6131
(39)
(10)
(50)
126
7183
135
216 10186
(16)
42
(81)
55
65
(55)
(83)(50)(62)
(83)
(98)
(71)
112
86
74
(120)
165
153
(60)(31)
(93)
(21)
(41)
(55)
(35)
(55)
56
Figure 1 Multiple sclerosis prevalence rates in Europe (adjusted for the European population; in brackets crude rates when adjustment
was not possible).
Epidemiology of MS in Europe 709
� 2006 EFNS European Journal of Neurology 13, 700–722
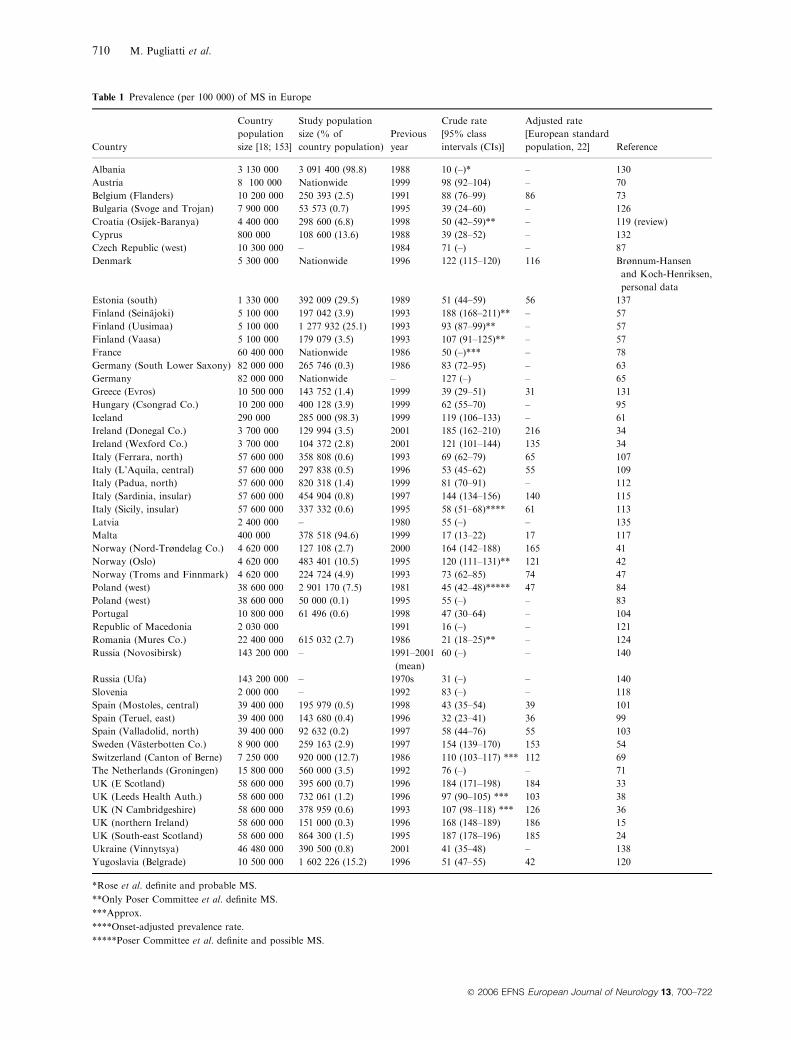
Table 1 Prevalence (per 100 000) of MS in Europe
Country
Country
population
size [18; 153]
Study population
size (% of
country population)
Previous
year
Crude rate
[95% class
intervals (CIs)]
Adjusted rate
[European standard
population, 22] Reference
Albania 3 130 000 3 091 400 (98.8) 1988 10 (–)* – 130
Austria 8 100 000 Nationwide 1999 98 (92–104) – 70
Belgium (Flanders) 10 200 000 250 393 (2.5) 1991 88 (76–99) 86 73
Bulgaria (Svoge and Trojan) 7 900 000 53 573 (0.7) 1995 39 (24–60) – 126
Croatia (Osijek-Baranya) 4 400 000 298 600 (6.8) 1998 50 (42–59)** – 119 (review)
Cyprus 800 000 108 600 (13.6) 1988 39 (28–52) – 132
Czech Republic (west) 10 300 000 – 1984 71 (–) – 87
Denmark 5 300 000 Nationwide 1996 122 (115–120) 116 Brønnum-Hansen
and Koch-Henriksen,
personal data
Estonia (south) 1 330 000 392 009 (29.5) 1989 51 (44–59) 56 137
Finland (Seinajoki) 5 100 000 197 042 (3.9) 1993 188 (168–211)** – 57
Finland (Uusimaa) 5 100 000 1 277 932 (25.1) 1993 93 (87–99)** – 57
Finland (Vaasa) 5 100 000 179 079 (3.5) 1993 107 (91–125)** – 57
France 60 400 000 Nationwide 1986 50 (–)*** – 78
Germany (South Lower Saxony) 82 000 000 265 746 (0.3) 1986 83 (72–95) – 63
Germany 82 000 000 Nationwide – 127 (–) – 65
Greece (Evros) 10 500 000 143 752 (1.4) 1999 39 (29–51) 31 131
Hungary (Csongrad Co.) 10 200 000 400 128 (3.9) 1999 62 (55–70) – 95
Iceland 290 000 285 000 (98.3) 1999 119 (106–133) – 61
Ireland (Donegal Co.) 3 700 000 129 994 (3.5) 2001 185 (162–210) 216 34
Ireland (Wexford Co.) 3 700 000 104 372 (2.8) 2001 121 (101–144) 135 34
Italy (Ferrara, north) 57 600 000 358 808 (0.6) 1993 69 (62–79) 65 107
Italy (L’Aquila, central) 57 600 000 297 838 (0.5) 1996 53 (45–62) 55 109
Italy (Padua, north) 57 600 000 820 318 (1.4) 1999 81 (70–91) – 112
Italy (Sardinia, insular) 57 600 000 454 904 (0.8) 1997 144 (134–156) 140 115
Italy (Sicily, insular) 57 600 000 337 332 (0.6) 1995 58 (51–68)**** 61 113
Latvia 2 400 000 – 1980 55 (–) – 135
Malta 400 000 378 518 (94.6) 1999 17 (13–22) 17 117
Norway (Nord-Trøndelag Co.) 4 620 000 127 108 (2.7) 2000 164 (142–188) 165 41
Norway (Oslo) 4 620 000 483 401 (10.5) 1995 120 (111–131)** 121 42
Norway (Troms and Finnmark) 4 620 000 224 724 (4.9) 1993 73 (62–85) 74 47
Poland (west) 38 600 000 2 901 170 (7.5) 1981 45 (42–48)***** 47 84
Poland (west) 38 600 000 50 000 (0.1) 1995 55 (–) – 83
Portugal 10 800 000 61 496 (0.6) 1998 47 (30–64) – 104
Republic of Macedonia 2 030 000 1991 16 (–) – 121
Romania (Mures Co.) 22 400 000 615 032 (2.7) 1986 21 (18–25)** – 124
Russia (Novosibirsk) 143 200 000 – 1991–2001
(mean)
60 (–) – 140
Russia (Ufa) 143 200 000 – 1970s 31 (–) – 140
Slovenia 2 000 000 – 1992 83 (–) – 118
Spain (Mostoles, central) 39 400 000 195 979 (0.5) 1998 43 (35–54) 39 101
Spain (Teruel, east) 39 400 000 143 680 (0.4) 1996 32 (23–41) 36 99
Spain (Valladolid, north) 39 400 000 92 632 (0.2) 1997 58 (44–76) 55 103
Sweden (Vasterbotten Co.) 8 900 000 259 163 (2.9) 1997 154 (139–170) 153 54
Switzerland (Canton of Berne) 7 250 000 920 000 (12.7) 1986 110 (103–117) *** 112 69
The Netherlands (Groningen) 15 800 000 560 000 (3.5) 1992 76 (–) – 71
UK (E Scotland) 58 600 000 395 600 (0.7) 1996 184 (171–198) 184 33
UK (Leeds Health Auth.) 58 600 000 732 061 (1.2) 1996 97 (90–105) *** 103 38
UK (N Cambridgeshire) 58 600 000 378 959 (0.6) 1993 107 (98–118) *** 126 36
UK (northern Ireland) 58 600 000 151 000 (0.3) 1996 168 (148–189) 186 15
UK (South-east Scotland) 58 600 000 864 300 (1.5) 1995 187 (178–196) 185 24
Ukraine (Vinnytsya) 46 480 000 390 500 (0.8) 2001 41 (35–48) – 138
Yugoslavia (Belgrade) 10 500 000 1 602 226 (15.2) 1996 51 (47–55) 42 120
*Rose et al. definite and probable MS.
**Only Poser Committee et al. definite MS.
***Approx.
****Onset-adjusted prevalence rate.
*****Poser Committee et al. definite and possible MS.
710 M. Pugliatti et al.
� 2006 EFNS European Journal of Neurology 13, 700–722

increasing MS frequency cannot be ruled out. A ten-
dency for a decreasing variability in prevalence rates
among and within countries has been observed over
time, which might point to a widespread improvement
of case ascertainment and survey methodology in the
same time frame, rather than to biological factors
accounting for such variability.
MS prevalence by gender
The estimation of prevalence rates by gender could be
computed from data deriving from the following
countries: Austria, Belgium, Cyprus, Denmark, Esto-
nia, Finland, France, Germany, Greece, Hungary, Ice-
land, Ireland, Italy, Malta, Norway, Spain, Sweden,
Switzerland, the Netherlands and UK (Table 2). Pre-
valence rates range from 11 to 282 per 100 000 in
women and from 10 to 123 in men, with a female:male
ratio between 1.1 and 3.4. Prevalence rates are higher
for women in each of the countries considered. How-
ever, lower gender ratios (in the distribution first
quartile, i.e. between 1.1 and 1.5) were reported for
Malta, Czech Republic, Belgium, Denmark, Romania,
Table 2 Prevalence (per 100 000) of MS in Europe by gender
Country Previous year Women (95% CIs) Men (95% CIs) Women:men ratio Reference
Albania 1988 11(–)* 10(–)* 1.1 130
Austria 1999 – – 2.5** 70
Belgium (Flanders) 1991 101 (80–115) 74 (59–89) 1.4 73
Bulgaria (Svoge and Trojan) 1995 52 (28–87) 26 (10–54) 2.0 126
Croatia 1969–1991 – – 1.8 119
Cyprus 1988 39 (24–59) 37 (23–57) 1.1 132
Czech Republic 1970–1978 (mean) – – 1.5 89
Denmark 1996 155 (145–165) 89 (84–95) 1.8 Brønnum-Hansen,
personal data
Estonia (south) 1989 63 (53–75) 37 (29–47) 2.0 137
Finland (Uusimaa) 1993 123 (114–132)*** 60 (54–67)*** 2.3 57
Germany (South Lower Saxony) 1986 – – 2.9 63
Greece (Evros) 1999 – – 2.8 131
Hungary (Csongrad Co.) 1999 182 (–) 66 (–) 2.7 95
Iceland 1999 157 (136–181) 72 (59–88) 2.2 61
Ireland (Co. Donegal) 2001 282 (243–327) 85 (64–111) 3.4 34
Ireland (Co. Wexford) 2001 154 (122–191) 88 (64–117) 1.7 34
Italy (Ferrara, north) 1993 91 (78–106) 46 (36–58) 2.1 107
Italy (L’Aquila, central) 1996 68 (57–83) 37 (28–48) 2.1 109
Italy (Padua, north) 1999 111 (99–123) 50 (41–58) 2.3 112
Italy (Sardinia, insular) 1997 205 (188–224) 83 (72–95) 2.5 115
Italy (Sicily, insular) 1995 62 (51–75)**** 55 (44–68)**** 1.2 113
Malta 1999 20 (14–27) 13 (8–19) 1.5 117
Norway (Nord-Trøndelag Co.) 2000 205 (171–243) 123 (97–153) 1.7 41
Norway (Oslo) 1995 – – 2.1** 42
Norway (Troms and Finnmark) 1993 89 (73–108) 58 (46–73) 1.4 47
Republic of Macedonia 1990s – – 1.7 121
Romania (Mures Co.) 1986 – – 1.3 124
Spain (Mostoles, central) 1998 54 (40–70) 33 (23–47) 1.6 101
Spain (Teruel, east) 1996 41 (26–55) 24 (12–35) 1.7 99
Spain (Valladolid, north) 1997 74 (52–102) 41 (24–65) 2.0 103
Sweden (Vasterbotten Co.) 1997 202 (179–228) 105 (89–125) 1.9 54
Switzerland (Canton of Berne) 1994 137 (127–148) 62 (56–69) 1.8 69
The Netherlands (Groningen) 1992 – – 1.7 71
UK (E Scotland) 1996 262 (241–285) 100 (86–115) 2.8 33
UK (Leeds Health Auth.) 1996 141 (–) 52 (–) 2.8 38
UK (N Cambridgeshire) 1993 – – 2.2 36
UK (northern Ireland) 1996 230 (–) 104 (–) 2.3 15
UK (South-east Scotland) 1995 257 (242–272) 112 (102–122) 2.5 24
Ukraine (Vinnytsya) 2001 – – 2.1 138
Yugoslavia (Belgrade) 1996 54 (49–59)** 28 (24–32)** 1.9 120
*Rose et al. definite and probable MS.
**Only Poser Committee et al. definite MS.
***Age-adjusted data.
****Onset-adjusted prevalence rate.
Epidemiology of MS in Europe 711
� 2006 EFNS European Journal of Neurology 13, 700–722

Sicily (Italy), Albania and Cyprus. The highest gender
ratio (in the distribution third quartile, i.e. between 2.3
and 3.4) was reported for northern Ireland and Ireland,
UK (Scotland), Finland, Italy (north and Sardinia),
Austria, Germany, Hungary and Greece.
MS prevalence by age
Prevalence rates by age have been computed based on
the data from the following countries: Belgium, Den-
mark, Estonia, Greece, Ireland, Italy, Malta, Norway,
Poland, Spain, Sweden, Switzerland and UK (Table 3).
Mean total prevalence estimates by age group varied
significantly within countries, ranging from 0 (Greece
and Mala) to 22 (northern Spain) per 100 000 for the
age group of 0–17 years, 16 (Greece) to 147 (Sardinia,
Italy) for the age group of 18–34 years, 36 (Malta) to
383 (Scotland, UK) for the age group of 35–49 years,
24 (Greece) to 377 (northern Ireland, UK) for the age
group of 50–64 years, 0 (Malta) to 313 (northern Ire-
land, UK) for age group of 65–74 years, and 0 (Malta
and Sicily, Italy) to 120 (Norway) for age 75 years and
above. The highest prevalence estimates have been
reported for age group of 35–49 for all countries con-
sidered, with the exception of Ireland, UK (northern
Ireland and Scotland) and Norway, where prevalence
was higher in the age group of 50–64 years.
MS incidence estimates
The distribution of available crude total incidence rates
is reported in Fig. 2 and Table 4. European total mean
MS incidence rate is estimated to be four cases per
100 000/year based on the data from Albania, Croatia,
Czech Republic, Denmark, Finland, France, Germany,
Greece, Hungary, Iceland, Italy, Malta, Norway,
Poland, Rep. of Ireland, Romania, Slovenia, Spain,
Sweden, Switzerland, the Netherlands, Ukraine and
UK. Total mean incidence rates are lower (below the
distribution first percentile) in Albania, Malta, Poland,
Republic of Macedonia, Romania, Spain and Ukraine,
and higher (over the distribution third quartile) in
Czech Republic, Finland, Hungary, Italy (Sardinia),
Norway and UK (Scotland). For the time-period con-
sidered, peaks of incidence rates were registered in
Seinajoki, Finland (11.6/100 000/year), south-eastern
Scotland (9.3/100 000/year), eastern Norway (8.7/
100 000/year) and northern Sardinia, Italy (6.8/
100 000/year).
The distribution of MS by disease course
The distribution of prevalent cases by disease course is a
hard task in that classification can be especially con-
fusing between the RP-MS and SP-MS. Furthermore,
depending on the article-specific purposes, these two
Table 3 Prevalence (per 100 000) of MS in Europe, by age
Country
Previous
year
0–17
year
18–34
year
35–49
year
50–64
year
65–74
year
75+
years Reference
Belgium (Flanders) 1991 1 61 161 157 86* 32* 73
Denmark 1996 5 51 195 236 228 112 Brønnum-Hansen,
personal data
Estonia (south) 1989 1 47 141 71 17 8 137
Greece (Evros) 1999 5 59 85 41 5 5* 131
Ireland (Co. Wexford and Donegal) 2001 4 84 346 358 224 94 34
Italy (Ferrara, north) 1993 6 63 125 104 38 13 107
Italy (L’Aquila, central) 1996 10 86 103 51 7* 7* 109
Italy (Sardinia, insular) 1997 7 147 312 163 82* 61* 115
Italy (Sicily, insular) 1995 5 65 137 77 25 0 113
Malta 1999 0 26 36 28 0 0 117
Norway (Nord-Trøndelag Co.) 2000 0 102 282 349 194 122 41
Norway (Oslo) 1995 2 65 200 255 177 90 42**
Poland 1981 1 73 75 68 16* 16* 84
Spain (Mostoles, central) 1998 6 43 88 37 8* 8* 101
Spain (Teruel, east) 1996 2 51 78 33 6* 6* 99
Spain (Valladolid, north) 1997 22 91 78 57 5* 5* 103
Sweden (Vasterbotten Co.) 1997 4 103 295 267 223 87 54
Switzerland (Canton of Berne) 1986 5* 55* 120–230* 220* 115–220* 40* 69
UK (East Scotland) 1996 4 91 383 358 176 89 33
UK (Leeds Health Auth.) 1996 – 15–70* 150–250* 200–250* 150* 60* 38
UK (North Cambridgeshire) 1993 – 10–75* 200–300* 250–300* 170* 75* 36
UK (northern Ireland) 1996 4 81 343 377 313 60 15
UK (South-east Scotland) 1995 7 97 356 363 261 103 24
*Approx.
**Only Poser Committee et al. definite MS.
712 M. Pugliatti et al.
� 2006 EFNS European Journal of Neurology 13, 700–722

categories are sometimes omitted, or the trend during the
disease early phase is only considered. RR-MS ranged
from 24% (The Netherlands) to 88% (Greece) of pre-
valent cases. The combined proportion of RP-MS and
SP-MS ranged from 4% (Sweden) to 50% (Bulgaria),
whereas PP-MS ranged from 4% (Austria) to 35% (The
Netherlands). The distribution of prevalent cases by
disease course is reported in Fig. 3 and Table 5.
The distribution of MS by severity
In most studies, the distribution of disease severity was
expressed by using the proportion of disability
according to Kurtzke’s EDSS in prevalent cases. The
estimated proportion range for mild MS (EDSS 0–3.5)
was 33% (UK) to 80% (Spain); it was between 13%
(Italy) and 48% (UK) for moderate MS (EDSS 4–6.5)
and between 5% (Austria) and 39% (The Netherlands)
for severe MS (EDSS 7–9.5) (Fig. 4 and Table 6).
MS mortality rates and survival time
Multiple sclerosis is associated with an elevated risk for
death. Multiple sclerosis mortality rates in Europe
range from 0.5 to 3.6 per 100 000, within decreasing
trends over time reported for Denmark, Scotland, The
Netherlands, Switzerland, Germany, Austria and Por-
tugal [141–143], increasing trends in Norway, Sweden,
Bulgaria and in Italy for women [51,141,144,145]. The
highest mortality rates from MS in Austria were
observed for the age group of 50–69 and with a fema-
le:male ratio of 2.0 [143]. In the same study, the total
median age at death from MS was 59 years between
1990 and 2001, with a 15-year shorter life expectancy
than the general population. Mean survival time after
onset ranges from about 30 to 45 years [142,146–148].
Discussion
Despite the wealth of data from systematic epidemio-
logical studies on MS conducted over the past three
decades, reliable information on age-specific prevalence
rates, on the distribution of prevalent cases by disease
severity and course, and on incidence rates is lacking for
nearly two-thirds of all European countries. The
attempt to redefine the geographical pattern of MS in
1193.7
5.0
110
3.0
88
50
55
71
62
47
8337
51
3916
1039
51
55
36
21
99
140
154
65
50
113
95
35
30
96
55
156
186
0.8
3.8
6.82.4
0.5
4.3
4.8
5.1
12.0
0.7
4.2
2.2
02.2.9
6.0
4.2
6.0
4.0
8.75.2
5.1
3.0
0.9
0.7
Figure 2 Multiple sclerosis crude incidence rates in Europe.
Epidemiology of MS in Europe 713
� 2006 EFNS European Journal of Neurology 13, 700–722

Europe is a hard task because of: (i) the variability of
the surveyed populations with respect to size, age
structure, ethnicity; (ii) the capability to detect benign
and/or early cases; (iii) the different degree of case
ascertainment coverage based on the geographic and
time setting, access to medical care, number of neuro-
Table 4 Incidence (per 100 000/year) of MS
in Europe
Country
Time
interval
Study
population
size (ca.) Rate (95% CI) Reference
Albania 1968–1987 3 091 000 0.5 (0.4–0.6) 130
Czech Republic 1985–1990 – 6.0 (–)* 88
Denmark 1980–1989 Nationwide 5.0 (4.8–5.2) 44
Finland (Seinajoki) 1979–1993 197 000 11.6 (10.1–13.1)** 50
Finland (Uusimaa) 1979–1993 1 278 000 5.1 (4.1–6.3)** 50
Finland (Vaasa) 1979–1993 179 000 5.2 (4.8–5.5)** 50
France 1993–1997 94 000 4.3 (2.9–7.2) 79
Germany 1979–1992 100 000 4.2 (–) Lauer,
personal
data
Greece (Evros) 1994–1999 143 000 2.4 (1.4–3.7) 131
Hungary 1998 400 128 6.0 (–) 95
Iceland 1991–1995 255 000 3.7 (–) 61
Ireland (Co. Donegal) 2001 129 994 5.1 (1.6–11.7) 34
Ireland (Co. Wexford) 2001 104 372 4.5 (0.3–8.7) 34
Italy (Ferrara, north) 1990–1993 368 000 2.4 (1.6–3.4) 107
Italy (Padua, north) 1995–1999 820 000 4.2 (3.7–4.7) 112
Italy (Sardinia, insular) 1993–1997 432 000 6.8 (5.8–7.9) 115
Italy (Sicily, insular) 1990–1994 338 000 3.9 (3.0–5.0) 113
Malta 1989–1998 400 000 0.8 (–) 117
Norway (Nord-Trøndelag Co.) 1974–1998 127 000 5.3 (3.7–7.5) 41
Norway (Oslo) 1992–1996 484 000 8.7 (6.3–11.9)** 42
Norway (Troms and Finnmark) 1989–1992 225 000 4.3 (3.0–5.9) 47
Poland (west) 1993–1995 50 000 2.2 (–) 83
Republic of Macedonia 1990s – 0.7 (–)* 121
Romania (Mures Co.) 1976–1986 600 000 0.9 (–)** 124
Russia (Iaroslavl) 1996–2001 – 3.0 (–) 140
Slovenia 1990s 2.9 (–) 118
Spain (Mostoles) 1994–1998 196 000 3.8 (2.7–5.3) 101
Spain (Teruel) 1992–1996 143 000 2.2 (–) 99
Sweden (Vasterbotten Co.) 1988–1997 256 000 5.2 (4.4–6.2) 54
Switzerland (Canton of Berne) 1961–1980 920 000 4.0 (3.7–4.3) 69
UK (North Cambridgeshire) 1990–1995 379 000 4.8 (3.8–6.0) 36
UK (South-east Scotland) 1992–1995 864 000 12.0 (10.6–13.3) 24
Ukraine (Vinnytsya) 1990–1994 390 000 0.7 (–) 139
*Approx.
**Only Poser Committee et al. definite MS.
%
0
20
40
60
80
100
Aus
tria
Bel
gium
Bul
garia
Cze
ch R
epub
lic
Fin
land
Fra
nce
Ger
man
y
Gre
ece
Hun
gary
Irel
and
Italy
Nor
way
Pol
and
Rom
ania
Spa
in
Sw
eden
Thw
Net
herla
nds
UK
Ukr
aine
Yug
osla
via
unknown
PP-MS
RP-SP-MS
RR-MS
Figure 3 Estimated proportion of MS
cases by disease course based on the
prevalence.
714 M. Pugliatti et al.
� 2006 EFNS European Journal of Neurology 13, 700–722

logists, availability of new diagnostic procedures, public
awareness about MS; (iv) the impact of different
diagnostic criteria used and the interobserver variability
when comparing incidence and prevalence rates
between studies.
A decreasing north-to-south gradient in the distri-
bution of MS prevalence rates across Europe is
observed. Although assessment biases might play a
role in such distribution, biological factors, i.e. differ-
ences in environmental exposures, and/or different
genetic susceptibility underlying such differences can-
not be ruled out. Mean rates tend to be higher in
countries where the degree of disease investigation is
also higher, where a better accuracy in survey meth-
odology is used and where assessments have been
repeatedly conducted over time, often based on
nationwide surveys and on the use of registry systems.
In this perspective, the positive correlation between
MS prevalence and degree of country socioeconomic
level can be confounded by the quality and number of
epidemiological assessments conducted. The tendency
for a decreased variability in prevalence rates among
and within countries over time and an increase of
prevalence and incidence rates over time where mul-
tiple assessments have been carried out also seems to
20
40
60
80
100
%
Aus
tria
Bel
gium
Ger
man
y
Hun
gary
Italy
Spa
in
Nor
way
Sw
eden
UK
(Nor
ther
n Ire
land
)
The
Net
herla
nds
EDSS 7.0–9.5
EDSS 4.0–6.5
EDSS 0–3.5
Figure 4 Estimated proportion of MS cases by disease severity
(EDSS) based on the prevalence.
Table 5 Proportion (%) of MS patients by
disease course in EuropeCountry Year
RR
(%)
RP-SP
(%)
PP
(%) Reference
Austria 1999 64* 28* 4* 70
Belgium (Flanders) 1991 85** – 15** 73
Bulgaria (Svoge and Trojan) 1995 32 50 18 127
Cyprus 1988 95 – – 132
Czech Republic 2004 55 35 10 90
Finland 1979–1993 78 – 22 59
France 1997 58 27 15 82
Germany (South Lower Saxony) 1986 63 25 12 63
Greece (Evros) 1999 87.5** – 12.5** 131
Hungary (Csongrad Co.) 1996 69 20 11 95
Ireland (Co. Donegal) 2001 51 38 11 34
Ireland (Co. Wexford) 2001 49 39 12 34
Italy (Ferrara, north) 1993 52 29 19 107
Italy (L’Aquila, central) 1996 75 18 7 109
Italy (Sicily, insular) 1995 51 35 5 113***
Norway (Nord-Trøndelag Co.) 2000 54 29 17 41
Norway (Oslo) 1995 78** – 22** 42****
Norway (Troms and Finnmark) 1993 79** – 21** 47
Poland 2004 60 32 8 86
Romania 2004 61 24 15 125
Spain (Mostoles, central) 1998 70.5 10.5 19 101
Spain (Teruel, east) 1996 82 9 9 99
Spain (Valladolid, north) 1997 68 12 20 103
Sweden 1997 84 4 13 53
The Netherlands (Groningen) 1982 24 47 29 71
UK (Leeds Health Auth.) 1996 38 47 15 39
UK (North Cambridgeshire) 1993 55 23 22 36
UK (northern Ireland) 1996 48 40 12 15
Ukraine (Vinnytsya) 2001 52 37 11 138
Yugoslavia (Belgrade) 1996 51 36 13 120
*4% Unknown.
**Initial course.
***9% unknown.
****Only Poser Committee et al. definite MS.
Epidemiology of MS in Europe 715
� 2006 EFNS European Journal of Neurology 13, 700–722

be pointing to a general improvement in case ascer-
tainment and survey methodology in time.
When multiple regression models were used to pre-
dict the degree of MS prevalence according to latitude,
a latitudinal gradient was found if crude prevalence
rates were considered [149]. However, for prevalence
and incidence rates, age-adjusted to the European (and
world) population a weak correlation was found, which
points to the populations age structure as a relevant
factor underlying the differences in MS distribution.
Nevertheless, a certain extent of heterogeneity has
been found within countries. In fact, significantly higher
rates have been reported for Sardinia as opposed to
mainland Italy, in Scotland as opposed to the rest of
UK, and in Norwegian southern regions, which might
point to a role of the interaction between specific yet
unknown environmental factors and the population
specific genetic susceptibility. Moreover, as incidence is
reported to be increasing over time, when quantifying
the burden of MS such trend should not be overlooked
as it implies greater prevalence rates in the aging pop-
ulation in the future.
A general methodological issue encountered in
reviewing the current epidemiology ofMS in Europe was
categorization. A great deal of variability in categorizing
variables (age group, disease course, disease severity) is
observed among studies, which thus yield to results that
are not or just hardly comparable among each other.
Sometimes, crude figures are not reported and any at-
tempt at assigning cases to a standard referral categor-
ization for all countries cannot but lead to �best guesses�.The different age group categories used in the
reported studies and the frequent lack of crude data
make a precise quantification of MS burden by age
difficult. This especially applies to the patients in their
fifth and sixth decade of life, a crucial age when inves-
tigating on the disease socioeconomic burden because
of the relevant loss of productivity at this age.
Given the multiple criteria used, the remarkable
heterogeneity of the course patterns and, again, the
cross-sectional nature of the assessments, assigning
cases to a referral classification is even more challenging
than for the distribution by age groups. Specific categ-
orization can be especially confusing for progressive
relapsing MS and transitional forms. Furthermore,
depending on the study-specific purposes, only the
proportion of RR-MS and PP-MS is sometimes
reported. As disease course categorization is mostly
based on the prevalent cases, it is assessed at one point
time leading to misclassification biases with respect to
future outcomes (e.g. RR-MS converting into SP-MS
over time). This might yield to an underestimation of
the proportion of progressive courses and highly dis-
abled cases, subsequently underestimating the impact of
such cases in the global disease burden and biasing the
planning of specific socioeconomic interventions.
In most studies, the distribution of disease degree of
severity was expressed by using the proportion of dis-
ability according to Kurtzke’s EDSS [17] in prevalent
cases. Because of the historical or cross-sectional nature
of most epidemiological studies scrutinized, precise
scores could not be assessed and a variability in categ-
orization has often been observed, for which only best
estimates of proportions could be reported.
The disability adjusted life years (DALYs) is one of
the most commonly used measures in evaluating the
Table 6 Proportion (%) of MS patients by
disease severity (EDSS) in Europe
Country Year
EDSS
0–3.5
(%)
EDSS
4.0–6.5
(%)
EDSS
7.0–9.5
(%) Reference
Austria 1999 69 26 5 70
Belgium (Flanders) 1990s 54 23 23 Carton, personal data
Germany 2004 46* 39* 15* Lauer, personal data
Hungary (Csongrad Co.) 1999 58 22 20 95
Italy (Ferrara, north) 1993 62 13 25 107
Italy (Sardinia, insular) 1997 65 20 15 115
Italy (Sicily, insular) 1995 61 16 23 113
Norway
(Nord-Trøndelag Co.)
2000 56 28 16 41
Spain (Mostoles, central) 1998 80 15 5 101
Spain (Teruel, east) 1996 60 22 18 99
Spain (Valladolid, north) 1997 58 29 13 103
Sweden 1998 36* 27* 37* 56
The Netherlands
(Groningen)
1980s 43 18 39 72
UK (northern Ireland) 1996 32.5 47.5 20 15
*Approx.
**Only Poser Committee et al. definite MS.
716 M. Pugliatti et al.
� 2006 EFNS European Journal of Neurology 13, 700–722

burden of MS in health economics. DALYs are the sum
of the present value of future years of life-time lost
because of premature mortality [years of life lost
(YLLs)] and of life-time adjusted for the disease severity
because of mental and/or physical disability [years of
life with disability (YLDs)] [150,151]. The computation
of DALYs is therefore based upon epidemiological
data, such as prevalence and incidence rates, age at
disease onset, life expectancy at disease onset, age at
death, degree and duration of disability. The total
DALY for MS in Europe is 307 000 years and varies
according to mortality strata, being 157 000 in the very-
low-child/very-low-adult stratum, 63 000 in the low-
child/low-adult and 87 000 in the low-child/high-adult
mortality strata, respectively [152]. Despite diseases
such as stroke-, dementia- or alcohol-related neuro-
logical disorders having the highest burden in DALYs
among the brain disorders, one should, however, notice
that fewer studies on measuring DALYs have been
carried out so far for MS when compared with other
neurological disorders. Comorbidity in MS, such as
epileptic seizures, mood disturbances, urinary tract
infections, or other immuno-mediated conditions fre-
quently reported in association with MS, is often
overlooked when measuring DALYs in MS.
The general decreasing trend of mortality rates over
time reported for many countries and subsequent
increased survival time after onset up to 45 years lead
to an increased burden of the disease because of the
greater number of YLDs. The mean life expectancy at
birth estimated for the year 2002 in Europe is 67.5 years
(65 for men and 70 for women), with Russia, Ukraine,
Moldova, Belarus, Albania, Turkey, Latvia, Romania,
Lithuania and the Republic of Macedonia being in the
first quartile (<63.7 years), whereas Luxembourg,
Germany, Norway, France, Spain, Italy, Iceland,
Switzerland and Sweden being in the third quartile
(>71.4 years) [152]. The majority of the latter coun-
tries are found to have a medium to high prevalence
for MS.
Data on MS mortality rates must be taken cau-
tiously, when they are retrospectively based on Inter-
national Classification of Diseases (ICD) codes as they
may reflect a change in the coding system over time. In
addition, when MS patients die from other causes or
from age-related diseases if they are in the older tier,
misclassification deriving from the assessment through
death certificates is probably to occur as MS is not
mentioned. In fact, a 23% underestimation of MS
mortality was reported in Scotland for the time-period
1996–1999 [39]. In the attempt at defining the burden of
the disease, the results may be even more distorted
because of �MS� being omitted in death certificates of
patients died from complications from an MS-related
high disability (e.g. pneumonia, septicemia, urinary
trait infections, etc.).
Conclusions
Despite the multiple assessments on MS epidemiology
in Europe reported in the international literature in the
past three decades, comparing indices among countries
is still a hard task and often only leads to approximate
estimates. This becomes a major methodological con-
cern when evaluating the burden of MS in Europe and
when implementing specific cost-of-illness studies.
Methodological variables, represented by the different
use of classification systems, inclusion criteria, the lack
of standardization and of quotation of confidence
intervals and the use of different population sizes,
should be adequately addressed and a collaborative
multicentric European project encouraged for the
assessment of the current burden of MS in Europe.
Acknowledgements
We would like to acknowledge the European Neuro-
logical Society (ENS, Prof. A. Steck and Prof. G. Said),
the Fondazione Italiana Sclerosi Multipla (FISM,
grants n. 97/R/69 and n. 02/R/43), Regione Autonoma
della Sardegna (Assessorato dell’Igiene, Sanita e
Assistenza Sociale). We are also grateful to Dr Klaus
Lauer (Griesheim, Germany) for his precious and
constant support in the data collection and revision.
References
1. Sadovnick AD, Ebers GC. Epidemiology of multiplesclerosis: a critical overview. Canadian Journal of Neuro-logical Science 1993; 20: 17–29.
2. AISM (Associazione author Italiana Sclerosi Multip-lax)I costi della SM. 2003; Available at http://www.ais-m.it (accessed Sep 6, 2004).
3. Trapp BD, Peterson J, Ransohoff RM, et al. Axonaltransection in the lesions of multiple sclerosis. NewEngland Journal of Medicine 1998; 338: 278–285.
4. Ebers M. Natural history of multiple sclerosis. In:Compston A, ed. McAlpine’s Multiple Sclerosis, NewYork, Churchill Livingstone, 1998; pp. 191–221.
5. Freal JE, Kraft GH, Coryell JK. Symptomatic fatigue inmultiple sclerosis. Archives of Physical Medicine andRehabilitation 1984; 65: 135–138.
6. Krupp LB, Alvarez LA, LaRocca NG, Scheinberg LC.Fatigue in multiple sclerosis. Archives of Neurology 1988;45: 435–437.
7. Lucchinetti CF, Bruck W, Rodriguez M, Lassmann H.Distinct patterns of multiple sclerosis pathology indicatesheterogeneity on pathogenesis. Brain Pathology 1996; 6:259–274.
8. Noseworthy JH, Lucchinetti C, Rodriguez M, Weins-henker BG. Multiple sclerosis. New England Journal ofMedicine 2000; 343: 938–952.
Epidemiology of MS in Europe 717
� 2006 EFNS European Journal of Neurology 13, 700–722

9. Poser CM, Paty DW, Scheinberg L et al. New diagnosticcriteria for multiple sclerosis: guidelines for researchprotocols. Annals of Neurology 1983; 13: 227–231.
10. Mc Donald WI, Compston A, Edan G et al. Recommen-ded diagnostic criteria for multiple sclerosis: guidelinesfrom the International Panel on the Diagnosis ofMultipleSclerosis. Annals of Neurology 2001; 50: 121–127.
11. Barkhof F, Filippi M, Miller DH et al. Comparison ofMR imaging criteria at first presentation to predictconversion to clinically definite multiple sclerosis. Brain1997; 120: 2059–2069.
12. Tintore M, Rovira A, Martinez M et al. Isolated demy-elinating syndromes: comparison of different MR ima-ging criteria to predict conversion to clinically definitemultiple sclerosis. American Journal of Neuroradiology2000; 21: 702–706.
13. Brex FA, Miszkiel KA, O’Riordan JI et al. Assessing therisk of early MS in patients with clinically isolated syn-dromes: the role of follow-up MRI. Journal of Neurol-ogy, Neurosurgery and Psychiatry 2001; 70: 390–393.
14. Fangerau T, Schimrigk S, Haupts M et al. Diagnosis ofmultiple sclerosis: comparison of the Poser criteria andthe new McDonald criteria. Acta Neurologica Scandi-navica 2003; 109: 385–389.
15. McDonnell GV, Hawkins SA. Clinical study of primaryprogressive multiple sclerosis in Northern Ireland, UK.Journal of Neurology, Neurosurgery and Psychiatry 1998;64: 451–454.
16. Lublin FD, Rengold SC. Defining the clinical course ofmultiple sclerosis: results from an international survey.National Multiple Sclerosis Society (USA) AdvisoryCommittee on Clinical Trials on New Agents in MultipleSclerosis. Neurology 1996; 46: 907–911.
17. Kurtzke JF. Rating neurological impairment in multiplesclerosis and expanded disability status scale (EDSS).Neurology 1983; 33: 1444–1452.
18. Europa. EU at a Glance. European Governments On-Line.Available at 2004; http://www.europa.eu.int/abc/governments/index_en.htm (accessed Sept. 6, 2004).
19. Rosati G. The prevalence of MS in the world: an update.Neurology Science 2001; 22: 117–140.
20. Pugliatti M, Sotgiu S, Rosati G. The worldwide preval-ence of MS. Clinical Neurology and Neurosurgery 2002;104: 182–191.
21. Firnhaber W, Lauer K. (eds) Multiple Sclerosis inEurope: An Epidemiological Update. Darmstadt:Leuchtturm-Verlag/LTV Press, 1994.
22. Doll R, Hill AB. Mortality of British doctors in rela-tion to smoking: observation on coronary thrombosis.National Cancer Institute Monographs 1966; 19: 205–268.
23. Robertson N, Compston A. Surveying multiple sclerosisin the United Kingdom. Journal of Neurology, Neuro-surgery and Psychiatry 1995; 58: 2–6.
24. Rothwell PM, Charlton D. High incidence and preval-ence of multiple sclerosis in South East Scotland: evi-dence of a genetic predisposition. Journal of Neurology,Neurosurgery and Psychiatry 1998; 64: 733–735.
25. Swingler RJ, Compston DAS. Demographic character-istics of multiple sclerosis in south East Wales. Neuro-epidemiology 1990; 9: 68–77.
26. Roberts MHV, Martin GP, McLelland L et al. Theprevalence of multiple sclerosis in the SouthamptonSouth West Hampshire Health Authority. Journal of
Neurology, Neurosurgery and Psychiatry 1991; 54: 55–59.
27. Mumford CJ, Fraser MB, Wood NW, Compston DAS.Multiple sclerosis in the Cambridge health district ofEast Anglia. Journal of Neurology, Neurosurgery andPsychiatry 1992; 55: 877–882.
28. Rice-Oxley M, Rees JR, Williams ES. A prevalent surveyof multiple sclerosis in Sussex. Journal of Neurology,Neurosurgery and Psychiatry 1995; 58: 27–30.
29. Shepherd DI, Summers A. Prevalence of multiple scler-osis in Rochdale. Journal of Neurology, Neurosurgery andPsychiatry 1996; 61: 415–417.
30. Cook SD, Cromarty MB, Tapp W, Poskanzer D,Wlaker JD, Dowling PC. Declining incidence of mul-tiple sclerosis in the Orkney Islands. Neurology 1985;35: 545–551.
31. Cook SD,MacDonald J, TappW, Poskanzer D, DowlingPC. Multiple sclerosis in the Shetland Islands: an update.Acta Neurologica Scandinavica 1988; 77: 148–151.
32. Allison RS, Millar JH. Prevalence of disseminatedsclerosis in Northern Ireland. Ulster Medical Journal1954; 23: 1–27.
33. Forbes RB, Wilson SV, Swingler RJ. The prevalence ofmultiple sclerosis in Tayside Scotland: do latitudinalgradients really exist? Journal of Neurology 1999; 246:1033–1040.
34. McGuigan C, McCarthy A, Quigley C, Bannan L,Hawkins SA, Hutchinson M. Latitudinal variation in theprevalence of multiple sclerosis in Ireland, an effect ofgenetic diversity. Journal of Neurology, Neurosurgery andPsychiatry 2004; 75: 572–576.
35. McDonnell GV, Hawkins SA. An epidemiologic study ofmultiple sclerosis in Northern Ireland. Neurology 1998;50: 423–428.
36. Robertson NP, Deans J, Fraser M, Compston DAS.multiple sclerosis in the North Cambridgeshire districtsof East Anglia. Journal of Neurology, Neurosurgery andPsychiatry 1995; 59: 71–76.
37. Sharpe G, Price SE, Last A, Thompson RJ. Multiplesclerosis in island population-prevalence in the Bailiwicksof Guernsey and Jersey. Journal of Neurology, Neuro-surgery and Psychiatry 1995; 58: 22–26.
38. Ford HL, Gerry E, Airey CM et al. The prevalence ofmultiple sclerosis in the Leeds Health Authority. Journalof Neurology, Neurosurgery and Psychiatry 1998; 64:
605–610.39. Ford HL, Gerry E, Johnson M, Williams R. A pros-
pective study of the incidence, prevalence and mortalityof multiple sclerosis in Leeds. Journal of Neurology 2002;249: 260–265.
40. McDonnell GV, Hawkins SA. An assessment of thespectrum of disability and handicap in multiple sclerosis:a population-based study. Multiple Sclerosis 2001; 7:
111–117.41. Dahl OP, Aarseth JH, Myhr KM, Nyland H, Midgard
R. Multiple sclerosis in Nord-Trøndelag County Nor-way: a prevalence and incidence study. Acta NeurologicaScandinavica 2004; 109: 378–384.
42. Celius EG, Vandvik B. Multiple sclerosis in Oslo Nor-way: prevalence on 1 January 1995 and incidence over a25-year period. European Journal of Neurology 2001; 8:463–469.
43. Edland A, Nyland H, Riise T, Larsen JP. Epidemiologyof multiple sclerosis in the county of Vestfold, eastern
718 M. Pugliatti et al.
� 2006 EFNS European Journal of Neurology 13, 700–722

Norway: incidence and prevalence calculations. ActaNeurologica Scandinavica 1996; 93: 104–109.
44. Koch-Henriksen N. The Danish Multiple SclerosisRegistry: a 50-year follow-up. Multiple Sclerosis 1999; 5:293–296.
45. Larsen JP, Kvaale G, Riise T, Nyland H, Aarli JA. Anincrease in the incidence of multiple sclerosis in westernNorway. Acta Neurologica Scandinavica 1984; 70: 96–103.
46. De Graaf AS. Multiple sclerosis in Northern Norway.European Neurology 1974; 11: 281–295.
47. Grønlie SA, Myrvoll E, Hansen G, et al. Multiplesclerosis in North Norway, and first appearance in anindigeneous population. Journal of Neurology 2000; 247:129–133.
48. Midgard R, Riise T, Nyland H. Epidemiologic trends inmultiple sclerosis in Møre and Romsdal, Norway: aprevalence/incidence study in a stable population.Neurology 1991; 41: 887–892.
49. Groebke-Lorenz W, Balint S, Frey UP et al. Multiplesclerosis in northwestern Switzerland. SchweizerischeMedizinische Wochenschrift. Journal Suisse de Medecine1992; 122: 582–587.
50. Sumelahti ML, Tienari PJ, Wikstrom J, Palo J, HakamaM. Regional and temporal variation in the incidence ofmultiple sclerosis in Finland 1979–1993. Neuroepidemi-ology 2000; 19: 67–75.
51. Midgard R, Riise T, Kvale G, Nyland H. Disability andmortality in multiple sclerosis in western Norway. ActaNeurologica Scandinavica 1996; 93: 307–314.
52. Midgard R, Albrektsen G, Riise T et al. Prognosticfactors for survival in multiple sclerosis a longitudinalpopulation based study in Møre and Romsdal, Norway.Journal of Neurology, Neurosurgery and Psychiatry 1995;58: 417–421.
53. Sundstrom P, Nystrom L, Forsgren L. Prevalence ofmultiple sclerosis in Vasterbotten County in northernSweden. Acta Neurologica Scandinavica 2001; 103: 214–218.
54. Sundstrom P, Nystrom L, Forsgren L. Incidence(1988–97) and prevalence (1997) of multiple sclerosis inVasterbotten County in northern Sweden. Journal ofNeurology, Neurosurgery and Psychiatry 2003; 74: 29–32.
55. Svenningsson A, Runmarker B, Lycke J, Andersen O.Incidence of multiple sclerosis during two fifteen-yearperiods in the Gothenburg region of Sweden. ActaNeurologica Scandinavica 1990; 82: 161–168.
56. Sundstrom P, Svenningsson A, Nystrom L et al.. Clinicalcharacteristics of multiple sclerosis in VasterbottenCounty in northern Sweden. Journal of Neurology,Neurosurgery and Psychiatry 2004; 75: 711–716.
57. Sumelahti ML, Tienari PJ, Wikstrom J, Palo J, HakamaM. Increasing prevalence of multiple sclerosis in Finland.Acta Neurologica Scandinavica 2001; 103: 153–158.
58. Wikstrom J, Tienari PJ, Sumelahti ML, Hovi E, Kinn-unen E, Palo J. Multiple sclerosis in Finland: evidence ofuneven geographic distribution, increasing frequency andhigh familial occurrence. In: Firnhaber W, Lauer K, eds.Multiple Sclerosis in Europe: An Epidemiological Update.Darmstadt: Leuchtturm-Verlag/LTV Press 1994; pp 73–77.
59. Sumelahti ML, Tienari PJ, Hakama M, Wikstrom J.Multiple sclerosis in Finland: incidence trends and
differences in relapsing remitting and primary progres-sive disease courses. Journal of Neurology, Neurosurgeryand Psychiatry 2003; 74: 25–28.
60. Koch-Henriksen N, Brønnum-Hansen H, Hyllested K.Incidence of multiple sclerosis in Denmark 1948–1982: adescriptive nationwide study. Neuroepidemiology 1992;11: 1–10.
61. Benedikz J, Magnus S, Gumundsson J et al. The naturalhistory of untreated multiple sclerosis in Iceland. A totalpopulation-based 50 year prospective study. ClinicalNeurology and Neurosurgery 2002; 104: 208–210.
62. Benedikz JEG, Magnusson H, Poser CM, GumundssonG. Multiple sclerosis in Iceland 1 January 31 December1989: a 90 years total population study. In: Firnhaber W,Lauer K, eds. Multiple Sclerosis in Europe: An Epidemi-ological Update. Darmstadt: Leuchtturm-Verlag/LTVPress, 1994; pp. 41–50.
63. Poser S, Stickel B, Krtsch U, Burckhardt D, Nordman B.Increasing incidence of multiple sclerosis: in South LowerSaxony Germany. Neuroepidemiology 1989; 8: 207–213.
64. Lauer K, Firnhaber W. Descriptive and analytical epi-demiological data on multiple sclerosis from a long-termstudy in southern Hesse, Germany. In: Firnhaber W,Lauer K, eds. Multiple Sclerosis in Europe: An Epidemi-ological Update. Darmstadt: Leuchtturm-Verlag/LTVPress, 1994; pp. 147–158.
65. Hein T, Hopfenmuller W. Projection of the number ofmultiple sclerosis patients in Germany. Nervenartz 2000;71: 288–294.
66. Poser S. The epidemiology of multiple sclerosis insouthern Lower Saxony. In: Firnhaber W, Lauer K, eds.Multiple Sclerosis in Europe: An Epidemiological Update.Darmstadt: Leuchtturm-Verlag/LTV Press, 1994; pp.130–133.
67. Haupts M, Schejbal P, Pohlau D et al. Epidemiologicaldata on multiple sclerosis from an industrial area innorth-west Germany. In: Firnhaber W, Lauer K, eds.Multiple Sclerosis in Europe: An Epidemiological Update.Darmstadt: Leuchtturm-Verlag/LTV Press, 1994; pp.143–146.
68. Meyer-Rienecker H. Epidemiological analyses on mul-tiple sclerosis in the region of Rostock, north-east Ger-many. In: Firnhaber W, Lauer K, eds. Multiple Sclerosisin Europe: An Epidemiological Update. Darmstadt: Leu-chtturm-Verlag/LTV Press, 1994; pp. 134–142.
69. Beer S, Kesserling J. High prevalence of multiplesclerosis in Switzerland. Neuroepidemiology 1994; 19:
14–18.70. Baumhackl U, Eibl G, Ganzinger U et al. Prevalence of
multiple sclerosis in Austria. Results of a NationwideSurvey. Neuroepidemiology 2002; 21: 226–234.
71. Minderhoud JM, Zwanniken CF. Increasing prevalenceand incidence of multiple sclerosis: an epidemiologicalstudy in the province of Groningen, The Netherlands. In:Firnhaber W, Lauer K, eds. Multiple Sclerosis in Europe:An Epidemiological Update. Darmstadt: Leuchtturm-Verlag/LTV Press, 1994; pp. 113–121.
72. Prange AJA, Lauer K, Poser S et al. Epidemiologicalaspects of multiple sclerosis: a comparative study offour centres in Europe. Neuroepidemiology 1986; 5:
71–79.73. Van Ooteghem P, De Hooghe MB, Vlietnick R, Carton
H. Prevalence of multiple sclerosis in Flanders, Belgium.Neuroepidemiology 1994; 13: 220–225.
Epidemiology of MS in Europe 719
� 2006 EFNS European Journal of Neurology 13, 700–722

74. Guard O, Pinette T, Dumas R, Giraud M. Epidemiologiede la sclerose en plaques en Cote- D’Or. Sem Hop Paris1986; 62: 1055–1060.
75. Confavreux C, Darchy P, Alperovitch A et al. Le Sud-Est francais: zone a ��haut risque�� de sclerose en plaques?Presse Medicale 1987; 16: 622–623.
76. Beer C, Puel J, Clanet M et al. Risk factors in multiplesclerosis: a population-based case–control study inHautes Pyrenees, France. Acta Neurologica Scandinavica1989; 80: 46–50.
77. Roth MP, Ballivet S, Descoins P et al. Multiple sclerosisin the Pyrenees-Atlantiques: a case–control study con-ducted in the southwest of France. In: Firnhaber W,Lauer K, eds. Multiple Sclerosis in Europe: An Epidemi-ological Update. Darmstadt: Leuchtturm-Verlag/LTVPress, 1994; pp. 177–178.
78. Kurtzke JF, Delasnerie-Laupretre N. Reflection on thegeographic distribution of multiple sclerosis in France.Acta Neurologica Scandinavica 1996; 93: 110–117.
79. Moreau T, Manceau E, Lucas B, Lemesle M, UrbinelliR, Giroud M. Incidence of multiple sclerosis in Dijon,France a population-based ascertainment. NeurologicalResearch 2000; 22: 156–159.
80. Alperovitch A, Bouvier MH. Geographical pattern ofdeath rates from multiple sclerosis in France. An analysisof 4912 deaths. Acta Neurologica Scandinavica 1982; 66:454–461.
81. Van Bockstael V, Gosselin S, Vukusic S, Confavreux C.Prevalence of multiple sclerosis in French farmers: anational survey. Multiple Sclerosis 2004; 10(Suppl. 2):S156.
82. Confavreux C, Vukusic S, Adeleine P. Early clinicalpredictors and progression of irreversible disability inmultiple sclerosis: an amnesic process. Brain 2003; 126:770–782.
83. Potemkowski A. Epidemiology of multiple sclerosis in theregion of Szczecin: prevalence and incidence 1993–1995.Neurologia i Neurochirurgia Polska 1999; 33: 575–585.
84. Wender M, Pruchnik-Grabowska D, Hertmanowska H,et al.Epidemiologyofmultiple sclerosis inWesternPoland– a comparison between prevalence rates in 1965 and 1981.Acta Neurologica Scandinavica 1985; 72: 210–217.
85. Potemkowski A, Walczak A, Nocon D, Fabian A,Nowacki P. Epidemiological analysis of multiple scler-osis in the Szczecin Region, north-western part ofPoland. In: Firnhaber W, Lauer K, eds. Multiple Scler-osis in Europe: An Epidemiological Update. Darmstadt:Leuchtturm-Verlag/LTV Press, 1994; pp. 249–254
86. Berkowicz T. Report of multiple sclerosis center in Lodz.Cephalalgia Hungarica 2004; 13: 63–64.
87. Jedlicka P. Epidemiology of multiple sclerosis in Cze-choslovakia. In: Battaglia MA, Crimi G, eds. An Updateon Multiple Sclerosis. Monduzzi Editore, Bologna, 1989;pp. 253–255.
88. Jedlicka P, Benes B, Hron B et al. Epidemiology ofmultiple sclerosis in the Czech Republic. In: FirnhaberW, Lauer K, eds. Multiple Sclerosis in Europe: An Epi-demiological Update. Darmstadt: Leuchtturm-Verlag/LTV Press, 1994; pp. 261–265.
89. Lensky P. Geographic disproportion of multiple sclerosisin Czechoslovakia from the point of view of indirectproof. In: Firnhaber W, Lauer K, eds. Multiple Sclerosisin Europe: An Epidemiological Update. Darmstadt: Leu-chtturm-Verlag/LTV Press, 1994; pp. 266–273.
90. HorakovaD.Report ofmultiple sclerosis center atCharlesUniversity. Cephalalgia Hungarica 2004; 13: 47–48.
91. Meluzinova E. Report of multiple sclerosis center atUniversity Hospital Motol, 2nd Medical School. Cep-halalgia Hungarica 2004; 13: 49–50.
92. Guseo A, Jofeiu E, Kocsis A. Epidemiology of multiplesclerosis in Western Hungary 1957–1992. In: FirnhaberW, Lauer K, eds. Multiple Sclerosis in Europe: An Epi-demiological Update. Darmstadt: Leuchtturm-Verlag/LTV Press, 1994; pp. 279–286.
93. Palffy G, Czopf J, Kuntar L, Gyodi E . Multiple sclerosisin Baranya County in Hungarians and in Gipsies. In:Firnhaber W, Lauer K, eds. Multiple Sclerosis in Europe:An Epidemiological Update. Darmstadt: Leuchtturm-Verlag/LTV Press, 1994; pp. 274–278.
94. Bencsik K, Rajda C, Klivenyi P et al. The prevalence ofmultiple sclerosis in the Hungarian city of Szeged. ActaNeurologica Scandinavica 1998; 97: 315–319.
95. Bencsik K, Rajda C, Fuvesi J et al. The prevalence ofmultiple sclerosis, distribution of clinical forms of thedisease and functional status of patients in CsongradCounty, Hungary. European Neurology 2001; 46: 206–209.
96. Kurtzke JF. Geographical distribution of multiplesclerosis. An update within special reference to Europeand the Mediterranean region. Acta Neurologica Scan-dinavica 1980; 62: 65–80.
97. Fernandez O, Luque G, San Roman C et al. The pre-valence of multiple sclerosis in the sanitary district ofVelez-Malaga, southern Spain. Neurology 1994; 44: 425–429.
98. Bufill E, Blesa R, Galan I, Dean G. Prevalence of mul-tiple sclerosis in the region of Osona, Catalonia, northernSpain. Journal of Neurology, Neurosurgery and Psychi-atry 1995; 58: 577–581.
99. Modrego Pardo PJ, Pina Latorre MA, Lopez A, ErreaJM. Prevalence of multiple sclerosis in the provinceof Teruel, Spain. Journal of Neurology 1997; 244: 182–185.
100. Uria DF, Calatayud MT, Virgala P et al. Multiplesclerosis in Gijon health district, Asturias, northernSpain. Acta Neurologica Scandinavica 1997; 96: 375–379.
101. Benito-Leon J, Martın E, Vela L et al. Multiple sclerosisin Mostoles, central Spain. Acta Neurologica Scandinav-ica 1998; 98: 238–242.
102. Pina MA, Ara JR, Modrego PJ et al. Prevalence ofmultiple sclerosis in the sanitary district of Calatayud,northern Spain: is Spain a zone of high risk for thisdisease? Neuroepidemiology 1998; 17: 258–264.
103. Tola MA, Yugueros MI, Fernandez-Buey N, Fernandez-Herranz R. Prevalence of multiple sclerosis in Valladolid,northern Spain. Journal of Neurology 1999; 246: 170–174.
104. De Sa J, Mendes H, Pallos A et al. The prevalence ofmultiple sclerosis in Portugal: results of a population-based study. Multiple Sclerosis 1998; 4: 368.
105. Malatesta G, Gabriele A, Macor S et al. Diffusion ofmultiple sclerosis in two Italian provinces, Chieti-Pes-cara. Italian Journal of Neurological Sciences 1991; 12(Suppl. 5): 83.
106. Meucci G, Bianchi F, Rossi G. Indagine sulla preval-enza della sclerosi multipla nella USL n.17 del Val-darno inferiore. In: 7th Italian Congress ofNeuroepidemiology (Abstract Book).Tipografia UmbraPerugia, 1992; p. 35.
720 M. Pugliatti et al.
� 2006 EFNS European Journal of Neurology 13, 700–722

107. Granieri E, Malagu S, Casetta I et al. Multiple sclerosisin Italy. A reappraisal of incidence and prevalence inFerrara. Archives of Neurology 1996; 53: 793–798.
108. Maddestra M, Sabbatini S, Paci F, Paci A. Epidemio-logical survey of multiple sclerosis in the province ofTerni. Neuroepidemiology 1998; 17: 54.
109. Totaro R, Marini C, Cialfi A et al. Prevalence of multiplesclerosis in the L’Aquila district, central Italy. Journal ofNeurology, Neurosurgery and Psychiatry 2000; 68: 349–352.
110. Iuliano G. Prevalence of multiple sclerosis in Salerno,Italy: preliminary data in a study on general practition-ers. Italian Journal of Neurological Sciences 1999; 20
(Suppl. 4): S186.111. Sironi L, D’Alessandro G, Corso G, Bottacchi E. Epi-
demiology of multiple sclerosis in Valle d’Aostam, Italy.Multiple Sclerosis 1997; 3: 283.
112. Ranzato F, Perini P, Tzintzeva E et al. Increasing fre-quency of multiple sclerosis in Padova, Italy: a 30-yearepidemiological survey. Multiple Sclerosis 2003; 9: 387–392.
113. Nicoletti A, Lo Bartolo ML, Lo Fermo S et al. Preval-ence and incidence of multiple sclerosis in Catania, Sicily.Neurology 2001; 56: 62–66.
114. Granieri E, Casetta I, Govoni V et al. The increasingincidence and prevalence of M S in a Sardinian province.Neurology 2000; 55: 842–847.
115. Pugliatti M, Sotgiu S, Solinas G et al. Multiple sclerosisepidemiology in Sardinia: evidence for a true increasingrisk. Acta Neurologica Scandinavica 2001; 103: 20–26
116. Sotgiu S, Pugliatti M, Sanna A et al. Multiple sclerosiscomplexity in selected populations the challenge of Sar-dinia, insular Italy. European Journal of Neurology 2002;9: 329–341.
117. Dean G, Elian M, Galea de Bono A et al. Multiplesclerosis in Malta in 1999: an update. Journal of Neur-ology, Neurosurgery and Psychiatry 2002; 73: 256–260.
118. Koncan-Vracko B. Epidemiological investigation ofmultiple sclerosis in Slovenia. In: Firnhaber W, Lauer K,eds. Multiple Sclerosis in Europe: An Epidemiologicalupdate. Darmstadt: Leuchtturm-Verlag/LTV Press, 1994;p. 294.
119. Materljan E, Sepcic J. Epidemiology of multiple sclerosisin Croatia. Clinical Neurology and Neurosurgery 2002;104: 192–198.
120. Pekmezovic T, Jarebinski M, Drulovic J, Stojsvljevic N,Levic Z. Prevalence of multiple sclerosis in Belgrade,Yugoslavia. Acta Neurologica Scandinavica 2001; 104:
353–357.121. Ljapchev R, Daskalovska V. Epidemiological studies of
multiple sclerosis in the Republic of Macedonia. In:Firnhaber W, Lauer K, eds. Multiple Sclerosis in Europe:An Epidemiological Update. Darmstadt: Leuchtturm-Verlag/LTV Press, 1994; pp. 301–308.
122. Petrescu A, Verdes F. Epidemiology of multiple sclerosisin Romania. Neurologie et Psychiatrie (Bucur) 1989; 27:261–271.
123. Petrescu A. Epidemiology of multiple sclerosis inRomania. In: Firnhaber W, Lauer K, eds. MultipleSclerosis in Europe: An Epidemiological Update. Darms-tadt: Leuchtturm-Verlag/LTV Press, 1994; pp. 287–293.
124. Becus T, Popoviciu L. Epidemiologic survey of multiplesclerosis in Mures County, Romania. Romanian Journalof Neurology and Psychiatry 1994; 32: 115–122.
125. Bajenaru O, Pascu I. Report of multiple sclerosis centers.Cephalalgia Hungarica 2004; 13: 68–70.
126. Milanov I, Georgiev D, Kmetska K, Jordanova L,Topalov N. Prevalence of multiple sclerosis in Bulgaria.Neuroepidemiology 1997; 16: 304–307.
127. Milanov I, Topalov N, Kmetska TS. Prevalence ofmultiple sclerosis in Gipsies and Bulgarians. Neuroepi-demiology 1999; 18: 218–222.
128. Trendafilova L, Manova M, Hadjipetrova K . Multiplesclerosis in the Plovdiv area, Bulgaria. In: Firnhaber W,Lauer K, eds. Multiple Sclerosis in Europe: An Epidemi-ological Update. Darmstadt: Leuchtturm-Verlag/LTVPress, 1994; pp. 326–331.
129. Rose AS, Ellison GW, Myers LW, Tourtellotte WW.Criteria for the clinical diagnosis of multiple sclerosis.Neurology 1976; 26: 20–22.
130. Kruja J. Multiple sclerosis in Albania. In: Firnhaber W,Lauer K, eds. Multiple Sclerosis in Europe: An Epidemio-logical Update. Darmstadt: Leuchtturm-Verlag/LTVPress, 1994; pp. 309–315.
131. Piperidou HN, Heliopoulos IN, Maltezos ES, MilonasIA. Epidemiological data of multiple sclerosis in theprovince of Evros, Greece. European Neurology 2003; 49:8–12.
132. Middleton LT, Dean G. Multiple sclerosis in Cyprus.Journal of the Neurological Sciences 1991; 103: 29–36.
133. Dean G, Aksoy H, Akalin T, Middleton L, Kyriallis K.Multiple sclerosis in the Turkish- and Greek-speakingcommunities of Cyprus. A United Nations BicommunalProject. Journal of the Neurological Sciences 1997; 145:163–168.
134. Celik Y, Birgili O, Kiyat A et al. Prevalence of multiplesclerosis in the metropolitan area of Edirne city, Turkey.Multiple Sclerosis 2003; 9 (Suppl. 1)): 47–48. Abstract.
135. Boiko AN. Multiple sclerosis prevalence in Russia andother countries of the former USSR. In: Firnhaber W,Lauer K, eds. Multiple Sclerosis in Europe: An Epidemi-ological Update. Darmstadt: Leuchtturm-Verlag/LTVPress, 1994; pp. 219–230.
136. Boiko A, Deomina T, Favorova O, Gusev E, SudomoinaM, Turetskaya R. Epidemiology of multiple sclerosis inRussia and other of the former Soviet Union: investiga-tions of environmental and genetic factors. Acta Neuro-logica Scandinavica 1995; 91 (Suppl. 161): 71–76.
137. Gross K, Kokk A, Kaasik AE. Prevalence of MS inSouth Estonia. Evidence of a new border of the Fenno-scandian focus. Acta Neurologica Scandinavica 1993; 88:241–246.
138. Korbut AL, Korniychuk AG. MS in the population ofVinnytsya City Central Ukraine. 2001;Neurologia; neuro-chirurgia Polska. (Suppl. 2): 1–60.
139. Korniychuk AG, Zheliba OV. Epidemiology of MS inVinnytsia Oblast, South-West Ukraine. Journal of Neuro-immunology 2005; 56–63 (Suppl. 1): 41.
140. Boiko A, Zavalishin IA, Spirin NN et al. Epidemiologyof MS in Russia: first data of United Study of MultipleSclerosis epidemiology in Russia.Multiple Sclerosis 2004;10 (Suppl.2): 157. Abstract.
141. Lai SM, Zhang ZX, Alter M, Sobel E. World-widetrends in multiple sclerosis mortality. Neuroepidemiology1989; 8: 56–67.
142. Brønnum-Hansen H, Koch-Henriksen N, Stenager E.Trends in survival and cause of death in Danish patientswith multiple sclerosis. Brain 2004; 127: 844–850.
Epidemiology of MS in Europe 721
� 2006 EFNS European Journal of Neurology 13, 700–722

143. Ekestern E, Lebhart G. Mortality from multiplesclerosis in Austria 1970–2001: dynamics, trends andprospects. European Journal of Neurology 2004; 11:
511–520.144. Tassinari T, Parodi S, Badino R, Vercelli M. Mortality
trend for multiple sclerosis in Italy (1974–1993). Euro-pean Journal of Epidemiology 2001; 17: 105–110.
145. Landtblom AM, Riise T, Boiko A, Soderfelt B. Distri-bution of multiple sclerosis in Sweden based on mortalityand disability compensation statistics.Neuroepidemiology2002; 21: 167–179.
146. Kantarci O, Siva A, Eraksoy M et al. Survival and pre-dictors of disability in Turkish MS patients. Neurology1998; 51: 765–772.
147. Pekmezovic T, Jarebinski M, Drulovic J, Stojsavljevic N,Levic Z. Survival of multiple sclerosis patients in theBelgrade population. Neuroepidemiology 2002; 21: 235–240.
148. Sumelahti ML, Tienari PJ, Wikstrom J, Salminen TM,Hakama M. Survival of multiple sclerosis in Finland
between 1964 and 1993. Multiple Sclerosis 2002; 8: 350–355.
149. Zivadinov R, Iona L, Monti-Bragadin L et al. The use ofstandardized incidence and prevalence rates in epidemi-ological studies on multiple sclerosis. Neuroepidemiology2003; 22: 65–74.
150. Murray CJL, Lopez AD. Progress and directions inrefining the global burden of disease approach: aresponse to Williams. Health Economics 2000; 9: 69–82.
151. Fox-Rushby JA, Hanson K. Calculating and present-ing disability adjusted life years (DALYs) in cost-effectiveness analysis. Health Policy Planning 2001; 16:326–331.
152. World Health Organization (2004). Statistical Annex.The World Health Report 2004 – Changing History.Geneva: WHO.
153. Global Health Atlas. 2005; Available at http://atlas.globalhealth.org (accessed June 14, 2005).
722 M. Pugliatti et al.
� 2006 EFNS European Journal of Neurology 13, 700–722