Embed Size (px)
Citation preview

The Environmental Impact of Desktop 3DPrinting in a Distributed Manufacturing
Model: Analyzing Spare PlasticParts Fabricated by Home Users
The Harvard community has made thisarticle openly available. Please share howthis access benefits you. Your story matters
Citation Belculfine, Eliseu. 2016. The Environmental Impact of Desktop 3DPrinting in a Distributed Manufacturing Model: Analyzing SparePlastic Parts Fabricated by Home Users. Master's thesis, HarvardExtension School.
Citable link http://nrs.harvard.edu/urn-3:HUL.InstRepos:33797342
Terms of Use This article was downloaded from Harvard University’s DASHrepository, and is made available under the terms and conditionsapplicable to Other Posted Material, as set forth at http://nrs.harvard.edu/urn-3:HUL.InstRepos:dash.current.terms-of-use#LAA

The Environmental Impact of Desktop 3D Printing in a Distributed Manufacturing
Model: Analyzing Spare Plastic Parts Fabricated by Home Users
Eliseu Belculfine
A Thesis in the Field of Sustainability and Environmental Management
for the Degree of Master of Liberal Arts in Extension Studies
Harvard University
May 2016


Abstract
Three-dimensional (3D) printing technologies are challenging the existing
industrial paradigms and creating expectations that the relationship between
manufacturing and the environment can also be different. One of these expectations is
that greenhouse gas emissions may be reduced when people fabricate their own products
at home because product transportation that is required by the conventional
manufacturing model is avoided. Although avoiding product transportation can be
beneficial for the environment, the effects of 3D printing in a distributed manufacturing
model are essentially unknown. Data on environmental impact from spare plastic parts
were obtained from conventional and distributed manufacturing processes by a Life
Cycle Assessment (LCA) software, the Ecoinvent-3 database and electricity consumption
measurements. The LCA was conducted to compare the environmental impact of spare
plastic parts fabricated by two main models: 3D printing in distributed manufacturing and
injection molding in conventional manufacturing. This assessment considered that spare
plastic parts were manufactured overseas in conventional manufacturing, while in
distributed manufacturing, parts were fabricated by users at home using a desktop 3D
printer. Therefore, the aim of this study is to answer the following question: is the
environmental impact of ABS-made spare plastic parts fabricated at home by a desktop
3D printer lower than that of similar ABS parts made by conventional manufacturing?
The findings show that the environmental impact caused by energy consumption used by
a desktop 3D printer is significantly higher than any benefit obtained from removing the

need to transport products overseas in the conventional manufacturing model. In fact,
TRACI mid-point results demonstrate that global warming of distributed manufacturing
is 11 times higher than that of conventional manufacturing. These findings not only
highlight the environmental impact of desktop 3D printing in a distributed manufacturing
model, but also justify the importance of using quantitative methods for environmental
assessments of new technologies.
v
Acknowledgements
This thesis is an important contribution to my academic progression; therefore, I
would like to acknowledge a few important people who have helped me achieve this
major personal milestone. Firstly, I would like to thank my Thesis Director, Dr. Ramon
Sanchez from the Harvard T.H. Chan School of Public Health, who has greatly supported
me during my thesis development, contributing with ideas, methodology and overall
guidance. Secondly, I would like to express my sincere appreciation to all Harvard
University Extension School staff, in particular, my Thesis Advisor, Dr. Mark Leighton
who has provided exceptional support and dedication in reviewing this thesis material
and made significant contributions to improve its organization, logic and readability.
Finally, I would also like to thank my supportive family—Andrea, Daniel and Amanda—
who have abdicated being together with me during numerous hours along the last years to
make this academic achievement possible.

vi
Table of Contents
Acknowledgements ..............................................................................................................v
List of Tables ................................................................................................................... viii
List of Figures .................................................................................................................... ix
Definition of Terms..............................................................................................................x
I. Introduction ...................................................................................................................1
Research Significance and Objectives ........................................................ 2
Background ............................................................................................................. 5
Fused Deposition Modeling .................................................................................... 6
Environmental Impact ........................................................................................... 10
Spare Plastic Parts ................................................................................................. 15
Raw Material Transportation ................................................................................ 20
Research Questions and Hypotheses .................................................................... 22
II. Methods .......................................................................................................................23
Goal and Scope Definition .................................................................................... 24
Plastic Material ......................................................................................... 25
3D Printer .................................................................................................. 25
Part Category ............................................................................................ 27
Functional Unit ......................................................................................... 28
System Boundaries.................................................................................... 31
Inventory Analysis ................................................................................................ 33
vii
Raw Material Transport ............................................................................ 34
Injection Molding and Filament Processes ............................................... 35
Overseas Transport ................................................................................... 35
3D Printing Process................................................................................... 36
Life Cycle Impact Assessment.............................................................................. 41
Interpretation and Presentation of Results ............................................................ 43
Research Limitations ............................................................................................ 43
III. Results .........................................................................................................................46
Data Collection ..................................................................................................... 47
Spare Part Selection .................................................................................. 47
3D Printing Energy Consumption ............................................................. 49
Packaging Factors ..................................................................................... 51
Life Cycle Assessment .......................................................................................... 52
Conventional Manufacturing .................................................................... 52
Distributed Manufacturing ........................................................................ 53
3D Printing Environmental Impact ....................................................................... 55
IV. Discussion and Conclusions .......................................................................................57
Appendix 1 .........................................................................................................................63
Appendix 2 .........................................................................................................................64
References ..........................................................................................................................65

viii
List of Tables
Table 1 Summary of 3D printing technologies listed by Swift and Booker (2013). ..... 6
Table 2 Environmental impact of 3D printing research matrix. .................................. 14
Table 3 3D printer model main characteristics. ........................................................... 27
Table 4 Materials, assemblies, and processes used in LCA inventory. ....................... 34
Table 5 Energy consumption to fabricate an ABS part. .............................................. 50

ix
List of Figures
Figure 1 Distribution of 3D printer models...................................................................... 8
Figure 2 Cost per part variation according to production volume. ................................ 17
Figure 3 Plastic spool dimensions and estimated volume. ............................................. 21
Figure 4 High-level research methodology steps based on life cycle assessment. ........ 24
Figure 5 Stress per cycles to failure graph from ABS part produced using injection
molding and 3D printing process. ................................................................... 30
Figure 6 System boundary of conventional and distributed manufacturing scenarios. . 33
Figure 7 Desktop 3D printer and watt-meter plugged into a powerline. ....................... 40
Figure 8 Number of “likes” per part category. ............................................................... 48
Figure 9 Washing machine knob design and its application. ......................................... 49
Figure 10 Energy consumption of the 3D printing process of a washing machine plastic
knob using the Ultimaker 2 desktop 3D printer. ............................................. 51
Figure 11 TRACI mid-points from conventional manufacturing. ................................... 53
Figure 12 TRACI mid-points from distributed manufacturing. ....................................... 54
Figure 13 Conventional and distributed manufacturing mid-points comparison............. 55
Figure 14 Conventional and distributed manufacturing global warming mid-point........ 56

x
Definition of Terms
3D printing: “the fabrication of objects through the deposition of a material using a print
head, nozzle, or another technology. Term often used synonymously with additive
manufacturing; in particular associated with machines that are low end in price and/or
overall capacity”. However, this term was also used to describe the specific technology
patented by Sachs et al. in 1993 as 3DP. (ASTM, 2012).
Additive manufacturing: “a process of joining materials to make objects from 3D model
data, usually layer upon layer, as opposed to subtractive manufacturing methodologies”
(ASTM, 2012).
Computer-Aided Design (CAD): “the use of computers for the design of real or virtual
objects” (ASTM, 2012).
Conventional Manufacturing: the current manufacturing model where production is
concentrated in few manufacturing locations in order to offer cost advantages due to
efficiency generated by high volume and standardized production.
Distributed Manufacturing: the manufacturing model where production is distributed in
several manufacturing locations. Manufacturing locations definition can vary, but for this
study objective, manufacturing locations are the desktop 3D printer users’ homes.
Fused deposition modeling (FDM®): the “material extrusion process used to make
thermoplastic parts through heated extrusion and deposition of materials layer by layer;
term denotes machines built by Stratasys, Inc.”(ASTM, 2012).
xi
Life Cycle Assessment (LCA): the “compilation and evaluation of the inputs, outputs and
the potential environmental impacts of a product system throughout its life cycle” (ISO,
1997).
Material extrusion: “an additive manufacturing process in which droplets of build
material are selectively dispensed through nozzle or orifice” (ASTM, 2012)
Product system: “collection of materially and energetically connected unit processes
which performs one or more defined functions” (ISO, 1997).
STL: ”the file format for 3D model data used by machines to build physical parts; STL is
the de facto standard interface for additive manufacturing systems” (ASTM, 2012).
System boundary: an “interface between a product system and the environment or other
product systems” (ISO, 1997).
Tooling: “a mold, die, or other device used in various manufacturing and fabricating
processes such as plastic injection molding, thermoforming, blow molding, vacuum
casting, die casting, sheet metal stamping, hydroforming, forging, composite lay-up tools,
machining and assembly fixtures, etc.” (ASTM, 2012).
Thermoplastic: a kind of plastic that is moldable when heated to a specific temperature.
Unit process: the “smallest portion of a product system for which data are collected when
performing a life cycle assessment” (ISO, 1997).
1
Chapter I
Introduction
Desktop three-dimensional (3D) printers enable users to fabricate physical objects
from digital computer files in their homes. With the evolution of 3D printing technology
applications and the reduction of operational costs, products tend to be manufactured
close to the point of consumption, and ultimately in customers’ homes (D’Aveni, 2013).
Considering that it is economically and technically feasible to build products at home
using desktop 3D printers, in the near future, 3D printing users may decide to stop buying
products from retailers and fabricate their own products at home. Production will no
longer be concentrated in few conventional manufacturing locations but will be
distributed among numerous users fabricating their own products at home through
desktop 3D printers.
Distributed manufacturing requires no product transportation from conventional
manufacturers to users, thereby possibly reducing the environmental impact of overseas
transportation. Conventional manufacturing usually relies on mass production and a
centralized manufacturing model in locations such as China, where labor and material
costs are reduced. Consumer products fabricated in China are then transported from
manufacturers to retailers in the United States (U.S.) using ocean ships which consume
fossil fuels and emit carbon dioxide—increasing greenhouse gas concentrations in the
atmosphere. Conversely, distributed manufacturing tends to avoid greenhouse gas

2
emissions because manufacturing production is distributed among local users, making
overseas transportation unnecessary.
Research Significance and Objectives
Although one may intuitively suggest that desktop 3D printing associated with
distributed manufacturing is beneficial for the environment because it reduces greenhouse
gases, the problem is that there is little evidence to support this broad declaration. There
is a common belief that 3D printing can reduce the need for product transportation and
then reduce the energy required to move products from centralized manufacturing
locations to retailers, reconfiguring the entire supply chain; consequently, reducing the
impact on the environment (Gibson, Rosen & Stucker, 2009; Lipson & Kurman, 2013;
Despeisse & Ford, 2015). Nevertheless, these authors fail to deliver objective evidences
to support their conclusion; moreover, they transmit a misleading message that 3D
printing by itself is beneficial for the environment.
The environmental impact of desktop 3D printing in a distributed manufacturing
model needs to be evaluated considering Fused Deposition Modeling (FDM) because this
is the most common technology used on desktop 3D printers by home users. Wittbrodt et
al. (2013) demonstrate that there are economic benefits when users fabricate their own
products at home using desktop 3D printers with FDM technology, showing that it is
feasible to do so. From an environmental perspective, Kreiger and Pearce (2013) make a
comprehensive Life Cycle Assessment (LCA) using an FDM desktop 3D printer and
conclude that “distributed manufacturing using open-source 3D printers has the potential

3
to have a lower environmental impact than conventional manufacturing for a variety of
products.”
However, Kreiger and Pearce (2013) make at least three general assumptions that
misrepresent the environmental impact resulting from desktop 3D printing. First,
products selected in their study do not represent a specific product category that desktop
3D printer users are willing to fabricate at home instead of buying from manufacturers. It
is incorrect to draw a broader conclusion about the environmental impact of 3D printing
based on a set of products that may not have a significant effect on conventional
manufacturing. Second, the study does not consider transportation of raw material used
by desktop 3D printers in the life cycle inventory. Desktop 3D printer users require raw
material, which usually comes from overseas, to fabricate their products; for this reason,
it is necessary to ship the raw material to users’ homes. Third, conventional and
distributed manufacturing comparison uses different thermoplastic materials. In Kreiger
and Pearce’s study, Acrylonitrile Butadiene Styrene (ABS) was used in conventional
manufacturing while Polylactic Acid (PLA) was used in distributed manufacturing. ABS
and PLA are both thermoplastics used to manufacture plastic parts, but parts produced
with ABS require more energy than similar parts produced with PLA.
Therefore, this thesis proposes to use LCA to compare the environmental impact
of spare plastic parts fabricated at home by a desktop 3D printer, considering raw
material coming from overseas, and using only ABS to compare conventional and
distributed manufacturing models. Spare plastic parts represent a true product category
that can generate users’ interest in fabricating objects at home instead of buying from
manufacturers, as well as manufacturers’ interest in sharing their product designs with

4
users as digital files instead of managing a complex supply chain of spare parts. From a
raw material perspective, assessing the environmental impact of raw material production
and transportation is relevant to the overall environmental impact of the distributed
manufacturing model. Desktop 3D printer users need plastic filament to fabricate their
parts and this raw material usually comes from overseas manufacturers; consequently, it
is important to consider the filament process as part of a distributed manufacturing
system. Finally, the assessment needs to make clear that distributed and conventional
manufacturing are compared using the same plastic material. Comparing different
materials within the same study may result in a misleading message since the energy
required to process ABS is significantly different compared to that required to process
PLA.
The environmental impact comparison in this study used the LCA methodology to
assess both conventional and distributed manufacturing through the Ecoinvent-3 database
and TRACI mid-points. As the main benefit, the results of this LCA will show desktop
3D printer users the environmental impact of fabricating their own plastic parts at home
and, eventually, influence their behavior regarding the conscious use of 3D printing
resources. It is also hoped that this research will bring awareness to LCA practitioners
regarding the importance of studying more realistic scenarios in order to extrapolate the
environmental impact for a specific product category. Furthermore, this study may also
assist future researchers in quantifying the ways in which spare plastic parts, fabricated
by desktop 3D printing, can contribute to extending the life of obsolete products and
promote environmental benefits through product re-use.

5
Background
Although prior work has been conducted in the field, the Stereolithography
apparatus (SLA) patented by Charles W. Hull is generally recognized as the first major
milestone in commercial 3D printing technology (Gibson, Rosen, & Stucker, 2009). The
SLA printing process starts with a Computer Aided Design (CAD) file that is converted
or translated into a file type named STL, a file type format develop by the 3D Systems
Company, which commercializes the SLA 3D printers (Gibson, Rosen, & Stucker, 2009).
An STL file slices the CAD file into layers and then the 3D printer has the information
required to print each layer. Next, the STL file is sent to the 3D printer where a low-
power laser beam traces a cross-section layer in a liquid photopolymer resin, solidifying
this layer through photopolymerization. Finally, a new liquid layer is replenished over the
previously solidified layer and then the process is repeated until a 3D object is built
(Swift & Booker, 2013).
Many other commercial 3D printing technologies have emerged following
Stereolithography and they typically differ in their way of fabricating cross-section
layers. Their technologies often use different materials and fabrication processes but they
all build 3D objects layer upon layer. ASTM International (2012) provides a set of terms
to structure the most common fabrication processes of 3D printing technologies: binder
jetting, directed energy deposition, material extrusion, material jetting, powder bed
fusion, sheet lamination, and vat photopolymerization. In the Manufacturing Process
Selection Handbook, Swift and Booker (2013) detail the manufacturing process
differences among five of these main 3D printing technologies, and also describe the
advantages and disadvantages of using them for various applications. Similar to SLA,

6
behind every 3D printing technology, there is one original patent that initiated a different
technology and enabled the creation of a new 3D printing company (Table 1).
Table 1. Summary of 3D printing technologies listed by Swift and Booker (2013).
3D Technology Main Process Company
Stereolithography Apparatus, SLA
(U.S. Patent No. 4,575,330, 1986)
Photopolymer resin
solidified by light. 3D Systems
Laminated Object Manufacturing, LOM
(U.S. Patent No. 4,752,352, 1988)
Laminate thin sheets of
paper, plastic or metal. Helisys
Selective Laser Sintering, SLS
(U.S. Patent No. 4,863,538, 1989)
Powder material fused
by laser. DTM
Fused Deposition Modeling, FDM
(U.S. Patent No. 5,121,32, 1992)
Thermoplastic
extrusion. Stratasys
3-Dimensional Printing, 3DP
(U.S. Patent No. 5,204,055, 1993)
Powder material fused
by UV cure.
ZCorp and
others.
Adapted from (Gibson et al., 2009; Bechthold et al., 2015).
Fused Deposition Modeling
While patents protected Stratasys, Inc.’s intellectual property for a limited time,
their gradual expiration has given rise to new 3D printing companies. In 1989, S. Scott
Crump filed the first FDM technology patent and founded Stratasys, Inc. (U.S. Patent No.
5,121,329, 1992). This original patent was the key to the success of Stratasys, Inc.
because it protected Stratasys, Inc. and allowed it to explore this new technology and
develop the 3D printing market with fewer competitors. In 2009, the original FDM patent
expired and then an open source project called RepRap made use of FDM 3D printing
technology and became commercially available (Manyika et al., 2013). In order to build a

7
3D printer from the RepRap open source project, a significant amount of technical skills
are required, which may frustrate less skilled users. With the objective of facilitating the
access of 3D printing to the general public, Bre Pettis, Zack ‘Hoeken’ Smith, and Adam
Mayer founded MakerBot in 2009; similarly, RepRap early adopters Erik de Bruijn,
Martijn Elserman, and Siert Wijnia founded Ultimaker in 2011 (Frauenfelder, 2013).
The adoption of desktop 3D printers by home users has grown with an increase in
companies competing in the 3D printing market, resulting in lower desktop printer prices,
and increased investment in more competitive FDM technologies. With the original FDM
patent expiration, the market competition of new emerging 3D printing companies has
reduced desktop 3D printer prices to an affordable level and promoted the adoption of 3D
printing by home users (Horn & Harrysson, 2012; Brooks, Kinsley, & Owens, 2014;
Walls, Corney, & Vasantha, 2014). In four years, Makerbot sold 22,000 desktop printers
and the market growth opportunities called the attention of Stratasys, Inc., which
acquired Makerbot in a 604 million-dollar deal (Clay, 2013). Comprehensive market
share information about 3D printers is not publicly available; however, the 3D printing
communities make use of internet website portals to share their printer models and what
they are fabricating. The 3D Hubs (2015) website portal provides public market research
based on its users’ records. A trend report from September 2015, based on a survey of
more than 20,000 printers around the globe, shows that Ultimaker 2, RepRap Prusa i3,
and Makerbot Replicator 2 and 2x represent 25% of the desktop 3D printer market
(Figure 1).

8
Figure 1. Distribution of 3D printer models. Adapted from (3D Hubs, 2015).
The benefit of having relatively simple technology and inexpensive raw materials
has helped FDM become popular among home users, but there are also disadvantages
such as fabrication speed when compared to conventional manufacturing. Similar to the
SLA process, printing starts with a compatible STL file that is sent to the printer. Inside
the printer, a filament of a thermoplastic (i.e., a plastic filament) is pushed into a heated
nozzle where the plastic is heated to its transition temperature, melted, and extruded.
Then, the print nozzle moves and deposits the molten plastic over a heated plate to create
a hardened layer of material. Next, the process is repeated and more material is deposited
over the previous layer and then a 3D object is built layer upon layer (Swift & Booker,
2013). The printing velocity is restricted by the capability of a printer to melt, extrude,

9
and deposit thermoplastic material without compromising the resolution and quality
required by the user.
In general, print speed and layer resolution are the main printing parameters that
affect fabrication velocity. The print speed is directly related to the capability of a 3D
printer to supply the plastic filament into the heated nozzle. After the plastic filament,
which typically has a diameter ranging from 1.75 to 3.00 mm, is heated, the molten
material is extruded through the nozzle, which has a diameter smaller than the filament.
Thus, one important parameter is the velocity at which the printer can fill the heated
nozzle with plastic filament. For example, the Ultimaker 2 model uses 2.85 mm plastic
filament and has a 0.4 mm nozzle, and its print speed can range from 30 to 300 mm/s
according to specifications (Ultimaker, 2015). Another important printing parameter is
the layer resolution, which defines the layer height of extruded material. The distance that
a printed object can reach in z direction—moving the print nozzle or the base plate—
defines the layer resolution. For instance, the Ultimaker 2 can move its base plate into z
direction and obtain a layer resolution of between 0.04 and 0.20 mm (Ultimaker, 2015).
In contrast, mass production manufacturing processes have faster building speeds
and are more suitable to deal with high production volumes. The injection molding
process is a common mass production manufacturing process designed to produce plastic
parts. In this process, the heated thermoplastic material is forced into a steel mold tooling
cavity, where it is cooled and formed. While one single plastic part may take hours to be
fabricated by a desktop 3D printer, hundreds of parts can be produced per hour using
injection molding process. On the other hand, contrary to 3D printing, injection molding

10
requires upfront investments to design and fabricate steel mold tooling (Anderson, 2012;
Lipson, & Kurman, 2013).
3D printing may not be suitable to substitute mass production but it can be
feasible for smaller production lots since it requires significantly fewer pre-production
steps to fabricate a plastic part. “It may be hard to imagine that this technology [3D
printing] will displace today’s standard ways of making things in large quantities”
(D’Aveni, 2015b). However, in order to operate 3D printing it is only requires a 3D
printer, raw material (e.g., plastic filament, resin powder, etc.) and electricity, making 3D
printing presumably suitable for low production challenges. For instance, one specific
study using SLS technology finds the break-even point of 87,000 units produced, where
3D printing technology has an advantage over injection molding (Atzeni, Iuliano,
Minetola, & Salmi, 2010). The break-even point will certainly change depending on the
3D printing technology and product, but Atzeni et al. (2010) demonstrate that it is
reasonable to affirm that 3D printing is feasible for lower production volumes, as
opposed to large volumes, where injection molding process is more suitable.
Environmental Impact
The feasibility of 3D printing for low production volumes has not only produced
substantial economic growth by promoting the rise of the 3D printing industry, but it has
also created some expectations about its contribution to the environmental field. Because
it is economically feasible to produce parts for low production volumes, in the future, 3D
printer users may be able to fabricate their own products at home instead of buying these
products from manufacturers (D’Aveni, 2013). This new manufacturing paradigm

11
enables a community of users to work collectively on the design of new products, taking
advantage of digital files that can easily be shared across the internet. Unlike the
conventional manufacturing model, which is based on mass production, distributed
manufacturing merges the designer, manufacturer, and consumer contribution into a
single role in a collective community of makers, thus, eliminating the need for product
transportation. Distributed manufacturing brings, among other things, the concept of on-
demand manufacturing, which in its variations can develop different consequences in the
productivity of the manufacturing system but also for the environment (Chen et al.,
2015). According to this rationale, in the future, conventional manufacturers may no
longer ship products to users because users may fabricate their own products at home;
then, less consumption of fossil fuels will be required for product transportation and,
consequently, greenhouse gas emissions will be reduced.
Consensus exists that 3D printing has the potential to reduce product
transportation and, consequently, to lower the environmental impact through distributed
manufacturing. Gibson, Rosen, and Stucker (2009) assert that 3D printing has the
potential to generate distributed employment that is environmentally friendly since “it
involves much lower energy consumption than the established concentration of product
development, production and distribution.” Similarly, Lipson and Kurman (2013) also
argue that 3D printing can reduce the need for product transportation and storage, which
leave huge carbon footprints due to their fuel and electricity consumption. A
complementary perspective is proposed by Despeisse and Ford (2015), who state that 3D
printing can promote a “reconfiguration of the supply chain,” enabling the fabrication of

12
products with fewer components and assemblies that may require fewer participants and
interactions, potentially leading to a reduction in the environmental impact of logistics.
Additionally, another study emphasizes that the benefits for the environment are
uncertain unless the scenario considers a narrow scope of 3D printing applications.
Gleber, Schoot-Uiterkamp, and Visser (2014) suggest that there is a potential reduction of
carbon dioxide emissions for aerospace fuel demands, aerospace production, and medical
production due to “reduced handling, shorter supply chains, and reduced material
demands;” however, the environmental benefits for consumer products are not significant
according to their study. The study suggests that consumer products require technical and
economic conditions that 3D printing still cannot fulfill, thereby reducing the potential
environmental contribution of 3D printing in the consumer market.
The comparison presented by Gleber et al. (2014) highlights the importance of
assessing 3D printing’s environmental impact in terms of technical and economic
feasibility for consumer products. From an economic perspective, researchers fabricated
20 different 3D objects using a desktop 3D printer based on FDM technology and showed
that it is economically feasible for an average U.S. household to fabricate commercial
products at home instead of buying those products from conventional manufacturing
(Wittbrodt, Glover, Laureto, Anzalone, Oppliger, Irwin, & Pearce, 2013). They also
concluded that electricity consumption was a key element in determining the economic
feasibility of fabricating products with desktop 3D printing. However, even 3D printing
enthusiasts are still careful about declaring the environmental benefits of this new
technology. For instance, although Lipson and Kurman (2013) believe in the potential of
3D printing for the economy and society, they also warn their readers about the

13
importance of using a lifecycle approach: specifically, considering that 3D printing
consumes up to 10 times more energy than a mass production manufacturing process
such as injection molding does. A study comparing products fabricated by FDM and
milling machines elucidates the importance of selecting a restricted scenario and using
LCA to understand the environmental impact of 3D printing (Faludi, Bayley, Bhogal, &
Iribarne, 2015). This study did not focus on distribution manufacturing but on rapid
prototyping; nonetheless, the study compared products fabricated by different
manufacturing processes and showed, using LCA results, that energy consumption is a
key contributor to the environmental impact of 3D printing.
While potential sustainability benefits have been reported by previous studies,
quantitative studies that focus on FDM technology are needed in order to specifically
answer whether the environmental impact of distributed manufacturing is lower than that
of conventional manufacturing. Moving toward sustainable manufacturing requires
scientific data to assess the environmental impact of new forms of manufacturing. For
this reason, the use of a standardized framework and methodology based on the Life
Cycle Inventory is required “to truly understand and appreciate the environmental impact
beyond just postulations and suggestions based on statically insignificant data” (Mani,
Lyons, & Gupta, 2014). Among previous research approaches (Table 2), one particular
study underscores the importance of using LCA as a quantitative environmental impact
analysis of the FDM technology.

14
Table 2. Environmental impact of 3D printing research matrix.
Qualitative
(vision, reasoning, opinion)
Quantitative
(cost benefit, LCA)
General
(many technologies)
- Chen, D., Heyer, S., Ibbotson,
S., Salonitis, K., Steingrímsson,
J. G., & Thiede, S. (2015)
- Despeisse & Ford (2015)
- Gibson, Rosen, & Stucker
(2009)
- Lipson & Kurman (2013)
- Gebler, Schoot-Uiterkamp,
& Visser (2014)
Specific
(FDM technology)
- Faludi, Bayley, Bhogal, &
Iribarne (2015)
- Kreiger & Pearce (2013)
- Wittbrodt, Glover, Laureto,
Anzalone, Oppliger, Irwin, &
Pearce (2013)
The studies about the environmental impact of 3D printing were categorized as “General”
or “Specific” depending on the scope of technology studied and as “Qualitative” or
“Quantitative” depending on whether or not conclusions were based on quantitative data.
Finally, Kreiger and Pearce (2013) apply the LCA methodology to three different
products and then contrast the environmental impact of producing these products at home
using desktop 3D printers with similar products using injection molding at an overseas
manufacturer. The LCA results from their study show “that distributed manufacturing
with a RepRap 3D printer will have less environmental impact than conventional
manufacturing.” Kreiger and Pearce's study is, in fact, the most specific and quantitative
work that could assist 3D printer users in determining whether it is sustainable to
fabricate objects at home instead of buying those same products from the market.
Consensus exists among many authors that there are environmental benefits associated
with 3D printing, but Kreiger and Pearce (2013) are some of the few who draw this
conclusion based on an LCA approach.

15
Although Kreiger and Pearce (2013) based their conclusion on reasonable
assumptions and LCA results, they do not consider three important elements to make
their broader statement sound. First, it is not realistic to assume that low-end products
selected in their study (e.g., a spout, a juicer, and a toy) are feasible in a distributed
manufacturing model. The products chosen in their study do not represent a realistic
product category that 3D printer users are willing to fabricate at home and, consequently,
do not promote distributed manufacturing. Second, their study’s boundary and system
conditions do not take into consideration that raw material transportation from suppliers
to desktop 3D printer users will occur, and that injection molding and 3D printing use
different raw materials. It is reasonable to investigate whether including the raw material
supply chain into life cycle inventory and LCA calculation can offset any environmental
gain from avoiding the product transportation in conventional manufacturing. Third, the
authors’ comparison consider the possibility of fabricating products through 3D printing
using PLA instead of ABS. If comparison between conventional and distributed
manufacturing uses different materials, it is possible that results are biased toward the
systems that use PLA because processing PLA requires less energy than processing ABS
does.
Spare Plastic Parts
Neil Gershenfeld, professor at the Massachusetts Institute of Technology (MIT)
and the head of MIT's Center for Bits and Atoms, is an enthusiast of digital fabrication,
which includes 3D printing as one of its technologies. However, he is cautious about the
potential of the application of 3D printing technology in the future. At the same time that

16
he believes that 3D printing will allow users to “design and produce tangible objects on
demand, wherever and whenever they need them,” he also considers that 3D printing is
too slow and may not be suitable to fabricate whatever a user needs (Gershenfeld, 2012).
In his view, today’s interest in 3D printers resembles the 1950s enthusiasm for
microwave ovens. At that time, many foresaw that microwave ovens would have a great
impact on cooking, but, in fact, even today the microwave oven has not replaced the
conventional oven. Professor Gershenfeld has great hopes for 3D printing: he believes
that 3D printing will follow the same steps as personal computing, which started as
hobbyists’ equipment and has become ubiquitous in one’s daily activities. However, this
particular observation—that today’s 3D printers resemble yesterday’s microwave
ovens—clearly drives one to think about where, specifically, 3D printing fits into its
actual context of technical development and about the most likely purpose that 3D
printers may serve in avoiding conventional manufacturing.
Therefore, the present study proposes to select spare plastic parts as a realistic
product category with which to measure the environmental impact of desktop 3D
printers. Spare plastic parts are usually fabricated in a mass production model and then
stocked until they are required to substitute a broken part from a product. Because
products have a significant quantity of individual parts, storing and making spare parts
available to users is a complex and expensive operation for manufacturers. According to
Despeisse and Ford (2015), the environmental benefits are expected to be higher for
modular and upgradable components since products can be kept in operation using 3D
printed parts and can thus have their lifespan expanded. Distributed manufacturing can
eliminate resources that do not add value to centralized manufacturing, such as injection
17
molding tools, energy consumption arising from the transportation of products, and
stocking spare parts (Gibson, Rosen, & Stucker, 2009). From an economic perspective,
fabricating spare plastic parts at home is a win-win situation because users can save
money and time fabricating these parts at home while manufacturers can get rid of
managing non-added value operations on their side.
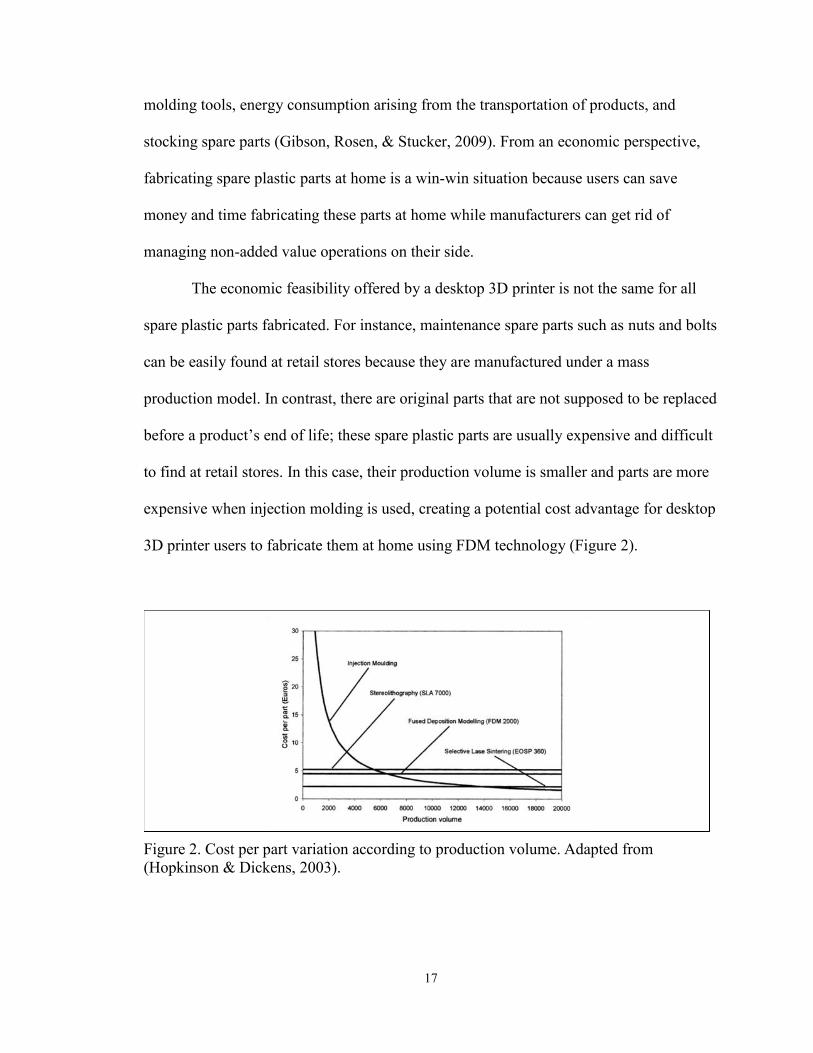
The economic feasibility offered by a desktop 3D printer is not the same for all
spare plastic parts fabricated. For instance, maintenance spare parts such as nuts and bolts
can be easily found at retail stores because they are manufactured under a mass
production model. In contrast, there are original parts that are not supposed to be replaced
before a product’s end of life; these spare plastic parts are usually expensive and difficult
to find at retail stores. In this case, their production volume is smaller and parts are more
expensive when injection molding is used, creating a potential cost advantage for desktop
3D printer users to fabricate them at home using FDM technology (Figure 2).
Figure 2. Cost per part variation according to production volume. Adapted from
(Hopkinson & Dickens, 2003).

18
Spare plastic parts are necessary to substitute an original broken part from a
product that requires this part to operate properly. Spare parts that are required for
preventive maintenance fall outside the scope of this work because they are already part
of the established mass production model. Product designers can foresee that some parts
will need to be replaced before the end of life of a product. For example, fuel filters used
by regular cars are spare parts typically replaced before the car’s end of life. These parts
are produced together with original parts and are directed to maintenance locations
instead of manufacturers’ assembly lines. Consequently, they already take advantage of
conventional manufacturing savings and their supply chain is not necessarily independent
from that of regular conventional manufacturing.
However, when an original plastic part that is not supposed to break during a
product’s lifetime needs replacement, manufacturers need to manage a non-standardized
supply chain management to supply the repair centers with this specific part and,
eventually, to replace the whole product. This alternate supply chain model is not the core
business of manufacturers. Therefore, in order to comply with regulations and customers’
requirements, manufacturers are required to produce non-optimized small lots of
production to supply the market with spare parts.
Understanding why original plastic parts break before products’ end of life is
crucial for determining the characteristics of spare plastic parts. Assuming that
manufacturers have made the correct material, design, and manufacturing process
choices, the original plastic part should last the entire product’s lifetime, unless the
product was inappropriately used or overextended its expected lifetime. The
inappropriate use of a product may put the original plastic part under a situation where its

19
mechanical, thermal, environmental, electrical, and chemical properties will not assure its
functionality. Conversely, if the product is used within the manufacturer’s specifications,
the product will last beyond the expected end of life and, eventually, fail due to its
overextended lifetime. This present study will assume that users make the correct use of
the product and spare plastic parts are used to replace original plastic parts broken due to
overextending the product’s expected lifetime.
Due to the popularity of 3D software modeling, part design information is no
longer restricted to manufacturing facilities. Collaborative websites, like Thingiverse, are
dedicated to 3D printing communities and share the 3D design for several parts intended
to replace a broken part. Usually, 3D printer users are familiar with mechanical design
and desktop 3D printer capabilities, so whenever their own household products break,
they are inclined to resolve the problem by disassembling and fixing the product by
substituting the broken part with a 3D printed part. In the household category of the
Thingiverse website, there is a sub-category named Replacement Parts that presents a
significant number of examples of the ways in which users can fix their household
products using 3D printed parts.
However, not all products listed in this category are suitable for this study. Again,
if a part produced by a 3D printer does not avoid the manufacturing of a new part by
conventional manufacturing, it does not reduce the need for production and product
transportation from overseas; consequently, it is out of the scope of this study. For
instance, some parts that may complement the use of a product, such as holders, may
assist users with domestic challenges but they do not fix a broken part. Instead, they
simply make the product more functional. Furthermore, some parts are experiments to

20
prove 3D printing capabilities but there are clearly more suitable substitutes available on
the market. Some nuts, bolts, washers, and brackets are examples of parts produced by
users with this intent. On the other hand, some parts are clearly designed to replace a
broken part from a product that users may feel compelled to fabricate it instead of waiting
for an original replacement part.
Raw Material Transportation
Fabricating products at home may avoid product transportation from conventional
manufacturers to customers but it also introduces the necessity to transport raw material
from suppliers directly to 3D printer users. While thermoplastic material used in the
injection molding process comes in pellet form, desktop 3D printers use the thermoplastic
material in filament form. Like injection molding, plastic filament production uses the
thermoplastic material in pellet form. The thermoplastic pellets are fed into an extruder to
produce a plastic filament. Next, similar to the electric wire package process, the plastic
filament is rolled into plastic spools. Then, filament spools containing a plastic filament
are vacuum packaged into a polyethylene bag to protect the filament from humidity
(Torwell Macromolecule Material Limited, 2015).
It should be noted that packaged plastic filament contains the plastic spool, which
is not directly used in the fabrication of an object but may have an impact on the LCA.
Plastic spools can vary in format and material, but according to one plastic spools
manufacturer, spools are manufactured using an injection molding process and are made
from Polystyrene (PS) or Polypropylene (PP) plastic that has a regular density of 1.05
g/cm³ (Dongguan Changhong Bobbin Co., Ltd, 2015). In order to transport one kilogram

21
of ABS filament, 187.37g of PS is also required by injection molding to manufacture one
spool—assuming that PS density is 1.05 g/cm³ (Figure 3).
Figure 3. Plastic spool dimensions and estimated volume. Adapted from (Dongguan
Changhong Bobbin Co., Ltd, 2015)
Raw material package density from conventional manufacturing is different when
compared to raw material density for 3D printing processes. Conventional manufacturing
uses the thermoplastic material in pellet form for its injection molding process. Raw
material comes in ABS pellets, which yield an estimated package approximated density
of 1.05 g/cm³—similar to ABS density itself. Distributed manufacturing, on the other
hand, uses plastic filament as raw material for the 3D printing process. Assuming that one
carton of 8 x 8 x 3 inches contains 1kg (2.2 pounds) of 3.0mm ABS filament and has a
total package weight of 3.0 pounds, one may estimate a density of 0.4325g/cm³ for a
plastic filament package. Thus, considering a fixed volume of transportation in a truck,
about 2.4 times more trucks are required to transport the same amount of raw material to
distributed manufacturing when compared to conventional manufacturing.

22
Research Questions and Hypotheses
This study tests the hypothesis that fabricating products at home using desktop 3D
printers has less environmental impact than buying products from manufacturers. The
dominant argument is that because users fabricate products at home there is no reason to
transport products from manufacturers to users’ homes; consequently, fossil fuel
consumption and greenhouse gas emissions are diminished (Gibson, Rosen & Stucker,
2009; Lipson & Kurman, 2013; Despeisse & Ford, 2015).
To test this hypothesis, this study must assess a product category that users have
more interest in fabricating at home than in buying from a conventional manufacturer.
Therefore, the aim of this study is to answer the following question: is the environmental
impact of ABS-made spare plastic parts fabricated at home by a desktop 3D printer lower
than that of similar ABS parts made by conventional manufacturing?
In order to answer this question, a LCA compared the environmental impact of
spare plastic parts fabricated by these two main models: 3D printing in distributed
manufacturing and injection molding in conventional manufacturing. As a result, this
study’s findings will assist desktop 3D printer users to understand the environmental
impact of fabricating their own plastic parts at home and, hopefully, will influence their
behavior regarding the conscious use of 3D printing resources.

23
Chapter II
Methods
LCA methodology was used to compare the environmental impact of distributed
manufacturing versus conventional manufacturing. The International Organization for
Standardization (ISO) 14040:1997(E) standard “provides principles and framework and
provides some methodological requirements for conducting LCA studies,” and details
each phase of this framework. According to the ISO, the phases of LCA are goal and
scope definition, inventory analysis, impact assessment, and interpretation. LCA
methodology is not linear. Although it starts with goal and scope definition, the
remaining phases do not come one after the other; instead, they are all interconnected in
an LCA framework. Thus, the LCA methodology is iterative and not linear;
consequently, the LCA practitioner might eventually be encouraged to interpret and
review any phase of LCA at any time because the more data is collected, the more is
learned about the system (ISO, 1997; Bauman and Tillman, 2004).
It is desirable to establish a main regular flow from goal and scope definition to
the final interpretation of results, although LCA is iterative and activities may freely go
back and forth along the assessment. A straightforward approach assists LCA
practitioners in objectively approaching each LCA phase and in performing key activities
or reaching milestones that need to be accomplished to assure the completion of an LCA
study. In addition, this approach does not prevent the iterative nature of LCA to start a
new activity every time a new finding detours the regular flow of actions expected by the

24
straightforward LCA approach. Therefore, a flow was designed to describe high-level
research steps to be accomplished, establishing a pragmatic methodology process and
offering a cadence for this research study (Figure 4).
Figure 4. High-level research methodology steps based on life cycle assessment.
Goal and Scope Definition
The goal of this study was to compare the environmental impact of a plastic part
fabricated by a desktop 3D printer in a distributed manufacturing model with a similar
plastic part fabricated by injection molding in a conventional manufacturing model. For
this reason, the first step was to select the plastic material to be used in the experiment.
The second step was to select the desktop 3D printer model based on the most common
technology used in desktop 3D printers, the plastic material choice, and the printer
models available for purchase. Next, a part category was defined by considering a
scenario where a specific part category is currently produced by conventional
manufacturing and potentially feasible to be fabricated by desktop 3D printer users. Then,

25
a functional unit was designed in order to compare conventional with distributed
manufacturing on a similar basis. Lastly, system boundaries were delimited in order to
capture only production stages that are distinctive between conventional and distributed
manufacturing systems; moreover, the analysis was simplified and focused only on the
core stages of both systems.
Plastic Material
The material selection of an original and spare plastic part must be compatible to
its use because material choice is critical for defining plastic properties. PLA is a material
commonly used in desktop 3D printers, but not in conventional manufacturing. Instead,
products such as plastic toys, electronic equipment, and household appliances are usually
made of many individual ABS parts. ABS is commonly used in conventional
manufacturing due to its resistance to chemicals, heat, and impact.
One may consider comparing conventional manufacturing using ABS with
distributed manufacturing using PLA, but this is not a fair comparison. Kreiger and
Pearce (2013) consider PLA a better environmental choice than ABS with regard to
energy consumption during desktop 3D printing fabrication. However, comparing PLA
with ABS is not appropriate for an LCA study because PLA properties are not completely
suitable for ABS applications; otherwise, conventional manufacturers would be using
PLA instead of ABS in production.
3D Printer
26
There are several 3D printer models available for desktop users. The criteria used
in this study was to choose a specific 3D printer model that represented a significant
segment of the market share of 3D desktop printers. According to a 3D Hubs (2015)
report, the main 3D printers are the Ultimaker 2, the RepRap Prusa i3, and the models
Replicator 2 and 2x from MakerBot. Different desktop 3D printers may use different
plastic materials. For instance, the Replicator 2 uses only PLA as a raw material, while
the remaining top listed printers (e.g., Ultimaker 2, Prusa i3, and Replicator 2x) use PLA
and ABS. Although all of these desktop 3D printer models use FDM technology and
fabricate plastic parts with similar characteristics, their differences regarding raw material
use must be considered from an environmental assessment standpoint. Thus, the
Replicator 2 could not be used in this study because it only uses PLA as raw material
Therefore, the printer selected for this study was the Ultimaker 2. The choice was
based on its popularity among users, the similarity of its power specifications when
compared to other 3D printers, and availability for testing. The Ultimaker 2 is the most
popular printer according to the 3D Hub survey, which made it the strongest candidate
for the study (3D Hubs, 2015). In addition, the Ultimaker 2 has similar power
consumption specifications to those of the Prusa i3 and the Replicator 2x (Table 3).
Finally, this printer model was available for testing in a nearby university. The
convenience of executing a test in the controlled environment of a university, the
similarity of power consumption and the popularity index provided by 3D Hubs drove the
choice of the Ultimaker 2 printer model.

27
Table 3. 3D printer model main characteristics.
3D Printer
Model
Price
(US$)
Build Envelope
(cm)
Plastic
Material
Nozzle
(mm)
Filament
(mm)
Power
(watts)
Ultimaker 2 2,500 22.3 x 22.3 x 20.5 ABS,
PLA 0.4 2.85 221W
Prusa i3 300-
1,000 20.0 x 20.0 x 20.0
ABS,
PLA 0.4
1.75 or
2.85 n.a.
Replicator 2X 2,500 24.6 x 16.3 x 15.5 ABS,
PLA 0.4 1.75 221W
Adapted from (Makerbot, 2015; RepRap, 2015; Ultimaker, 2015).
Part Category
This study focused on parts that fit inside a desktop 3D printer’s build envelope.
Spare plastic parts need to be small enough to fit inside a desktop 3D printer build
envelope in order to be produced at home. For instance, the Ultimaker 2 can produce
plastic parts that fit inside a build envelope of 22.3cm x 22.3cm x 20.5cm. For this
reason, large ABS parts that cannot fit inside the building envelope were out of the scope
of this study. The parts needed to replace ABS parts from toys, electronic equipment, and
household appliances are generally small enough to fit inside the building envelope;
hence, they were suitable for this study.
Research was conducted on the Thingiverse website in order to determine which
spare part category was most suitable for the scope of this study. Thingiverse has
thousands of parts listed in the Household Replacement Parts category; therefore, in order
to avoid any research bias, the first 10 parts uploaded by users every month from January
to May 2015 were sampled. Then, only parts made to replace an original broken part
were categorized. Next, since Thingiverse users can express their enthusiasm regarding
any part design by voting in a similar fashion to the Facebook “like” button, parts were

28
categorized according to the quantity of “likes” and ranked into a descending order to
determine the most liked category. Finally, parts were also categorized into broader
categories in order to assess which kind of part was most recurrently designed by users.
Overall, this selection methodology provided a 3D printer user perspective regarding
which spare plastic part made more sense to be evaluated.
Functional Unit
The functional unit of this study was defined as “the volume of ABS spare parts
required by one individual to make self-repair of household appliances along an extended
product’s lifetime.” The functional unit is a key element to enable the comparison
between two distinctive systems: “it is a measure of the performance that the systems
under study have in common” (Bauman & Tillman, 2004). Once the spare part fits into a
specific three-dimensional slot in a product and makes it functional again, the repair is
complete. Thus, although it is tempting to define a functional unit based on plastic
weight, in fact, the first key characteristic of a spare plastic part is its volume.
Injection molding and 3D printing processes may produce plastic parts with
different weight. While a 3D printer can produce solid or hollow plastic parts that still
occupy the volume required to make a part functional inside a product assembly, an
injection molding design can also produce parts with less material than a completely solid
object. Despite the quantity of material used, all characteristics must be preserved in both
cases to make a plastic part functional. In order to compare injection molding and 3D
printing parts, the functional unit may consider whether other important mechanical
properties are preserved independently from the weight variation of the plastic part.

29
Probably, the most important mechanical property of a spare plastic part is its
durability. One may assume that mechanical, thermal, environmental, electrical, and
chemical part characteristics are preserved when using the same ABS material for both
conventional and distributed manufacturing scenarios. However, this is not entirely
correct because a 3D printer fabricates anisotropic parts: the mechanical parts vary
according to the direction in which they are fabricated (Ahn, Montero, Odell, Roundy, &
Wright, 2002). Ahn et al. (2012) demonstrate that “the compressive strengths of FDM
specimens ranged from 80 to 90 percent of those for injection molded ABS,” and
measured tensile strengths of FDM specimens “were between 65 and 72 percent of the
measured strength of injection molded FDM ABS.” In summary, 3D printed parts seem
to be less resistant than injection molding parts are.
If lower tensile and compression strength are influenced by anisotropic
characteristics of 3D printed parts, it is perhaps reasonable to assume that fatigue stress is
also affected and, therefore, influences plastic part lifetime. The fatigue stress properties
of FDM 3D plastic parts not only display anisotropic behavior, but are also influenced by
the orientation of the layers of molten plastic (Lee and Huang, 2013; Ziemian, Okwara, &
Ziemian, 2015). Although 3D printed parts seem to have lower resistance to fatigue stress
than injection molded parts, the lack of a study directly comparing fatigue stress
properties between a part fabricated by a desktop 3D printer and injection molding
prevents including any data in the LCA study.
While it is not conclusive, a comparison of fatigue stress results from different
studies can provide an approximate indication of whether 3D printed parts behave
differently than injection molded parts do during fatigue stress tests. One common fatigue

30
data chart used for this evaluation was the S-N curve, which plots the magnitude of
cyclical stress (S) against the cycles to failure (N) (McKeen, 2009). Various authors
provide tensile stress amplitude versus cycles to failure data for 3D printed and for
injection molded parts, but no direct comparison was found in existing studies (McKeen,
2009; Lee Huang, 2013; Ziemian et al., 2015). Again, while it is not conclusive, a 3D
printed part always breaks with fewer cycles when compared to injection molding at the
same stress level when comparing data from 3D printed parts with injection molded parts
(Figure 5).
Figure 5. Stress per cycles to failure graph from ABS part produced using injection
molding and 3D printing process. Adapted from (McKeen, 2009; Lee & Huang, 2013)
Although it is not possible to assert the exact influence on durability among these
two distinctive manufacturing processes, this comparison strengthens this study’s
assumption that, under similar conditions, 3D printing parts are expected to fail before
injection molding parts do. While tension and compression static test differences per se

31
cannot indicate whether durability is affected, this simple data comparison provides a
reasonable amount of confidence that 3D printing parts may have lower durability when
compared to injection molding parts. Unfortunately, these experiments were not designed
to be compared, so it is therefore not safe to conclude that 3D printing and injection
molding behave in exactly the same proportion as illustrated in Figure 5; for this reason,
this data cannot be safely used in the functional unit definition. All in all, ideally, the
functional unit should consider that more 3D printing parts are required to fulfill spare
part needs compared to parts produced by injection molding.
Due to a lack of data, in this study the functional unit will not consider the
durability disadvantage of 3D parts over injection molding. On one hand, this may
become a clear advantage from an environmental assessment perspective toward 3D
printing because in the real world it is expected that 3D printed parts submitted to
mechanical cycles break more often than injection molding parts do. On the other hand,
acknowledging this bias will create extra confidence in the environmental impact results
in a situation where injection molding proves to be more environmentally friendly than
3D printing.
System Boundaries
Assumptions about the circumstances and ways in which spare plastic parts are
produced, packaged and stocked for a future request, and then shipped to users, are
critical to the definition of supply chain scenarios. Considerations about the minimum
amount of products that can be stocked and transported will be important to delineate the

32
differences between conventional and distributed manufacturing, and to define the system
boundary of the study.
In this study, two main systems were compared: conventional manufacturing and
distributed manufacturing. The raw material process is exactly the same for both systems,
so, the raw material process is out of system boundaries because the environmental
impact of this process is the same for both systems. Similarly, product use and disposal
processes also tend to be the same for both systems. Ultimately, both conventional and
distributed manufacturing produces a plastic object that will be used and discarded.
Because these systems are not supposed to differ in terms of use and disposal, these unit
processes were not part of system boundaries. It is more important to compare the
manufacturing process of conventional manufacturing with the fabrication process of
distributed manufacturing. In fact, the system boundary aims to focus the environmental
study on manufacturing stages where differences between injection molding and 3D
printing can be seen, and where product transportation occurs (Figure 6).
33
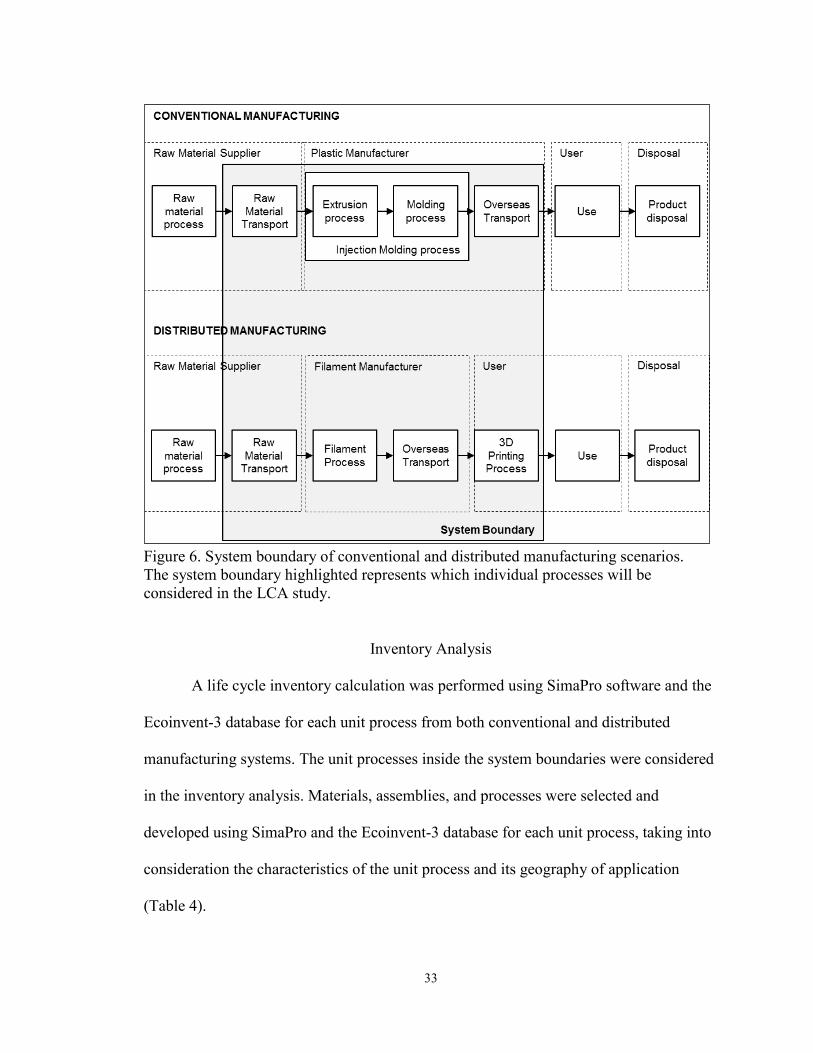
Figure 6. System boundary of conventional and distributed manufacturing scenarios.
The system boundary highlighted represents which individual processes will be
considered in the LCA study.
Inventory Analysis
A life cycle inventory calculation was performed using SimaPro software and the
Ecoinvent-3 database for each unit process from both conventional and distributed
manufacturing systems. The unit processes inside the system boundaries were considered
in the inventory analysis. Materials, assemblies, and processes were selected and
developed using SimaPro and the Ecoinvent-3 database for each unit process, taking into
consideration the characteristics of the unit process and its geography of application
(Table 4).

34
Table 4. Materials, assemblies, and processes used in LCA inventory.
Unit processes Materials, assemblies and processes from the
Ecoinvent-3 database
Raw material transport Transport, freight, lorry, unspecified {GLO}| market
for | Alloc Def, S
Injection molding process Injection moulding {ROW}| processing | Alloc Def, S
Filament process Extrusion, plastic pipes {RoW}| production | Alloc
Def, S;
Injection moulding {ROW}| processing | Alloc Def, S;
Polystyrene, general purpose {GLO}| market for |
Alloc Def, S
Overseas transport Transport, freight, lorry, unspecified {GLO}| market
for | Alloc Def, S;
Transport, freight, sea, transoceanic ship {GLO}|
market for | Alloc Def, S
3D printing process Electricity, low voltage {WECC, US only}| market for
| Alloc Def, S
Raw Material Transport
The first step, or unit process, of both conventional and distributed manufacturing
systems is the transport of ABS pellets from the raw material supplier to the injection
molding or filament process. ABS pellets are small cylindrical pieces of ABS plastic with
a diameter and length of few millimeters. Due to their granular shape, they are
transported in different sizes of packages: 25kg and 1-ton bags are commonly used in the
industry. Hence, both package standards are suitable for truck transportation from raw
material supplier to plastic part or filament manufacturer. The density of the package is
estimated to be similar to ABS’s density of 1.05 g/cm³ due to pellets’ fine-grained
characteristics. In this study, it was assumed that the raw material supplier and plastic
35
part or filament manufacturer were both located in Shenzhen, China, separated by a
distance of 100km.
Injection Molding and Filament Processes
In this process, ABS pellets are fed into a hopper just above the injection molding
equipment to produce a plastic part. ABS pellets are heated inside a structure called a
barrel, then a screw motor drive propels the molten material from the barrel to inside a
steel tooling cavity, where the material is cooled and formed. After that, parts are
gathered and packaged into cardboard boxes.
Similar to the injection molding process, ABS pellets are the raw material of the
filament process. ABS pellets are also fed into a hopper just above the extruding
equipment to produce a plastic filament. Again, ABS pellets are heated inside a barrel
and then a screw motor drive propels the molten material out of the extruder; however,
unlike injection molding, the final product is not molded inside a steel tooling, but is
instead cooled in filament form and rolled into polystyrene spools. It should be noted that
these spools are made by injection molding and become part of this unit process. Finally,
the plastic filament, when ready and packaged, becomes a secondary raw material for the
3D printing process.
Overseas Transport
While in conventional manufacturing, the plastic part is shipped to the end user
after the injection molding process, in distributed manufacturing, the filament roll is
shipped to the end user as secondary raw material for the 3D printing process after the

36
filament process. In both cases, it was assumed that the plastic part or filament was
transported by truck from the manufacturer location to Shenzhen port, an estimated
distance of 100km. Because it was assumed that the end users were in Boston, U.S.,
plastic parts and filament were considered to be transported from Shenzhen to Boston
port by ocean. According to data retrieved from the Ports.com website, a ship must travel
12,769 nautical miles, or 23,648.19 km, to go from Shenzhen to Boston, passing through
the Suez Canal (Ports.com, 2016). Finally, in Boston, another truck needed to travel an
additional 100km to take plastic parts or filament from the Boston port to local retailers.
3D Printing Process
This is the last unit process in the distributed manufacturing system and it occurs
in the user’s home. In this unit process, the plastic filament is transformed into a physical
object through 3D printing technology. In short, the 3D printing process heats the
filament plastic to make it malleable to give form to the objects layer by layer. This
operation requires the plastic filament as (a secondary) raw material as well as electricity
to produce energy to melt the plastic filament. Because the Ecoinvent-3 does not contain
the required information to perform the life cycle inventory for the 3D printing process,
an assumption was made that the life cycle inventory of the 3D printing process is
directly related to its energy consumption in melting a certain mass of plastic.A desktop
3D printer has few printing settings that significantly determine energy consumption. The
energy consumption of desktop 3D printers varies depending on the models and
especially on certain printing parameters (Walls, Corney, & Vasantha, 2014). According
to Walls et al. (2014), more research is needed to assess the influence of filament

37
diameter, layer height and printer speed parameters on energy consumption. Filament
diameter is a fixed parameter in this study because the desktop 3D printer Ultimaker 2
uses only the filament size of 2.85 mm. Layer height determines the quality of the
fabricated part as well as the printing velocity. If the layer height is low, more layers are
necessary to fabricate an object; consequently, the printing time is longer. Finally, printer
speed is the velocity at which the filament is pulled into the desktop 3D printer. In
summary, filament diameter, layer height, and print speed are printing parameters to be
defined before measuring the energy consumption of a desktop 3D printer.
As with any ordinary equipment that relies on electricity, a printer’s energy
consumption is proportional to its operation time: the longer the printing time, the higher
the energy consumption. In desktop 3D printers, electricity is used to power small motors
to move a printer nozzle that is kept heated above the transition temperature to extrude
ABS plastic; therefore, it is expected that the more the nozzle moves and is kept heated,
more energy is consumed. In the desktop 3D printer Ultimaker 2, the plastic filament
diameter is fixed at 2.85 mm; thus, print speed and layer height become parameters that
significantly influence the time needed to print an object. Layer height is related to the
amount of material deposited per layer. When layer height is relatively high, fewer layers
are needed to fabricate an object, resulting in a reduced printing time. Conversely, the
print speed parameter is the velocity with which the plastic filament is inserted into the
3D printer. It is expected that higher print speeds will make objects faster, thereby
reducing energy consumption. Therefore, since this study aimed to measure electricity
consumption, layer height and printer speed were the parameters of interest in this
experiment.
38
Printing parameters were chosen based on information provided by the Ultimaker
2 software and laboratory technician expertise. Version 15.04 of Cura (2015), the 3D
printing software used to prepare 3D computer files, indicates in its instruction manual
that a layer height of 0.1 mm is required to achieve normal quality. Although this desktop
3D printer model can print layers from 0.006 to 0.25 mm, the choice was made to keep
product quality at the normal standard to avoid printing rework and to reflect the most
likely parameter used by general users. Next, print speed was kept below 80 mm/s under
the advice of a laboratory technician who’s past experience proved that above this
threshold printing becomes less stable. In fact, Version 15.04 of Cura (2015) indicates
that the Ultimate 2 printers can reach up to 150 mm/s, but it requires personal
experimentation to adjust the optimized settings. Thus, this study relied on the laboratory
team’s expertise and helpful tips from 3D printing software, so layer height was kept at
0.1 mm and print speed at 50 mm/s.
The filling percentage is an important parameter that affects printing time and also
the quantity of material used to build a plastic part. The interior of an object fabricated by
a 3D printer can be completely solid or partially hollow, similar to a honeycomb
structure, thereby requiring less plastic material. The solid interior is expected to give to
the plastic part the maximum mechanical strength; however, the 3D printer is capable of
printing hollow inner structures that may provide similar mechanical strength using less
material. All in all, the less the plastic part is filled, the shorter the printing time is;
consequently, the fabrication time and energy consumption will vary depending on the
filling percentage.

39
This experiment used fixed parameters of layer height, printer speed, and different
filling percentages to evaluate energy consumption. Again, layer height was set at 0.1
mm, the print speed at 50 mm/s, and the filling percentage was set at 100% and 25%.
During the experiment, a watt-meter, plugged into a desktop 3D printer power line,
measured the energy consumption with 0.01 kWh resolution (Figure 7). The energy
measurement started just after the base plate and heating process, exactly when the plastic
material started to flow from the print head. The measurement ended when the print head
stopped delivering plastic material to the object. The total energy consumption and
printing time were collected. Finally, after the part had cooled, it was removed from the
3D printer and weighed on a scale with a 0.1g resolution. Excess material was removed
and the part was weighed again. Although the excess material was required to produce
the 3D printed part, the weight difference represented wasted plastic material.

40
Figure 7. Desktop 3D printer and watt-meter plugged into a powerline.
It should be noted that the initialization printing step, which has an effect on
energy consumption, was removed from this experiment, simply to reduce experimental
variability. In order to fabricate an ABS plastic part, it is necessary to heat its base plate
to a temperature of approximately 90°C to avoid the plastic deformation due to fast
cooling when plastic leaves the print nozzle and touches the base plate. In parallel, the
printer nozzle needs to be heated up to the transition temperature while the base plate is
heating up. Therefore, the preliminary heating time from the base plate and nozzle were
not considered in the individual measurement. Supposedly, heating timing and energy
consumption may be different when different print jobs are compared. For instance, a
desktop 3D printer may already be heated; then, the heating time and energy consumption

41
are lower than in another situation where more heating time is required to print an object
for the first time. Based on laboratory technician experiences and the researcher’s own
observation, heating time is around 5 minutes and consumes 0.02 kWh. Energy
consumption may not be sufficient to significantly distort the results, but the
measurements would be more accurate with the elimination of this source of variation
from the experiment.
Life Cycle Impact Assessment
The objective of this methodology phase was to translate the life cycle inventory
into environmental impact (Bauman & Tillman, 2004). The life cycle inventory
calculation shows, for example, carbon dioxide emissions as well as many other
greenhouse gases that contribute to global warming. When greenhouse gas emissions are
calculated for both the conventional and distributed manufacturing system, it may be
difficult to compare these systems and understand their contribution to the greenhouse
effect and impact on global warming. In order to improve the readability of the results,
the greenhouse gas emission results were gathered and converted into an aggregated
second-level indicator, such as global warming, also known as a mid-point.
In addition, obtaining only a global warming mid-point may reveal only part of
the story about differences between the environmental impacts of conventional and
distributed manufacturing. The life cycle inventory needs to be translated into a few other
mid-points in order to provide readers with a broader understanding. For example, ozone
depletion is an important mid-point to characterize the impact of ozone emissions in the
lower atmosphere. Although the ozone concentration in the upper atmosphere works as a

42
shield against dangerous ultraviolet rays from the sun, in the lower atmosphere, ozone is
a harmful pollutant that causes damage to plants and human health (Bauman & Tillman,
2004).
Converting measurements into mid-points is not necessarily an easy task;
fortunately, there is a ready-made method available for LCA practitioners. For example,
ReCiPe uses a baseline method for characterization as described in the Handbook on
LCA by Guinée et al. (2002). This method is also known as CML-IA and it focuses on 18
mid-points and integrates them with damage indicators, or end-points, provided by Eco-
indicator 99 (Heijungs, Goedkoop, Huijbregts, De Schryver, & Struijs, 2013). Although
ReCiPe is widely adopted by LCA practitioners, it is a European method and it is
possible that some considerations may fail to represent the reality of specific regions such
as North America.
In order to develop a method that better represents the North American region,
“U.S. EPA decided to begin development of software to conduct impact assessment with
the best applicable methodologies within each category,” resulting in the TRACI method
(Bare et al., 2002). In this study, TRACI methods were used to determine the mid-points.
This life cycle impact assessment was calculated for both conventional and distributed
manufacturing scenarios using the software SimaPro and the Ecoinvent-3 database.
TRACI was more suitable for the present study, considering that distributed
manufacturing system was within the U.S.

43
Interpretation and Presentation of Results
For each mid-point, the contribution of unit processes was assessed to determine
the relative influence of each unit process in overall mid-points results. Then, each mid-
point from conventional and distributed manufacturing was evaluated and compared, and
finally, they were compared among themselves to assess the overall environmental
impact of conventional and distributed manufacturing.
Research Limitations
A few research limitation aspects potentially prevent this study from obtaining the
most accurate and highest quality findings during LCA. These limitations are all related
to the quality of estimation of the 3D printing process LCA inventory. It seems to be
more critical to estimate the environmental impact of 3D printing due to the absence of
information in the Ecoinvent-3 database and to its novelty aspect, which may interfere in
life cycle inventory assumptions. The printer model definition, 3D printing energy
consumption measurements and the failure rate of 3D spare plastic parts represent the
potential limitations of this research.
The printer model definition was limited by the data and printer available for the
study. First, only one 3D printing market study was available with which to determine
which printer model was more popular among home users. The existence of a variety of
market studies could reveal nuances among printer models and user preferences that
might affect this study’s 3D printer definition. In addition, although this study selected
the most popular printers according to the 3D Hubs report, it was also limited by the lack
of opportunity to fabricate a spare plastic part using any other 3D printer model. On the

44
other hand, printer selection should not be that critical among printers utilizing the same
technology. All FDM printers need to heat ABS material to the same temperature to
extrude it through a printer nozzle and deposit it into layers to make a plastic part. The
highest amount of energy is spent in the heating process; for this reason, it is expected
that all 3D printers that use FDM technology may have roughly similar energy
consumption performances.
Energy measurements were also potentially limited by the equipment used. For
instance, the energy consumption of 3D printing was measured because there was no
information about 3D printing processes in the Ecoinvent-3 database. The energy
measurements determined the environmental impact of the 3D printing process. The use
of a watt-meter was the only feasible choice to measure energy in kWh while a 3D printer
object was being fabricated; however, the calibration and resolution of equipment may
offer a lack of accuracy, which would affect LCA results. Nevertheless, while energy
measurements could be influenced by watt-meter equipment, when comparing watt-meter
results with expected values (i.e., 3D printer specifications) it could be assumed that
values were not significantly different. This assured confidence on measured values.
Lastly, plastic parts fabricated by 3D printers were expected to fail in greater
proportions than parts manufactured by injection molding, but there is no reliable
estimation about the differences in expected failure rate. No different failure rate could be
associated to 3D printing in this study, which makes it biased toward reducing the
environmental impact of 3D printing when compared to injection molding. Despite the
nature of the limitations presented, their impact was potentially minimized considering
the conservative bias of the LCA estimations. In this study, it was assumed that 3D

45
printed and injection molded parts fail with the same rate. This is an evident advantage of
the 3D printing process and distributed manufacturing. On the other hand, if conventional
manufacturing proves to be a more environmentally friendly system, the bias toward
distributed manufacturing will serve only to reinforce that LCA results were indeed
favorable to conventional manufacturing.
46
Chapter III
Results
The results are presented in three distinctive sections: data collection, life cycle
assessment, and 3D printing environmental impact—conventional and distributed
manufacturing systems were compared in this final section.
The data collection section presents results from the research and experiments that
were developed in order to determine the spare plastic part to be used in the study, the
energy consumption of desktop 3D printing, and packaging density differences between
shipping raw material and products not captured in the Ecoinvent-3 database.
The life cycle assessment section presents the results of the life cycle inventory
for both the conventional and distributed manufacturing systems; in particular, it shows
the life cycle inventory results obtained from the SimaPro software using the Ecoinvent-3
database, as well as data from the previous section. Moreover, characterization results are
presented using TRACI mid-points in a numerical and graphical fashion.
Finally, in the 3D printing environmental impact section, the results from both
conventional and distributed manufacturing are directly compared, with the objective of
determining which TRACI mid-point categories have more influence on the
environmental impact of 3D printing.

47
Data Collection
Spare Part Selection
The Thingiverse website has thousands of 3D printing designs produced by its
users, including a specific section categorized as Household Replacement Parts, which
was used to select the spare plastic part for this study. A systematic sampling procedure
was applied, where the first 10 parts uploaded for each month, from January to May
2015, were selected for this study. After parts were gathered, an evaluation was
conducted and only parts that represented a solution to replace a user’s broken part were
selected. The result was that 30 out of 50 parts were selected. On Thingiverse, users can
vote about whether they like the part uploaded by other users. There is a “like” button
that users can click if they like a specific uploaded 3D print design. This is a feature
similar to the “like” button on YouTube or Facebook. The selected parts were ranked
according to the number of “like” votes. Each 3D part uploaded by users is different.
Because the aim was to find a part category that represented the spare plastic part
environment, it was not necessary to choose one specific part, but instead one that could
represent a category of larger application. For this reason, the individual results were
aggregated into categories and then ranked by “like” voting counting (Figure 8).

48
Figure 8. Number of “likes” per part category.
The pin loom was the most individually liked popular part among Thingiverse
users; however, different types of knobs, aggregated into a single score, represented 20%
of the total voting. Once they were aggregated into one single category, knobs became
the spare plastic part category most liked among Thingiverse users, as well as the type of
product with the most designs available in the repository. Knobs also had the highest
incidence among other parts: while most of the parts were unique in their category, there
were seven different knob parts designed by users with the intent of fixing broken parts.
A knob design uploaded from Thingiverse (Figure 9a) commonly used in washing
machines (Figure 9b) was selected to perform the experiment.

49
Figure 9. Washing machine knob design and its application. (a) Knob design in 3D
model. (b) Two knobs installed in a washing machine; the left is an original knob; the
right is fabricated by a desktop 3D printer. Both figures were adapted from (Thingiverse,
2015).
3D Printing Energy Consumption
The following observations were made as a result of the experiments conducted in
this study using a desktop 3D printer, with the objective of determining the energy
consumption of a 3D printer. It should be noted that external temperature was controlled
due to the air conditioning system in the laboratory, but it was not measured during the
experiment. In addition, the energy required to pre-heat the 3D printer base plate, where
the objects were made, was not measured in order to reduce the variability of the
experiment.. Two washing machine plastic knobs were fabricated by the desktop 3D
printer Ultimaker 2 using a layer resolution of 0.1 mm and printer speed of 50 mm/s. One
knob was fabricated with a filling percentage of 100%, and the other with 25%. At the
end of the experiment, cumulative energy consumption was measured and parts were
weighed. The results show that printing time, energy consumption, and part weight are
higher for the filling percentage of 100%. Waste weight does not seem to be significantly
different between 100% and 25% (Table 5).

50
Table 5. Energy consumption to fabricate an ABS part.
Plastic filling
(%)
Printing time
(min)
Energy
(kWh)
Part weight
(g)
Waste weight
(g)
100 140 0.44 13.3 0.6
25 74 0.24 6.0 0.5
The washer knob was fabricated by Ultimaker 2 desktop 3D printer using ABS filament
with a diameter of 2.85 mm, and following printing parameters: layer height 0.1 mm and
printer speed 50 mm/s.
During the experiment, energy consumption was measured every two minutes to
observe the consumption behavior differences between the different filling percentages.
Despite differences in filling percentage, the energy consumption rate was similar,
indicating that filling percentage does not affect the amount of energy consumed per unit
of time. However, the printing time was significantly shorter for the 25% filling, which
consequently reduced the total energy consumption (Figure 10).

51
Figure 10. Energy consumption of the 3D printing process of a washing machine plastic
knob using the Ultimaker 2 desktop 3D printer.
Packaging Factors
For transportation life cycle inventory calculations, the Ecoinvent-3 database
considers the transport of one unit of mass per unit of distance to represent its functional
unit. The common functional unit used by Ecoinvent-3 is tons per kilometer (tkm);
however, the database does not take into account packaging density variations. Assuming
that the ABS pellet package has a density of 1.05 g/cm³ and the ABS filament package
has a density of 0.4325g/cm³, approximately 2.4 more trucks or ships are necessary to
transport the same amount of ABS material from filament suppliers to 3D printer users
than are required to move plastic raw material from suppliers to injection molding
manufacturers. In order to properly assess the life cycle impact of the injection molding
process, one original plastic knob was ordered from the spare part retailer. It arrived by
regular mail, inside a paper envelope of 16 x 24 cm, delivered by the United States Postal
Service directly to the researcher’s home. The original plastic knob weight was 8.6 g and
52
the total package weighed 27.2 g. Considering the total weight of 8.6 g of an original
plastic knob part, the estimated packaging volume of 50.625 cm³ (4.5 x 4.5 x 2.5 cm)
density is 0.1699 g/cm³. Therefore, approximately 6.2 more trucks or ships are needed to
transport the knobs from the manufacturer to end users than are required to transport raw
material from suppliers to injection molding manufacturers.
Life Cycle Assessment
The LCA compares original plastic knobs manufactured by conventional
manufacturing to plastic knobs fabricated by 3D printers in a distributed manufacturing
system. Original knobs are different in weight and inner filling when compared to 3D
printed knobs. While original knobs are solid ABS parts designed with empty spaces in
their interior to reduce weight and accommodate molding processes, 3D printed knobs
are solid blocks that can be totally or partially filled with plastic. This LCA compares the
original knobs with 3D printed knobs with 100% plastic filling.
Conventional Manufacturing
The TRACI mid-point results for the conventional manufacturing system were
expressed in 10 different categories. The results show that the overseas transport process
has a higher environmental impact than all other unit processes (Figure 11). Analyzing
the global warming mid-point, 2.078 kg CO2e is generated to produce 0.618 kg of ABS
plastic parts. While the injection molding process is responsible for 44% of kg CO2e, the
overseas transport has an impact of 55% CO2e. In fact, if product transportation could be

53
avoided entirely, almost half of the environmental impact of global warming could be
reduced. Appendix 1 presents the complete results.
Figure 11. TRACI mid-points from conventional manufacturing.
Distributed Manufacturing
The distributed manufacturing system TRACI mid-points were also expressed in
10 different categories. The 3D printing process is the unit process that has a major
environmental impact in all categories. The environmental impact is significant and
represents no less than 70% in all categories (Figure 12).

54
Figure 12. TRACI mid-points from distributed manufacturing.
Unlike conventional manufacturing, overseas transportation has no significant
impact on the distributed manufacturing system, while the major contribution comes from
the 3D printing process due to its energy consumption. For example, the global warming
mid-point has 23.017 kg CO2e—which is 10 times higher than conventional
manufacturing—and the major impact, 90% of kg CO2e, comes from the 3D printing
process. Appendix 2 lists the complete results.

55
3D Printing Environmental Impact
All environmental impact mid-points from distributed manufacturing are
significantly higher than those of conventional manufacturing (Figure 13). Although the
differences are not equal for all mid-points, these comparative results show that
conventional manufacturing has a lower environmental impact than distributed
manufacturing for every TRACI mid-point.
Figure 13. Conventional and distributed manufacturing mid-points comparison.
Global warming is one of the mid-points of main interest in this study because the
expectation was that, by avoiding product transportation, distributed manufacturing could

56
deliver a lower environmental impact due to greenhouse gas reductions. For this reason,
this study compared the unit process impact on the global warming mid-points of both
conventional and distributed manufacturing. The results show that the environmental
impact caused by 3D printing energy consumption is several times higher than the
environmental benefits achieved from avoiding product transportation. Moreover, the
filament process required to produce the secondary raw material for 3D printing has more
impact on the global warming mid-point than injection molding does (Figure 14).
Figure 14. Conventional and distributed manufacturing global warming mid-point.

57
Chapter IV
Discussion and Conclusions
The findings from this study suggest that the environmental impact of ABS-made
spare plastic parts fabricated at home by a desktop 3D printer is higher than that of
similar ABS parts made by conventional manufacturing. The environmental impact
comparison using the Ecoinvent-3 database and TRACI mid-points has demonstrated that
all environmental impact mid-points of distributed manufacturing are significantly higher
than those of conventional manufacturing.
In conventional manufacturing, overseas transport has a major environmental
impact; therefore, the idea that the environmental impact of conventional manufacturing
could be reduced by avoiding overseas transportation is plausible. When 3D printing
offered a possibility to home users to print their own products, this stimulated 3D printing
enthusiasts, authors, and researchers to believe that 3D printing could also be a
sustainable technology capable of reducing the environmental impact of manufactured
products (Gibson, Rosen & Stucker, 2009; Lipson & Kurman, 2013; Despeisse & Ford,
2015). Unexpectedly, the environmental impact caused by energy consumption used by
fabricating plastic parts with desktop 3D printing is significantly higher than any benefit
obtained from removing the need to transport products overseas in the conventional
manufacturing model. Because 3D printing consumes a significant amount of energy, the
idea that fabricating products at home can be beneficial for the environment is not based
on facts, and is in fact contradicted by these empirical results and anlyses.

58
The environmental impact of fabricating a part at home is highly influenced by
the energy consumption required for a desktop 3D printer to fabricate a plastic part. In
this study, the energy required to fabricate a washing machine knob made of ABS
material was 0.44 kWh, which yields 31.6547 kWh per kg of ABS using a desktop 3D
printer. Simply compared to conventional manufacturing, to produce 1 kg of plastic,
injection molding requires 2.8758 kWh according to the Ecoinvent-3 database, which is
11 times less energy than what is required by a 3D printer (Hischier, 2007). Because
injection molding can produce the same quantity of parts with 0.618 kg of ABS as the 3D
printing process produces with 1 kg of ABS, the environmental impact of 3D printing
compared to injection molding is 22 times higher. While the injection molding global
warming mid-point impact is 0.92 kg CO2e, the 3D printing process alone has an
environmental impact of 20.8 kg CO2e. The environmental impact of distributed
manufacturing is even higher because the plastic filament process is not considered here.
Removing material from a spare plastic part may save energy, but it makes the
part weaker and increases the probability of a part needing to be replaced more times than
if an injection molded part was used. The capability of 3D printing to produce hollow
parts, and thereby consume less material, has been an argument in favor of 3D printing.
Supposedly, consuming less material than conventional manufacturing can offer a
sustainable advantage to 3D printing. In fact, by producing a knob with 25% plastic
filling, energy consumption and weight are reduced, as is the environmental impact, but
conventional manufacturing still has a lower environmental impact. Moreover, Ahn et al.
(2012) have demonstrated that the compressive and tensile strengths of FDM 3D plastic
parts are lower than those of injection molded parts. In addition, fatigue test comparisons

59
demonstrated that 3D plastic parts, considering a fixed stress, fail after fewer cycles than
injection molded parts do (McKeen, 2009; Lee Huang, 2013; Ziemian et al., 2015).
Consequently, if parts were fabricated with less material, they would be even weaker and
would still have an environmental impact considerably higher than parts made with
conventional manufacturing. Taking into account that the scope of this study was to
assess spare plastic parts, the durability of a part is a key element of a functional unit.
Thus, the weaker the 3D part is, the more additional parts need to be considered in the
functional unit, offsetting the benefit of reducing energy consumption.
While previous research suggests the potential of lowering the environmental
impact by using desktop 3D printing and distributed manufacturing, the present work
shows that distributed manufacturing does not have a lower environmental impact if
realistic assumptions are made. Using different assumptions, Kreiger and Pearce (2013)
compare conventional and distributed manufacturing using different materials and relying
on the ability of 3D printing to produce hollow parts as an environmental advantage.
Conversely, the present study considered that 3D parts are naturally weaker than injection
molded parts; therefore, comparing hollow parts with injection molding parts is not a
viable assumption since they become more fragile and their reduced lifetime should be
considered in LCA. In addition, conventional plastic parts do not necessarily weigh the
equivalent of a 100% 3D printed part as Kreiger and Pearce assume in their study.
Conversely, in this study the original injection molded part weighed significantly less
than the 100% filled 3D printed part; failing to consider this in an LCA clearly biases
results toward a lower environmental impact of distributed manufacturing. In summary,
when parts from the same material and weight are compared, even in Kreiger and
60
Pearce’s study, conventional manufacturing has a lower environmental impact than
distributed manufacturing does.
This study has also shown that technology and the supply chain understanding are
important factors in determining whether desktop 3D printing is beneficial for the
environment, but relying on partial information may cause misleading conclusions. The
results of this study demonstrate that products fabricated by desktop 3D printers are not
more environmentally friendly than those made by injection molding when similar
products are offered by conventional manufacturing. Worse still, if a home user fabricates
a part that is not currently being manufactured by conventional manufacturing, naturally,
the fabrication of a totally new product will have a higher environmental impact than not
manufacturing any part will. An exception can be made if the energy used by 3D printing
is far cleaner than energy use in conventional manufacturing, or if 3D printing technology
evolves to consume less energy. In summary, desktop 3D printing technology may evolve
and become more sustainable than conventional manufacturing, but, certainly considering
today’s technology and environmental impact of energy production, conventional
manufacturing is more sustainable than fabricating products at home using desktop 3D
printers.
However, the fact that desktop 3D printers are not more environmentally friendly
than conventional manufacturing should not stop the exploration of other benefits of 3D
printing. The benefits of experimentation, learning, and collaboration offered by 3D
printing are limitless and those benefits may outweigh the environmental impact caused
in a broader perspective. For instance, building 3D printed limb prostheses for users who
do not have the means to afford costly regular prostheses could offer users more comfort
61
and enhance their ability to deal with the adversities of daily activities. In fact, everything
that is produced that is not expected to be a substitute for something that is already
produced has an environmental impact; however, enhancing people’s abilities and
helping them to be included in society may have economical and social benefits that can
outweigh the environmental impact caused by the consumption of ABS and energy.
In addition, preventing people from using desktop 3D printers because they
consume too much energy is like preventing students from using paper and pencils
because they are made of wood. Desktop 3D printers are enabling a whole community of
makers in a way that resembles the genesis of personal computing technology, which is a
significant accomplishment by itself, but fabricating plastic parts at home does not seem
to be more sustainable than buying products from retailers when the environmental
impact of producing electricity is considered. Paper manufacturing has possibly evolved
from extracting wood from natural resources to produce paper from forests that have
been planted and dedicated to paper production. Similarly, energy production may evolve
to a model with less environmental impact that is less dependent on fossil fuels; then, the
environmental impact of the energy consumed by desktop 3D printers will be reduced
and desktop 3D printing may become environmentally friendly in certain cases. The
benefits of desktop 3D printing are undeniable in terms of developing prototypes,
designing learning tools, and fabricating prostheses; therefore, further research
investigating the ways in which to reduce the environmental impact of desktop 3D
printing should be conducted.
Further research could evaluate different desktop 3D printer models and printing
settings to investigate how energy consumption could be improved. The present work did

62
not substantially explore the effect of different printing settings on energy consumption.
The investigation was limited to few key printing parameters whose combination would
provide a useful perspective regarding their influence on energy consumption and part
design. Further research may also consider improving the understanding of printing
parameters by conducting experiments to discover whether there is an optimal
configuration that minimizes energy requirements and, consequently, reduces
environmental impact. Finally, a combined analysis of mechanical tests and failure rate
could improve the understanding of the relevance of the chosen printing parameters—and
especially the plastic filling percentage—regarding the mechanical resistance of 3D parts
and their relation to the parts’ lifetime.

63
Appendix 1
TRACI Mid-Points per Unit Process from Conventional Manufacturing
Impact category Unit Total
Raw
Material
Transport
Injection
Molding
Overseas
Transport
Ozone depletion kg CFC-11 eq 3.5E-07 2.1E-09 1.0E-07 2.5E-07
Global warming kg CO2 eq 2.1E+00 8.4E-03 9.2E-01 1.2E+00
Smog kg O3 eq 4.0E-01 1.4E-03 5.3E-02 3.4E-01
Acidification kg SO2 eq 2.9E-02 5.2E-05 6.0E-03 2.3E-02
Eutrophication kg N eq 1.5E-03 5.9E-06 4.7E-04 1.0E-03
Carcinogenics CTUh 1.2E-08 6.6E-11 5.4E-09 6.1E-09
Non carcinogenics CTUh 9.2E-08 1.5E-09 3.9E-08 5.2E-08
Respiratory effects kg PM2.5 eq 2.5E-03 6.3E-06 9.1E-04 1.6E-03
Ecotoxicity CTUe 8.5E-01 2.6E-02 2.9E-01 5.4E-01
Fossil fuel depletion MJ surplus 3.4E+00 1.8E-02 1.2E+00 2.2E+00

64
Appendix 2
TRACI Mid-Points per Unit Process from Distributed Manufacturing
Impact category Unit Total
Raw
Material
Transport
Filament
Process
Overseas
Transport
3D
Printing
Process
Ozone depletion kg CFC-11
eq 2.7E-06 3.3E-09 7.3E-08 1.6E-07 2.4E-06
Global warming kg CO2 eq 2.3E+01 1.4E-02 1.5E+00 7.2E-01 2.1E+01
Smog kg O3 eq 1.3E+00 2.2E-03 7.6E-02 2.2E-01 9.8E-01
Acidification kg SO2 eq 1.1E-01 8.5E-05 7.6E-03 1.4E-02 8.9E-02
Eutrophication kg N eq 1.2E-02 9.5E-06 4.7E-04 6.5E-04 1.1E-02
Carcinogenics CTUh 1.6E-07 1.1E-10 1.0E-08 3.8E-09 1.5E-07
Non
carcinogenics CTUh 8.0E-07 2.4E-09 4.7E-08 3.2E-08 7.2E-07
Respiratory
effects kg PM2.5 eq 7.2E-03 1.0E-05 9.9E-04 9.7E-04 5.2E-03
Ecotoxicity CTUe 8.1E+00 4.3E-02 5.2E-01 3.4E-01 7.2E+00
Fossil fuel
depletion MJ surplus 2.9E+01 3.0E-02 3.1E+00 1.4E+00 2.5E+01

65
References
3D Hubs. (2015, September). 3D Printing Trends September 2015. Retrieved September
29, 2015, from https://www.3dhubs.com/trends
Ahn, S., Montero, M., Odell, D., Roundy, S., & Wright, P. K. (2002). Anisotropic
material properties of fused deposition modeling ABS. Rapid Prototyping
Journal, 8(4), 248–257. http://doi.org/10.1108/13552540210441166
Anderson, C. (2012). Makers: The New Industrial Revolution. Crown Business.
ASTM International. (2012). Standard terminology for additive manufacturing
technologies: Designation F2792 - 12a. West Conshohocken, PA: ASTM
International.
Atzeni, E., Iuliano, L., Minetola, P., & Salmi, A. (2010). Redesign and cost estimation of
rapid manufactured plastic parts. Rapid Prototyping Journal, 16(5), 308–317.
Bare, J. C., Norris, G. A., Pennington, D. W., & McKone, T. (2002). Traci. Journal of
Industrial Ecology, 6(3-4), 49–78. http://doi.org/10.1162/108819802766269539
Bauman, H., & Tillman, A.M. (2004). The Hitch Hiker’s Guide to LCA. Lund:
Studentlitteratur AB.
Bechthold, L., Fische, V., Hainzlmaier, A., Hugenroth, D., Ivanova, L., Kroth, K.,
Römer, B., Sikorska, E., Sitzmann, V. (2015). 3D Printing: A Qualitative
Assessment of Applications, Recent Trends and the Technology’s Future Potential
(No. 17-2015). Center for Digital Technology and Management (CDTM).
Retrieved from http://www.e-
fi.de/fileadmin/Innovationsstudien_2015/StuDIS_17_2015.pdf
Brooks, G., Kinsley, K., & Owens, T. (2014). 3D Printing As A Consumer Technology
Business Model. International Journal of Management & Information Systems
(IJMIS), 18(4), 271–280.
Cura [Computer software]. (2015). Retrieved from
https://ultimaker.com/en/products/cura-software
Chen, D., Heyer, S., Ibbotson, S., Salonitis, K., Steingrímsson, J. G., & Thiede, S. (2015).
Direct digital manufacturing: definition, evolution, and sustainability
implications. Journal of Cleaner Production, 107, 615–625.
http://doi.org/10.1016/j.jclepro.2015.05.009

66
Clay, K. (2013, June 19). 3D Printing Company MakerBot Acquired In $604 Million
Deal. Retrieved December 31, 2015, from
http://www.forbes.com/sites/kellyclay/2013/06/19/3d-printing-company-
makerbot-acquired-in-604-million-deal/
Crump, S. S. (1992). U.S. Patent No. 5,121,329. Washington, D.C: U.S. Patent and
Trademark Office.
D’Aveni, R. A. (2013). 3-D Printing Will Change the World. Harvard Business Review,
91(3), 34–34.
Deckard, C. R. (1989). U.S. Patent No. 4,863,538. Washington, D.C: U.S. Patent and
Trademark Office.
Despeisse, M., & Ford, S. (2015). The Role of Additive Manufacturing in Improving
Resource Efficiency and Sustainability. In S. Umeda, M. Nakano, H. Mizuyama,
H. Hibino, D. Kiritsis, & G. von Cieminski (Eds.), Advances in Production
Management Systems: Innovative Production Management Towards Sustainable
Growth (pp. 129–136). Springer International Publishing.
Dongguan Changhong Bobbin Co., Ltd. (2015). ABS /1.75MM 3.0MM empty plastic
spool for 3D printer filament. Retrieved November 15, 2015, from
http://dgchxp.en.alibaba.com/product/60135941190-
221463765/ABS_1_75MM_3_0MM_empty_plastic_spool_for_3D_printer_filam
ent.html
Faludi, J., Bayley, C., Bhogal, S., & Iribarne, M. (2015). Comparing environmental
impacts of additive manufacturing vs traditional machining via life-cycle
assessment. Rapid Prototyping Journal, 21(1), 14–33. http://doi.org/10.1108/RPJ-
07-2013-0067
Feygin, M. (1988). U.S. Patent No. 4,752,352. Washington, D.C: U.S. Patent and
Trademark Office.
Frauenfelder, M. (2013). Make: Ultimate Guide to 3D Printing 2014. Maker Media, Inc.
Retrieved from http://proquest.safaribooksonline.com.ezp-
prod1.hul.harvard.edu/book/hardware/3d-printing/9781457183669
Gebler, M., Schoot-Uiterkamp, A. J. M., & Visser, C. (2014). A global sustainability
perspective on 3D printing technologies. Energy Policy, 74, 158–167.
http://doi.org/10.1016/j.enpol.2014.08.033
Gershenfeld, N. (2012). How to Make Almost Anything: The Digital Fabrication
Revolution. Foreign Affairs, 91(6), 43–57.
Gibson, I., Rosen, D. W., & Stucker, B. (2009). Additive Manufacturing Technologies:
Rapid Prototyping to Direct Digital Manufacturing (2010 edition). London ; New
York: Springer.

67
Heijungs, R., Goedkoop, M., Huijbregts, M., De Schryver, A., & Struijs, J. (2013).
ReCiPe 2008: A life cycle impact assessment method which comprises harmonised
category indicators at the midpoint and the endpoint level. Ministry of Housing,
Spatial Planning and Environment. Retrieved from http://www.pre-
sustainability.com/download/ReCiPe_main_report_MAY_2013.pdf
Hischier, R. (2007). Life Cycle Inventories of Packaging and Graphical Papers.
(ecoinvent-Report No. 11). Dübendorf: Swiss Centre for Life Cycle Inventories.
Hopkinson, N., & Dickens, P. M. (2003). Analysis of rapid manufacturing-using layer
manufacturing processes for production. Journal of Mechanical Engineering
Science, 217(C1), 31–39.
Horn, T. J., & Harrysson, O. L. A. (2012). Overview of current additive manufacturing
technologies and selected applications. Science Progress, 95(3), 255–282.
Hull, C. W. (1986). U.S. Patent No. 4,575,330. Washington, D.C: U.S. Patent and
Trademark Office.
International Organization for Standardization (1997). 14040: 1997. Environmental
management-Life cycle assessment-Principles and framework. European
Committee for Standardization.
Kreiger, M., & Pearce, J. M. (2013). Environmental Life Cycle Analysis of Distributed
Three-Dimensional Printing and Conventional Manufacturing of Polymer
Products. ACS Sustainable Chemistry & Engineering, 1(12), 1511–1519.
Lee, J., & Huang, A. (2013). Fatigue analysis of FDM materials. Rapid Prototyping
Journal, 19(4), 291–299. http://doi.org/http://dx.doi.org.ezp-
prod1.hul.harvard.edu/10.1108/13552541311323290
Lipson, H., & Kurman, M. (2013). Fabricated: The New World of 3D Printing. John
Wiley & Sons.
Makerbot. (2015). Makerbot website. Retrieved October 4, 2015, from
http://store.makerbot.com/replicator2x.html.
Mani, M., Lyons, K. W., & Gupta, S. K. (2014). Sustainability Characterization for
Additive Manufacturing. Journal of Research of the National Institute of
Standards and Technology, 119, 419. http://doi.org/10.6028/jres.119.016
Manyika, J., Chui, M., Bughin, J., Dobbs, R., Bisson, P., & Marrs, A. (2013). Disruptive
technologies: Advances that will transform life, business, and the global economy.
McKinsey Global Institute.
McKeen, L. W. (2009). Fatigue and Tribological Properties of Plastics and Elastomers,
2nd Edition. Butterworth-Heinemann.

68
Ports.com. (2016). Sea route & distance. Retrieved from http://ports.com/sea-
route/#/?a=14803&b=682&c=Port%20of%20Shenzhen,%20China&d=Port%20of
%20Boston,%20United%20States
RepRap. (2015). Prusa i3 – RepRap Wiki. Retrieved October 4, 2015, from
http://reprap.org/wiki/Prusa_i3
Sachs, E. M., Haggerty, J. S., Cima, M. J., & Williams, P. A. (1993). U.S. Patent No.
5,204,055. Washington, D.C: U.S. Patent and Trademark Office
Swift, K. G., & Booker, J. D. (2013). Manufacturing Process Selection Handbook.
Butterworth-Heinemann.
Thingiverse. (2015). Thingiverse website. Retrieved March 31, 2016, from
http://www.thingiverse.com/thing:664098.
Torwell Macromolecule Material Limited. (2015). 3mm ABS 3D printing filament 31
colors,1kg, 0.3kg, 0.5kg, 2kg available for 3D printer. Retrieved November 15,
2015, from http://torwell3d.en.alibaba.com/product/60111540905-
221460437/3mm_ABS_3D_printing_filament_31_colors_1kg_0_3kg_0_5kg_2kg
_available_for_3D_printer.html
Ultimaker. (2015). Ultimaker 2 Specifications. Retrieved November 22, 2015, from
https://ultimaker.com/en/products/ultimaker-2
Walls, S., Corney, J., & Vasantha, G. (2014). Relative Energy Consumption of Low-Cost
3D Printers. In Proceedings of the 12th International Conference on
Manufacturing Research (ICMR201 4 (pp. 97–102). Southampton: Hampshire
Press Ltd. Retrieved from http://www.solent.ac.uk/conference-centre/events/icmr-
2014/conference-registration.aspx
Wittbrodt, B., Glover, A. G., Laureto, J., Anzalone, G., Oppliger, D., Irwin, J., & Pearce,
J. (2013). Life-cycle economic analysis of distributed manufacturing with open-
source 3-D printers. Mechatronics; Mechatronics, 23(6), 713-726.
doi:10.1016/j.mechatronics.2013.06.002
Ziemian, S., Okwara, M., & Ziemian, C. W. (2015). Tensile and fatigue behavior of
layered acrylonitrile butadiene styrene. Rapid Prototyping Journal, 21(3), 270–278.
http://doi.org/10.1108/RPJ-09-2013-0086


![The 3D printing ‘revolution’ · 3D printing ‘Bigger than internet’ FT 21.6.12 3D printing: ‘The PC all over again?’ Economist 1.12.12 ‘3D printing [..] has the potential](https://img.dokumen.tips/doc/110x75/5f08eac77e708231d42459a8/the-3d-printing-arevolutiona-3d-printing-abigger-than-interneta-ft-21612.jpg)