Embed Size (px)
Citation preview

The Entry of Colombian Heroin into the US Market:
The Relationship between Competition, Price, and
Purity
Daniel Rosenblum∗, Jay Unick†, Daniel Ciccarone‡
April 8, 2013
Abstract
There have been large structural changes in the US heroin market over the past 20
years. Colombian heroin entered the market in the mid-1990s, followed by a large fall in
the price per pure gram and the exit of Asian heroin. By the 2000s, Colombian heroin had
become a monopoly on the east coast and Mexican heroin a monopoly on the west coast
with competition between the two in the middle. We estimate the relationship between
these changes in competitive market structure on retail-level heroin price and purity. We
find that the entry of Colombian heroin is associated with less competition and a lower
price per pure gram of heroin at the national level. However, there is wide variation in
changes in market concentration across the US. Controlling for the national fall in the
heroin price, more competition in a region or city is associated with a lower price per pure
gram.
Keywords: Heroin Price, Heroin Purity, Competition, US, Illicit Drug MarketsRole of Funding Source: Funding for this study was provided by NIH-NIDA Grant R01DA027599;NIH-NIDA had no further role in study design; in the collection, analysis and interpretation ofdata; or in the writing of the report.
∗Corresponding Author: Department of Economics, Dalhousie University, Halifax, NS B3H4R2, Canada.Phone: (902) 494-8945. Fax: (902) 494-6917. E-mail: [email protected]
†School of Social Work, University of Maryland at Baltimore, 525 West Redwood St, Baltimore, MD 21201,USA. E-mail: [email protected]
‡Department of Family & Community Medicine, University of California, San Francisco, ParnassusHeights, Box 0900 MU-3E, 500 Parnassus Ave, MU3E, San Francisco, CA 94143-0900, USA. E-mail:[email protected]
1

1 Introduction
We examine the effect of the entry of Colombian heroin on the US heroin market. There are four
major supplier regions for the US: Mexico, South America (mostly Colombia), Southeast Asia
(mostly Burma), and Southwest Asia (mostly Afghanistan). There have been large changes
in the availability of heroin from these regions over time. In particular, in the 1990s there
was a dramatic decline in heroin supplied from Asia, while South American heroin increased
substantially. Furthermore, as shown by Ciccarone et al. (2009), the US supply of heroin is
divided geographically with Mexican heroin currently having a monopoly in the west, South
American heroin having a monopoly in the east, and competition in the middle.
The competition we measure is that between rival substitute products rather than rival busi-
nesses. That is, we want to know what happens when Pepsi is introduced at a supermarket
that already offers Coke rather than the rivalry between two competing supermarkets or two
competing distributors of Coke and Pepsi. In our case, we focus on the entry of Colombian
heroin. It is likely that competition between drug dealers and along the supply chain has a role
to play in the effect of the entry of Colombian heroin on the US market. Although this would
be useful to understand, we are only able to observe changes in the place of origin of heroin,
not the dynamics of the many agents in the heroin market.
We seek to understand the effects of the changes in market structure after the entry of
Colombian heroin. In standard economic theory, the more competition there is, the better it
is for consumers. The fact that heroin is supplied illegally and is an addictive good makes
the theoretical analysis more complex. The theoretical work on addictive goods markets has
no general predictions, in that some models predict that increased competition may raise the
price while others predict it will lower the price (Driskill and McCafferty, 2001; Richards et al.,
2007; Showalter, 1999). On the one hand, competitive pressure may bring prices down. On the
other hand, if competition is in the form of violence, then more competition may increase both
suppliers’ costs, raising the market price (there could be a kind of natural monopoly in heroin).
In addition, given that heroin is an addictive good, a monopoly may want to sell below current
2

market price, knowing it can take full advantage of increased demand in the future. Thus,
assuming policy goals are to both reduce heroin use and lower negative externalities from the
heroin market, such as crime and disease, it is by no means obvious whether competition is
preferable to monopoly. We contribute to the literature on addiction and market competition by
providing the first estimates of the relationship between market competition and heroin price
and purity.
2 Overview of the US Heroin Market
Figure 1 shows the proportion of heroin samples from each of the major heroin supplying
regions. In the early 1990s, Asian heroin represented more than half of the market. By the mid-
1990s, South American (i.e. Colombian) heroin went from zero market share to overtaking
Mexico as the dominant supplier of heroin in the US. At the same time, the supply of Asian
heroin fell to almost nothing.
The United Nations Office on Drugs and Crime (UNODC) provides yearly estimates of
opium production by country of origin. Figure 2 shows the estimated potential production for
Southwest Asian and Southeast Asian heroin, while Figure 3 shows the estimated production
for Mexico and Colombia. Given that opium production is illegal, these should be taken as
rough estimates of opium supply. The UNODC generally assumes that 10 units of opium can
be converted into 1 unit of heroin, although the exact amount of opium that is converted into
heroin is unknown.
Southeast Asian opium production has been declining since the mid-1990s, which coincides
with the fall in heroin observations from Southeast Asia in the US market. Laos, Vietnam,
and Thailand all had dramatic declines in opium production, however Burma has consistently
produced an order of magnitude larger amount of opium than these other countries combined.
Although economic development may have led to a reduction in opium production in Laos,
Vietnam, and Thailand, the large-scale decline in Southeast Asian opium was likely due to
several Burmese states banning opium production between 1997 and 2005 (Paoli et al., 2009).
3
The decline in supply from Southeast Asia may be able to explain the dramatic decline
in Southeast Asian heroin in the US. However, there has been a rise in opium production in
Southwest Asia, with the exception of the short-term eradication campaign by the Taliban in
Afghanistan in 2000-2001 (Gibson et al., 2005; Ciccarone, 2005). The fall in the US market
share since the early 1990s may be due to an inability to compete with Colombian heroin,
which likely has significantly lower transportation costs. The drop in Southwest Asian heroin’s
US market share may also be due to Afghanistan filling the void in Europe and Asia left by the
large decline in Southeast Asian heroin. Paoli et al. (2009), Ciccarone (2009), and Ciccarone
(2012) discuss the existence of segmented markets, where heroin is supplied to particular places
by particular suppliers through a limited number of trafficking routes. Once Asian heroin left
the US market and their trafficking routes were reduced, there could be substantial barriers to
re-entry.
The potential opium supply from Mexico remained steady until the 2000s, when it began
to rise. Colombia’s potential opium supply increased rapidly in the mid-1990s, before declin-
ing in the 2000s. Although the rapid increase in opium production in Colombia can explain
Colombian heroin’s take-over of nearly half the US market, the UNODC’s estimate of a sub-
stantial rise in the Mexican opium supply does not explain why the Mexican market share has
remained steady and generally below Colombia’s since the mid-1990s. One possibility is that
the UNODC overestimated Mexican production and underestimated Colombian production in
the 2000s. Another possibility is that the recent Mexican Drug War has limited the amount of
heroin that enters the US from Mexico.
On the supply side, it appears that there has been a general increase in opium production.
The combined estimated opium production in Colombia and Mexico has more than doubled
since the early 1990s. As we will show, there was a substantial decline in the price per pure
gram of heroin over the 1990s. However, consumer demand is an equally important factor
in determining price. Figure 4 shows the proportion of high school seniors that report using
heroin in the past year. Reported heroin use more than doubled in the mid-1990s, and then
slowly declined in the 2000s. Brady et al. (2008) estimate the prevalence of injection drug
4

Figure 1: Change in heroin supplier regions from 1990-2008. Data Source: STRIDE Database.
5
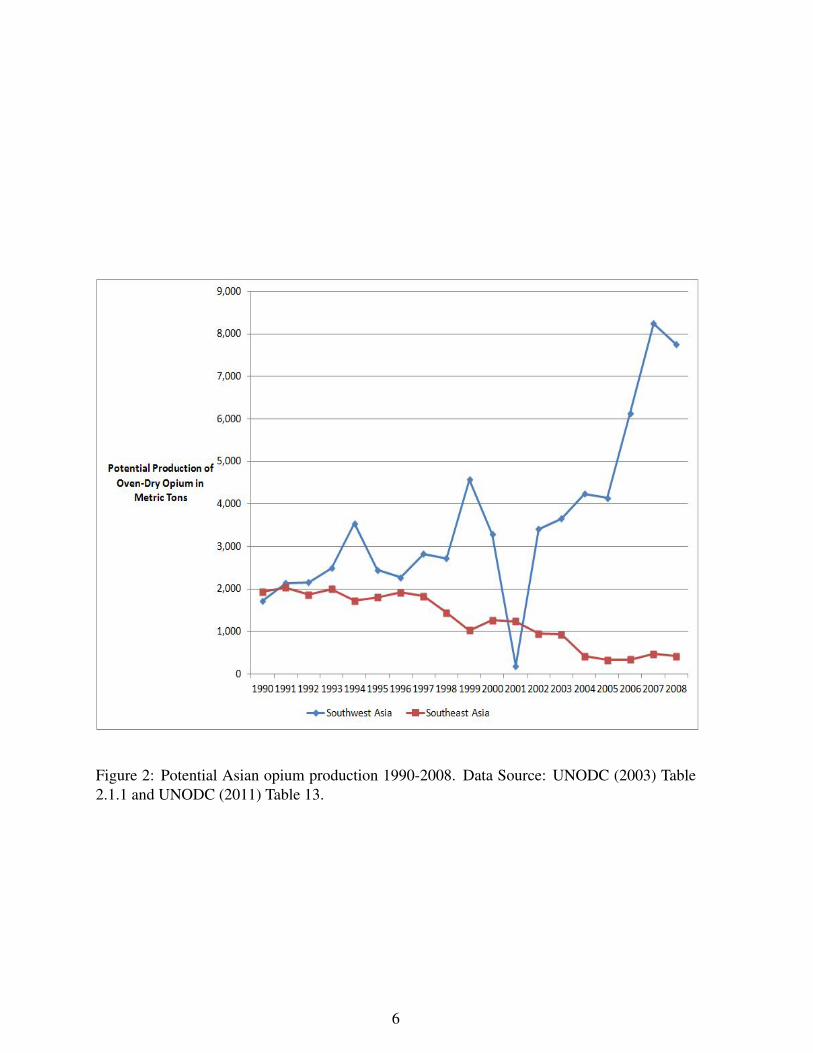
Figure 2: Potential Asian opium production 1990-2008. Data Source: UNODC (2003) Table2.1.1 and UNODC (2011) Table 13.
6
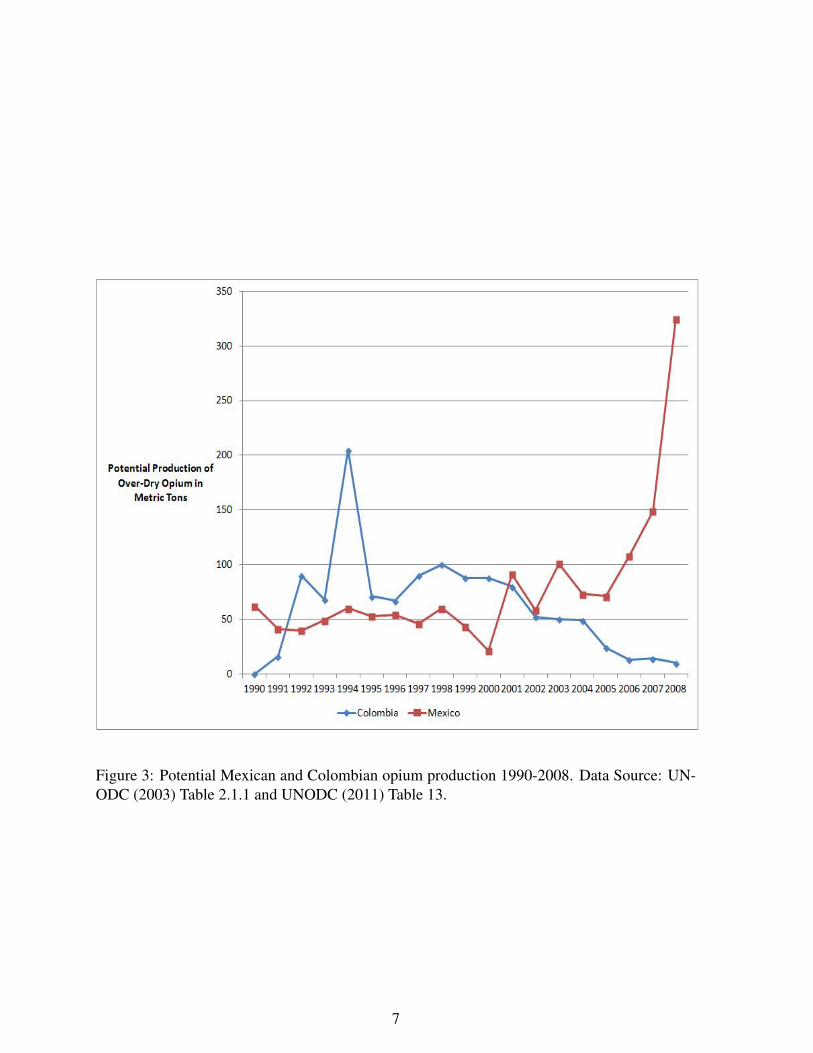
Figure 3: Potential Mexican and Colombian opium production 1990-2008. Data Source: UN-ODC (2003) Table 2.1.1 and UNODC (2011) Table 13.
7
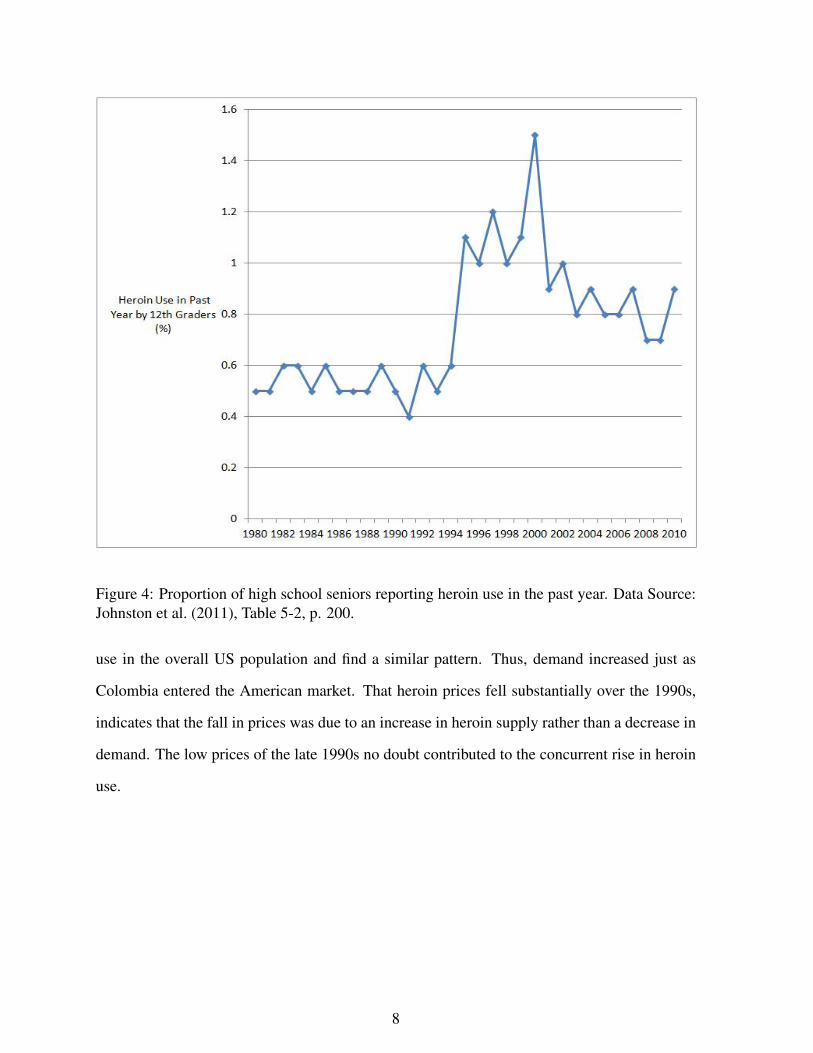
Figure 4: Proportion of high school seniors reporting heroin use in the past year. Data Source:Johnston et al. (2011), Table 5-2, p. 200.
use in the overall US population and find a similar pattern. Thus, demand increased just as
Colombia entered the American market. That heroin prices fell substantially over the 1990s,
indicates that the fall in prices was due to an increase in heroin supply rather than a decrease in
demand. The low prices of the late 1990s no doubt contributed to the concurrent rise in heroin
use.
8

3 Data
Our analysis uses the DEA’s System to Retrieve Information from Drug Evidence (STRIDE)
database.1 STRIDE includes information from drug seizures and arrests. These observations
include the amount and purity, but generally not the price or country of origin. In addition,
there is information from law enforcement purchases of heroin, which include price as well as
amount and purity. STRIDE includes additional information from the DEA’s Domestic Moni-
tor Program (DMP), in which agents purchase illegal drugs and record the price and test those
drugs for purity and country of origin. The DMP data is collected to monitor the retail level
price and purity of heroin. There is no connection between this data and criminal investigations
as in the rest of the STRIDE data. STRIDE also includes data from the Heroin Signature Pro-
gram (HSP), which tests a sample of heroin seized at borders and from arrests for the heroin’s
country of origin. All observations include heroin purity. The 37 percent of observations with a
recorded price are used to estimate the price per expected pure gram. The 32 percent of obser-
vations with a recorded country of origin (from the DMP and HSP) are used to estimate market
competition.
There is disagreement about whether the STRIDE data can be used reliably. Horowitz
(2001) argues that the STRIDE data has limited use because the data does not represent a
random sample. In particular, Horowitz (2001) finds that the drug observations have different
means and time trends within cities depending on the method of acquisition. However, Arkes
et al. (2008) further divides the sample by distribution level (low amounts at the retail level;
high amounts at the wholesale level) and find that trends are consistent within cities in these
subgroups. They argue that although the mean estimate in a given city and time period may not
reflect the market’s actual price, the city-specific time trends in price and purity can reasonably
be estimated with the STRIDE data. In this paper, we follow the general approach outlined in
Arkes et al. (2008) to estimate time trends in heroin price, purity, and expected price per pure
gram of heroin.
1Data is unvalidated DEA data in the sense that the data we use is raw and it is possible that errors remain inthe database. We cleaned the data to reduce errors as much as possible.
9

The raw STRIDE data covers January 1990 through December 2008. There are 100,123
observations. We follow Arkes et al. (2004)’s method to clean the data. We drop observations
if the method of acquisition is not by purchase, seizure, or lab seizure (deleting 136 observa-
tions). We drop observations that are from U.S. territories (Guam, Puerto Rico, etc.) rather
than states (2188 observations). We drop observations where the purity is above 100 percent
(6 observations). We keep observations with zero purity, since our price and purity analysis
depends on the expected purity, rather than the actual purity of heroin.2
Heroin is given a drug code based on the type of heroin. For our main analysis, we use ob-
servations for heroin hydrochloride (9200.005) and heroin base (9200.000), which according
to Arkes et al. (2004) cannot easily be distinguished by the consumer.3 These types of heroin
account for 82 percent of observations. We perform a separate analysis for heroin salt undeter-
mined (9200.9), which accounts for 16 percent of observations and may be physically different
from heroin hydrochloride and base.4 The remaining 2 percent of observations (heroin citrate,
tartrate, and other) are dropped from the analysis. We refer to the combined hydrochloride and
hydrochloride base observations as heroin “HCL/B” and the salt undetermined observations as
heroin “SU” throughout the paper. Additionally, we focus on retail level heroin prices. Thus,
observations are restricted to amounts of 1 gram or less. In addition, due to the possibility of
imprecise purity measures for small amounts of heroin, we remove observations of less than
0.1 gram (22,128 observations).5 We are then left with 26,348 observations for our analysis
(22,091 for heroin HCL/B and 4,257 for heroin SU).
Figures 5 and 6 show kernel density estimates of heroin purity and price respectively.
Heroin HCL/B has a more evenly distributed purity compared to the low level of purity of
2Actual purity is the objective purity value as tested by the DEA. Expected purity is the subjective belief of theheroin consumer as to the purity of purchased heroin based on multiple purchases in the same heroin market. Weassume that expected purity is the average purity of heroin purchased in a given year and location.
3This is likely “white powder” heroin. Heroin hydrochloride and heroin base are used differently by theconsumer, in that base needs an addition of acid to make it soluble. However, they likely have similar effects atsimilar volumes.
4This is possibly “black tar” heroin. The salt undetermined observations are generally not part of the HSP, soone cannot easily determine the place of origin. Most of the observations come from Washington, D.C. and areotherwise spread throughout the US. Since black tar heroin is predominantly found in the western US, this heroinis likely not only black tar heroin.
5All estimates are robust to including observations of less than 0.1 gram.
10

Figure 5: Purity kernal density estimate of heroin HCL/B and heroin SU for amounts between0.1 and 1 gram. Data Source: STRIDE Database.
heroin SU. The price distributions show that heroin HCL/B tends to have a higher price than
heroin SU. Thus, the analysis of heroin SU is of a lower-quality and less expensive heroin.
4 Market Competition
The STRIDE data has information on four regions of origin (Mexico, South America, South-
west Asia, and Southeast Asia). We use the yearly proportion of observations from each origin
region at the national level, US census region level,6 and the MSA level7 as a measure of market
6The 9 census region are: Pacific (AK, CA, HI, WA, OR), Mountain (AZ, CO, ID, MT, NM, NV, UT, WY),West North Central (IA, KS, MN, MO, ND, NE, SD), West South Central (AR, LA, OK, TX), East North Central(IL, IN, MI, OH, WI), East South Central (AL, KY, MS, TN), South Atlantic (DC, DE, FL, GA, MD, NC, VA,WV), Middle Atlantic (NY, NJ, PA), and New England (CT, MA, ME, NH, RI, VT). We omit the East SouthCentral region from our analysis because of the low number of observations for this region.
7The MSAs are: Atlanta, Baltimore, Boston, Chicago, Dallas, Denver, Detroit, Houston, Los Angeles, Miami,New York, Philadelphia, Portland, San Diego, San Francisco, Seattle, St. Louis, and Washington, D.C. We dropMSAs with fewer than 500 observations. However, we combine the remaining observations by census region tocreate seven additional units. (As in the regional analysis we drop the East South Central region. We also combinethe West North Central and East North Central regions to get a sufficient number of observations.)
11

Figure 6: Price per non-pure gram kernal density estimate of heroin HCL/B and heroin SU foramounts between 0.1 and 1 gram and prices between $0 and $1000 per non-pure gram. DataSource: STRIDE Database.
12
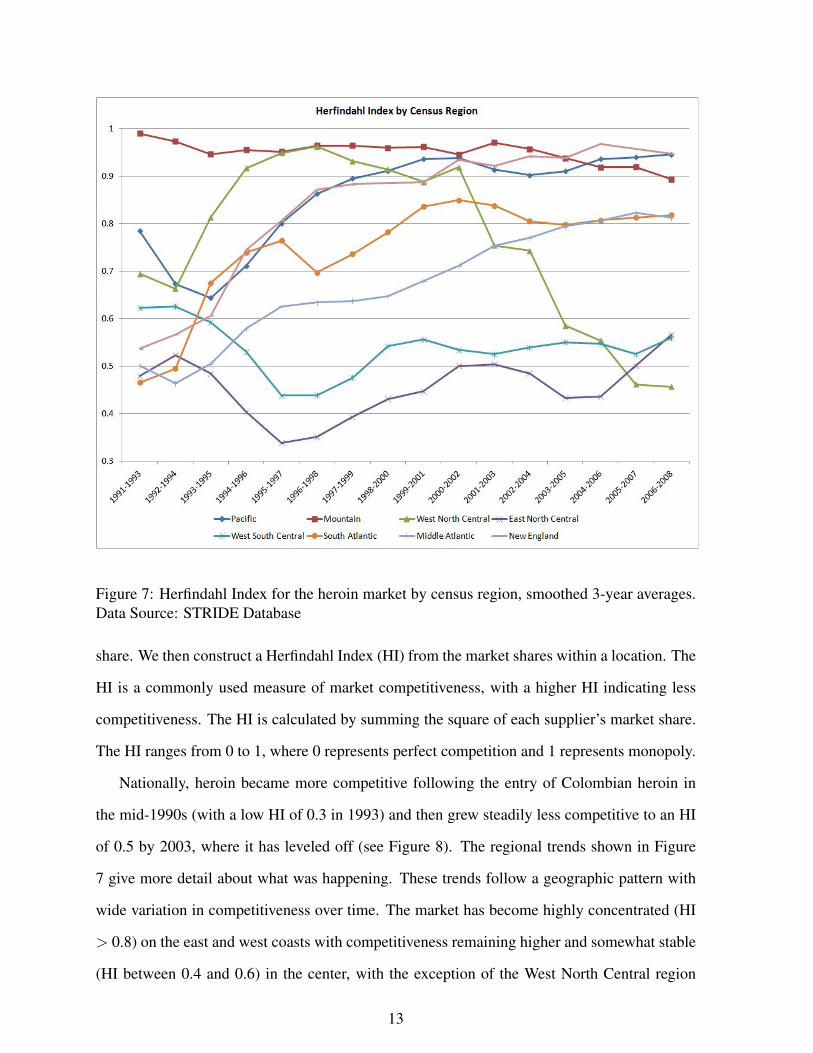
Figure 7: Herfindahl Index for the heroin market by census region, smoothed 3-year averages.Data Source: STRIDE Database
share. We then construct a Herfindahl Index (HI) from the market shares within a location. The
HI is a commonly used measure of market competitiveness, with a higher HI indicating less
competitiveness. The HI is calculated by summing the square of each supplier’s market share.
The HI ranges from 0 to 1, where 0 represents perfect competition and 1 represents monopoly.
Nationally, heroin became more competitive following the entry of Colombian heroin in
the mid-1990s (with a low HI of 0.3 in 1993) and then grew steadily less competitive to an HI
of 0.5 by 2003, where it has leveled off (see Figure 8). The regional trends shown in Figure
7 give more detail about what was happening. These trends follow a geographic pattern with
wide variation in competitiveness over time. The market has become highly concentrated (HI
> 0.8) on the east and west coasts with competitiveness remaining higher and somewhat stable
(HI between 0.4 and 0.6) in the center, with the exception of the West North Central region
13

becoming highly concentrated between 1996 and 2002 (HI close to 1), but then becoming
significantly more competitive after 2002 with an HI close to 0.5 in 2008. The western part of
the US has, for the most part, had a Mexican heroin monopoly. The east coast lost its supply of
Asian heroin, effectively creating a Colombian heroin monopoly. The center of the country is
characterized by the exit of Asian heroin, but the increased presence of Mexican and Colombian
heroin.8
5 Estimation Strategy
Following Arkes et al. (2004), we use the estimated price per expected pure gram as our mea-
sure of market price. Because heroin is unregulated, purchasers do not know the purity of the
heroin before it is consumed. Thus, dealers may, purposefully or not, sell low purity heroin to
unsuspecting drug users. Given this information asymmetry, we assume that frequent heroin
buyers are purchasing heroin with an expectation about the quality of that heroin. As in Arkes
et al. (2004), we estimate the price per expected pure gram by using a two-stage estimation.
The first stage is to estimate the purity in a location-year. The second stage is to estimate the
price in a location-year conditional on the estimated purity. We add a third stage in which the
estimated price per pure gram is correlated with the level of market concentration.
There are three levels of analysis: national, regional, and MSA level. Arkes et al. (2004)
use a two-stage general linear random effects model at the MSA level which allows for general
time trends to affect all the MSAs. The regional and MSA level results below are robust to
this estimation method, but for simplicity we only report the estimates from an ordinary least
squares method. Since we treat each location as a distinct market, when estimating price and
8The average HI is much larger in the regional and MSA estimates compared to the national estimates. Amathematical example will help to explain why this should be the case. Assume there are only two regions withan equal number of observations and they each have a 50-50 split between Mexican and Colombian heroin. TheHI of each region is 0.5 and the national HI would also be 0.5. If the regions are instead highly concentrated, onewith all Mexican heroin and the other with all Colombian heroin, they would each have an HI of 1. However, thenational HI would remain at 0.5. Thus, a rise in market concentration in a region will have a large effect on thatregion’s HI, but not necessarily the national HI. Note that if a region or MSA flipped from one type of heroin toanother, for example from 10 percent Mexican heroin and 90 percent Colombian heroin to 90 percent Mexicanheroin and 10 percent Mexican heroin, the HI would not change. Thus, we measure the availability of multipletypes of heroin, rather than the components of these types.
14

purity we only include time effects within location rather than across locations. General time
effects are then included in the estimated correlation between competition and location-specific
price per expected pure gram.
Within each market (i.e. the whole country, the census region, or the MSA), purity is
estimated as:
purityit = α+βamountit + γt + εit (1)
where purityit is the purity of heroin observation i in year t in a specific market. amountit is the
amount of heroin observed in grams, γt are year fixed effects, and εit is the error term. Price per
expected pure gram within a market is then estimated as follows:
ln(priceit) = α+β ln(puregramsit)+ γt + εit (2)
priceit is the inflation adjusted price and puregramsit = purityit ∗ amountit , where purityit is
the estimated purity from Equation 1. A location-price-year level dataset is then constructed,
where each observation includes the estimated price per pure gram for 0.5 grams of heroin in a
given year and location.9
The last estimation equation correlates the price per pure gram with market competition:
pricepure jt = α+βHI jt +ψ j + γt + εi jt (3)
where pricepure jt =price jtpurity jt∗amount jt
evaluated at amount jt = 0.5 is the estimated price per pure
gram in location j in year t. HI jt is the location-year HI.10 ψ j are location fixed effects.
The national estimates (where there is only one j) show us the aggregate correlation be-
tween market competition and the heroin price. Location and year fixed effects are not in-
cluded in these estimates as they would absorb all variation in the data. These estimates show
us the effect of Colombia’s entry on the US market as a whole. For the regional and MSA
estimates, time and location fixed effects control for general time trends in prices across all
locations and normalizes each location to its own initial price level. Since the price levels may
9The choice of 0.5 grams was chosen as a convenient middle point in the distribution, as it is close to theaverage amount collected between 0.1 and 1 gram.
10We do not separate HI by type of heroin because they are substitutes.
15

not be accurate, the fixed effect estimates show the effects of competition on price trends within
locations. In contrast to the national estimates, these estimates take advantage of differences
across local markets which were differentially affected by Colombian heroin’s entry. That is,
as market competition goes down (HI goes up), we estimate the effect on the price per ex-
pected pure gram relative to the location’s initial price level controlling for the national impact
of Colombia’s entry into the US market.
These estimates can only be interpreted as causal if one believes that changes in the mea-
sured HI are exogenous with respect to heroin price and purity and that there is no omitted
variable bias. Endogeneity may exist because heroin from any given source region may be
more likely to enter a high priced market or more likely to exit a low price market, which
would bias our estimates towards finding a negative relationship between HI and price. Our
estimates of such a negative relationship at the national level may plausibly be explained by
this reverse causality, that the low prices caused Asian heroin to leave. However, that we find
a positive relationship at the regional and MSA level means we may be underestimating the
effect of market concentration on price.
Omitted variable bias may also exist. For example, there may be a drop in price in places
with low market concentration because those happen to be places where the economy has been
improving relative to the rest of the country and, thus, demand (and price) is lower. All heroin
HCL/B estimates are robust to including unemployment or poverty rates as controls. Some
of the heroin SU estimates are not robust to the inclusion of these controls, likely due to the
lack of precision in these estimates. Thus, although the estimates give the first indication of
how competition is related to heroin price and purity, we should be cautious about the causal
interpretation of the estimates.
6 Descriptive Statistics
Mean values of the main variables of interest are presented in Table 1. The average estimated
purity is similar across specifications, with heroin HCL/B having higher purity than heroin SU.
16
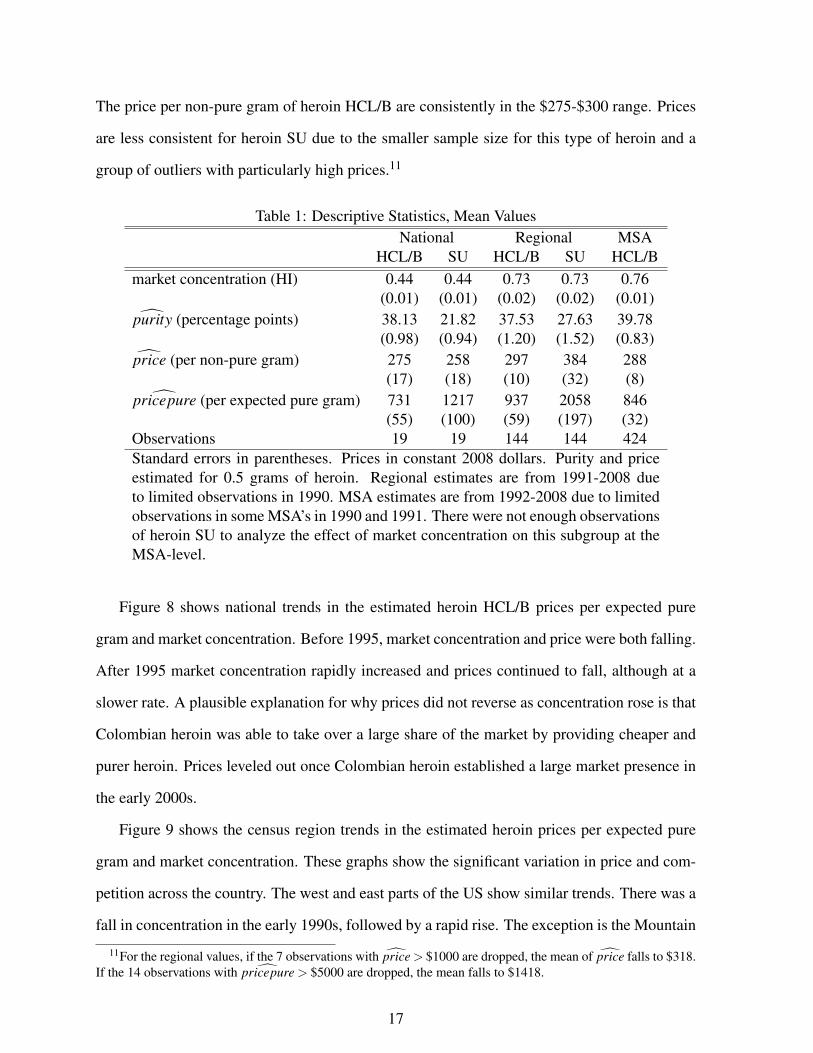
The price per non-pure gram of heroin HCL/B are consistently in the $275-$300 range. Prices
are less consistent for heroin SU due to the smaller sample size for this type of heroin and a
group of outliers with particularly high prices.11
Table 1: Descriptive Statistics, Mean ValuesNational Regional MSA
HCL/B SU HCL/B SU HCL/Bmarket concentration (HI) 0.44 0.44 0.73 0.73 0.76
(0.01) (0.01) (0.02) (0.02) (0.01)purity (percentage points) 38.13 21.82 37.53 27.63 39.78(0.98) (0.94) (1.20) (1.52) (0.83)
price (per non-pure gram) 275 258 297 384 288(17) (18) (10) (32) (8)pricepure (per expected pure gram) 731 1217 937 2058 846(55) (100) (59) (197) (32)
Observations 19 19 144 144 424Standard errors in parentheses. Prices in constant 2008 dollars. Purity and priceestimated for 0.5 grams of heroin. Regional estimates are from 1991-2008 dueto limited observations in 1990. MSA estimates are from 1992-2008 due to limitedobservations in some MSA’s in 1990 and 1991. There were not enough observationsof heroin SU to analyze the effect of market concentration on this subgroup at theMSA-level.
Figure 8 shows national trends in the estimated heroin HCL/B prices per expected pure
gram and market concentration. Before 1995, market concentration and price were both falling.
After 1995 market concentration rapidly increased and prices continued to fall, although at a
slower rate. A plausible explanation for why prices did not reverse as concentration rose is that
Colombian heroin was able to take over a large share of the market by providing cheaper and
purer heroin. Prices leveled out once Colombian heroin established a large market presence in
the early 2000s.
Figure 9 shows the census region trends in the estimated heroin prices per expected pure
gram and market concentration. These graphs show the significant variation in price and com-
petition across the country. The west and east parts of the US show similar trends. There was a
fall in concentration in the early 1990s, followed by a rapid rise. The exception is the Mountain
11For the regional values, if the 7 observations with price > $1000 are dropped, the mean of price falls to $318.If the 14 observations with pricepure > $5000 are dropped, the mean falls to $1418.
17

Figure 8: National estimates of trends in heroin prices and market concentration. Data Source:STRIDE Database
18

Figu
re9:
Reg
iona
lest
imat
esof
tren
dsin
hero
inH
CL
/Bpr
ices
and
mar
ketc
once
ntra
tion.
Dat
aSo
urce
:ST
RID
ED
atab
ase
19

region which has been highly concentrated throughout the time period, with a drop in the last
few years. On either side of the US, concentration and prices have converged.
In the center, there are two distinct areas. The West North Central region is the only area to
have a large increase in concentration in the 1990s followed by a large decrease in concentration
in the 2000s. Although prices fell substantially in the early 1990s, prices have then moved with
market concentration, with relatively high prices in the late 1990s and early 2000s followed by a
concurrent fall in price and market concentration in the later 2000s. The East North Central and
West South Central regions have maintained a low level of market concentration compared to
the rest of the country. Similar to the rest of the country, concentration and prices fell together
in the early 1990s, then concentration began to slowly rise and prices stabilized.
7 Estimates
Table 2 shows the estimates of Equation 3. At the national-level, market concentration in-
creased and the price per pure gram fell. The regional and MSA-level estimates include fixed
effects that control for national changes in the heroin price. Once, the overall fall in price is
taken into account, market concentration is positively correlated with the heroin price per pure
gram. The coefficient for heroin hydrochloride shows that a 0.1 increase in the HI correlates
with a $243 fall in price at the national-level, but a $138 increase in price at the regional-level
and $60 increase in price at the MSA-level. The opposite signs of the coefficients show that al-
though prices fell everywhere with the overall increase in market concentration, they fell more
rapidly in areas with more competition. That is, Colombian heroin’s entry is correlated with
a general fall in price, but those areas with more competition saw a larger decline in price.
Those with less competition had relatively high prices. Analogously, if Pepsi starts becoming
available in stores, the price of all softdrinks will fall. However, the price will fall even more in
stores where both Coke and Pepsi are available, rather than stores where only one type of soft
drink is sold.
We decompose the effect of market competition by estimating the correlation between com-
20
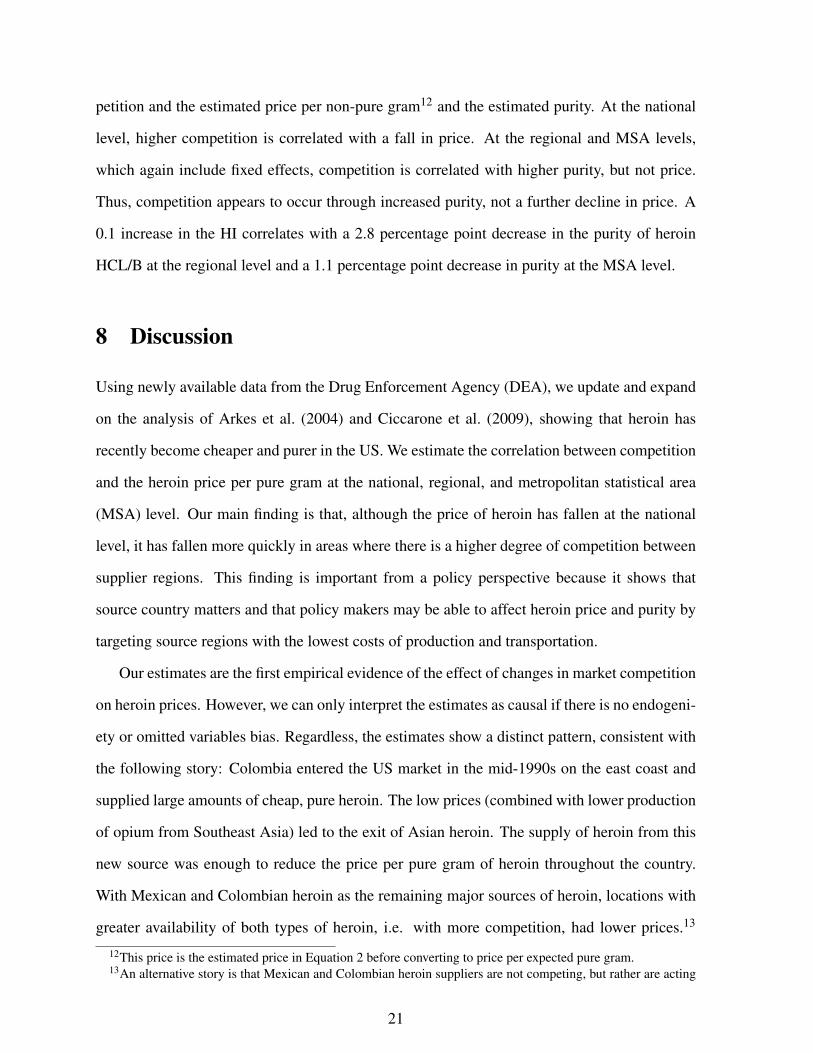
petition and the estimated price per non-pure gram12 and the estimated purity. At the national
level, higher competition is correlated with a fall in price. At the regional and MSA levels,
which again include fixed effects, competition is correlated with higher purity, but not price.
Thus, competition appears to occur through increased purity, not a further decline in price. A
0.1 increase in the HI correlates with a 2.8 percentage point decrease in the purity of heroin
HCL/B at the regional level and a 1.1 percentage point decrease in purity at the MSA level.
8 Discussion
Using newly available data from the Drug Enforcement Agency (DEA), we update and expand
on the analysis of Arkes et al. (2004) and Ciccarone et al. (2009), showing that heroin has
recently become cheaper and purer in the US. We estimate the correlation between competition
and the heroin price per pure gram at the national, regional, and metropolitan statistical area
(MSA) level. Our main finding is that, although the price of heroin has fallen at the national
level, it has fallen more quickly in areas where there is a higher degree of competition between
supplier regions. This finding is important from a policy perspective because it shows that
source country matters and that policy makers may be able to affect heroin price and purity by
targeting source regions with the lowest costs of production and transportation.
Our estimates are the first empirical evidence of the effect of changes in market competition
on heroin prices. However, we can only interpret the estimates as causal if there is no endogeni-
ety or omitted variables bias. Regardless, the estimates show a distinct pattern, consistent with
the following story: Colombia entered the US market in the mid-1990s on the east coast and
supplied large amounts of cheap, pure heroin. The low prices (combined with lower production
of opium from Southeast Asia) led to the exit of Asian heroin. The supply of heroin from this
new source was enough to reduce the price per pure gram of heroin throughout the country.
With Mexican and Colombian heroin as the remaining major sources of heroin, locations with
greater availability of both types of heroin, i.e. with more competition, had lower prices.13
12This price is the estimated price in Equation 2 before converting to price per expected pure gram.13An alternative story is that Mexican and Colombian heroin suppliers are not competing, but rather are acting
21

Tabl
e2:
Eff
ecto
fMar
ketC
once
ntra
tion
onH
eroi
nPr
ice
and
Puri
ty,1
990-
2008
Nat
iona
lEst
imat
esR
egio
nalE
stim
ates
MSA
Est
imat
esH
eroi
nH
CL
/BH
eroi
nSU
Her
oin
HC
L/B
Her
oin
SUH
eroi
nH
CL
/BPr
ice
PerP
ure
Gra
mM
arke
tCon
cent
ratio
n-2
432*
**-3
471*
*13
83**
*32
78**
595*
**(7
77)
(155
4)(2
58)
(126
9)(2
00)
Reg
iona
lFix
edE
ffec
tsno
noye
sye
sno
MSA
Fixe
dE
ffec
tsno
nono
noye
sY
earF
ixed
Eff
ects
nono
yes
yes
yes
Obs
erva
tions
1919
144
144
424
R-S
quar
ed0.
370.
230.
770.
510.
45Pr
ice
PerN
on-P
ure
Gra
mM
arke
tCon
cent
ratio
n-1
057.
35**
*-1
022.
55**
*-6
.16
108.
10-7
.83
(156
.38)
(208
.48)
(40.
64)
(239
.8)
(47.
21)
Reg
iona
lFix
edE
ffec
tsno
noye
sye
sno
MSA
Fixe
dE
ffec
tsno
nono
noye
sY
earF
ixed
Eff
ects
nono
yes
yes
yes
Obs
erva
tions
1919
144
144
424
R-S
quar
ed0.
730.
590.
810.
330.
53Pu
rity
(per
cent
age
poin
ts)
Mar
ketC
once
ntra
tion
-21.
95-1
9.56
-28.
34**
*-2
2.02
**-1
1.23
***
(16.
55)
(15.
91)
(5.3
2)(9
.61)
(3.6
7)R
egio
nalF
ixed
Eff
ects
nono
yes
yes
noM
SAFi
xed
Eff
ects
nono
nono
yes
Yea
rFix
edE
ffec
tsno
noye
sye
sye
sO
bser
vatio
ns19
1914
414
442
4R
-Squ
ared
0.09
0.08
0.77
0.53
0.72
Stan
dard
erro
rsin
pare
nthe
ses.
Pric
esin
cons
tant
2008
dolla
rs.
Reg
iona
lest
imat
esar
efr
om19
91-2
008
due
tolim
ited
obse
rvat
ions
in19
90.M
SAes
timat
esar
efr
om19
92-2
008
due
tolim
ited
obse
rvat
ions
inso
me
MSA
’sin
1990
and
1991
.T
here
wer
eno
teno
ugh
obse
rvat
ions
ofhe
roin
SUto
anal
yze
the
effe
ctof
mar
ketc
once
ntra
tion
onth
issu
bgro
upat
the
MSA
-lev
el.P
urity
and
pric
ees
timat
edfo
r0.5
gram
sof
hero
in.
(*p
<0.
1,**
p<
0.05
,***
p<
0.01
)
22

Hence, Colombia’s entry led to both a reduction in competition and price, and at the same
time, those regions with more competition had an even lower price relative to less competitive
regions.
The analysis shows that there were two stages to the entry of Colombian heroin. The
first was that cheap, pure heroin was able to facilitate the exit of Asian heroin and reduce
competition overall. In the short-run this is a bad outcome from a policy perspective, increasing
the use of heroin. The second stage was the establishment of a regional monopoly. Less
competition eventually causes a more expensive and lower quality product. Thus, the lack of
competition on the coasts may drive heroin prices up in the long-run.
We find that a rise in the price per pure gram at the regional and MSA level takes the form
of higher purity rather than a lower price per non-pure gram. This finding is consistent with
the phenomenon of “dime bags”, heroin sold in small quantities for $10. The price of a dime
bag has, by definition, not changed over time. The quantity of heroin in a dime bag has not
changed much, leaving purity as the dimension which heroin sellers use to increase or decrease
the price per pure gram. This information is particularly important for policy makers because
it means that prices that do not take into account purity will miss the most important changes
in the heroin market.
There is considerable evidence that interdiction efforts focused on decreased supply sim-
ply shift production and distribution patterns without substantial effects on consumption. The
market evidence presented here is somewhat consistent with that interpretation, namely there
are a number of market participants willing and able to compete for the US market, and greater
competition for consumers results in an increased quality of heroin. On an international level,
Paoli et al. (2009) explain that there is a “balloon effect” where the disruption of heroin from
one source is somewhat futile because it only causes a new producer to appear elsewhere. The
evidence presented here suggests that heroin product is fungible at a national level as well. All
of this is to say that it is difficult to reduce sources of supply without providing incentives for
as a colluding forward-looking duopoly which keeps the price of heroin low to increase future demand. However,this would not explain why the price of heroin is lower where both types of heroin are present compared to wherethey have monopoly control of a market.
23
other potential market participants to enter. However, our research also suggests that eliminat-
ing suppliers which have particularly inexpensive costs of production and transportation, may
cause an increase in price even if new suppliers emerge. The one obvious avenue that would
affect all suppliers would be to reduce consumer demand for heroin.
In terms of policy, our research has two major implications. First, preventing a new supplier
from entering the US market can keep the price high. Thus, assuming interdiction works at
reducing heroin production, intervening in a source country with particularly low production
and transportation costs should be much more effective than intervening in high cost countries.
Second, holding the number of suppliers to the US constant, the fewer the sources of heroin
in a region or city, the higher the price. Mexican heroin’s monopoly on the west coast and
Colombian heroin’s monopoly on the east coast is likely causing higher prices than would be
the case if both types of heroin were sold in equal shares in every city. Within the US, places
with more competitive illicit drug markets and, thus, low prices, may be the ones that need the
most intervention.
We are still left with several questions. How did Colombian heroin take over the east
coast market? Did Asian heroin leave peacefully or was it pushed out through violence? Is
crime falling in places with less competition? What are the implications of reduced heroin
prices for health and poverty outcomes? Is this era of inexpensive heroin telling us something
about resilience to increasing demand among vulnerable populations? As a beginning of this
research agenda, we have shown that competition in the heroin market is not very different
than competition in other markets: entry of a low-cost competitor reduces the price and greater
competition lowers the price further.
24
References
Arkes, J., Pacula, R. L., Paddock, S., Caulkins, J. P., and Reuter, P. (2004). Technical report for
the price and purity of illicit drugs through 2003. Office of National Drug Control Policy,
Washington DC: Executive Office of the President (Publication Number NCJ 207769).
Arkes, J., Pacula, R. L., Paddock, S. M., Caulkins, J. P., and Reuter, P. (2008). Why the DEA
STRIDE data are still useful for understanding drug markets. NBER Working Paper No.
14224.
Brady, J. E., Friedman, S. R., Cooper, H. L. F., Flom, P. L., Tempalski, B., and Gostnell,
K. (2008). Estimating the prevalence of injection drug users in the u.s. metropolitan areas
from 1992-2002. Journal of Urban Health: Bulletin of the New York Academy of Medicine,
85(3):323–351.
Ciccarone, D. (2005). The political economy of heroin: Regional markets, practices and con-
sequences. International Journal of Drug Policy, 16:289–290.
Ciccarone, D. (2009). Heroin in brown, black, and white: Structural factors and medical con-
sequences in the us heroin market. International Journal of Drug Policy, 20(3):277–282.
Ciccarone, D. (2012). Letizia paoli, victoria a. greenfield and peter reuter: The world heroin
market: Can supply be cut? Asian Journal of Criminology, 7:95–97.
Ciccarone, D., Unick, G. J., and Kraus, A. (2009). Imapct of South American heroin on the us
heroin market 1993-2004. International Journal of Drug Policy, 20(5):392–401.
Driskill, R. and McCafferty, S. (2001). Monopoly and oligopoly provision of addictive goods.
International Economic Review, 42(1):43–72.
Gibson, A., Degenhardt, L., Day, C., and McKetin, R. (2005). Recent trends in heroin supply
to markets in Australia the United States and Western Europe. International Journal of Drug
Policy, 16:293–299.
25

Horowitz, J. L. (2001). Should the DEA’s STRIDE data be used for economic analyses of
markets for illegal drugs. Journal of the American Statistical Association, 96(456):1254–
1262.
Johnston, L. D., O’Malley, P. M., Bachman, J. G., and Schulenberg, J. E. (2011). Monitoring
the Future national survey results on drug use, 1975-2010. Ann Arbor: Institute for Social
Research, The University of Michigan.
Paoli, L., Greenfield, V. A., and Reuter, P. (2009). The World Heroin Market: Can Supply Be
Cut? New York, NY: Oxford University Press.
Richards, T. J., Patterson, P. M., and Hamilton, S. F. (2007). Fast food, addiction, and market
power. Journal of Agricultural and Resource Economics, 32(3):425–447.
Showalter, M. H. (1999). Firm behavior in a market with addiction: the case of cigarettes.
Journal of Health Economics, 18:409–427.
UNODC (2003). Global Illicit Drug Trends 2003. United Nations Publications, Sales No.
E.03.XI.5.
UNODC (2011). World Drug Report 2011. United Nations Publications, Sales No. E.11.XI.10.
26


![Heroin maintenance for chronic heroin-dependent individualsharmreductionactioncenter.org/HRAC_DOCUMENTS/ADDICTION AND... · [Intervention Review] Heroin maintenance for chronic heroin-dependent](https://img.dokumen.tips/doc/110x75/5b87383e7f8b9a1a248c3f66/heroin-maintenance-for-chronic-heroin-dependent-individualsharmr-and-intervention.jpg)