Embed Size (px)
Citation preview
Copyright of Shell International BV 1September 2016
THE ENERGY LADDER
A model for projecting energy demand
Dr. Tashi Erdmann Martin Haigh
Statistical Adviser Senior Energy
Adviser
Shell Global Solutions Int. Shell
International

Copyright of Shell International BV 2September 2016
DISCLAIMER STATEMENT
The New Lens Scenarios” and “A Better Life with a Healthy Planet” are part of an ongoing process – scenario-building – used in Shell for more than 40 years to challenge executives’ perspectives on the future business environment. We base them on plausible assumptions and quantification, and they are designed to stretch management thinking and even to consider events that may only be remotely possible. Scenarios, therefore, are not intended to be predictions of likely future events or outcomes, and investors should not rely on them when making an investment decision with regard to Royal Dutch Shell plc securities.
The companies in which Royal Dutch Shell plc directly and indirectly owns
investments are separate legal entities. In this presentation “Shell”, “Shell
group” and “Royal Dutch Shell” are sometimes used for convenience where
references are made to Royal Dutch Shell plc and its subsidiaries in general.
Likewise, the words “we”, “us” and “our” are also used to refer to subsidiaries
in general or to those who work for them. These expressions are also used
where no useful purpose is served by identifying the particular company or
companies. ‘‘Subsidiaries’’, “Shell subsidiaries” and “Shell companies” as
used in this presentation refer to companies over which Royal Dutch Shell plc
either directly or indirectly has control. Entities and unincorporated
arrangements over which Shell has joint control are generally referred to “joint
ventures” and “joint operations” respectively. Entities over which Shell has
significant influence but neither control nor joint control are referred to as
“associates”. The term “Shell interest” is used for convenience to indicate the
direct and/or indirect ownership interest held by Shell in a venture, partnership
or company, after exclusion of all third-party interest.
This presentation contains forward-looking statements concerning the
financial condition, results of operations and businesses of Royal Dutch Shell.
All statements other than statements of historical fact are, or may be deemed
to be, forward-looking statements. Forward-looking statements are statements
of future expectations that are based on management’s current expectations
and assumptions and involve known and unknown risks and uncertainties that
could cause actual results, performance or events to differ materially from
those expressed or implied in these statements. Forward-looking statements
include, among other things, statements concerning the potential exposure of
Royal Dutch Shell to market risks and statements expressing management’s
expectations, beliefs, estimates, forecasts, projections and assumptions.
These forward-looking statements are identified by their use of terms and
phrases such as ‘‘anticipate’’, ‘‘believe’’, ‘‘could’’, ‘‘estimate’’, ‘‘expect’’,
‘‘goals’’, ‘‘intend’’, ‘‘may’’, ‘‘objectives’’, ‘‘outlook’’, ‘‘plan’’, ‘‘probably’’,
‘‘project’’, ‘‘risks’’, “schedule”, ‘‘seek’’, ‘‘should’’, ‘‘target’’, ‘‘will’’ and similar
terms and phrases. There are a number of factors that could affect the future
operations of Royal Dutch Shell and could cause those results to differ
materially from those expressed in the forward-looking statements included in
this presentation, including (without limitation): (a) price fluctuations in crude
oil and natural gas; (b) changes in demand for Shell’s products; (c) currency
fluctuations; (d) drilling and production results; (e) reserves estimates; (f) loss
of market share and industry competition; (g) environmental and physical
risks; (h) risks associated with the identification of suitable potential
acquisition properties and targets, and successful negotiation and completion
of such transactions; (i) the risk of doing business in developing countries and
countries subject to international sanctions; (j) legislative, fiscal and regulatory
developments including regulatory measures addressing climate change; (k)
economic and financial market conditions in various countries and regions; (l)
political risks, including the risks of expropriation and renegotiation of the
terms of contracts with governmental entities, delays or advancements in the
approval of projects and delays in the reimbursement for shared costs; and
(m) changes in trading conditions. All forward-looking statements contained in
this presentation are expressly qualified in their entirety by the cautionary
statements contained or referred to in this section. Readers should not place
undue reliance on forward-looking statements. Additional risk factors that may
affect future results are contained in Royal Dutch Shell’s 20-F for the year
ended December 31, 2015 (available at www.shell.com/investor and
www.sec.gov ). These risk factors also expressly qualify all forward looking
statements contained in this presentation and should be considered by the
reader. Each forward-looking statement speaks only as of the date of this
presentation, 5 September 2016. Neither Royal Dutch Shell plc nor any of its
subsidiaries undertake any obligation to publicly update or revise any forward-
looking statement as a result of new information, future events or other
information. In light of these risks, results could differ materially from those
stated, implied or inferred from the forward-looking statements contained in
this presentation.
We may have used certain terms, such as resources, in this presentation that
United States Securities and Exchange Commission (SEC) strictly prohibits
us from including in our filings with the SEC. U.S. Investors are urged to
consider closely the disclosure in our Form 20-F, File No 1-32575, available
on the SEC website www.sec.gov.

Copyright of Shell International BV 3September 2016
Shell’s New Lens Scenarios
Mountains Oceans
0
100
200
300
400
500
600
700
800
900
1,000
2000 2010 2020 2030 2040 2050 2060
EJ
/ y
ea
r (E
nerg
y so
urc
e)
Year
World - Total Primary Energy - By Source
Oil Biofuels
Natural Gas Biomass Gasified
Coal Biomass / Waste Solids
Biomass Traditional Nuclear
Hydro-electricity Geothermal
Solar Wind
Other Renewables
FSB Energy - Shell WEM v2.5.20 - Mountains - Balanced
0
100
200
300
400
500
600
700
800
900
1,000
2000 2010 2020 2030 2040 2050 2060
EJ
/ y
ea
r (E
nerg
y so
urc
e)
Year
World - Total Primary Energy - By Source
Oil Biofuels
Natural Gas Biomass Gasified
Coal Biomass / Waste Solids
Biomass Traditional Nuclear
Hydro-electricity Geothermal
Solar Wind
Other Renewables
FSB Energy - Shell WEM v2.5.20 - Oceans - BalancedSource:

Copyright of Shell International BV 4September 2016
Net-zero emissions world, towards the end of the
century
Emerging
Net-Zero
Emissions
World
2015
Assumes 50% electrification of end use.
ENERGY
SOURCE:
GAS
OIL
COAL
BIOENERGY
NUCLEAR
SOLAR
WIND
OTHER
With Carbon Capture and Storage
Fossil
Source: Shell analysis

Copyright of Shell International BV 5September 2016
Six key drivers of the energy system
ECONOMICGROWTHPOPULATION
ENVIRONMENTALPRESSURES
RESOURCEAVAILABILITYTECHNOLOGY
PEOPLE’SCHOICES

Copyright of Shell International BV 6September 2016
Three core models form the heart of the
World Energy Model
FOSSIL, NUCLEAR& RENEWABLES
END USER & ENERGY PRODUCERS
RESIDENTIAL, INDUSTRY & TRANSPORT
TOTAL DEMAND
Energy
GDP/person
ENERGY CHOICE
Market Share
Price differential
ENERGY SUPPLY
Production
/year
Time

Copyright of Shell International BV 7September 2016
Energy Ladder – the relationship between energy
demand and incomes is non-linear and partially
country-specific
Sources: IEA 2015 energy balances and Shell Scenarios Team estimates; World Bank 2015; UN Population Division 2015 revision.
For 1870 – 1960 data for UK and USA: US EIA, UK DECC, Angus Maddison (www.ggdc.net/maddison). Japan national statistics.
USA
CHN
IND
JPNDEU
FRA
CAN
GBR
BRA
KOR
ITA
IDNMEX
ESP
AUSTWN
NGA
THA
POL
TUR
NLD
PAK
MYS
EGY
BEL
VNM
SWE
PHL
FIN
AUT
GRC
SGP
COL
CHL
CHE
NOR
PRTBGD
ETH
ISR
DNK
TZA KEN
NZL
0
100
200
300
400
1,000 10,000 100,000
Prim
ary
en
erg
y (
GJ /
ca
pita
/ y
ea
r)
GDP (PPP) / capita (2010 USD) [log scale]
The Energy Ladder, 1960 - 2015 *
* UK and USA 1870 - 2015; Japan 1953 - 2015; Non-OECD 1971 - 2015* UK and USA 1870 - 2015; Japan 1953 - 2015; Non-OECD 1971 - 2015

Copyright of Shell International BV 8September 2016
0
50
100
150
200
250
300
350
400
1,000 10,000 100,000
Pri
ma
ry e
nerg
y (
GJ
/ c
ap
ita
/ y
ea
r)
GDP (PPP) / capita (2010 USD) [log scale]
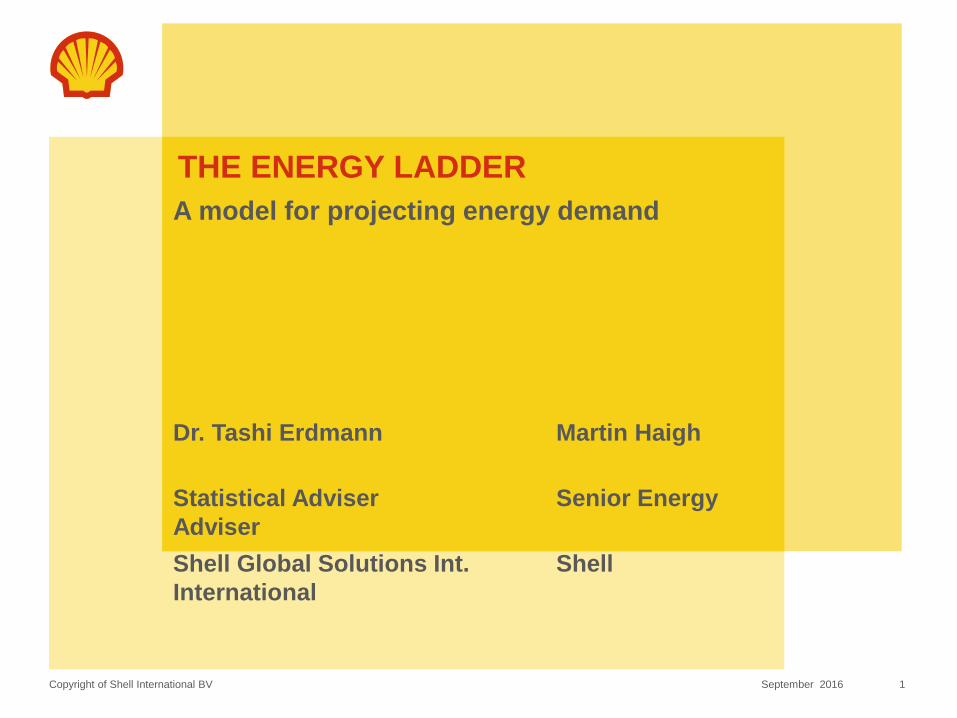
The Energy Ladder, 1960 - 2012 *
USA CAN
The inexorable link: economic growth and energy
demand
* USA and UK from 1870.
Sources: IEA 2013; World Bank 2013; UN Population Division 2012; US EIA; UK DECC; Angus Maddison; Japan
national statistics; Shell New Lens Scenarios
North America300-350
Copyright of Shell International BV 9September 2016
0
50
100
150
200
250
300
350
400
1,000 10,000 100,000
Pri
ma
ry e
nerg
y (
GJ
/ c
ap
ita
/ y
ea
r)
GDP (PPP) / capita (2010 USD) [log scale]
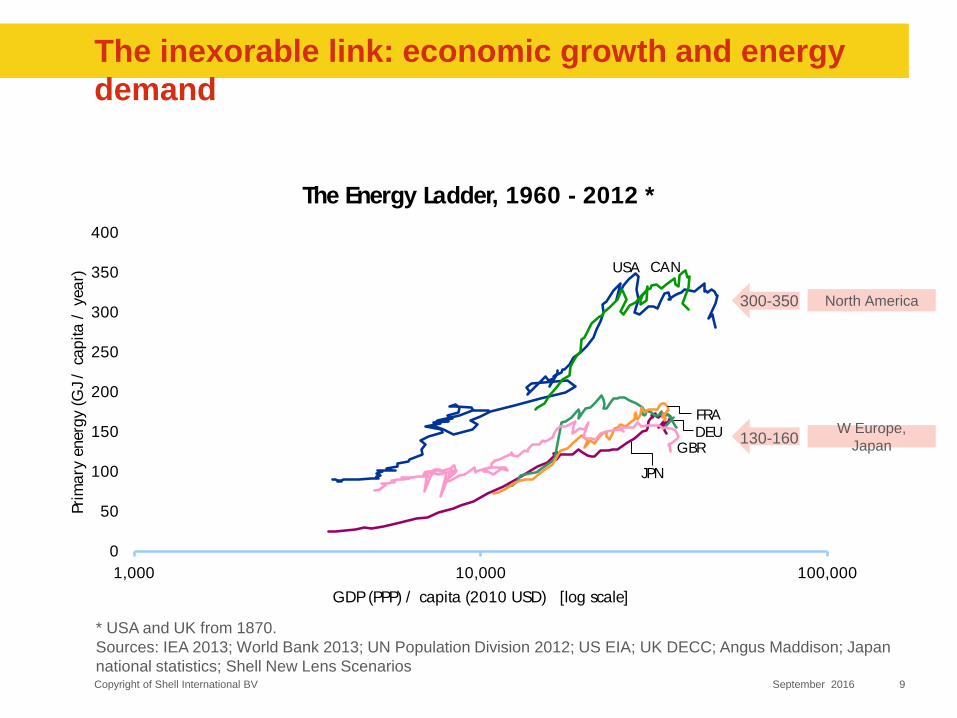
The Energy Ladder, 1960 - 2012 *
USA
JPN
DEU
FRA
CAN
GBR
The inexorable link: economic growth and energy
demand
North America
W Europe,
Japan
300-350
130-160
* USA and UK from 1870.
Sources: IEA 2013; World Bank 2013; UN Population Division 2012; US EIA; UK DECC; Angus Maddison; Japan
national statistics; Shell New Lens Scenarios

Copyright of Shell International BV 10September 2016
0
50
100
150
200
250
300
350
400
1,000 10,000 100,000
Pri
ma
ry e
nerg
y (
GJ
/ c
ap
ita
/ y
ea
r)
GDP (PPP) / capita (2010 USD) [log scale]
The Energy Ladder, 1960 - 2012 *
USA
JPN
DEU
FRA
CAN
GBR
AUSSWE
The inexorable link: economic growth and energy
demand
North America
Scandinavia,
Australia
W Europe,
Japan
200-240
300-350
130-160
* USA and UK from 1870.
Sources: IEA 2013; World Bank 2013; UN Population Division 2012; US EIA; UK DECC; Angus Maddison; Japan
national statistics; Shell New Lens Scenarios

Copyright of Shell International BV 11September 2016
0
50
100
150
200
250
300
350
400
1,000 10,000 100,000
Pri
ma
ry e
nerg
y (
GJ
/ c
ap
ita
/ y
ea
r)
GDP (PPP) / capita (2010 USD) [log scale]
The Energy Ladder, 1960 - 2012 *
USA
JPN
DEU
FRA
CAN
GBR
TWN
KOR
AUSSWE
The inexorable link: economic growth and energy
demand
North America
Scandinavia,
Australia
Asian Tigers
W Europe,
Japan
200-240
300-350
130-160
* USA and UK from 1870.
Sources: IEA 2013; World Bank 2013; UN Population Division 2012; US EIA; UK DECC; Angus Maddison; Japan
national statistics; Shell New Lens Scenarios

Copyright of Shell International BV 12September 2016
0
50
100
150
200
250
300
350
400
1,000 10,000 100,000
Pri
ma
ry e
nerg
y (
GJ
/ c
ap
ita
/ y
ea
r)
GDP (PPP) / capita (2010 USD) [log scale]
The Energy Ladder, 1960 - 2012 *
USA
JPN
DEU
FRA
CAN
GBR
ESP
ITA
TWN
KOR
AUSSWE
The inexorable link: economic growth and energy
demand
North America
Scandinavia,
Australia
Asian Tigers
W Europe,
JapanMediterranean
200-240
300-350
130-160
100-120
* USA and UK from 1870.
Sources: IEA 2013; World Bank 2013; UN Population Division 2012; US EIA; UK DECC; Angus Maddison; Japan
national statistics; Shell New Lens Scenarios

Copyright of Shell International BV 13September 2016
0
50
100
150
200
250
300
350
400
1,000 10,000 100,000
Pri
ma
ry e
nerg
y (
GJ
/ c
ap
ita
/ y
ea
r)
GDP (PPP) / capita (2010 USD) [log scale]
The Energy Ladder, 1960 - 2012 *
USA
CHN
JPN
DEU
FRA
CAN
GBRMYS
ESP
ITA
BRA
TWN
KOR
AUSSWE
The inexorable link: economic growth and energy
demand
North America
Scandinavia,
Australia
Asian Tigers
W Europe,
JapanMediterranean
200-240
300-350
130-160
100-120
* USA and UK from 1870.
Sources: IEA 2013; World Bank 2013; UN Population Division 2012; US EIA; UK DECC; Angus Maddison; Japan
national statistics; Shell New Lens Scenarios

Copyright of Shell International BV 14September 2016
WEM Energy Ladders track non-linear growth with
GDP, specific to each sector ...
Sector energy demand per capita
versus GDP per capita
Sector energy demand in “Energy
Service” (ES)
Sector Unit of Energy
service
Heavy Industry Tonne of steel
Other Industry Heating requirement in
buildings
Services Heating requirement in
buildings
Passenger Transport Passenger kilometre
Freight Transport Tonne kilometre
Residential Heating
Lighting Cooking
Heating requirement in
buildings
Residential Appliances Electricity need
(benchmark = fridge)
Non energy Oil equivalent for
output
ES
pe
r ca
pita
Energy demand in sector i
GDP per capita (USD)

Copyright of Shell International BV 15September 2016
... and enable an evolution to “mature” at levels of
demand, dependent on country-characteristics
Residential Heating needs depend on the heating-degree days
Energy consumption for
HEATING
(developed countries)
Average energy consumption for
HEATING
(developed countries)
GJ p
er
ca
pita
GJ p
er
ca
pita
Example:

Copyright of Shell International BV 16September 2016
How are the energy ladders modelled?
Phase 1: Linear
Slope and Price Elasticity estimated from:
Phase 2: S-Shape
Logistic curve to maturity level
Maturity levels estimated from:
Phase 3: Linear, convergence to saturation level
Slope and Price Elasticity estimated as in Phase
1
0 10000 20000 30000
ES
/ca
p
GDP/cap
Energy Service demandper capita (EScap)
Sector Model Band start/end
Start Phase 2 Maturity Level
Phase 1 Phase 2 Phase 3
𝐸𝑆𝑐𝑎𝑝𝑖𝑡 = 𝑐𝑖 + 𝑎 ∙ 𝐺𝐷𝑃𝑐𝑎𝑝𝑖𝑡 + 𝑏 ∙ 𝑃𝑟𝑖𝑐𝑒𝑖𝑡 + 𝜖𝑖𝑡
𝐸𝑆𝑐𝑎𝑝𝑖,𝑚𝑎𝑡𝑢𝑟𝑖𝑡𝑦 = 𝑐 + 𝑎 ∙ 𝑋𝑖 + 𝜖𝑖

Copyright of Shell International BV 17September 2016
Estimation of maturity level: linear regression
USA
Japan
Germany
France
Canada
United Kingdom
South Korea
Italy
Spain
AustraliaTaiwan
Netherlands
Belgium
Sweden
Austria
Singapore
Switzerland
Norway
Israel
Denmark
New Zealand
Ireland
0
1
2
3
100 200 300 400 500
ESPrice_maturity
ES
ca
p_
ma
turi
ty
factor(Pattern_Phase2)
a
a
a
a
a
1
2
3
4
5
Fitted ES/cap
𝐸𝑆𝑐𝑎𝑝𝑖,𝑚𝑎𝑡 = 𝑐𝑝𝑎𝑡𝑡𝑒𝑟𝑛 − 0.003 ∙ 𝐸𝑆𝑃𝑟𝑖𝑐𝑒𝑖,𝑚𝑎𝑡
R-squared = 92.4%
Price energy for tonne of steel equivalent, at
maturity
To
nn
eo
f s
tee
l e
qu
iva
len
t /
ca
pita
, a
t m
atu
rity
Example
Energy service in Heavy Industry at
maturity (GDP/cap = $30k) depends on
price,
natural resources and economic policy.Percentage of variation in
demand explained by this model.
Energy service per capita (GDP/cap = $30k)
*Countries removed:
-Oil & gas countries
-Luxembourg, FinlandSource: Shell analysis

Copyright of Shell International BV 18September 2016
Estimation income and price elasticity: panel data
regression𝐸𝑆𝑐𝑎𝑝𝑖𝑡 = 𝑐𝑖 + 𝒂𝒑 ∙ 𝐺𝐷𝑃𝑐𝑎𝑝𝑖𝑡 + 𝒃 ∙ 𝑃𝑟𝑖𝑐𝑒𝑖𝑡 + 𝜖𝑖𝑡𝑃𝑟𝑖𝑐𝑒 𝐸𝑙𝑎𝑠𝑖𝑐𝑖𝑡𝑦 = 𝑏 ∙ Τ𝐸𝑆𝑐𝑎𝑝 𝑃𝑟𝑖𝑐𝑒
0
2
4
6
8
30000 40000 50000 60000
GDPcap
Fitte
d
Canada1
Canada2
Denmark1
Denmark2
Finland1
Finland2
Finland3
France
Germany1
Germany2
Greece
Ireland1
Ireland2
Israel
Italy1
Italy2
Japan
Netherlands
New Zealand
Norway1
Norway2
Norway3
South Korea
Spain1
Spain2
Sweden
Fitted ES/cap
*Countries removed:
-Oil & gas countries
-Small countries
Coefficients :
Coefficient P-value
GDPcap -1.2358e-05 0.03561
GDPcap2 7.3795e-05 < 2.2e-16
GDPcap3 5.5433e-05 1.449e-07
Price -4.7291e-04 0.03194
Effects statistically
significant
if P-value < 0.05
Example
Energy service per capita (GDP/cap > $30k)
To
nn
es
of
ste
el e
qu
iva
len
t /
ca
pita
Real GDP (2010 PPP) / capita
Energy demand in Heavy Industry has a
statistically significant price elasticity of -
0.045
(after correcting for the effect of GDP).
Source: Shell analysis

Copyright of Shell International BV 19September 2016
Energy Ladder example: Heavy Industry in India
0.0
0.5
1.0
1.5
2.0
2.5
3.0
3.5
4.0
4.5
1,000 10,000 100,000
tonne s
teel equiv
ale
nt
/ cap
GDP / cap
Energy ladder selected sector
USAChinaRussiaIndiaJapanGermanyFranceCanadaUnited KingdomBrazilSouth KoreaItalyIndonesiaMexicoSpainSouth Africa
Source: Shell analysis
Note: dashed line is predicted

Copyright of Shell International BV 20September 2016
Energy Ladder example: Heavy Industry in China
0.0
0.5
1.0
1.5
2.0
2.5
3.0
3.5
4.0
4.5
1,000 10,000 100,000
tonne s
teel equiv
ale
nt
/ cap
GDP / cap
Energy ladder selected sector
USAChinaRussiaIndiaJapanGermanyFranceCanadaUnited KingdomBrazilSouth KoreaItalyIndonesiaMexicoSpainSouth Africa
Source: Shell analysis
Note: dashed line is predicted

Copyright of Shell International BV 21September 2016
Heavy Industry: what if China’s demand is flat?
0.0
0.5
1.0
1.5
2.0
2.5
3.0
3.5
4.0
4.5
0 20,000 40,000
tonn
e s
teel e
qu
iva
lent
/ca
pita
GDP / capita (PPP 2010 USD)
World - Energy Service Ladder -Heavy Industry - (1960 - 2060)
USA China
India Japan
Germany France
Canada United Kingdom
Brazil South Korea
FSB Energy - Shell WEM v2.8.6
0.0
0.5
1.0
1.5
2.0
2.5
3.0
3.5
4.0
4.5
0 20,000 40,000
tonn
e s
teel e
qu
iva
lent
/ca
pita
GDP / capita (PPP 2010 USD)
World - Energy Service Ladder -Heavy Industry - (1960 - 2060)
USA China
India Japan
Germany France
Canada United Kingdom
Brazil South Korea
FSB Energy - Shell WEM v2.8.6 - China Flat HI
‘China flat’ scenarioBase case
Source:

Copyright of Shell International BV 22September 2016
0.0
0.2
0.4
0.6
0.8
1.0
1.2
1.4
0 5,000 10,000 15,000 20,000 25,000 30,000 35,000
tonn
e s
teel e
qu
iva
lent
/ca
pita
GDP / capita (PPP 2010 USD)
World - Energy Service Ladder -Heavy Industry - (1960 - 2060)
World
FSB Energy - Shell WEM v2.8.6 - China Flat HI
‘China flat’ leads to slowdown in global Heavy
Industry‘China flat’ scenarioBase case
0.0
0.2
0.4
0.6
0.8
1.0
1.2
0 5,000 10,00015,00020,00025,00030,00035,00040,000
tonn
e s
teel e
qu
iva
lent
/ca
pita
GDP / capita (PPP 2010 USD)
World - Energy Service Ladder -Heavy Industry - (1960 - 2060)
World
FSB Energy - Shell WEM v2.8.7 - BBC16 Build - Draft Run 1FSB Energy - Shell WEM v2.8.7
Source:
Note: dashed included to compare the ‘China flat’ scenario with the base case

Copyright of Shell International BV 23September 2016
0
2,000
4,000
6,000
8,000
10,000
12,000
14,000
19601970198019902000201020202030204020502060
mill
ion t
onnes o
f ste
el equiv
ale
nt
Year
World - Energy Service - Heavy Industry
China
Rest of theWorld
FSB Energy - Shell WEM v2.8.6
0
10
20
30
40
50
60
70
80
90
100
19601970198019902000201020202030204020502060
EJ / y
ear
(Energ
y carr
ier)
Year
World - Total Final Consumption - Heavy Industry
China
Rest of theWorld
FSB Energy - Shell WEM v2.8.6
Source:
0.0
0.5
1.0
1.5
2.0
2.5
0 5,00010,00015,00020,00025,00030,00035,00040,00045,000
tonne s
teel equiv
ale
nt
/capita
GDP / capita (PPP 2010 USD)
World - Energy Service Ladder - Heavy Industry - (1960 - 2060)
China
Rest ofthe World
FSB Energy - Shell WEM v2.8.6
0
5
10
15
20
25
0 5,00010,00015,00020,00025,00030,00035,00040,00045,000
GJ / c
apita (
Energ
y C
arr
ier)
GDP / capita (PPP 2010 USD)
World - Energy Ladder TFC - Heavy Industry -(1960 - 2060)
China
Rest ofthe World
FSB Energy - Shell WEM v2.8.6
China’s share of world Heavy Industry (tonnes of steel
equivalent) declines from 38% in 2015 to 23% in 2060
Base case
Source: Source:
Source:

Copyright of Shell International BV 24September 2016
Energy demand may double in the first half of this
century
Mountains Oceans
0
100
200
300
400
500
600
700
800
900
1,000
2000 2010 2020 2030 2040 2050 2060
EJ
/ y
ea
r (E
nerg
y so
urc
e)
Year
World - Total Primary Energy - By Source
Oil Biofuels
Natural Gas Biomass Gasified
Coal Biomass / Waste Solids
Biomass Traditional Nuclear
Hydro-electricity Geothermal
Solar Wind
Other Renewables
FSB Energy - Shell WEM v2.5.20 - Mountains - Balanced
0
100
200
300
400
500
600
700
800
900
1,000
2000 2010 2020 2030 2040 2050 2060
EJ
/ y
ea
r (E
nerg
y so
urc
e)
Year
World - Total Primary Energy - By Source
Oil Biofuels
Natural Gas Biomass Gasified
Coal Biomass / Waste Solids
Biomass Traditional Nuclear
Hydro-electricity Geothermal
Solar Wind
Other Renewables
FSB Energy - Shell WEM v2.5.20 - Oceans - Balanced
Source:

Copyright of Shell International BV 25September 2016