Embed Size (px)
Citation preview

6-1
6. THE EMERGING INDEPENDENCE OF YOUTH WITH DISABILITIES By Renée Cameto, Phyllis Levine, Mary Wagner, and Camille Marder
For the better part of the last century, people with disabilities often were viewed as “victims” or “patients,” roles that placed them in the position to be “helped” or “treated,” which often left little room for independence or personal choice. This philosophical approach, referred to as “the medical model” (Wolfensberger, 1983), governed disability practice and policy for years. By the latter part of the 20th century, the deinstitutionalization movement, a surge in advocacy, heightened public awareness, and support from legislation had changed how society interacts with people with disabilities. For the most part, the medical model has given way to a “social model” of disability that focuses on the individual rather than the impairment, with emphasis on health promotion, access, independence, and community (Patrick, 1997).
The notion that individuals with disabilities could and should participate fully in the community gained strong support with the passage of the federal Americans with Disabilities Act in 1990. This act barred discrimination in employment, commercial facilities, public accommodations, transportation, and government services. In 2001, further federal support for the independence of people with disabilities came in the form of the “New Freedom Initiative,” a comprehensive set of proposals that seeks to promote full access to community life for individuals with disabilities including the domains of education, employment, transportation, technology, and home ownership.
In recent years, the perspective that individuals with disabilities should be as independent as possible has been reflected in a notable change in the way young people with disabilities are viewed and treated by the adults in their lives. Increasingly and justifiably, youth with disabilities are viewed as capable of determining their own futures. Students receiving special education services in secondary school are being encouraged to develop decision-making and self-determination skills as ways to enhance their ability to express their views and advocate for their preferences and needs, and to make personal judgments that reflect competence, motivation, and personal ambition (Johnson & Sharpe, 2000; Zhang, 2001).
Studies show that students who are expected to take responsibility for planning their futures and to engage in self-determination activities in secondary school also take greater responsibility for their lives after school (Malian & Nevin, 2002; Price, Wolensky, & Mulligan, 2002). This early experience with responsibility can be manifested in several ways. For example, students who work or have some type of vocational experiences during high school are exposed to decision-making opportunities and gain experience in personal responsibility (e.g., getting to work on time, performing expected tasks, making appropriate choices, setting priorities). As the self-determination movement grows, youth with disabilities are likely to gain increased functional, self-care, and financial management skills, and to become increasingly active in setting their own courses into young adulthood.
This chapter highlights indicators of emerging independence for youth with disabilities as they prepare for the transition from high school to early adulthood. This broad range of dimensions of the complex construct of independence includes skills that strengthen self-reliance, such as managing self-care needs and knowing how to advocate for oneself. Another view of independence comes from teachers’ assessments of how much progress youth are

6-2
making toward transition goals related to independence, including goals for independent living, self-advocacy, and employment. Independence indicators also involve behaviors that suggest emerging responsibility for daily activities, including financial management and household chores. Emerging independence in the community is indicated by earning driving privileges or having a regular paid job.
The domains of independence measured in NLTS2 were identified by technical advisors in the study design process as important and mirror several that were included in the original NLTS. They are:
• Managing self-care activities.
• Using functional cognitive skills.
• Being mobile.
• Persisting in completing tasks.
• Self-advocating.
• Participating in transition planning and making progress toward independence-related transition goals.
• Having financial management responsibilities.
• Taking on household responsibilities.
• Earning driving privileges.
• Having regular paid employment.
Independence is described on these dimensions both for youth with disabilities as a group and for those who differ in their primary disability category. Then the relationships among these multiple indicators of independence are explored. Finally, two indicators—taking on household responsibilities and regular paid employment—are analyzed in more detail. These two indicators have been selected for multivariate analysis because they foreshadow the kinds of activities independent adults generally assume.
Dimensions of Independence of Youth with Disabilities
Skills That Support Independence
NLTS2 has investigated the extent to which youth with disabilities are acquiring a variety of skills that enhance their ability to become increasingly independent as they age. These skills involve caring for their personal physical needs, cognitively processing and acting on information, moving around in the environment, persisting with tasks, and advocating for oneself.1
Self-care skills. To assess the independence of youth in caring for their fundamental physical needs, parents of youth with disabilities were asked to rate how well youth can feed and dress themselves without help on a 4-point scale from “not at all well” to “very well.” A 1 NLTS2 findings related to self-care and functional cognitive skills are reported in greater detail in Cameto et al. (2003).

6-3
summative scale of abilities ranges from 2 (both skills done “not at all well”) to 8 (both skills done “very well”).
According to parents, the vast majority of youth feed and dress themselves on their own “very well” (Exhibit 6-1); only 3% and 6% feed and dress themselves less well, respectively. Virtually all youth (94%) have a high self-care skills scale score.
Functional cognitive skills. Parents were asked to use the same 4-point scale to evaluate their children regarding four skills that often are used in daily activities: reading and understanding common signs, telling time on a clock with hands (i.e., an analog clock), counting change, and looking up telephone numbers and using the telephone. These skills are referred to here as functional cognitive skills because they require the cognitive ability to read, count, and calculate. As such, they suggest much about students’ abilities to perform a variety of more complex cognitive tasks independently. However, they also require sensory and physical skills (e.g., seeing signs, manipulating a telephone). Consequently, a high score indicates high functioning in all of
these areas, but a low score can result from a deficit in one or more of the cognitive, sensory, or physical domains.
Parents report that youth with disabilities have more difficulty performing functional cognitive skills than the self-care skills described previously. Still, most youth have mastered these tasks (Exhibit 6-2). Approximately 92% of youth read and understand common signs “very well” or “pretty well,” whereas about 82% tell time or count change with these levels of skill. Looking up telephone numbers and using the telephone appears to be the most difficult task; about 75% of youth perform this task “very well” or “pretty well,” according to parents. A scale of general functional cognitive abilities was constructed by summing responses to the four items; it ranges from 4 (all skills done “not at all well”) to 16 (all skills done “very well”). Overall, about half of youth score high on this scale (a score of 15 or 16), and a small percentage (about 6%) score low (a score of 4 to 8) on the functional cognitive skills scale.
Mobility. Getting around outside the home involves both cognitive and physical abilities, and can be difficult for youth who have limitations in either or both of these areas of functioning. The ability of youth to navigate the nearby environment outside their homes was assessed by using parents’ ratings of how well youth are able to “get to places outside the home, like to school, to a nearby store or park, or to a neighbor’s house.” Parents responded on a 4-point scale ranging from “very well” to “not at all well” (Exhibit 6-3). The majority of youth get around in their local area “very well” (about 75%) or “pretty well” (about 18%).
Getting around independently can be especially problematic for youth with visual impairments. Information on their mobility skills was collected for all youth identified as having
Exhibit 6-1 SELF-CARE SKILLS OF YOUTH
WITH DISABILITIES
Percentage Standard
Error
Feeds him/herself without help Very well 96.8 .5 Pretty well 1.9 .4 Not very or not at all well 1.2 .3
Dresses him/herself without help Very well 93.8 .8 Pretty well 3.8 .6 Not very or not at all well 2.3 .5
Self-care scale score High (8) 93.5 .8 Medium (5 to 7) 5.1 .7 Low (2 to 4) 1.3 .4
Source: NLTS2 Wave 1 parent interviews.

6-4
a visual impairment, either as reported by school districts as the primary disability classification or by parents as one of a youth’s disabilities. School staff who were best qualified to describe the overall school programs of these students were asked to report how well (“not very well,” “pretty well,” “very well”) the students are able to perform 10 mobility activities (e.g., travel indoors using rotely learned routes, execute a route given a verbal set of directions).2 A composite mobility performance score was calculated by summing these responses, which range from 10 to 30. More than one-third (37%) of students with visual impairments are reported by school staff to perform in the low range, and another 38% are reported to have high mobility skills.
Self-determination. The road to independence for adolescents includes the development of a variety of self-determination skills, including persisting with tasks to completion and knowing how and when to advocate for oneself. To assess persistence, parents were asked how
often youth “keep working at something until he/she is finished, even if it takes a long time.” Responses included “very often,” “sometimes,” and “never.” Self-advocacy is assessed by using ratings by school staff of how well a student can “ask for what s/he needs in order to do his or her best in class.” They rated this self-advocacy skill on a 4-point scale that ranges from “very well” to “not at all well.”
Parents of most youth with disabilities report that their sons or daughters are persistent with a task “very often” (35%) or “sometimes” (49%; Exhibit 6-4). Only 16% of youth “never” follow a task through to completion, according to parents. School staff report that most youth with disabilities are developing self-advocacy skills, with about one in five (21%) asking for what they need “very well” and about twice as many (41%) self-advocating “well.”
Transition Planning and Goals
Other potential indicators of emerging independence for youth with disabilities involve their plan for transitioning from secondary school to early adulthood. NLTS2 has investigated two aspects of independence related to transition plans: students’ level of participation in their own transition planning and the progress they are making toward transition goals they set that relate to independence. 2 Appendix A provides the full set of these items.
Exhibit 6-2 FUNCTIONAL COGNITIVE SKILLS OF
YOUTH WITH DISABILITIES
PercentageStandard
Error
Reads and understands common signs
Very well 76.5 1.3 Pretty well 15.7 1.1 Not very or not at all well 7.8 .8
Tells time on an analog clock Very well 61.6 1.5 Pretty well 21.6 1.3 Not very or not at all well 16.8 1.2
Counts change Very well 58.5 1.6 Pretty well 24.1 1.3 Not very or not at all well 17.4 1.2
Looks up telephone numbers and uses the phone
Very well 51.4 1.6 Pretty well 24.2 1.4 Not very or not at all well 24.4 1.4
Functional cognitive skills scale score High (15 or 16) 48.9 1.6 Medium (9 to 14) 45.6 1.6 Low (4 to 8) 5.5 .7
Source: NLTS2 Wave 1 parent interviews.

6-5
Participation in transition planning. The Individuals with Disabilities Education Act Amendments of 1997 (IDEA ’97) require that by age 14, the individualized education plan (IEP) of every student with disabilities include consideration of his or her transition to postschool life and a statement of the course of study the student should undertake to reach his or her transition goals (e.g., a college preparatory course of study if postsecondary education is a goal, vocational education if employment after high school is a goal). Teaching students the skills to participate in this transition planning process actively and providing opportunities to practice them facilitate stronger self-determination, both during and after leaving school, when youth negotiate their shifting role from student to adult (Stodden & Jones, 2002).
School staff who were most knowledgeable about students’ overall school programs and the transition planning process were asked to indicate how involved students with disabilities are in the process. More than half of students with disabilities (58%) reportedly provide at least some input toward planning their transition goals and activities during their IEP or ITP process (Exhibit 6-5), and another 12% of students take on a leadership role on their own behalf. Whereas only 6% do not attend their own transition plan
development meeting, another quarter are present at the meeting but do not contribute much to the process.
Progress toward independence-related transition goals. Another benchmark against which to assess how independent youth with disabilities are becoming involves the goals each student has as part of his or her transition plan. School staff best able to describe the school programs and transition plans of students with disabilities were asked how much progress they believe each student is making toward a variety of transition goals. Three of these goals relate to future independence: “independent living goals (e.g., personal management, getting a driver’s license),” “vocationally oriented goals,” and “self-advocacy goals.” Those who responded that a
Exhibit 6-3 MOBILITY OF YOUTH WITH DISABILITIES
Percentage Standard
Error
How well all youth with disabilities get to places outside the home:
Very well 74.3 1.4 Pretty well 17.5 1.2 Not very well 4.8 .7 Not at all well 3.3 .6
Mobility scale score (youth with visual impairments only)
High (24-30) 38.5 5.8 Medium (16-23) 24.2 5.1 Low (10-16) 37.4 5.8
Source: NLTS2 Wave 1 parent interviews and student’s school program survey.
Exhibit 6-4 PERSISTENCE AND SELF-ADVOCACY SKILLS
OF YOUTH WITH DISABILITIES
Percentage Standard
Error
Persistence—How often youth keeps working at something until finished
Very often 35.0 1.5 Sometimes 48.6 1.6 Never 16.4 1.2
Self-advocacy—How well youth asks for what s/he needs to succeed in class
Very well 20.9 1.7 Well 41.0 2.0 Not very well 29.0 1.9 Not at all well 9.1 1.2
Source: NLTS2 Wave 1 parent interviews, general education teacher survey, and student’s school program survey.

6-6
student had such goals were asked to report whether the student is making “a lot of progress,” “some progress,” “a little progress,” or “no progress.”
For youth with these three types of transition goals, school staff report somewhat greater progress by youth toward the independent living goals than toward either the vocationally oriented or self-advocacy goals (Exhibit 6-5). Whereas more than one-third of youth (36%) who have independent living goals are reported to be making “a lot of progress” toward them, fewer than one-fourth of youth (23%) with vocationally oriented goals are reported to be making “a lot of progress” toward them, with 26% of youth with self-advocacy goals making “a lot of progress” toward those goals (p<.001). The three types of goals are similar in the rate at which youth are reported to be making “no progress” (approximately 5% to 7%).
Assuming Responsibilities of Daily Living Another aspect of independence
involves the extent to which youth with disabilities are taking responsibility for their daily living needs. Two of these needs are investigated in NLTS2: taking on responsibility for personal space, possessions, and needs in the household, and managing personal money.
Household Responsibilities
As youth mature, they often are expected to become more responsible for their own support within the household, such as fixing their own breakfast or lunch, straightening up their rooms or living areas, and doing their own laundry. In addition, most youth begin to function more independently outside of the home (e.g., by shopping for personal items). These kinds of daily living responsibilities can measure youth’s competence and independence.
Parents were asked how often youth fix their own breakfast or lunch, straighten up their living space, do laundry, and buy a few things at a store when they are needed. The frequency of performing these tasks was reported on a 4-point scale ranging from “never” to “always.”3 3 NLTS2 findings related to responsibilities within the household are reported in greater detail in Cameto et al. (2003).
Exhibit 6-5 YOUTH’S TRANSITION PLANNING
PARTICIPATION AND PROGRESS TOWARD INDEPENDENCE-RELATED
TRANSITION GOALS
PercentageStandard
Error
Reported to take following role in transition planning:
A leadership role 12.2 1.5 Provides input 57.7 2.3 Present but not participating 24.7 2.0 Not present 5.5 1.1
Reported as making the following progress toward independent living goals:
A lot of progress 35.9 2.5 Some progress 40.7 2.5 A little progress 18.2 2.0 No progress 5.2 1.1
Reported as making the following progress toward vocationally oriented goals:
A lot of progress 23.0 2.1 Some progress 46.3 2.5 A little progress 24.9 2.1 No progress 5.8 1.2
Reported as making the following progress toward self-advocacy goals:
A lot of progress 26.0 2.3 Some progress 43.5 2.6 A little progress 24.0 2.2 No progress 6.6 1.3
Source: NLTS2 Wave 1 student’s school program survey.

6-7
According to parents’ reports, more than half of youth with disabilities usually or always fix their own breakfast or lunch (Exhibit 6-6), about 40% usually or always straighten up their room or buy a few things at the store, and about one-fourth usually or always do their laundry.
About 40% of youth reportedly sometimes fix their own breakfast or lunch, straighten up their room, or buy a few things at the store, and about one-third sometimes do laundry. Only 8% of youth never fix their own breakfast or lunch, 18% of youth never straighten up their room, and 16% never buy things at the store. Doing laundry is the task least likely to be performed by youth, with about 40% never doing so. Although the extent to which youth perform these tasks may reflect their abilities and disabilities, it also may reflect other factors, such as youth’s preferences, parental expectations, or family culture.
An overview of students’ household responsibilities results from a summative scale of ratings of the frequency with which youth do the four activities described above. The scale ranges from 4 (all activities “never” done) to 16 (all activities “always” done). Almost 60% of youth score in the medium range on this scale, indicating that they usually or sometimes do these activities, and another 7% score in the high range, indicating that they almost always do them.
Managing Personal Finances
Financial responsibility also is a key indicator of independence. As youth mature, they begin to become able to earn, spend, and save money and to be financially accountable. Traditionally, young people encounter the concept of money management through some form of
allowance and perhaps a savings account set up by their family. Opening a checking account or owning a credit card entails another level of monetary responsibility—debt and debt payment—which requires a greater degree of independence. To assess the extent to which youth with disabilities are acquiring these financial management responsibilities, parents were asked whether their adolescent children “get an allowance or have other money that he/she can decide
Exhibit 6-6 HOUSEHOLD AND FINANCIAL RESPONSIBILITIES OF YOUTH
WITH DISABILITIES
Percentage Standard
Error
Household responsibilities Fixes own breakfast or lunch
Always 32.0 1.5 Usually 22.8 1.3 Sometimes 37.1 1.5 Never 8.2 .9
Straightens up own room/living area
Always 26.6 1.4 Usually 14.7 1.1 Sometimes 40.4 1.5 Never 18.3 1.2
Buys items needed at a store Always 25.3 1.4 Usually 17.0 1.2 Sometimes 41.5 1.6 Never 16.2 1.2
Does laundry Always 19.1 1.5 Usually 8.6 .9 Sometimes 32.9 1.5 Never 39.4 1.5
Household responsibilities scale score
High (15 or 16) 6.9 .8 Medium (9 to 14) 58.1 1.6 Low (4 to 8) 35.0 1.5
Financial management Gets an allowance/has money and can decide how to spend it 83.5 1.2 Has a savings account 44.7 1.6 Has a checking account 3.2 .6 Has a charge account or credit card 3.0 .8
Source: NLTS2 Wave 1 parent interviews.

6-8
how to spend.” They also were asked whether each youth has a savings account, checking account, or a charge account or credit card in his or her own name.
The large majority (84%) of youth with disabilities are reported by their parents to receive an allowance or other personal spending money (Exhibit 6-6). Another 45% have a savings account. On the other hand, parents report that only 3% of their adolescent children with disabilities have checking accounts, charge accounts, or credit cards in their own names.
Emerging Independence in the Community
In addition to increasing responsibility for personal business, many adolescents, with or without disabilities, also begin to acquire new roles and responsibilities in society. For adolescents with disabilities, the transition to independent participation in the community is challenged by numerous factors, including the economic climate, employment options, family support, personal resources, and functional ability, among others (Borgen & Amundson, 1995; Storey, Bates, & Hunter, 2002). Two aspects of independence in the context of community are investigated in NLTS2: earning driving privileges and having regular paid employment.
Earning Driving Privileges
Most states allow 15-year-olds to apply for learner’s permits that enable them to drive with an adult, and they permit 16-year-olds to take a test to earn independent driving privileges. License requirements beyond passing the written and driving tests vary from state to state (e.g., many require teens to have taken a formal driver education program), as do the privileges accorded teens of different ages (e.g., some states restrict the hours teens can drive and the passengers they can carry for the first 6 months of their driving career). This aspect of independence for youth with disabilities was assessed by asking parents of youth who were at least 15 years old whether their adolescent children with disabilities have a driver’s license or learner’s permit. According to parents, almost one-third (30%) of youth with disabilities age 15 or older have earned these driving privileges (Exhibit 6-7).
Regular Paid Employment
Regular paid employment during high school can be an important foundation for employment in the postschool years (Blackorby & Wagner, 1996; Rylance, 1998; Storey et al., 2002). According to parents, 54% of youth with disabilities are employed in regular paid jobs outside the home (other than work-study) at some time in a 1-year period, with 22% being employed at a given point in time (Exhibit 6-7).4 One-third of youth with disabilities work during both the summer and the school year, with fewer (16%) working
4 NLTS2 findings related to employment during secondary school are reported in more detail in Marder, Cardoso, Wagner. (2003).
Exhibit 6-7 EMERGING INDEPENDENCE OF YOUTH WITH
DISABILITIES IN THE COMMUNITY
PercentageStandard
Error
Youth 15 years old or older with a learner’s permit or driver’s license 30.4 1.8 Youth with regular paid employment:
During the past year 54.0 1.6 During the summer only 16.5 1.2 During the school year only 5.2 .7 During both summer and school year 32.2 1.5 Currently 21.8 1.3
Source: NLTS2 Wave 1 parent interviews.

6-9
only during the summer and still fewer (5%) working only during the school year.
Relationships among Dimensions of Independence
As multiple dimensions of the broad concept of independence, the various indicators presented thus far are related to each other, but some more strongly than others. Looking first at the interrelationships of various indicators within each dimension of independence, analyses show that among the skills that support independence, self-care and functional cognitive skills and mobility are highly related (Exhibit 6-8), with correlations of .53 to .68 (p<.0001). However, the ability to self-advocate is less strongly associated with other skills, with correlations ranging from .20 to .28 (p<.0001), and the trait of persisting with tasks is least related to other skills (correlations of .12 to .19, p<.0001).
The three measures of progress toward independence goals are highly related, with correlations ranging from .52 to .60 (Exhibit 6-9; p<.0001 for all correlations). The two dimensions of assuming responsibilities of daily living also are related, although less strongly; household responsibilities and the number of financial management responsibilities of youth are
correlated at .22 (p<.0001). Lastly, the two measures of emerging independence in the community—earning driving privileges and having paid employment outside the home—are related. Overall, 41% of youth with disabilities who have regular paid jobs also have a driver’s license or learner’s permit, compared with 15% of those who do not work for pay outside the home (p<.001).
In addition to each of these relationships among indicators of a particular dimension of independence, many relationships are significant across dimensions. Correlations between skills that support independence and progress toward independence-related goals range from .11 to .44 (p<.0001). The ability to advocate for oneself is the skill most strongly related to progress toward independence goals, particularly toward the self-advocacy goal (r=.44, p<.0001). Skills that support independence are even more strongly related to youth’s assuming responsibilities for daily living, with correlations ranging from .08 to .44 (p<.0001). All correlations are stronger with household responsibilities than with financial management responsibilities, perhaps reflecting the physical abilities required for assuming household responsibilities and for mastering self-care, mobility, and some functional cognitive skills. Progress toward independence goals are weakly, but significantly, related to assuming responsibilities of daily living, with correlations of .07 to .18 (p<.0001).
Exhibit 6-8 CORRELATIONS AMONG SKILLS THAT SUPPORT
THE INDEPENDENCE OF YOUTH WITH DISABILITIES
Functional Cognitive
Skills Mobility Self-
advocacy Persistence
Self-care skills .53 .56 .20 .12 Functional cognitive skills .68 .28 .18 Mobility .20 .12 Persistence .19
All correlations are significant at the p<.0001 level.

6-10
Exhibit 6-10 depicts the relationships among emerging independence in the community and other dimensions of independence. With the exception of persistence and making progress toward self-advocacy goals, all measures of independence are significantly higher (p<.05 to p<.001 across measures) for youth with disabilities who have regular paid jobs than for youth who do not. Similarly, factors including measures of skills that support independence, school staff reports of progress toward goals, and average household responsibilities are all significantly higher for age-eligible youth who have a driver’s license or permit than for those who do not have these privileges.
Disability Differences in Independence
Youth with different primary disability classifications differ dramatically in the levels of independence achieved on each of the dimensions described thus far.
Skills That Support Independence
Although large differences exist between youth with different primary disability classifications, the patterns of those differences are not uniform across the kinds of skills explored in NLTS2 (Exhibit 6-11). Self-care skills, functional cognitive skills, and mobility all vary greatly across categories; there are differences of about 48 percentage points for those rated as highly skilled in mobility across the categories. For all three dimensions of independence, youth with learning disabilities, speech impairments, emotional disturbances, hearing impairments, and other health impairments are the most likely to be rated as highly skilled.
Exhibit 6-9 CORRELATIONS AMONG DIMENSIONS OF INDEPENDENCE AND SKILLS THAT
SUPPORT THE INDEPENDENCE OF YOUTH WITH DISABILITIES
Progress Toward: Extent to Which Youth Assumes Responsibilities for Daily Living
Independent Living Goals
Vocationally Oriented
Goals
Self-advocacy
Goals Household
Responsibilities Financial
Responsibilities
Skills that support independence Self-care skills .22 .16 .16 .44 .27 Functional cognitive skills .23 .16 .26 .43 .27 Mobility .19 .11 .18 .43 .26 Self-advocacy .30 .32 .44 .23 .16 Persistence .09 .12 .12 .22 .08
Progress toward: Independent living goals -- .56 .60 .18 .07 Vocationally oriented goals -- -- .52 .16 .10 Self-advocacy goals -- -- -- .18 .10
Extent to which youth assumes household responsibilities -- -- -- -- .22
Source: NLTS2 Wave 1 parent interviews, general education teacher survey, and student’s school program survey.
All correlations are significant at the p<.0001 level.

6-11
More than 90% of these youth score high on the self-care scale, 52% or more score high on functional cognitive skills, and 72% or more get around outside the house “very well.” In contrast, youth with multiple disabilities or deaf-blindness are among the most likely to score in the lowest category on these scales. On self-care skills and mobility, they are joined by youth with orthopedic impairments. Regarding functional cognitive skills and mobility, youth with mental retardation, visual impairment, or autism also are among the least skilled.
A very different pattern is apparent regarding self-advocacy and persistence; for these skills, sensory or physical ability is not as relevant as for the other skills supporting independence. Across the disability categories, the percentage scoring at the highest level varies by 30 percentage points for self-advocacy and 27 percentage points for persistence. Youth with hearing or visual impairments are among the highest scoring; according to teachers, more than 30% of the youth in these two categories are able to self-advocate “very well”, and at least 50% are persistent “very often.” Although the results are consistent with the pattern of high self-care and functional cognitive skills and mobility for youth with hearing impairments, they are not consistent for youth with visual impairments, whose self-care skills, functional cognitive skills,
Exhibit 6-10 SELECTED DIMENSIONS OF INDEPENDENCE OF YOUTH WITH DISABILITIES, BY
EMPLOYMENT STATUS AND HAVING DRIVING PRIVILEGES Youth Has a Regular Paid Job Youth Has Driving Privileges
Yes No Yes No
Skills that support independence Average self-care skills scale score 8.0 7.7 8.0 7.8
(<.1) (<.1) (<.1) (<.1) Average functional cognitive skills scale score 14.2 13.0 14.6 13.2
(.1) (.1) (.1) (.1) Percentage who get around outside the house “very well”
82.1 (1.8)
65.1 (2.2)
88.5 (2.5)
69.2 (2.1)
Percentage who persist with tasks “very often” 36.2 (2.2)
34.1 (2.1)
36.2 (3.7)
34.2 (2.1)
Percentage who self-advocate “very well” 27.0 18.2 31.7 19.5 (2.9) (2.5) (4.9) (2.5) Progress toward independence-related goals Percentage making “some” or “a lot of progress” toward:
Independent living goals 85.7 68.9 65.7 32.4 (2.8) (4.0) (6.3) (3.6)
Vocationally oriented goals 76.7 63.9 35.1 26.1 (3.4) (4.0) (5.9) (3.3)
Self-advocacy goals 65.0 75.1 41.5 21.1 (3.8) (3.5) (.5) (3.2) Assuming responsibilities for daily living Average household responsibilities scale score 10.2
(.1) 9.4 (.1)
10.4 (.2)
9.8 (.1)
Average number of financial management responsibilities
.9 (<.1)
.8 (<.1)
.9 (<.1)
.9 (<.1)
Source: NLTS2 Wave 1 parent interviews, general education teacher survey, and student’s school program survey.
Standard errors are in parentheses.

6-12
and level of mobility are not particularly high. Patterns of mixed scores characterize other groups of youth, as well. For example, youth with deaf-blindness are among the most likely to demonstrate frequent persistence, but they are among the lowest scoring on all other skills that support independence. Conversely, youth with emotional disturbances are the least likely to be persistent or self-advocate “very often,” but their scores are among the highest on self-care and functional cognitive skills and mobility.
Exhibit 6-11 LEVELS OF SKILLS THAT SUPPORT INDEPENDENCE,
BY DISABILITY CATEGORY
Learning
Dis- ability
Speech/ Language
Impair-ment
Mental Retar-dation
Emo-tional Distur-bance
Hearing Impair-ment
Visual Impair-ment
Ortho-pedic
Impair-ment
Other Health Impair-ment Autism
Trau-matic Brain Injury
Multiple Disabili-
ties
Deaf-Blind-ness
Percentage with self-care skills scale scorea High (8) 98.1 96.0 80.9 96.7 97.5 73.2 50.5 90.5 52.9 76.7 53.4 56.0 (.7) (1.0) (1.9) (.9) (.9) (3.1) (2.7) (1.4) (2.7) (3.9) (2.7) (4.9)Low (2 to 4) .1 .2 4.0 .3 .1 6.3 17.8 .8 6.6 4.5 21.7 14.9 (.2) (.2) (1.0) (.3) (.2) (1.7) (2.1) (.4) (1.3) (1.9) (2.2) (3.5)
Percentage with functional cognitive skills scale scorea
High (15 or 16) 52.3 61.6 20.4 62.7 56.0 33.4 40.3 53.0 24.6 46.4 15.8 20.4 (2.4) (2.4) (2.0) (2.5) (2.8) (3.3) (2.7) (2.4) (2.3) (4.6) (2.0) (4.1)Low (4 to 8) 1.5 2.0 22.6 2.5 3.9 22.8 15.0 2.4 28.6 8.2 40.4 33.1 (.6) (.7) (2.1) (.8) (1.1) (3.0) (2.0) (.7) (2.4) (2.5) (2.6) (4.8)
Mobility—Percentage who get around outside the houseb
Very well 79.9 77.0 52.4 79.5 73.3 48.8 46.7 72.5 33.1 60.1 34.4 31.1 (2.0) (2.1) (2.6) (2.1) (2.6) (3.6) (2.9) (2.1) (2.7) (4.6) (2.7) (4.8)Not very or not at all well 4.1 5.8 22.0 4.6 .7 31.9 34.5 7.3 46.4 11.6 47.7 47.4 (1.0) (1.2) (2.1) (1.1) (1.5) (3.4) (2.7) (1.2) (2.9) (3.0) (2.8) (5.1)
Self-advocacy—Percentage who ask for what they need to succeed in classb
Very well 25.9 25.4 16.5 9.7 34.6 39.4 27.6 19.0 14.4 29.0 11.6 22.2 (2.7) (2.8) (2.4) (2.4) (3.6) (4.8) (3.1) (2.4) (2.4) (5.4) (2.4) (5.5)
Not very or not at all well 33.6 30.2 40.8 50.3 21.1 24.3 30.8 37.5 56.7 31.3 49.7 33.1 (2.9) (3.0) (3.2) (4.0) (3.1) (4.2) (3.2) (2.9) (3.3) (5.5) (3.8) (6.2)
Persistence—Percentage who keep working at something until finishedc
Very often 36.0 48.2 33.4 26.4 50.4 53.2 2.8 8.4 38.7 31.8 35.1 45.6 (2.3) (2.4) (2.4) (2.2) (2.9) (3.5) (2.7) (2.1) (2.6) (4.3) (2.6) (5.0)Never 13.9 10.2 20.1 26.2 11.0 9.4 16.9 19.5 18.5 16.6 23.5 17.6 (1.7) (1.5) (2.0) (2.2) (1.8) (2.1) (2.1) (1.9) (2.1) (3.4) (2.3) (3.8)
Source: NLTS2 Wave 1 parent interviews, general education teacher survey, and student’s school program survey. a The “medium” category is omitted. b The category “well” is omitted. c The category “sometimes” is omitted.
Standard errors are in parentheses.

6-13
Transition Planning and Goals
There is significant variation across disability categories in students’ participation in their own transition planning and in school staff reports of their progress toward independence-related goals (Exhibit 6-12). For example, one-fourth of students with visual impairments are reported to have a leadership role in transition planning, as are 18% of students with hearing or orthopedic impairments. In contrast, 2% to 3% of students with mental retardation, autism, or multiple disabilities are that active in their transition planning (p<.05 to p<.001 compared with all other categories); in fact, from 45% to 67% of youth in these categories either do not attend transition planning meetings or attended but do not participate.
Regarding progress toward goals, school staff are most likely to rate youth with learning disabilities; speech, hearing, or visual impairments; or traumatic brain injuries as making “a lot of progress.” One-third or more in these categories are rated as making “a lot of progress” toward independent living goals, and from about one-fourth to one-third are rated as making this degree of progress toward vocationally oriented goals. Students in these categories also generally are making substantial progress toward self-advocacy goals, as are youth with orthopedic impairments.
Although relatively few youth in any category are rated as making “no progress” toward independent living goals, differences across categories are significant. Youth with multiple disabilities are the most likely to be rated as making no progress toward independent living goals (13%), and those with autism are most likely to be making no progress toward self-advocacy goals (18%); these are significantly more likely than youth with learning disabilities or hearing impairments (p<.01 and .05). Differences among categories in the percentage of youth reported to be making “no progress” toward vocationally oriented goals are not significant.
Assuming Responsibilities for Daily Living
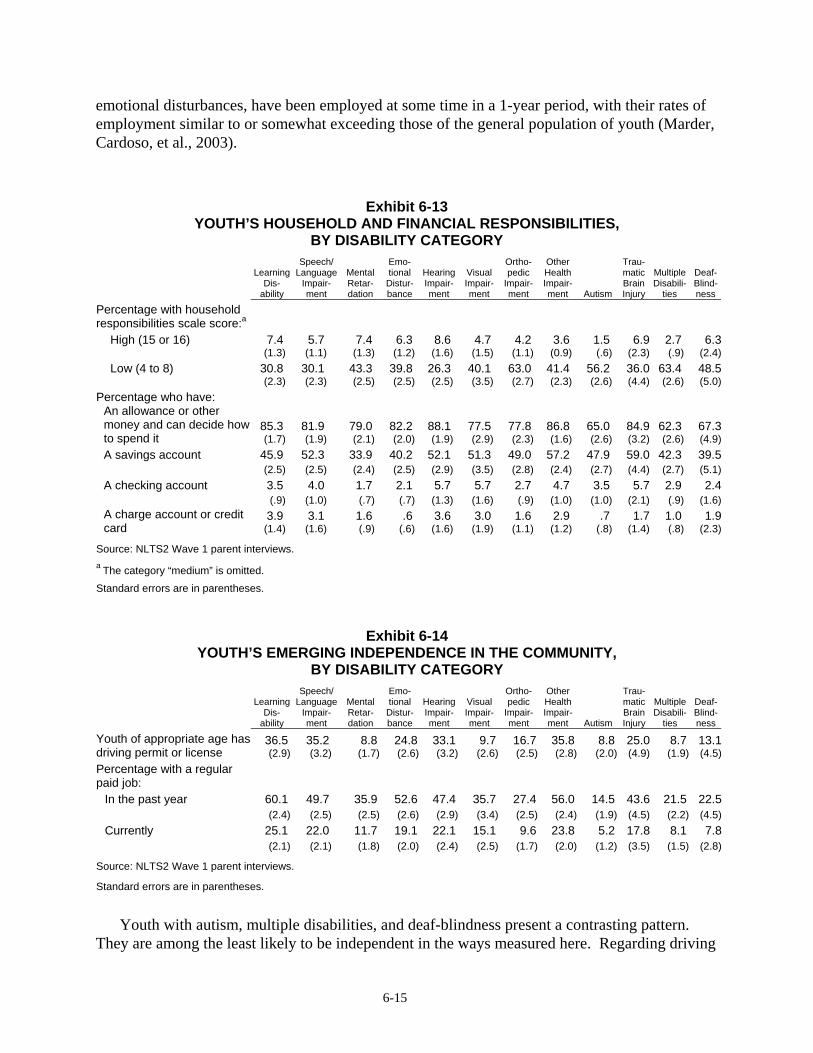
Disability category differences are apparent in the assumption of household responsibilities and management of personal finances (Exhibit 6-13). Although parents of 9% or fewer of youth in any disability category score youth high on the household responsibilities scale, there are significant differences among groups, with youth with hearing impairments being the most likely to score high (9%) and those with autism the least likely (2%, p<.001). Larger differences are seen among low scorers, which include from 56% to 63% for youth with orthopedic impairments, autism, or multiple disabilities. In contrast, about 30% of youth with learning disabilities or speech impairments score low (p<.001 for all comparisons).
There is about a 26-percentage-point difference across categories for youth’s having an allowance or other money about which they make decisions and for having a savings account. About 85% or more of youth with learning disabilities, hearing or other health impairments, or traumatic brain injuries have such funds. With the exception of those with learning disabilities, they, along with youth with speech or visual impairments, also are among the most likely to have a savings account (from 51% to 59%). Youth with hearing or visual impairments also are significantly more likely to have a checking account (6%), as are their peers with traumatic brain injuries (p<.05 for hearing or visual impairments, compared with mental retardation or emotional

6-14
disturbance). In contrast, 67% or fewer youth with autism, multiple disabilities, or deaf-blindness have an allowance (p<.001 for all comparisons), and 40% or fewer youth with mental retardation, emotional disturbances, or deaf-blindness have a savings account (p<.01 for youth with emotional disturbances vs. those with hearing impairments).
Emerging Independence in the Community
Across indicators, the highest levels of emerging community independence are apparent for youth with learning disabilities, speech impairments, or other health impairments (Exhibit 6-14). Along with youth with hearing impairments, more than one-third of these youth have earned driving privileges, according to parents, compared with one-fourth or fewer of youth in other categories (e.g., p<.05 for learning disability vs. traumatic brain injury). Employment rates also tend to be higher for these youth. For example, half or more of them, as well as youth with
Exhibit 6-12
YOUTH’S TRANSITION PLANNING PARTICIPATION AND PROGRESS TOWARD TRANSITION GOALS, BY DISABILITY CATEGORY
Learning Dis-
ability
Speech/Language
Impair-ment
Mental Retar-dation
Emo-tional Distur-bance
Hearing Impair-ment
Visual Impair-ment
Ortho-pedic
Impair-ment
Other Health Impair-ment Autism
Trau-matic Brain Injury
Multiple Disabili-
ties
Deaf- Blind-ness
Percentage reported to take part in transition planning:
In a leadership role 14.6 9.4 3.3 10.8 17.7 24.9 17.5 10.3 2.6 13.7 2.3 11.8 (2.5) (2.5) (1.3) (2.9) (3.4) (4.7) (3.1) (2.2) (1.2) (4.8) (1.3) (4.6)
Not present or present and not participating
24.9 (3.0)
31.5(3.9)
47.0(3.6)
36.4(4.3)
22.8(3.6)
24.5(4.7)
29.8(3.6)
21.1 (2.8)
67.3 (3.5)
30.1(6.0)
61.8(4.3)
45.2(7.1)
Percentage with progress toward independent living goal:
A lot of progress 42.2 38.5 21.1 28.0 33.5 33.0 24.9 29.9 15.4 37.6 21.5 24.9 (3.9) (4.9) (3.1) (4.5) (4.5) (5.7) (3.9) (3.6) (3.2) (7.3) (4.1) (7.2)No progress 3.9 5.4 6.4 8.3 1.9 6.2 7.6 7.4 10.2 5.8 12.6 3.8 (1.5) (2.3) (1.9) (2.7) (1.3) (2.9) (2.4) (2.1) (2.7) (3.5) (3.3) (3.2)
Percentage with progress toward a vocationally oriented goal:
A lot of progress 25.1 25.5 19.0 17.3 26.0 26.6 24.0 19.8 16.1 33.0 20.7 11.2 (3.3) (4.2) (3.0) (3.7) (4.2) (5.1) (3.9) (3.0) (3.0) (7.2) (3.8) (5.0)No progress 4.7 7.9 6.5 9.8 3.5 4.1 7.1 6.6 6.5 4.9 9.0 3.4 (1.6) (2.6) (1.9) (2.9) (1.8) (2.3) (2.4) (1.9) (2.0) (3.3) (2.7) (2.9)
Percentage with progress toward a self-advocacy goal:
A lot of progress 29.4 30.5 14.0 22.2 32.3 41.3 30.1 24.1 12.3 25.6 16.0 20.4 (3.7) (4.6) (2.8) (4.1) (4.8) (6.0) (4.2) (3.5) (2.9) (7.0) (3.7) (6.6)No progress 3.7 8.7 11.2 12.5 5.5 6.1 8.4 7.2 18.1 7.6 15.9 6.8 (1.5) (2.8) (2.5) (3.2) (2.3) (2.9) (2.5) (2.1) (3.4) (4.3) (3.7) (4.1)
Source: NLTS2 Wave 1 school program survey.
Notes: The categories “some progress” and “a little progress” are omitted. Progress toward a goal is reported only for youth with that kind of goal. Standard errors are in parentheses.
6-15
emotional disturbances, have been employed at some time in a 1-year period, with their rates of employment similar to or somewhat exceeding those of the general population of youth (Marder, Cardoso, et al., 2003).
Youth with autism, multiple disabilities, and deaf-blindness present a contrasting pattern.
They are among the least likely to be independent in the ways measured here. Regarding driving
Exhibit 6-13 YOUTH’S HOUSEHOLD AND FINANCIAL RESPONSIBILITIES,
BY DISABILITY CATEGORY
Learning Dis-
ability
Speech/ Language
Impair-ment
Mental Retar-dation
Emo-tional Distur-bance
Hearing Impair-ment
Visual Impair-ment
Ortho-pedic
Impair-ment
Other Health Impair-ment Autism
Trau-matic Brain Injury
Multiple Disabili-
ties
Deaf- Blind-ness
Percentage with household responsibilities scale score:a
High (15 or 16) 7.4 5.7 7.4 6.3 8.6 4.7 4.2 3.6 1.5 6.9 2.7 6.3 (1.3) (1.1) (1.3) (1.2) (1.6) (1.5) (1.1) (0.9) (.6) (2.3) (.9) (2.4)Low (4 to 8) 30.8 30.1 43.3 39.8 26.3 40.1 63.0 41.4 56.2 36.0 63.4 48.5
(2.3) (2.3) (2.5) (2.5) (2.5) (3.5) (2.7) (2.3) (2.6) (4.4) (2.6) (5.0)Percentage who have:
An allowance or other money and can decide how to spend it
85.3 (1.7)
81.9 (1.9)
79.0(2.1)
82.2(2.0)
88.1(1.9)
77.5(2.9)
77.8(2.3)
86.8(1.6)
65.0 (2.6)
84.9(3.2)
62.3(2.6)
67.3(4.9)
A savings account 45.9 52.3 33.9 40.2 52.1 51.3 49.0 57.2 47.9 59.0 42.3 39.5 (2.5) (2.5) (2.4) (2.5) (2.9) (3.5) (2.8) (2.4) (2.7) (4.4) (2.7) (5.1)A checking account 3.5 4.0 1.7 2.1 5.7 5.7 2.7 4.7 3.5 5.7 2.9 2.4 (.9) (1.0) (.7) (.7) (1.3) (1.6) (.9) (1.0) (1.0) (2.1) (.9) (1.6)A charge account or credit card
3.9 (1.4)
3.1 (1.6)
1.6(.9)
.6(.6)
3.6(1.6)
3.0(1.9)
1.6(1.1)
2.9(1.2)
.7 (.8)
1.7(1.4)
1.0(.8)
1.9(2.3)
Source: NLTS2 Wave 1 parent interviews. a The category “medium” is omitted.
Standard errors are in parentheses.
Exhibit 6-14 YOUTH’S EMERGING INDEPENDENCE IN THE COMMUNITY,
BY DISABILITY CATEGORY
Learning
Dis- ability
Speech/ Language
Impair-ment
Mental Retar-dation
Emo-tional Distur-bance
Hearing Impair-ment
Visual Impair-ment
Ortho-pedic
Impair-ment
Other Health Impair-ment Autism
Trau-matic Brain Injury
Multiple Disabili-
ties
Deaf-Blind-ness
Youth of appropriate age has driving permit or license
36.5 (2.9)
35.2(3.2)
8.8(1.7)
24.8(2.6)
33.1(3.2)
9.7(2.6)
16.7(2.5)
35.8 (2.8)
8.8 (2.0)
25.0(4.9)
8.7(1.9)
13.1(4.5)
Percentage with a regular paid job:
In the past year 60.1 49.7 35.9 52.6 47.4 35.7 27.4 56.0 14.5 43.6 21.5 22.5 (2.4) (2.5) (2.5) (2.6) (2.9) (3.4) (2.5) (2.4) (1.9) (4.5) (2.2) (4.5)Currently 25.1 22.0 11.7 19.1 22.1 15.1 9.6 23.8 5.2 17.8 8.1 7.8 (2.1) (2.1) (1.8) (2.0) (2.4) (2.5) (1.7) (2.0) (1.2) (3.5) (1.5) (2.8)
Source: NLTS2 Wave 1 parent interviews.
Standard errors are in parentheses.

6-16
privileges, they are joined by youth with visual or orthopedic impairments as being particularly unlikely to be driving, although 10% to 17% of youth in these categories do so. In the employment arena, 14% of youth with autism and fewer than one-fourth of those with multiple disabilities or deaf-blindness are employed in a given year. Their rates of current employment, along with those of youth with orthopedic impairments or mental retardation, also are low relative to other youth (e.g., p<.05 for multiple disabilities vs. emotional disturbance).
Factors Related to Independence of Youth with Disabilities
Multivariate analyses were performed to investigate the independent relationships of disability and a variety of other individual, household, and school program factors to emerging independence. Two measures of independence were used: independent performance of household chores and regular paid employment outside of school.
Individual Characteristics
The relationship of three kinds of individual characteristics—disability, functioning, and demographics—are considered as they relate to emerging independence.
Disability characteristics. Controlling for other factors, disability category is a significant factor related to performance of household responsibilities or holding a regular paid job for all youth with disabilities, with the exception of those with speech impairments (Exhibit 6-15). For example, relative to youth with learning disabilities,5 having an orthopedic impairment is negatively related to both carrying out household responsibilities and holding a job. Youth with orthopedic impairments score a full point below youth with learning disabilities on household responsibilities, other factors held constant, and are 21 percentage points less likely to have a paid job outside of school.
Compared with youth with learning disabilities, more differences are observed for youth in other disability categories regarding employment than household responsibilities, and differences generally favor youth with learning disabilities. Only youth with hearing impairments are more likely than youth with learning disabilities to demonstrate independence in performing household responsibilities, other factors being equal, whereas youth with emotional disturbances or orthopedic or other health impairments are somewhat less likely than youth with learning disabilities to carry out household responsibilities. Youth with mental retardation, visual or orthopedic impairments, autism, or multiple disabilities all are less likely than youth with learning disabilities to hold jobs, with differences of 10 to 30 percentage points, other factors held constant. In contrast, having ADD/ADHD, independent of the primary disability category, is positively related to the likelihood of youth’s having a job.
Additionally, the number of functional domains in which youth experience problems related to disability is strongly related to their independence, favoring youth with fewer areas of functional limitation. The age of the youth at the time that his/her disability was identified is related to the likelihood of having a job, favoring youth identified at a later age. 5 Multivariate analyses require that for categorical variables, such as disability category, each category be compared with another specified category. Learning disability was chosen as the category against which to compare the relationships for other disability categories because it is the largest category and, therefore, most closely resembles the characteristics of youth with disabilities as a whole.

6-17
Exhibit 6-15 DIFFERENCES IN INDEPENDENCE ASSOCIATED WITH INDIVIDUAL
CHARACTERISTICS OF YOUTH WITH DISABILITIESa
Estimated Difference in:
Household Responsibilities
Scale Score
Probability of Having Regular Paid Employment For Increment
Disability characteristics Speech/language impairment .0 -3.3 vs. learning disabilityb Mental retardation .1 -10.5** vs. learning disability Emotional disturbance -.3* -4.9 vs. learning disability Hearing impairment .5*** -8.2 vs. learning disability Visual impairment .2 -19.1*** vs. learning disability Orthopedic impairment -1.0*** -21.3*** vs. learning disability Other health impairment -.4*** -7.3 vs. learning disability Autism -.1 -29.9*** vs. learning disability Traumatic brain injury .1 -12.3 vs. learning disability Multiple disabilities/deaf-blindness -.1 -17.2*** vs. learning disability ADD/ADHD -.1 7.2** Yes vs. no Age at identification of disability .0 2.5** 8 vs. 4 years Number of problem domains -.2*** -6.5*** 3 vs. 1 domain
Functioning Health .2 2.5 Excellent vs. fair or poor (4 vs. 1)Self-care skills 2.1*** 24.4*** High vs. low (8 vs. 4) Functional cognitive skills 1.1*** 16.8*** High vs. low (15 vs. 7) Social skills .6*** 5.6* High vs. low (27 vs. 17) Persistence .9*** -3.0 High vs. low (3 vs. 1)
Demographics Age .7*** 17.3*** 17 vs. 14 years Gender -.7*** -.7 Male vs. female African American .5*** -15.4*** vs. white Hispanic .2 -19.5*** vs. white Other or multiple race/ethnicity .2 -14.3* vs. white Primarily language other than English spoken at home
.1 -1.7 Yes vs. no
a Statistics in this exhibit are calculated from models that included all individual characteristics shown in this exhibit, as well as household characteristics (results shown in Exhibit 6-16) and school programs and experiences (results shown in Exhibit 6-17). b Multivariate analyses require that for categorical variables, such as disability category, each category be compared with another specified category. Learning disability was chosen as the category against which to compare the relationships for other disability categories because it is the largest category and, therefore, most closely resembles the characteristics of youth with disabilities as a whole.
*p<.05; **p<.01; ***p<.001.
Exhibit reads: The household responsibilities scale scores of youth with hearing impairments are .5 higher than the scores of youth with learning disabilities, other factors being equal. The scores of youth with high self-care skills are 2.1 points higher than the scores of youth with low self-care skills. The probability of having regular paid employment is 10.5 percentage points lower for youth with mental retardation than for youth with learning disabilities. The probability of having regular paid employment is 16.8 percentage points higher for youth whose functional cognitive skills are high than for youth whose functional cognitive skills are low.

6-18
Functioning. The relationship between the measures of individual functioning and independence is very strong. It is quite plausible that the better young people can care for their personal self-care needs, the better they are able to perform the somewhat more complex tasks involved in household responsibilities, such as making breakfast, cleaning up, or doing laundry. Greater persistence is a quality that is positively associated with higher performance on household chores. Youth with better cognitive and social skills also are more likely to perform household tasks with greater facility. Along with basic cognitive skills, self-care skills serve youth well in attaining jobs. Youth with high self-care and cognitive skills are 24 and 17 percentage points, respectively, more likely to have a job than youth with low skills.
Demographic characteristics. Age is among the strongest influences on the employment patterns of youth in the general population (Herz & Kosanovich, 2000; Rothstein & Herz, 2000). As youth mature, they are expected to enter the world of work and take on greater responsibility in the performance of tasks of daily living, including household chores. Similarly, for youth with disabilities, age is strongly related to employment, as well as to taking on household responsibilities. As noted in other NLTS2 analyses of employment of youth with disabilities (Marder, Cardoso, & Wagner, 2003), youth are more likely to be employed with each additional year in age; 17-year-olds are 17 percentage points more likely to have a job than 14-year-olds, other factors held constant. Race/ethnicity also has a strong independent relationship to the likelihood of employment for youth. Compared with white youth, youth in every other ethnic category are less likely to be employed, by 14 to 20 percentage points. Also, as stereotypical gender roles would suggest, girls are more likely than boys to take responsibility for tasks within the home, although gender does not have an effect on the likelihood of employment, independent of other factors included in the analyses.
Household Characteristics
Various aspects of youth’s households are related to their independence, although not consistently across the two indicators of household responsibilities and employment (Exhibit 6-16). Other things being equal, youth from lower-income families are more likely than those from higher income families to be responsible for household tasks. This is consistent with findings that youth from lower-income families are subject to more household rules (Newman, Wagner, & Guzman, 2002). Among families who expect that youth eventually will live away from home, youth are more likely to perform household tasks. Youth whose families are involved with their lives outside the home, specifically with their schools, also are more likely to have a job.

6-19
School Programs and Experiences
NLTS2 analyses of the independence of youth with disabilities have not examined the relationships between school programs and experiences and household responsibilities because the activities of home and school are considered to be relatively independent. However, the analyses have considered the relationships of school programs and experience with the employment of youth. Few measures of school programs and experiences have strong associations with youth’s having a regular paid job outside of school (Exhibit 6-17). None of the vocational services provided as part of the youth’s school program (e.g., vocational education, career counseling, Tech Prep programs) are associated with youth employment, other factors held constant.
Youth who have changed schools more often, other than because of grade promotions, are more likely to have a job. Perhaps in light of their transient engagements in individual schools, they focus on the world of work rather than on school. Social adjustment supports, such as behavior management plans or services from a behavior specialist, are negatively related to youth’s having a job. This negative relationship may result from a spurious correlation, assuming that both receipt of social supports and low probability of having a job result, at least in part, from poor social adjustment. Future longitudinal analyses should be able to illuminate whether receipt of social supports helps youth gain employment over time.
Exhibit 6-16 DIFFERENCES IN INDEPENDENCE ASSOCIATED WITH HOUSEHOLD
CHARACTERISTICS OF YOUTH WITH DISABILITIESa Estimated Difference in:
Household Responsibility
Scale
Probability of Having
Regular Paid Employment For Increment
Household income -.2*** 1.4 $55,000 to $60,000 vs. $20,000 to $24,000
Family involvement at home .0 NA High vs. low (8 vs. 5) Family involvement at school NA 8.5*** High vs. low (6 vs. 1) Expectations for eventually living away from home
.9*** NA Definitely will vs. probably won’t (4 vs. 2)
a Statistics in this exhibit are calculated from models that included the household characteristics shown in this exhibit, as well as individual characteristics (results shown in Exhibit 6-15), and school programs and experiences (results shown in Exhibit 6-17).
*p<.05; **p<.01; ***p<.001.
Exhibit reads: The household responsibilities scale scores of youth whose household incomes are between $55,000 and $60,000 are .2 lower than the scores of youth whose household incomes are between $20,000 and $24,000, other factors being equal. The probability of having regular paid employment is 8.5 percentage points higher for youth whose families have high levels of involvement with their school than for youth whose families have low levels of involvement.

6-20
How Much Is Explained?
The multivariate analyses of measures of independence explain a statistically significant portion of the variation in household responsibilities (r2=.38) and youth employment (PI=.24).6 Almost all the explanatory power of the models of both types of emerging independence comes from the individual characteristics of youth with disabilities. Household characteristics increase the amount of variation explained in household responsibilities by only 1 percentage point. Similarly, household characteristics increase the PI of the model of probability of employment by 1 percentage point, and school programs and experiences by 2 percentage points. The fact that school programs and experiences result in such a small increase in the predictive power of the model should not be taken to mean that these programs and experiences make no difference to youth’s probability of employment. Even if such programs and experiences have little impact on employment in the same year they are provided, they may have more impact in later years, a phenomenon that NLTS2 will explore in future reports.
Looking Back to NLTS
A number of the factors related to employment that are included in these multivariate analyses were subjected to similar analyses in the original NLTS. However, a note of caution is needed regarding the comparison of the two analyses. NLTS analyses examined the relationship of multiple factors to employment of youth who were at least 16 years of age and no longer in school. In contrast, Wave 1 NLTS2 data include youth between the ages of 13 and 17, the vast
6 Because logistic regression analyses do not produce the typical measure of explained variation (r2) an alternative statistic was calculated for the employment analysis, which indicates the “predictive improvement,” or PI, that can be obtained by adding an independent variable to a logistic regression. Possible PI values range from 0 to 1 in a similar way to conventional r2 statistics. See Appendix A for a more complete description of PI.
Exhibit 6-17 DIFFERENCES IN INDEPENDENCE ASSOCIATED WITH SCHOOL PROGRAMS
AND EXPERIENCES OF YOUTH WITH DISABILITIESa
Estimated Difference in Probability of Regular Paid
Employment For Increment
School mobility 11.2** Changed school 3 times vs. not at all, except for promotions
Vocational education .7 Yes vs. no Number of vocational services 4.2 Four vs. none School-sponsored work experience -6.8 Yes vs. no Number of social adjustment supports -3.1* Two vs. none a Statistics in this exhibit are calculated from models estimated with the school programs and experiences shown in this exhibit, as well as individual characteristics (results shown in Exhibit 6-15), and household characteristics (results shown in Exhibit 6-16).
*p<.05, **p<.01, ***p<.001.
Exhibit reads: The probability of having regular paid employment is 11.2 percentage points higher for youth who have changed school three times, except for promotions, than for youth who have not changed schools at all, except for promotions, other factors being equal. The probability of having regular paid employment is 3.1 percentage points lower for youth who have two social adjustment supports than for youth who have no social adjustment supports.

6-21
majority of whom were still in school. Nevertheless, comparison of the results reveals several similarities.
The 12-month employment rate for youth with disabilities increased between 1987 and 2001 by 9 percentage points (p<.01; Wagner, Cameto, & Newman, 2003). Nonetheless, the relationships of disability to youth employment were consistent in both 1987 and 2001 for youth with speech impairments, mental retardation, emotional disturbances, or visual or orthopedic impairments. Employment of youth with speech impairments or emotional disturbances remains similar to that of youth with learning disabilities. The employment challenges of youth with mental retardation or with visual or orthopedic impairments have continued over time, with these youth continuing to be less likely to have a job than youth with learning disabilities. Positive changes have been found for youth with hearing or other health impairments.7 In 1987, youth in both these categories were significantly less likely than youth with learning disabilities to be employed. In 2001, the difference in the rate of employment for youth with hearing or other health impairments and for youth with learning disabilities was no longer significant, other factor held constant. However, the addition of several aspects of functioning to the analyses in 2001 that were not available for inclusion in 1987 could explain these differences.
The relationships of individual functioning, specifically self-care and cognitive mental skills, remain stable over time. Higher functioning is associated with a greater likelihood of employment. A difference is noted between 1987 and 2001 regarding the relationship of gender and employment. In 1987, males were significantly more likely to be employed than females, other factors being equal. In 2001, no independent relationship existed between gender and the rates of employment.
A comparison of analyses of school factors such as taking vocational education or having work experience in 1987 and 2001 would be premature because youth in NLTS2 are, for the most part, still involved in their education and preparation for employment and adult life.
Summary
Over the past several decades, a notable change has occurred in favor of the perspective that youth with disabilities are capable of determining their own futures. NLTS2 has investigated a variety of factors affecting the emerging independence of these youth, including skills that support and strengthen self-reliance, responsibilities that accompany an independent lifestyle, and activities associated with emerging independence.
Many youth have acquired skills to support independence, including those involving self-care, cognitive processing of information, mobility, and self-determination. Virtually all youth with disabilities have high self-care skills. About half of youth with disabilities have high functional cognitive skills, and only a small percentage do poorly in regard to these skills. About three-fourths of youth are reported to get around their neighborhoods “very well.” The self-determination skills involving persistence and asking for what one needs also are demonstrated by more than half of youth with disabilities.
7 When the original NLTS analyses were conducted, the federal disability category “other health impairment” included youth with autism. For this analysis only, youth with autism were included in the “other health impairment” category of NLTS2 so that the categories from the two studies would be commensurate.

6-22
Assuming responsibilities of daily living often is an expectation of youth as they mature. NLTS2 investigated the extent to which youth with disabilities have become responsible for a variety of typical tasks in the home and community, and for managing personal money. More than half of youth with disabilities always or usually prepare their own breakfast and lunch, and almost as many shop on their own, demonstrating emerging independence. Similar percentages are performing these tasks at least occasionally in the process of acquiring greater independence at home. Most youth have some experience managing their own money, but few have yet acquired the higher levels of financial management skills required to manage checking accounts or credit cards.
NLTS2 investigated two aspects of independence in the context of community: earning driving privileges and having regular paid employment. About one-third of age-eligible youth have acquired a driver’s license or permit, and more than half of youth have been employed at some time during a 1-year period.
The factors that have the greatest effects on youth’s acquisition of independence are their individual characteristics and capabilities. The specific nature of their disabilities, functional skills, and demographic characteristics are powerfully associated with their emerging independence.
Clearly, many youth with disabilities are making progress toward achieving independence. This conclusion is confirmed by school staff reports of youth’s progress toward their goals for transition to adult life. Youth have made the greatest progress on independent living goals, but their achievements toward goals of employment and self-advocacy also are notable.