Embed Size (px)
Citation preview

Full Terms & Conditions of access and use can be found athttp://www.tandfonline.com/action/journalInformation?journalCode=rsrs20
Download by: [University of Leeds] Date: 24 March 2017, At: 08:48
Regional Studies, Regional Science
ISSN: (Print) 2168-1376 (Online) Journal homepage: http://www.tandfonline.com/loi/rsrs20
The emerging geography of e-commerce in Britishretailing
Graham Clarke, Christopher Thompson & Mark Birkin
To cite this article: Graham Clarke, Christopher Thompson & Mark Birkin (2015) The emerginggeography of e-commerce in British retailing, Regional Studies, Regional Science, 2:1, 371-391,DOI: 10.1080/21681376.2015.1054420
To link to this article: http://dx.doi.org/10.1080/21681376.2015.1054420
© 2015 The Author(s). Published by Taylor &Francis
Published online: 02 Jul 2015.
Submit your article to this journal
Article views: 2300
View related articles
View Crossmark data

The emerging geography of e-commerce in British retailing
Graham Clarke*, Christopher Thompson and Mark Birkin
School of Geography, University of Leeds, Leeds, UK
(Received 16 December 2014; accepted 20 May 2015)
This paper explores the growth of e-commerce in British grocery retailing andexamines the spatial variations in e-commerce usage. The main data source is alarge commercial consumer survey (Acxiom’s Research Opinion Data) rarely usedby academics to date. Using these data in combination with census data, thepaper addresses a number of key questions. After outlining key trends in thedataset on e-commerce usage (by product and over time) the first research ques-tion is: How do e-commerce purchases vary by geodemographic group? Toanswer this question, we explore e-commerce usage by age, sex and social class.The second key question is: Does e-commerce usage vary by type of geographi-cal region? Thus, we explore variations in usage for urban and rural areas. Thedynamics of urban–rural diffusion are also addressed here – by examining, inaddition, the spread of broadband use across Britain. The last question is: Towhat degree do e-commerce sales vary by access to physical stores? This isaddressed by examining consumers’ home locations in relation to geographicalaccessibility. The results show that age and income are crucial demographic dis-criminators of e-commerce usage, as is rural location versus urban, and distancefrom physical stores.
Keywords: e-commerce; retail; geography; grocery; UK
Introduction
E-commerce is one of the main drivers of retail growth in many of the economies inthe developed world. A study in 2014 by the UK’s Centre for Retail Research estimatedthat retail businesses generated an estimated £38.8 billion from e-commerce sales in2013, with a forecast for £45 billion by the end of 2014. Thus, in 2013, market sharefor e-commerce sales in the UK was reported as being 13.5%. In the United States, theequivalent figures were reported at US$268 billion, or 10.6% of total sales (Centre forRetail Research, 2014).
In some markets (travel, books, DVDs, for example) the percentage of internet salesis undoubtedly higher, making up between 50% and 80% of all retail sales. In other sec-tors the contribution made by internet sales is significantly lower. Internet food sales,for example, are lower at around 5% (but also growing rapidly). Much of this growthhas been fuelled by increasing household access to broadband technology. The UK hasEurope’s second highest, and the world’s fifth highest, number of broadband subscrip-tions, although convergence is fast approaching across Europe (European Commission,2014). These higher consumer usage rates of broadband have enabled the UK to
*Corresponding author. Email: [email protected]
© 2015 The Author(s). Published by Taylor & Francis.This is an Open Access article distributed under the terms of the Creative Commons Attribution License (http://creativecommons.org/licenses/by/4.0/), which permits unrestricted use, distribution, and reproduction in any medium, provided the originalwork is properly cited.
Regional Studies, Regional Science, 2015Vol. 2, No. 1, 371–391, http://dx.doi.org/10.1080/21681376.2015.1054420

become a leading centre for online sales in general, and for online sales of groceryproducts in particular (compared with rates outside the UK).
According to some commentators in the 1990s, increased e-commerce activity waspredicted to spell the ‘death of distance’, implying that the market for e-commerce saleswould be less spatially differentiated than traditional store sales patterns (Cairncross,1997, being the most cited example). Although such predictions have been revised andthought out more carefully in recent years (Tranos & Nijkamp, 2013, for example, inrelation to economic geography more broadly), very little research has explored spatialvariations in e-commerce usage to test those predictions of the decline in importance ofgeography, and to examine whether in fact local geodemographics and distribution net-works might still impact crucially on the volume of activity. The aim of this paper is toinvestigate the geography of e-commerce activity in more detail, especially as seen inUK grocery retailing. It will be concerned exclusively with transactions between busi-nesses and consumers (B2C) rather than either business to business (B2B) or consumerto consumer (C2C). The paper makes extensive use of newly acquired data from Acx-iom Ltd, which provides a major survey of UK consumers and their shopping habits.The Acxiom data have significant advantages over surveys seen in the literature to date.The first is the size of the survey: it gathers detailed and up-to-date information onconsumer spending habits, preferences and socio-demographic information for over 1million UK consumers every year. Second, each household in the survey has a postcode– thus the richness in terms of geography is substantial. In addition, it is a longitudinaldataset that permits the study of a rapidly changing market. Our partnership withAcxiom provides a unique opportunity for academics to explore such rich datasets onthe geography and dynamics of consumer behaviour. The data are described in moredetail in the second section.
The third section explores the growth of e-commerce in the UK in more detail. First,we examine total growth and growth by different product groups. Then, from an exten-sive review of the literature, we set out an important set of hypotheses or issues that webelieve have major implications for the delivery and marketing of e-commerce products,allowing us to explore the geography of e-commerce in more detail in the fourth sec-tion. From that literature review we argue there are at least three major issues to beexplored in more detail. First, there are a number of studies that have highlighted differ-ences in activity rates by demographic group (e.g. Weltevreden, 2007). Thus, our firstresearch question is: To what extent does e-commerce usage vary by demographicgroup? Second, studies suggest that there are interesting rural/urban differences inusage: in short, ‘geography seems to matter for e-shopping’ (Farag, Weltevreden, vanRietbergen, & Dijst, 2006, p. 56). These differences are in part driven by variations inrural/urban access to broadband technology (Longley & Singleton, 2009; Longley,Webber, & Li, 2008). Thus, our second main research question is: To what extent doese-commerce usage vary by population density (urban/rural)? Third, and related to thesecond argument above, access to physical stores may also be important in understand-ing spatial patterns. Thus, our third main research question is: To what extent do we seegreater usage of e-commerce in areas where access to physical stores is limited? Suchareas might especially include rural communities, but could also refer to areas withincities that have poor access to major grocery retailers – so-called ‘food deserts’ (Clarke,Eyre, & Guy, 2002; Wrigley, Warm, & Margetts, 2003). Concluding comments areoffered in the fifth section.
372 G. Clarke et al.

The Acxiom Research Opinion Poll (ROP)
The primary aim of the ROP is to gather detailed and up-to-date information on con-sumer spending habits, preferences, socio-demographic information and the geographiclocation of respondents. The combination of these different pieces of information allowsfor detailed insights into the spending patterns of different types of people within differ-ent geographic areas. Moreover, with the survey being distributed annually and includ-ing questions not asked on other public sector surveys, it also provides a unique sourceof time-series data on the demographic and socioeconomic characteristics of people andhouseholds across the UK. The accuracy and robustness of Acxiom’s products for verysmall geographic areas are in part due to the quality and volume of data that the ROPsurvey delivers (Thompson, Stillwell, Clarke, & Bradbrook, 2010, has a broader reviewof quality issues). Table 1 demonstrates the number of questions and contents in eachsurvey between 2004 and 2010.
Table 1. Structure of the Acxiom Research Opinion Poll (ROP) questionnaire, 2004–10.
Year Questions Sections Section contents
2004 147 8 Hobbies & Activities; Shopping; Personal Care; About Your Home;Computer/Internet; Smoking; Motoring; You and Your Family
2005 163 14 Hobbies & Interests; Shopping; Drinks; Smoking; Pets; You & YourFamily; Motoring; Charities; Family Health; TV & Telephone;Computing & Internet; About Your Home; Financial Planning;Information Guides
2006 148 22 Groceries; Hobbies; Shopping; Your Interests; Drinks; Your Home;Outgoings; Your Occupation; Charities; You & Your Family; Pets;Family Health; Motoring; Financial Products; TV & Telephone;Computing & Internet; Local Area; Tobacco; Financial Planning;Planning Your Future; Information Guides
2007 136 25 Groceries; Shopping; Newspapers; Hobbies; Books; Home; HomeImprovements; Your Local Area; Occupation; Outgoings; FinancialProducts; You & Your Family; Motoring; Cars; Charities; FamilyHealth; Telephone & Internet; Shopping Channels; Leisure;Entertainment; Pets; Tobacco; Financial Planning; Retirement;Education
2008 133 27 Groceries; Shopping; Newspapers; Hobbies; Entertainment;Environment; Home; Home Improvements; Your Local Area;Charities; Occupation; Business Owner; You & Your Family;Family Health; Health Concerns; Outgoings; Internet; Telephone &TV; Financial Products; Financial Planning; Holidays; Pets;Education; Tobacco; Leisure; Motoring; Cars; TV Viewing
2009 130 26 Groceries; Shopping; Your Local Area; Hobbies; Newspapers;Coffee; Insurance; Environment; Internet & TV; You & YourFamily; Occupation; Outgoings; Home; Leisure; Financial Products;Charities; Telephone; Credit Crunch; Financial Planning; FamilyHealth; Technology; Education; Cars; Pets; Tobacco; ShoppingVouchers
2010 141 29 Groceries; Shopping; Coffee; Hobbies; Home; Home Improvements;Insurance; Household; Outgoings; You and Your Family; FamilyHealth; Financial Products; Charities; Occupation; Your Local Area;Internet; Telephone; Technology & TV; Financial Planning;Environment; Research; Animal Welfare; Leisure; Tobacco;Education; Skills; Cars; Newspapers; Shopping Vouchers
Regional Studies, Regional Science 373

Table 1 indicates that the ROP offers a large number of questions across a range ofdifferent areas. For example, the 2009 survey boasts 130 questions spread across 26different sections. The survey covers topics such as consumption and expenditure(Groceries, Shopping, Newspapers and Outgoings), preferences and opinions (Environ-ment, Charities and Local Area), health and education (Family Health, Education, andYou & Your Family), demographics and geography (You & Your Family, and Home),and the economy (Occupation, Financial Products, Financial Planning and CreditCrunch). The ROP survey is undertaken twice a year, initially in September and then inthe following January. The results from these two surveys are combined into one datafile and are packaged up as the data for a complete year.
Acxiom ROP is the largest annual paper-based survey in the UK and the largestpopulation study outside of the decennial Census of Population. On average, Acxiomhas received over 1 million household responses from the ROP each year since 2004.The survey responses inevitably show a certain amount of variation between groups.For instance, there is a slight underrepresentation of younger and more affluent respon-dents and an overrepresentation of more elderly respondents. The sorts of bias found inthe survey are by no means unique, however, as they are often found in many officialsample-based surveys (Frosztega, 2000; Thompson et al., 2010). In a smaller sample,and for different purposes, then a case might perhaps be made for a need to reweightdifferent members of the survey population. However, even with the slight underrepre-sentations we are confident that the size of the survey allows us to present a series ofcomparisons between the activity and behaviour patterns of different groups with con-clusions that would be largely unaltered by the inclusion of weights. A similar strategy,based on a more detailed and critical examination of the Acxiom data, has beenadvocated elsewhere (Thompson et al., 2010).
Growth in e-commerce in the UK
Accurate predictions of the total e-commerce market are notoriously difficult to obtain,as argued in the Introduction. There are a multitude of surveys using different samplesizes and product ranges. As noted above, the Centre for Retail research in the UK esti-mates the retail market for e-commerce grocery sales in 2013 to be worth £38.8 billion.However, we know that market penetration varies by organization and by product. Someorganizations have been seen as market leaders in the development of e-commercestrategies and technologies, whilst others have had notable failures, especially a numberof early pure e-players who were ‘crippled by distribution costs’ (Wrigley & Currah,2006). In the UK grocery market, Tesco has been widely acclaimed as the leading gro-cery e-commerce provider, whilst Sainsbury’s and Waitrose had significant problems inthe 2000s with their strategies. Wrigley and Currah (2006) note the importance of hav-ing a workable ‘back region’ strategy of stores or distribution depots to support andhandle e-commerce orders (one of the reasons why e-commerce remains in their opiniona geographically grounded business). In addition, there is evidence that the quality ofwebsites is important in determining usage – e-commerce will expand more quickly ifthe sites are attractive, which might include reputation, reliability, ease of navigation,ability or ease of product substitution, design and ease of interaction (Chiagouris &Ray, 2010; Kang & Kim, 2006; Wrigley & Currah, 2006).
Stern (1999) was among the first commentators to identify a greater likelihood ofsuccess for certain products than others. According to Stern, low rates of growth ine-commerce are expected in markets such as food and drink, rising to moderate levels
374 G. Clarke et al.

of uptake in clothes and electrical goods. The highest rates of penetration are expectedin books and music/films. Later experience adds credibility to these suggestions. Thus,using data from the Dutch Multiscope panel, Weltevreden (2007) finds a 66% onlineshare for books and 62% for ‘CDs, DVDs and videos’, falling to 5% for shoes and 3%for outer clothing. Similar evidence from the Acxiom ROP is shown in Figure 1 for theUK market. On the basis of this evidence, it seems that e-retail activity levels are highbut steady for books, CDs and DVDs, and to a lesser extent for clothes. Although gro-cery sales are lower, expansion is still strong and, of course, there is a very large marketby both volume and value.
Figure 2 shows the growth in total e-commerce sales in the UK between 2006 and2011 as recorded by the UK Office of National Statistics (ONS). Alongside the generaltrend of escalating sales over time, punctuated with regular seasonal jumps at Christmas,it is useful when examining these figures to consider the thesis that e-commerce mightbe more important in times of economic hardship. Reynolds (2011) suggests the lowertransaction costs that e-business firms are often more easily able to generate may appealmore to customers who are more price sensitive, additionally arguing that UK onlineretailers generally did well in late 2009 and early 2010.
There is also a body of literature that has explored the frequency and nature of pur-chases online and attempted to classify consumers by their behaviour in this respect.Thus, Soopramanien and Robertson (2007) break their internet users into ‘browsers’ and‘buyers’ and argue that there are considerable differences in behaviour between thosepersons purchasing online, those who browse but do not purchase, and those whobrowse and then become purchasers. To explore the notion of different types ofe-commerce shopper we draw here on the model suggested by Mokhtarian (2002) inrelation to telecommunications, consumer dynamics and the impact of these changes ontransportation patterns in the city (although we note other frameworks may be equallyvalid and useful). She identifies four different ‘cross-mode’ relationships between modesof communication: neutrality, modification, complementarity and substitution. Weltevre-den (2007) transfers this framework directly to e-commerce:
• Neutrality: shoppers at physical stores who are not interested in e-commerce.• Modification: these consumers may remain loyal to physical stores but modifytheir behaviour to include infrequent purchases from the internet.
0.00
5.00
10.00
15.00
20.00
25.00
30.00
35.00
40.00
45.00
50.00
2007 2008 2009 2010
Hou
seho
lds
(%)
Books
Wine
Clothes
CDs/DVDs
Grocery
Figure 1. Percentage of households that use e-commerce ‘often’ to buy different products.Source: Acxiom Research Opinion Poll (ROP).
Regional Studies, Regional Science 375

• Complementarity: here shoppers seem to switch equally between physical storesand e-commerce, and may be frequent users of both. From the literature to datethis would seem the most frequent form of behaviour of those using e-commerce.Hernandez, Gomez-Insausti, and Biasiotto (2001), Ferrell (2004), and Farag et al.(2006) found that shoppers make extensive use of both modes of retailing andoften browse online before purchasing at physical stores.
• Substitution: shoppers at physical stores become almost exclusively e-commerceshoppers. There is less evidence of this to date, although a number of studies indi-cate that regular online shoppers now make fewer physical shopping trips (Ferrell,2004). This also relates to an interesting debate in the literature about whether e-commerce complements or conflicts with physical store retailing: the clicks andbricks versus the clicks or bricks debate (Burt & Sparks, 2003).
Some elements of an alternative framework for understanding demographic variationshave been provided by Wilson-Jeanselme and Reynolds (2005). The major purchasingcriteria are identified as time, quality and cost, and it is argued that consumer attitudesmay be separated into five groups, as shown in Table 2. In order to compete for thebusiness of each group, ‘order quality’ criteria need to be satisfied, and in order to cap-ture them then ‘order winning’ criteria are paramount. In addition to evaluating thecompetitiveness of e-retailers, this framework is suggestive of uptake for both products
0
100
200
300
400
500
600
700
0
1
2
3
4
5
6
7
8
9
10
(mill
ions
£)
(%)
MonthInternet retail sales, £ millions Internet Sales as % of total retail sales
Figure 2. UK internet retail sale estimates, 2006–11.Source: ONS (2011).
Table 2. Demographic segmentation by time, quality and cost.
Order winning Order qualifying
Quality on time Quality Delivery time reliability/subsTime and cost conscious Ordering time Delivery cost/qualityJust what I ordered Quality SubstitutesCost conscious Delivery cost 10% discountTime conscious Ordering time Delivery time reliability/subs
Source: Wilson-Jeanselme and Reynolds (2005).
376 G. Clarke et al.

(Figure 2) and also demographics. For groups who are ‘cost conscious’ (the elderly orless affluent perhaps) it might be expected that internet retailers could find it more diffi-cult to compete (especially in relation to e-grocery where distribution costs are typicallyadditional) than for those who are ‘time conscious’ (e.g. those with young families or inprofessional occupations).
Table 2 thus suggests that demographics are important in understanding differentconsumer uses and loyalties to e-commerce. This issue will be explored in more detailin the next section, which also introduces the importance of geography.
The geography of e-commerce
A socio-economic analysis
First, to test the significance of different socio-economic variables in the ROP data, weuse a binary logistic regression to investigate the likelihood of households using theinternet ‘often’ to purchase groceries, controlling for a range of explanatory variables(age, income, tenure, household size). Before presenting the statistical analysis, it isimportant to present a description of the dataset to show what percentage of respondentsfall into each factor level and what is the overall sample size. Table 3 shows the samplesize by three categories: ‘uses the internet often to buy goods and services’ (yes/no) andmissing = no response.
Logistic regression has many similarities with linear regression, but linear regressioncannot be used in this case because the outcome variable (grocery spend for e-com-merce) in the ROP is recorded categorically. The logistic regression equation expressesthe linear regression equation in logarithmic terms (called the logit) and thus overcomesthe problem of violating the assumption of linearity (Field, 2009). The exact form ofthe equation can be expressed in multiple ways; however, in this case equation (1)expresses the probability of Y occurring (the probability that a household belongs in acertain e-commerce grocery spend category):
PðY Þ ¼ 1
1þ e�ðeb0þb1x1iÞ (1)
where e is the base of natural logarithms; b0 is the constant; x1 is the predictor variable;and b1 is the coefficient (weight) attached to the predictor.
In terms of the defined model, the binary response variable (use the internet to pur-chase groceries) is represented as Y = 1 for ‘often’ and Y = 0 for everything else. Addi-tionally, crucial to the interpretation of logistic regression is the value of the odds ratio(exp(B)), which is an indicator of the change in odds resulting from a unit change inthe predictor (equation 2). If the odds ratio is greater than 1, then it indicates that as thepredictor increases the odds of the outcome occurring increases. Conversely, a value lessthan 1 indicates that as the predictor increases, the odds of the outcome occurringdecreases:
D oddsodds after a unit change in the predictor
original odds(2)
The outputs of the binary logistic regression models are shown in Table 4. Each variableincludes the odds ratio of using the internet ‘often’ to buy groceries (high usage) foreach category of a variable compared with the reference/base level (the first categoryfor each variable). An odds ratio greater than 1 means a household in that category is
Regional Studies, Regional Science 377
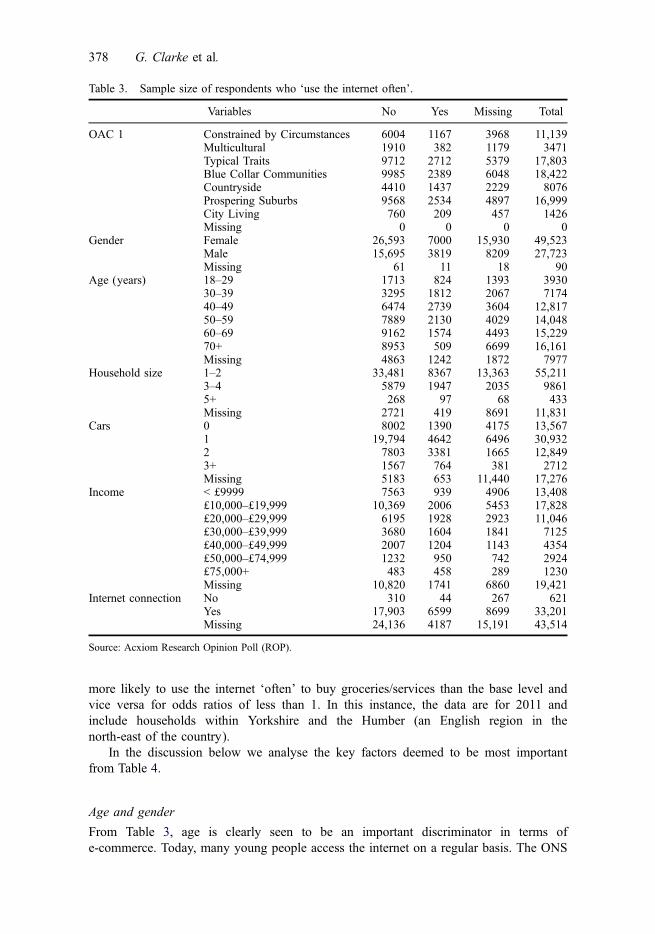
more likely to use the internet ‘often’ to buy groceries/services than the base level andvice versa for odds ratios of less than 1. In this instance, the data are for 2011 andinclude households within Yorkshire and the Humber (an English region in thenorth-east of the country).
In the discussion below we analyse the key factors deemed to be most importantfrom Table 4.
Age and gender
From Table 3, age is clearly seen to be an important discriminator in terms ofe-commerce. Today, many young people access the internet on a regular basis. The ONS
Table 3. Sample size of respondents who ‘use the internet often’.
Variables No Yes Missing Total
OAC 1 Constrained by Circumstances 6004 1167 3968 11,139Multicultural 1910 382 1179 3471Typical Traits 9712 2712 5379 17,803Blue Collar Communities 9985 2389 6048 18,422Countryside 4410 1437 2229 8076Prospering Suburbs 9568 2534 4897 16,999City Living 760 209 457 1426Missing 0 0 0 0
Gender Female 26,593 7000 15,930 49,523Male 15,695 3819 8209 27,723Missing 61 11 18 90
Age (years) 18–29 1713 824 1393 393030–39 3295 1812 2067 717440–49 6474 2739 3604 12,81750–59 7889 2130 4029 14,04860–69 9162 1574 4493 15,22970+ 8953 509 6699 16,161Missing 4863 1242 1872 7977
Household size 1–2 33,481 8367 13,363 55,2113–4 5879 1947 2035 98615+ 268 97 68 433Missing 2721 419 8691 11,831
Cars 0 8002 1390 4175 13,5671 19,794 4642 6496 30,9322 7803 3381 1665 12,8493+ 1567 764 381 2712Missing 5183 653 11,440 17,276
Income < £9999 7563 939 4906 13,408£10,000–£19,999 10,369 2006 5453 17,828£20,000–£29,999 6195 1928 2923 11,046£30,000–£39,999 3680 1604 1841 7125£40,000–£49,999 2007 1204 1143 4354£50,000–£74,999 1232 950 742 2924£75,000+ 483 458 289 1230Missing 10,820 1741 6860 19,421
Internet connection No 310 44 267 621Yes 17,903 6599 8699 33,201Missing 24,136 4187 15,191 43,514
Source: Acxiom Research Opinion Poll (ROP).
378 G. Clarke et al.

Table
4.Significanceof
keysocio-econ
omic
factorsforexplaining
high
e-commerce
usageforgroceries.
Variables
BSE
Wald
d.f.
Significance
Exp
(B)
95%
CIforExp
(B)
Low
erUpp
er
OAC
1Con
strained
byCircumstances
29.289
6.000
Multicultural
−.230
.102
5.08
61
.024
.794
.650
.970
Typ
ical
Traits
−.025
.062
.157
1.691
.976
.864
1.10
2BlueCollarCom
mun
ities
−.030
.062
.239
1.625
.970
.859
1.09
5Cou
ntryside
.225
.073
9.46
51
.002
1.25
21.08
51.44
4ProsperingSub
urbs
−.030
.065
.211
1.646
.971
.855
1.10
2City
Living
.109
.129
.712
1.399
1.115
.866
1.43
8Gender
Fem
ale
1.00
0Male
−.081
.036
5.119
1.024
.922
.860
.989
Age
(years)
18–29
309.40
25
.000
30–39
.027
.070
.149
1.699
1.02
7.896
1.17
940–49
−.213
.066
10.362
1.001
.808
.710
.920
50–59
−.551
.068
65.157
1.000
.577
.504
.659
60–69
−.652
.073
79.346
1.000
.521
.451
.601
70+
−1.22
0.103
139.47
51
.000
.295
.241
.361
Hou
seho
ldsize
1–2
9.08
82
.011
3–4
−.139
.047
8.87
61
.003
.870
.794
.954
5+−.162
.239
.464
1.496
.850
.532
1.35
7Cars
023
.337
3.000
1.121
.052
5.411
1.020
1.12
91.01
91.25
02
.233
.060
15.250
1.000
1.26
31.12
31.42
03+
.373
.087
18.516
1.000
1.45
21.22
51.72
0Income
<£9
999
274.04
26
.000
£10,00
0–£1
9,99
9.218
.064
11.466
1.001
1.24
41.09
61.411
£20,00
0–£2
9,99
9.413
.067
37.996
1.000
1.51
21.32
61.72
4£3
0,00
0–£3
9,99
9.626
.071
77.797
1.000
1.87
01.62
72.15
0£4
0,00
0–£4
9,99
9.860
.078
122.36
21
.000
2.36
42.03
02.75
3£5
0,00
0–£7
4,99
91.02
1.085
144.29
61
.000
2.77
72.35
13.28
1
(Con
tinued)
Regional Studies, Regional Science 379

Table
4.(Con
tinued).
Variables
BSE
Wald
d.f.
Significance
Exp
(B)
95%
CIforExp
(B)
Low
erUpp
er
£75,00
0+1.25
4.109
131.70
61
.000
3.50
42.82
94.34
1Internet
conn
ectio
nNo
1.00
0Yes
.907
.173
27.325
1.000
2.47
71.76
33.47
9Con
stant
−2.03
9.185
120.94
31
.000
.130
Note:
Odd
sratio
sshow
nin
italicsareno
tsign
ificantly
differentfrom
thereferencecategory.
380 G. Clarke et al.

show that 98.7% of 16–24 year olds have used the internet compared with only 23.8% ofthose aged 75 or more (ONS, 2011). An interesting study by FDS International in 2010(on behalf of the UK Office of Fair Trading – OFT) asked 1800 telephone intervieweesabout their e-commerce habits as well as their more general internet usage. Of thoseregular users of e-commerce there was again important demographic variations. Amongstthe 16–34-year age group, 45% were classed as regular users, with this figure decliningto 28% for 35–44 year olds, 10% for 55–64 year olds and only 5% for those aged 65+.Figure 3 shows the much more frequent use of e-commerce by young people seen in theAcxiom data.
Variations in e-purchasing patterns are also structured by gender, although this is aweaker discriminator in Table 4. According to the literature, men are consistently morelikely to patronize the internet than women (Weltevreden, 2007) and, as shown inFigure 4, those men who do use the internet are more likely to be frequent users in theROP data. This pattern holds for all groups up to age 40 and for those aged 50–74, andcould reflect the increased value attached by men to the (reduction in) time spentshopping, or perhaps a lower emphasis on quality.
Income
An appealing feature of the Acxiom data, as compared with the UK Census, for exam-ple, is extensive capture of individual and household income data. Thus, it is possible todemonstrate, as in Table 4, that the highest income households are those with the stron-gest e-retail preferences. Figure 5 explores the income data in more detail. On this mea-sure, the very wealthiest households are 10 times more likely to be frequent users thantheir low-income counterparts. Low usage is marked for all groups with an annualincome below £25,000, and even more pronounced below £10,000. There could besome interaction with the age variable here, so that the elderly who have already beenfound to be relatively low users are also often low earners. Uptake of broadband andinternet services is clearly also an important issue as typically low-income groupssimply lack access to the necessary technologies and funds (see below).
0%
10%
20%
30%
40%
50%
60%
70%
80%
90%
100%
Hou
seho
lds
Age (years)
Never
Rarely
Sometimes
Often
Figure 3. Percentage of households recording frequency of use of the internet to buy goods andservices by age.Source: Acxiom Research Opinion Poll (ROP).
Regional Studies, Regional Science 381

A geodemographic analysis
From Table 4 it can be seen that a number of output area classification (OAC)geodemographic groups are seen to be important discriminators of e-commerce activity.In particular, ‘countryside’ and ‘city living’, which contains more younger, professionalresidents. It is useful to consider whether some further discussion around geodemo-graphics could also provide important insights. In Table 5 a composite assessment usingthe UK OAC is provided. The UK OAC uses a combination of many socio-economic,demographic and housing variables to classify neighbourhoods into clusters of areasvarying from ‘transient’ to ‘settled’ and from ‘public housing’ to ‘prospering semis’(Vickers & Rees, 2007). The results show an interesting level of variation; for example,a threefold variation of ‘internet avoidance’ between ‘prospering younger families’ (only
0
5
10
15
20
25
30
35
40
18_2
4
25_2
9
30_3
4
35_3
9
40_4
4
45_4
9
50_5
4
55_5
9
60_6
4
65_6
9
70_7
4
75_7
9
80_8
4
85+
(%)
Age (years)Male Female
Figure 4. Percentage of households that responded ‘Often’ to the question ‘How often do youuse the internet to buy goods and services?’ by age and gender.Source: Acxiom Research Opinion Poll (ROP).
0% 20% 40% 60% 80% 100%
<£5,000
£5,000-£9,999
£10,000-£14,999
£15,000-£19,999
£20,000-£24,999
£25,000-£29,999
£30,000-£34,999
£35,000-£39,999
£40,000-£44,999
£45,000-£49,999
£50,000-£74,999
£75,000+
Households
Often
Sometimes
Rarely
Never
Figure 5. Variations in usage for the question ‘How often do you use the internet to buy goodsand services?’ by household income.Source: Acxiom Research Opinion Poll (ROP).
382 G. Clarke et al.

21.22% do not use the internet) and ‘senior communities’ (62.79%). Highest usageappears for groups ‘prospering younger families’ and ‘village life’. The lowest usagelevels appear for groups ‘senior communities’, ‘Afro-Caribbean’ and ‘public housing’(Picot-Coupey, Hure, Cliquet, & Petr, 2009, have a comparison analysis of Frenchdemographic groups most likely to shop online).
An inevitable reservation with this style of geodemographic analysis is the degree ofaveraging that takes place even when the census output areas (OAs) are relatively smallneighbourhoods in the order of only 120 households. Hence, ‘senior communities’, forexample, cannot be expected completely to exclude younger residents (the ‘ecologicalfallacy’; Birkin, 1995). Unfortunately similar classifications for individuals or house-holds are not available for this purpose (cf. Longley and Singleton, 2009, who suggesta classification of households with specific reference to their online behaviours; and alsoBurns, Birkin, Heppenstall, & See, 2012, in which a general-purpose individual andhousehold classification is currently in development).
Geospatial: urban/rural
Table 5 shows variations between different neighbourhood clusters reflecting underlyingdemographics and social geography. ‘Village life’ appears to have high internet usage. Itis an interesting debate as to whether we might expect rural e-commerce usage to behigher than urban. Rural consumers certainly face greater accessibility problems inrelation to physical stores and may thus find e-commerce and home delivery more
Table 5. Households purchasing goods online by output area classification (OAC).
Code Name Often Sometimes Rarely Never TotalInternet
connection
4a Prospering YoungerFamilies
23.62 39.32 15.84 21.22 100 91.96
3a Village Life 21.51 32.40 12.60 33.49 100 80.856a Settled Households 19.61 33.88 14.07 32.43 100 83.392b Settled in the City 18.90 34.55 12.80 33.74 100 80.333b Agricultural 21.27 31.52 15.37 31.83 100 82.963c Accessible Countryside 18.30 34.00 14.40 33.30 100 83.276c Young Families in Terraced
Homes19.72 31.16 14.53 34.59 100 82.32
6d Aspiring Households 19.14 30.93 15.93 34.00 100 84.194c Prospering Semis 17.41 31.91 13.62 37.05 100 82.286b Least Divergent 21.11 28.13 13.63 37.13 100 79.764b Prospering Older Families 17.09 31.68 14.47 36.76 100 82.924d Thriving Suburbs 16.07 31.08 15.25 37.60 100 84.621c Older Blue Collar 17.18 29.54 12.81 40.47 100 76.981b Younger Blue Collar 16.54 29.69 12.87 40.90 100 77.972a Transient Communities 18.11 26.77 18.11 37.01 100 82.881a Terraced Blue Collar 17.17 26.60 12.10 44.13 100 77.277a Asian Communities 15.36 27.59 14.73 42.32 100 79.275b Older Workers 15.57 25.42 12.40 46.62 100 73.345c Public Housing 13.38 24.71 11.97 49.94 100 72.147b Afro-Caribbean 9.50 24.50 14.50 51.50 100 67.295a Senior Communities 9.60 19.02 8.59 62.79 100 54.59
Total 17.73 30.15 13.54 38.58 100 83.11
Sources: Acxiom Research Opinion Poll (ROP), 2004–10; ONS (2001).
Regional Studies, Regional Science 383

convenient and ‘accessible’. In contrast, De Blasio (2008) concludes for e-banking thatinternet usage is more frequent among urban consumers than among non-urban onesand that e-commerce is largely unaffected by city size. In relation to the rural/urbanquestion, it is often argued that e-commerce is a predominantly urban phenomenonbecause new technology usually starts in centres of innovation (innovation-diffusionhypothesis; Farag et al., 2006).
Table 6 shows a profile of internet usage according to population density by resi-dence of user. The locations are classified into three bands according to the MLSOAurban/rural classification (where MLSOA is the Middle-Layer Super Output Area spatialscale of around 7000 households; ONS, 2013). While the patterns of variation thatemerge are not compelling, if anything what we see contradicts evidence to be foundelsewhere in the literature that urban areas are more important for e-commerce.
Perhaps these high contemporary rates for rural areas reflect the rise and diffusion ofbroadband technology over space. However, there has been little or no research to datedepicting changing broadband penetration for smaller geographical areas (although seethe useful static analysis in Longley & Singleton, 2009; Longley et al., 2008). Thus, itis useful to explore the growth of broadband usage across the UK using the annualAcxiom ROP data.
Figure 6 shows the very rapid rollout of broadband in the UK by government region(GOR). Overall connection rates start at around 57% in 2007, with a marked concentra-tion of internet access in London and the south-east of the country. In the next threeyears, availability accelerates quickly to a situation in which the vast majority of areasprovide internet access to more than 70% of households. Although there is still a patternof greatest concentration in the south and east, only the most extremely rural areas ofWales and the Southern Uplands of Scotland look to be relatively underprovided.
These changing patterns over time can be interpreted in a number of ways. In con-trast to the diffusion effect, it is rural users who have most to gain from electronictransactions (because they lack access to high-quality urban retail services; see below).Certainly, there is evidence outside the UK also that as internet technology spreads torural areas, there is a greater awareness and belief that this form of retailing can bemore relevant to rural consumers (Lennon et al., 2007). Another consideration here isthat place of residence could be becoming less important as a determinant of internetaccess. Thus, it could be that many users are actually accessing services from the work-place and increasingly from mobile devices, which could ultimately neutralize provisionto a considerable extent.
Given this diffusion of broadband diffusion from the south-east we might alsoexpect internet usage to be higher in similar communities in the south-east comparedwith further north – in other words, to see a higher market share within prosperingyoung families in the south-east compared with prospering young families in the
Table 6. Variations in usage for the question ‘How often do you use the internet to buy goodsand services?’ by Middle-Layer Super Output Area (MLSOA) urban/rural classification.
MLSOA urban/rural Often Sometimes Rarely Never Total
Urban Urban 17.11 29.78 13.55 39.56 100Rural Town and Fringe 20.33 31.17 13.25 35.25 100Rural Village, Hamlet & Isolated Dwellings 20.43 32.90 13.96 32.71 100Total Total 17.76 30.18 13.54 38.52 100
Source: Acxiom Research Opinion Poll (ROP).
384 G. Clarke et al.

north-east. The rationale for this hypothesis comes from surveys that have shown thatearly adopters of online channels are more likely to buy a wider range of products andmore frequently than late adopters (Chiagouris & Ray, 2010; Liu & Forsythe, 2011;Shih & Venkatesh, 2004). Figure 7 plots the spatial diffusion of e-commerce shoppingsince 2007; it seems to support the idea that on a like-for-like basis the more highlyurbanized consumers of the south are more advanced in their internet usage (see also
Figure 6. Households with an internet connection, 2007–10.Source: Acxiom Research Opinion Poll (ROP).
Regional Studies, Regional Science 385

Sinai & Waldfogal, 2004). However, the growth of e-commerce shopping in more ruralareas is striking by 2010, especially in Wales, Scotland and northern England.
Geographical accessibility
The rural/urban issue raises the efficiency hypothesis of Farag et al. (2006), whichargues that consumers are more likely to adopt e-commerce when their accessibility to
Figure 7. Frequent e-commerce usage by households in the UK, 2008–10.Source: Acxiom Research Opinion Poll (ROP).
386 G. Clarke et al.

physical shops is relatively low. They ask the question: Do people with low shopaccessibility, as in less urbanized or non-urbanized areas, buy more products online?This again may impact most on rural communities, but may also be applicable to areasof cities that lack good access to retail facilities. In a grocery context such areas havebeen labelled ‘food deserts’ (Clarke et al., 2002; Wrigley et al., 2003). The evidence sofar is rather limited. Sinai and Waldfogal (2004) did find high correlations betweenonline retailing for books and clothes and access to the nearest physical store, whilstFarag et al. (2006) found that people are more likely to adopt e-commerce when accessto physical stores is low.
The Acxiom data indicate the preferred grocery brand for each respondent as wellas their favourite retail destination and preferred distribution channel. This facilitates adirect comparison at OA level between the distance people are required to travel toaccess retail opportunities and their channel preference. So to further the explorationinto accessibility and e-commerce, Table 6 displays the average distance consumer’s tra-vel to their nearest grocery store (over 3000 square feet). The figures are also brokendown by the three main online food retailers and by ‘online’ (frequently use the internetfor grocery shopping) and ‘offline’ customers (never use the internet for grocery shop-ping. The results in Table 7 show strong support once more for the efficiency hypothe-sis. It is clear that for all the major grocers, online customers have much poorerphysical access to retail outlets than their offline counterparts. In all cases, online con-sumers have further on average to travel to their nearest grocery store than those whonever use the internet. This is most evident for those customers who shop at Asda. AsAsda stores are mainly large stores located in outer suburban areas, this might explainthe differences between brands (Tesco and Sainsbury’s have more mixed portfolios oflarge and convenience stores throughout the urban/rural landscape).
Towards a comprehensive city-wide view of e-commerce use
In this concluding section of analysis, we plot the small-area household internet usagefor one city, namely Leeds in the UK (Figure 8), and for groceries only. There arearound 10,000 households covered by the Leeds area (for this variable). The spatialunits are census OAs, the lowest spatial scale of census zones available. Given the dis-cussion above, these spatial variations in e-commerce use are thus likely to be the resultof a mixture of geodemographic, geospatial and accessibility issues.
First, Figure 8 can be seen to support the demographic analysis given in the fourthsection. High market share for e-commerce can be seen in the more affluent northern(semi-rural) suburbs to the north and north-east of the city (as illustrated in area A ofthe map). To the south and south-east of the city centre there is evidence of low marketpenetration for e-commerce (area B). These are some of the most deprived, densely
Table 7. Average distance travelled to the nearest grocery store by retailer for online and offlinecustomers.
Retailer Offline (miles) Online (miles)
Asda 2.54 4.90Tesco 2.12 3.47Sainsbury’s 2.44 3.14
Source: Acxiom Research Opinion Poll (ROP).
Regional Studies, Regional Science 387

populated neighbourhoods in the city. As some of these regions may also be perceivedto be in food deserts (or at least areas with lower accessibility to the largest stores), itmight be argued that they are more likely to use e-commerce (on the accessibility argu-ment above). However, it can be seen that this is not the case. Thus, perhaps geodemo-graphics are more important than accessibility issues alone. There is a massive ironyhere: the very areas that could benefit the most from e-commerce in terms of improvingaccess to high-quality fruit and vegetables are the areas that can least afford to do so. Inaddition to direct access costs (computer hardware, broadband etc.) the delivery chargefor most e-commerce operating systems makes this mode of distribution even more pro-hibitive to low-income consumers. To add to that injustice, some firms have alreadyblacklisted certain public housing estate areas on the basis of fear of crime and harass-ment of drivers (e.g., Schlesinger, 2010).
Area C in Figure 8 forms another area of high internet use. This is associated withthe university area and student households in Hyde Park and Headingley. Although stu-dents are not high-income earners, their age profile fits the geodemographic analysisabove, and of course many are highly computer literate with a high likelihood of adopt-ing new technologies. Area D is a very rural area of Metropolitan Leeds and again sup-ports the hypothesis of increased use by rural householders.
Conclusions
In this paper the latest evidence from a major survey of consumption patterns in the UKpopulation has been examined to provide an understanding of internet retailing trends,
Figure 8. Online grocery penetration by the lower Super Output Area in Leeds.Source: Acxiom Research Opinion Poll (ROP).
388 G. Clarke et al.

with special reference to e-grocery. Online retail sales are growing; however, they arestill far behind those generated from stores. Grocery sales lag significantly behind otherproducts including books, DVDs and videos, but are continuing to grow rapidly. Onlineconsumers are most likely to be men aged 25–44 years, affluent and living in city cen-tres. While e-commerce did originally diffuse out from London and the main cities, it isno longer just an urban trend. There is evidence of increasingly high usage in ruralareas due to increased quality in broadband services. In the case of the grocery marketpeople are more likely to adopt e-shopping the further away they live from a supermar-ket. However, these interactions are complex, particularly in urban areas wheresocioeconomics and demographics can override accessibility effects.
There is still a lot of research to be undertaken in exploring the geography ofe-commerce. One outstanding task is to explore the spatial variations in the locations ofconsumers who shop at stores and those online for the same organization. An interestingquestion remains about whether e-commerce provides access to a different set of cus-tomers for a particular retailer or merely serves existing face-to-face customers more com-prehensively. If this question can be answered, then many retailers could betterunderstand the importance of e-commerce in capturing new sales. It would also help themdecide on suitable distribution strategies for growing in areas of low market share; newstores versus ‘virtual’ stores (sometimes called dot.com or even ‘dark’ stores) servinginternet customers from distribution depots, or stores where the shoppers are only retailemployees (Tesco, for example, in 2012 had four ‘dark’ stores ringing London, in Enfield,Croydon, Aylesford and Greenford, with another three in prospect in Didcot, Erith nearDartford and in Crawley; Wood, 2012). Coupled with the kind of geodemographic analy-sis provided here on consumer usage of e-commerce, this would provide a powerfulframework for incorporating e-commerce fully into the retail distribution chain.
Disclosure statementNo potential conflict of interest was reported by the authors.
FundingThis work was supported by the ESRC (RES-187-24-0015).
ReferencesBirkin, M. (1995). Customer targeting, geodemographics and lifestyles approaches, Chapter 6. In
P. Longley & G. Clarke (Eds.), GIS for business and service planning (pp. 104–149). London:Longman.
Burns, L., Birkin, M., Heppenstall, A., & See, L. (2012, 22–24 August). Geodemographics: Creat-ing a classification at the level of the individual. In European Congress of the RegionalScience Association International. Bratislava. (Unpublished).
Burt, S., & Sparks, L. (2003). E-commerce and the retail process: A review. Journal of Retailingand Consumer Services, 10, 1275–1286.
Cairncross, F. (1997). The death of distance. Boston, MA: Harvard Business School Press.Centre for Retail Research. (2014). Online Retailing: Britain, Europe and the US 2014. Retrieved
from http://www.retailresearch.org/onlineretailing.phpChiagouris, L., & Ray, I. (2010). Customers on the web are not all created equal: The moderating
role of internet shopping experience. International Review of Retail, Distribution and Con-sumer Research, 20, 251–271.
Regional Studies, Regional Science 389

Clarke, G. P., Eyre, H., & Guy, C. (2002). Deriving indicators of access to food retail provisionin British cities: Studies of Leeds. Bradford and Cardiff, Urban Studies, 11, 2041–2060.
De Blasio, G. (2008). Urban–rural differences in internet usage, e-commerce and e-banking:Evidence from Italy. Growth and Change, 39, 341–367.
European Commission. (2014). Broadband markets, Digital agenda Scoreboard 2014. Brussels:European Commission.
Farag, S., Weltevreden, J., van Rietbergen, T., & Dijst, M. (2006). E-shopping in the Netherlands:Does geography matter? Environment and Planning B, 33, 59–74.
Ferrell, C. E. (2004). Home-based teleshoppers and shopping travel: Do teleshoppers travel less?Transportation Research Record, 1894, 241–248.
Field, A. (2009). Discovering Statistics Using SPSS. London: Sage.Frosztega, M. (2000). Income distribution data for great Britain: Robustness assessment report.
Department of Social Security. Retrieved from http://statistics.dwp.gov.uk/asd/hbai/frsrar2.pdfHernandez, T., Gomez-Insausti, R., & Biasiotto, M. (2001). Non-store retailing and shopping
centre vitality. Journal of Shopping Centre Research, 8, 58–81.Kang, Y., & Kim, Y. J. (2006). Do visitors’ interest level and perceived quality of web page
content matter in shaping the attitude towards a website? Decision Support Systems, 42,1187–1202.
Lennon, S. J., Kim, M., Johnson, K. K. P., Jolly, L. D., Damhorst, M. L., & Jasper, C. R. (2007).A longitudional look at rural consumer adoption of online shopping. Psychology and Market-ing, 24, 375–401.
Liu, C., & Forsythe, S. (2011). Examining drivers of online purchase intensity: Moderating roleof adoption duration in sustaining post-adoption online shopping. Journal of Retailing andConsumer Services, 18, 101–109.
Longley, P., & Singleton, A. D. (2009). Linking social deprivation with digital exclusion inEngland. Urban Studies, 46, 1275–1298.
Longley, P., Webber, R., & Li, C. (2008). The UK geography of the E-Society: A nationalclassification. Environment and Planning A, 40, 360–382.
Mokhtarian, P. L. (2002). Telecommunications and travel: The case for complementarity. Journalof Industrial Ecology, 43–57.
ONS. (2011, May 18). Internet access quarterly update, Office of National statistics. London:ONS.
ONS. (2013, February 22). Rural/Urban Definition (England and Wales). Retrieved from http://www.ons.gov.uk/ons/guide-method/geography/products/area-classifications/rural-urban-definition-and-la/rural-urban-definition–england-and-wales-/index.html
Picot-Coupey, K., Hure, E., Cliquet, G., & Petr, C. (2009). Grocery shopping and the Internet:Exploring French consumers’ perceptions of the ‘hypermarket’ and ‘cybermarket’ formats.The International Review of Retail, Distribution and Consumer Research, 19, 437–455.
Reynolds, J. (2011). Perspectives on the future of retail e-business technologies, Retail Digest.Summer/Autum/Winter2010 Spring 2011, 26–33.
Stern, N. Z. (1999). The impact of the internet on retailing. International Trends in retailing, 16(2), 71–87.
Schlesinger F. (2010, March 31). Tesco refuses to deliver food to residents... because their streetis blacklisted as ‘a bad area’, Mail Online. Retrieved from http://www.dailymail.co.uk/news/article-1262276/Tesco-refuse-deliver-disabled-woman-street-blacklisted-bad-area.html
Shih, C. F., & Venkatesh, A. (2004). Beyond adoption: Development and application of a use-diffusion model. International Journal of Research in Marketing, 68, 59–72.
Sinai, T., & Waldfogal, J. (2004). Geography and the internet: Is the internet a substitution or acomplement for cities? Journal of Urban Economics, 56, 1–24.
Soopramanien, D. G. R., & Robertson, A. (2007). Adoption and usage of online shopping: Anempirical analysis of the characteristics of ‘buyers’, ‘browsers’ and ‘non-internet shoppers’.Journal of Retailing and Consumer Services, 14, 73–82.
Thompson, C. Stillwell, J. C. H., Clarke, M., & Bradbrook, C. (2010). Understanding andvalidating Acxiom’s research opinion poll data. Working Paper 10/06, School of Geography,University of Leeds.
Tranos, E., & Nijkamp, P. (2013). The death of distance revisited: Cyber‐place, physical andrelational proximities. Journal of Regional Science, 53, 855–873.
390 G. Clarke et al.

Vickers, D., & Rees, P. H. (2007). Creating the UK National Statistics 2001 output area classifica-tion. Journal of the Royal Statistical Society: Series A (Statistics in Society), 170, 379–403.
Weltevreden, J. W. J. (2007). Substitution or complementarity? How the Internet changes citycentre shopping Journal of Retailing and Consumer Services, 14, 192–207.
Wilson-Jeanselme, M., & Reynolds, J. (2005). Competing for the online grocery customer: TheUK experience. In N. Kornum & M. Bjerre (Eds.), Grocery e-commerce: Consumer behaviourand business strategies (pp. 7–35). Cheltenham: EE publishing.
Wood, Z. (2012, November 30 Friday). Rise of the dark store feeds the online shoppers. TheGuardian. Retrieved from http://www.guardian.co.uk/business/2012/nov/30/dark-stores-feed-dotcom-shoppers
Wrigley, N., & Currah, A. (2006). Globalising retail and the ‘new e-conomy’: The organizationalchallenge of e-commerce for the retail TNCs. Geoforum, 37, 340–351.
Wrigley, N., Warm, D., & Margetts, B. (2003). Deprivation, diet, and food-retail access: Findingsfrom the Leeds ‘food deserts’ study. Environment and Planning A, 35, 151–188.
Regional Studies, Regional Science 391