Embed Size (px)
Citation preview

XXXIV INTRODUCTION-DISCUSSION OF THE POPULATION.
THE ELEMENrrs OF THE POPULATION. THE POPULATION OF THE UNITED ST.A.TES CLASSIFIED BY SEX.
TABI.E XVl.-THE PROPORTIONS OF THE SEXES IN THl~ SEVERAL STATES AND TERRITORIES, AND JN THE UNITED ST.ATES, WITH A SUMMARY OF 'rHE CHANGES DURING THE PAST DECADE.
Numlier of femnles fo Number of females to 100, 000 mules. 100, 000 males.
Stutes and territories. Malo. Female. States and territories. Male. Female.
1870. 1880. 1870. 1880.
----'.l.'bo United States ... 25, 518, 820 24, 036, 963 07, 801 96, 514 Mississippi ............. 507, 177 504, 420 100, 261 99, 513
::::::::::=::::;;:;::::= Missouri. .............. l, 127, 187 1, 011, ms 92, 034 92, 370 .A.labnma ......•.•.•••.... 622, 629 039, 876 103, 993 102, 770 Montana ................ 28, 177 10, 082 22, 801 38, 975 .A.rlzoua ................. 28, 202 12, 238 40, 235 43, 804 Nebrnaka ............... 249, 241 203, 101 74, 644 81, 511 Arkansas ................ 4rn, 210 386, 240 95, 146 92:1 785 Nevada ................. 42, 010 20, 247 31, 230 48, 185 Cnlifomi~ .•.....•.••..... 518, 176 346, 518 60, 300 66, 872 New Hnmpshire ........ 170, 526 170, 405 104, 510 103, 482 Colorado ................. 129, 131 65, 190 60, 012 50, 489 Now Jersey ............ 5fi9, 922 571, 104 101, 502 102, 013 'Connecticut ............. 305, 782 316, 918 102, 000 103, 641 Nriw Mexico ............ 04, 406 55, 0(9 94, 017 85, 383 Dakota .................. 82, 290 52, 881 uO, 732 64, 257 ' Now York .............. 2, fi05, 322 2, 577, 5·i9 102, 003 102, 882 Delawnrl} ................ 74, 108 72, GOO OD, 615 97, 830 ' North C1trolin1t ......... 687, 908 711, 842 100, 546 103, 479 Dist1·ict of Colmnbi11 .... 83, 578 94, 040 111, 704 112, 5241 Ohio .................... 1, 013, 930 1, 584, 120 99, 204 081 Hi2 Floridii, .................. 130, •144 ms, 049 98, 574 97, 511 Oregon ................. 103, 381 71, 387 71, 1~0 60, 052 Georgia .................. 762, 981 779, 109 104, 525 102, 125 Ponnsylvnnfo ........... 2, 1301 055 2, 146, 23Cl 100, 282 100, 448 Ido.ho .................... 21, 818 10, 702 23, 104 49, 463 Rhodo Island ........... 133, 030 143, fiOl 107, 485 107, 870 Illinois .................. 1, 586, 523 1, 401, 348 02, 022 01, 001 South Carolina. .......... 490, 408 505, 100 105, 176 103, 009 Imlinnit .......... ,. ...... 1, 010, 301 967, 940 00, 880 05, 801 Tnnnessno .............. 769, 277 773, 082 101, 807 100, 494 Iowa ..................... 848, 130 776,470 90, 703 01,ma Tcima ................... 837, 840 753, 900 93, 203 89, 082 Kansas .................. 536, 007 459, 420 80, 196 85, 607 Utnh ................... 74, 509 OD, 454 00, 700 03, 215 Kentucky ............... sa2, uno 816, 100 08, 447 08, om Vermont ................ 166, 887 10:;, 300 99, 402 99, 108 Lonlaiana ................ 408, 754 471, 102 100, 714 100, 520 Virginia.~_ .... --·---- .. 745, 589 706, 970 105, 200 102, 808 Maine ................... 32·1, 058 324, 878 100, 226 100, 253 Washington ............ 45, 973 29,Ul.l 59, 807 63, 301 :Marylancl. ............... 402, 187 472, 756 102, 838 102, 280 West Virginia .......... 314,405 303, 902 98, 352 90, 050 :M(lssachusetta ........... 858, 44() 924, 645 107, 075 107, 712 Wisconsin .............. 680, 069 ()35,428 03, 558 93, 435 :Micl1igan ................ 802, 855 774, 582 91, ai4 89, 821 Wyoming ............... 14, 152 0, 037 26, 306 46, 897 :?.finnesota ............... 410, 149 301, 624 86, 871 80, 275
TABLE XVII.
A.-FEMALES IN EXCESS IN 1880.
a-States and territ;ories in which the excess of females is 5 per cent. of the males, or more:
District of Columbia., having 112,524 females to 100,000 mnles. Rhocle lslrmcl, lmviug 107,870 females to 100,000 males. 1\fassachusetta, having 107,712 females to 100,000 males.
b-Statcs in which the excess is from 2t to 5 per cent. of the males:
Connecticut, having 103,641 females to 100,000 males. New Hampshire, having 10::1,482 females to 100,000 males. Nort.h Carolina., having 103,479 females to 100,000 run.Jes. South Cnrolinn, having 103,009 females to 100,000 males. New York, lrnving 102,882 females to 100,000 males.
Virginia, having 102,868 females to 100,000 males. Alabama, having 102,770 females to 100,000 males.
c-States in which the excess is less thau 2t per cont. of Lho males:
Marylancl, having 102,28[) females to 100,000 males. Georgia, having 1021125 females to 100,000 urnles, Now Jersey, having 102,013 females to 100,000 males. Louisiana, having 1001520 fcmnfos to 100,000 males. Tennessee, having 100,494 females to 100,000 males. Pennsylvania, having 100,448 females to 100,000 males. Maine, having 100,253 females to 100,000 males,
B.-MALES IN EXCESS JN 1880.
a-States in which tho number of fomales is 95 per cent. or more I b-Statcs ancl territories in which the number of females is DO to of the number of males : 95 irnr cent. of th(l number of males:
Mississippi, having 99,513 females to 100,000 m(l.les. Vermont, having 99,108 females to 100,000 mnles. Ohio, having !lS,152 females to 100,000 males. Kentucky, lrnving 98,019 females to 100,000 mnles. Delaware, having 07,830 females to 100,000 males, Florida, having 97,511 females to 100,000 males. West Virginia, having 96,650 ftmales to 100,000 males. In<linna, having 95,801femalesto100,000 males.
Illinois, Jmving 94,001 females to 100,000 males. Wisconsiu, haviug 03,435 females to 100,000 male8, Utah, having 93,215 females to 100,000 males, Arkansas, having 92, 785 females to 100,000 males. Missouri, having 92,370 females to 100,tJOO males. Iowa, having 911551 females to 100,000 mnles.
I
i'
' i i !
~·
;' ::._

I I
-·
i
.)
I I
I I
i"rinz,1.ta,~rn. tn4:ru·s.
..iJla/&v tit.. r..L-a~s.l.t!6';•; tlu.ut !i Jll!!Yt'llt
lruilO-~. "~.,
10,. 20... ..
===----
~--
\-11" _ mi·'
M_AP OF THI~ r 1::.-, S' S 'I~ ~ r_J_:.. ~ED . -.4.'1.... u N I '1 - SHOWING- N(" S.EX
. OMINATL J ... ' . THE PRED ' T F.EliM.LES INT!fr. "':I.LES AND _ , L"'\:CESS OF ~•i.: ' 'OPUI.,\TION
THE LOCAL JTION OF TO'L.\L .E 1' th Census. . DLS1'RIBU . f Populatiuuatthe en
. tho Returns o Cnmpiledtrom 1880.
-- ----~-----...-... ,-~!) ---'"- T~" "

THE PROPORTION OF THE SEXES.
B.-·MALES IN EXCESS IN 1880-Continned.
c-States and territories in which the nuniber of females is 80 tb 90 Dakota, having 64,257 females to 100,000 ma,les. Washington, having G'.3,391 females to 100,000 males. Colorado, having 50,489 females to 100,000 males.
per cent. of the unmber of males:
xxxv
Textis, h:wing 89,982 females to 100,000 males. Michigan, having 89,821 females to 100,000 males. Miuncsofo,, having 86,275 females to 100,000 males. Kansas, lmviug 85,607 females to 100,000 males. New Mexico, having 85,383 females to 100,000 males.
e-States and tllrritorics in which the numbe1: of females is less than
· Nebraska, having 81,51 l females to 100,000 mitles.
d·-States aml territories iu which tlie number of females is 50 to 80 iier cent. of the munber of males:
Oregon, having 69,052 females to 100,000 males: CaJif'ornia, having 66,872 fomales to 100,000 males.
50 per cent. of the number of ma1cs :
Idaho, having 49,463 fomnles to 100,000 males. Ncvadit, having 48,185 females to 100,000 males. 'Vyoming, having 46,897 females to 100,000 males. Arizona, having 4:.l,394 females to 100,000 males. l\fontmrn, having 38,975 females to 100, 000 males.
As will be noticed, the preponderance of females is in the Atlantic region. Iu the whole tier of states which lie along the Athtntic coast, with the sole exception of Delaware, females are in excess.
. Of the states along the Gulf, there are more females tllan males in Alabama ancl in Ijouisiana. These, with Tennessee in tho interior, are the only states in which females are in excess. This excess reaches its maximum in the District of Columbia. In tlie southern portion of this tier of states the excess is but sligl1t, while in the northern part it is very decided, showing markedly the effect of the westward emigration of the male element, and of the existence of manufactures of a class which especially employ female labor, such as the manufacture of boots and shoes, of paper, and of cotton goods. In the l\Iissi:-isippi valley the excess is slightly on the side of th0 males, indicating tha,t the JlOpulation of that region is not a normal one, immigration entering to disturb the natural proportion of the sexes. The m.ost markeLl cn,ses of the excess of males are in the territories u.nd newer states of the West, where settlement is recent, where immigration is still active, ancl where the luxuries and the comforts of life are greatly al.Jl'idged by the necessities of frontier existence. Especially is this t.rue in those states and territorie8 where mining and cattle raising a,re the principal occupations. Of these the most marked examples are Montana, Arizona, Idaho, Wyoming, and Nevada, in which uiore than two-thirds of the riopnlation are males. New Mexico, although a territory, has been nuder different conditions from most of the otl!ers. It has long been settled b;r a permanent class of farmers and graziers of Mexican blood. Utnh, too, is peopletl rnainl;r by a setrtlecl communit,y of farmers having families. The existence of polygamy, also, goes to account for the nearly equal proportion of females in this territor;}', in spite of its comparatively recent settlement.
T,rnm XVIII.-CHANGE:3 SINCE lSiO IN THE RELATIVE PROPOR'rIONS 0~' 'l'HE SEXES, AS EXPRESSED BY THE NUMBER . OP FEMALES ·ro 100,000 MALES .
.tl.-Females inareaserl. Maine. - - __ .. - - - -- .• _. - -• _ - - .... -... _ - - .. __ . -... _. _. _ • __ . 27 Pennsylvania ____ - . ·-- _. ·-- --· __ --·· ___ -· ... __ -· .. _ __ _ _ __ 166 New York----··---··-·-·· .• · .•.• ·- .. _. - .. -·· ·- _ ·-· ..•• -·· 279 Missouri-----·-·--·········-----··--·-·----··----·...... 336 Rhode Islancl ........ - .......... - ..•..•.••... _. . . . . • • • • . 375 Nllw Jersey .............. --··-· .... .••• .••• •••• .... . .... 511 Massachusetts .....•. -- . . • • • • . . • • • . . • . • . .•••. _. . . . . . . . . . 637 District of Columbia ... - .......•...•....•• ···-. ---·· ... . 7GO Iowa .... _ ........... --·····-·· ...........••. --··........ 7tl8 Connecticut. - . _ _, ..•.. - . - ...•....•.•. ·-·- .. -- . . . .• • • •. •. 1, 035 Illinois ....• ----·--·-· .•.•.•.•.•.. -·-·................... 1, 079 Arizona ........ -- -•...... - .......•...•.. _ •....... _ . • • • . . 3, 159 vVashington ................................. •..•....• :~. 3,584 Dakota -- . -- ..• : ••.•••....•.•.••••...... - - . . .. •••• .• .••• 4, 525 Kansas .•.••......... ·-···· ......••.......•••..••.. ··-··· 5,411 California .•... _ ...... - -- .•....••••..••••.... __ . ___ .. .... G, 563 Nllbraska •..•.•.••. ---···-··· ....... ·---······· .••••.• .. 6,867 Montana·-·-·· ............................ ··--·-·-· .•..• 16, 174 Nevada --- ...•.••.• __ ........ -- ........ ···-··. _ •••.. -· __ 16, 955 Wyoming •..•.••••...•. -·-- .... ·-·--·................... 20, 591 Idaho .................................... ·-·-··•........ 26, 359
· B.-JJ'omales dec,-aased.
Wisconsin ..................... - .• _ ••..• - ...... -•...•.. - . Louisiana._ ............................................ . VCJl·mont .......... _ ........•......•..••••...•.•..•.•.••• Kentucky_ ...••••••.•.......••..•.....•••. _ ....... - .••. Marylanrl .................... ---· --·-·· •••. ·----- ---·-·. Minnesota .... --·· ...................................... . Missii'.Sip1Ji ....... -.........•. -• · - - .• • : • . • • ·••· · · • ••• --- · New Hampshire .•..•...•...••.. ---· •••••......••.•...... Flo1·ida . _ •............... _ ...•••.. - -••.••••••.••• - ..•.•. Ii1(liana ... - ........•••....••. ··-··- .••••••••••.•.......• Ol1io .• - - •.......••. - ...... -- -• • • •• · · • • · · - - · · • · - • · • • • · · · · A1almma .......................... -··- ---· ........ ,, ___ _ TenneHsee ........•........ -••....•..•.•.• - .•.....•.. - ... West Virginia .• -•....••••....•...•....•••.••.• __ ;_ .....• Delaware ................. -.• -.... - ••• ----······-········ :Michigan ......... _., ..••. __ .•...•....•••.. - .• -··· •••••. Oregon. __ .··-· ............••....•••... _ .. _ .. _ ...•......• South Carolina ....................... _ •..•...... - - ...... . Virginia .... ------······ ..•........•.••• ··-···---···-··-Arkansas.- ....... -··.--·-·--·····--- .•• -· - -· •• - - -- ··-· -· Georgia ......................... __ ..•.•..••.....•..•... North Carolina . -•• " •••.•.. _ .....• - ••..• - -............. .. Texns. ___ ........ ···- -·-····· ···- -·-· .••••.•••• ·--· -···· 1Jtah .... ··-· .......................................... -New JYfexico .••... , . . . . • . _ ..•..••.......• _ ••....• -.•..•• Colora(lo ...................... _ •.. _ .................... .
123 1\)4
35<1 428 552 596 748
1,028 1,063 1,070 1,112 1,223 1,403 1,702 1,7tl5 1,853 2,078 2,167 2,332 2,361 2,400 3, 067 3,281 !l,485 9,534
10, 123
In the United States, as a whole, there has been during the past clecacle a reln,tive loss of females in comparison with males to the extent of 1,257 females to each 100,000 males.

XXXVI INrrRODUO'l'ION-DISTRIBUTION OF rrHE POPULATION.
TABLE XIX.-CHANGES IN THE PROPORTION OF FEMALES SINCE 1870.
I. States 01' territories in ·which nwles were in excess in 1870, and 'in which the proportfon of females has iiim·oasecl ililring the decade :
.Arizoua, California, Dakota, I<labo,
Il1iuois, Iowa, Kansas, Missouri, Montana,
Nobrnska1
Nevada, Waslliugtou, Wyoming.
II. States m· terri.tories in which females were in excess in 1870, ctnd in ?,ohfoh the JJropoi·tion of females ha.9 inorea11c17. diwing tlie tlecade:
Connecf.icnt., District. of Columbia, Maino,
Massachusetts, New Jersey, New York,
Pm111Hylvnnirt, Rhod() IHlmul.
III. States or territories in which males were in excess in 1870, and, in which the p?'Oportfon of fernale11 has deoreascil during tlw deca1Ze:
Arkansas, Colorado, Dela.ware, Florida, Indiana,
Kentucky, Michig11u, Minnesota,
·New Mexico, Ohio,. Oregon,
Toxns, Utah, Yormo11t, West Virginia, Wisconsin.
IV. States or territories in which females were in exces.9 in 1870, anil in 1vhich the proportion of fema,Zos ha,~ c7eoroaseil ifaring the deca.dc:
Ala.baurn, Georgia, Louisiana,
1vforylam1, Mississippi, Newifampsllire, North Cttrolina.,
Soni;h Caroliirn, Virginia, '!'Olllll18~0(),
In old, settled agricultural communities the sexes shonkl be very nearly equal iu nnmber, females being slightly in excess. The southern statos present us with the best example of this class of popuhttion. There m·e fow lnrg-11 cities in this section; there is little immigration or emigratfon. The coneentration of popnlfttiou into (\itiuH, IJw growth of manufactures an cl the mil1ing industry, immigration and emigTation, all tcrnl to distmb the l10l'111n.l l 011lnt.ion of the sexes. All markecl cases of change since 1870 in the above tttble mm be explain ml i-;impl,y: In Now Bngfond and the middle Atlantic states there has been little change, but that little has generally hmm rt proportional i11(11'(1aso of females, due to emigration of nmles westward and to the increase of textile uumnfaeturcs at 1101110 of a 11lasH whi<•.h largely em1)loy female labor. Eruigratfon from this region, however, has bet•n in pmt disgnil'lrnl h,Y i1muigTnl.iou inl«1 these states from foreign lauds, attracted by the increase in mannfaetming in<lnstrios. Jn Uw south At1ml1.io urnl the Gulf states there has been a marlrncl increase in the relative proport.iou of males. 'J'ho eanse fol' this elmng-11 is probably to be found mainly among the people resident therein, aml not in m.:t;rancons i111lmmoPH. Tr, mny wit:ll confhlence be ascribed i1minly to the effort of nature to restore t;he normal equilibrinm betwce11 the st1xes whi\'.l1 wn.s disturbed by the war.
In the states of the Mississippi valley the cha,uges u.re not extensfre, and (liffor in (lift'm·ent statmi, JH'<1011111I iJig no safient points. In the border states of Kansas arnl NtjlJraska rnHl the territory of Dakota we 11ot11, in Lho inu1·1·n0111 of females, the progress towrnd a settled eontlit.ion of society. A simihtr movement is vol'y nml'kotl i11 most; of tlw territories, as Arizona, Idaho, l\fontana, vVashiugton, and 1;vyoming, and the Paciilc 8tn,tm1 of Oalifornia. Hll!l Nevada. In Colorado, however, this progress has been rudely iuterl'npte(l by the great m11l 1·aphl <1llvelop111011L of:' the mineral ,resources during tlJe last two years, which lia8 dmwn to that Htl•te a vast mnln .immig1'ation. Jn Nllw Mexico the conditions of the settled l\fexican 1)opulatio11 have been distmhed by the influx: of a whito malo t•lonl<\lll', drawn there by mining aucl by the rapid construction of railroatls. 'l'he ease is very similar in Utn.h, nlHl, thongh to t1 less extent, in Texas.
THE POPULATION OF THE UNITED STATES OJ,ASSIFIED BY HAOB.
Tables XX, XXI, andXXII relate only to the white and colored raees. Asiaties, including Oh,inwm, ,Jn.pannso, East Indians, etc., an<l American Indians and l:talf.breeds, are not included. Of the OhiiHlse tber\l nm in tile l Jn il:!\<l States 105,4G5; of the Indians, mingled with the white meu and uot nuder tribal l'elations, or 11pon rmm1·vu.t.io1114 , 1.JH1i•o are G6,4~7. The numb~r of other l~tlhius in the Uuite(l Stutes, viz, tlwse still mHlor 1l'ib1tl rohit;ion.~ or upou re8ervat10ns, supported m part or entirely by the goyermueut, has not ;\'Ct been reported to the oHiel'.

1' '8
{! .. 15 .. _.
15 # 2$ ...• ·--
25 and OYBI"-·--
119' ]l'i' ]~ 103'
:;;c;
iv*===' ·..._.· ssr===-s="""=""-"'u::: .. -=-:::--:::-·:::-::;-=:·;.;;· 1;;,Y.;;,.~-=====-,..·c::.::=~~~.:
. MAP OF THE
UNITED S T~i\._TE S 8HOW1~(j THE DENSITY OF
COLORED POPCLATION F~XCLUSIVE rw TOWNS0l"80001NHAB1TANTS OROYE.R.
( 'ompil.eti from tho Rl'tnms of Poµulatiuuat tl1e T~uth Census . 1880.
;- \
XXXVII
of colored to
04il I
916 '
183
933
4,240
201
2, 097
1:
1. -· .... __ .......
,, ............. -
1880.
135, 647 7,185
078 530
911
198
3,558
034
1,298
61,261
2,563
299
2, 038 2,4-04
J54-, 510
35, 400 32, 858
153 319
71, 705
484
4,369
206
1,a33
2,038 2,0-.:33
1,891 1,533 1,530 1,298 1,274 1,060
978 935 934 Ull 784 589 530 484. 441 319 301 299 224 206 201 198 183 163
I e are colored . .:nbia, Florida,
~- \ _:_= ___ Arkansas and '' ,-o:: ._,~.;...-;;:?f __ mer the former
-~':o',>,';.,~. b
· · ·--~:::! there are but

.'ll
.. /
TI-IE POPULATION CLASSIFIED BY RACE. XXXVII
TABLE :XX.
=-'-=====~====;=o====;========oe=================~~=·~==--~---·-------="'
I I Number of colored tu I
J00,000 white. Number of colorod to
100,000 wl1itc. States and territories. White. Colorctl. States aml tcrl'itories. White.
•, 1870. I 1880. I 43 409
"70 0 "80 703 __ 1_4_ 5?81 1" 16" 1-M-. -.-.-.-----!--' -, u , 0 , , - u, " 18SlSSlpp1- . • . • • .. • • . . . 479, 308 '.l'he United States
--------·· ·--· ----·- - ' Missoul'i . . . . . . . . . . . . . . 2, 022, 826
.Alahan111 ... .•. ..•..... .. 002, 185 000, 103 01, 201 oo, 625 Montana................ 35, 385
.Arizom1. •• . . . ....... .. .. . 35, 100 15:; 271 441 Nebraska . . . . . .••. • . . . . 449, 76t
.Arkansas • . . . . . . . . . .. . . . 501, 531 210, OGG 83, 738 35, 614 N evnlln • .. . . . • .. • . .. . . . . 53, 556
Culii'omia.......... .... .. 7U7, 181 0, 018 051 784 New Hampshire ...... .
Coloraclo. .. . ...... .... ... 101, 120 2, 435 1, 163 1, 274 New Jersey ............ .
Connecticut .. . .. . . . . . . . 010, 700 11, 547 1, 183 1, 891 I New Mexico ........... .
Dakota . .• • .. ... . . . ... • .. 133, 147 401. 729 301 N!lw York ........... .. D<·laware ...... _......... 120, 100 20, 442 22, 200 22, 005 North Carolina ....... ..
District of Colmubia..... 118, OOG 50, 500 40, 1G7 50, 502 Ohio .. _ ............... · 1
J!'lorid11.................. 142, 605 126,000 05,453 88,840 Oregon··- ........... .
Georgia.................. 810,900 725,133 85,322 I 88,700 Penns~·l-canfa .......... ! lclnho ............ _ ... _.. 20, 013 53 5G5 ' 183 Hhodc Island ......... .. Illinois ............... _.. a, 031, 151 46, 308 1, H5
Incliam1............. •. . .. 1, D38, 7U8 30, 228 1, 483 Iowa..................... 1, 014, ooo O, 510 485
Knnsns ............... ..
Kcmi..ncky ··~··--·· ..... . Louisiana .. _ .......... _ .. l\faino .................. . llfitr;l'lallll ............. ..
llfassnchnsctts ..... __ .• _.
Michigan ............... .
Minnesota .............. .
952, 155 1, 377, 170
454, 054
O·iO, 8G2 7~1!, (i03
1, 703, 782
1, 614, 500
770, 884
43, 107
271, ·151 483, 055
1, 451 210, 230
18, 007
15, 100
1, 564
4, 930
20, 225
100, 592
257 28, 000
006
l, 015
173
1, 530 South 0arol!na . _ ...... . 2, 0~3 I T
580 I enncsseo • _ ........... .
II Texas ................ .. 4, 52i [! Utnh .................. .
19,711 1\ Vermont .............. .. 100, 30D i\ Virgini11 ............... _
224 I, . . 11 Wushmgton ........... .
2D, OlO ·11 West Virginia._ ....... .
1, 060 I Wisconsin ...... _ .... ..
:~~ i! Wyoming ............... \
~-.'........---.......!.~-~--"----
340, 229
1, 002, 017
108, 721
5, 01(), 0221 867, 242
3, 117, 920
163, 075
4, 107, 016
269, 939
391, 105
1, 138, 831
1, 107, 237
142, 423
331, 218 880, 858
07, 109 592, 537
1, 300, 018
10, 437
TABLE XXI.-NUMBER OF COLORED TO 100, 000 WHITES.
Colored.
650, 291
145, 350
946
2, 385
488
685 38, 853
1, 015 65, 104
531, 277
79, 900
487
85, 533 6, 488
604, l.!32
403, llil
393, 384
232
1, 057
631, 6l6
325
25, 886
2,702
208
1810.
120, 328
7,365
1, 000
646 016
183
8,502
100
1, 203
57, 725
2,429
398
1,889
2,3471 143, 549
34,433
41,887
2:17 28(}
72, 019
033
4,240
201
2, 097
a-Colorc<l in excess of whites: e-Colorecl 2 to 10 iier cent. of whites-Continued:
South Carolina ........ __ ........•. _ ... ___ . _ •• _ ... _ - . - 154, ti19 l\Iist-iissi11pi. . _ .. _ .. _. _ . _ .• _ ... __ .• _ .... - .. __ .... _. _ - . . 135, G47 Louisiana ............. _. _ ... _ ... _ .... __ •. _. _ .. ___ .. _ 106, 300
b-Co!oretl 50 to 100 per COf!,t,, of whites: Alalmrn8. _ .. _ ....... __ . __ . __ . _ .. _. _ ...... _ .......... . Florida.. . _ .... __ . _. __ .• _. _. _ .•...••• " •••• - -...• - -- -Georgia .•.••..................••. ·----· .... ·--· ..... Virginia ............. __ . _ ............ _. _ .••• __ ..•... North Carolina ........ _ ... _ . -..•... - . - .... - .. - . - - .. . District of Columbitt ................................ .
o-Colorcd 2ti to 50 per cent. of whites:
90,625 88, 840 88,766 71,705 61,261 GO, 502
Pennsylvania ...... ··-- ..........•.•.•... -·-- .... -·-Indi aua .• _ ••. _ •...••... _ ..•.. _ .•.•.. _ . _ .. _ •.. __ • _ .. _
f-Colo~·ecl less than 2 per cent. of whites: Connectieub ................ ____ ., .............. --·· _ vVyoming . __ . _ .. _. - _. __ •. _. _ .... __ ••• __ .•. _ . ____ • _. _ Illinois ... __ . - -... _ •.•... ___ ... _ ..•••. _ ..•... _ ... ___ .
New York .................... -----··-----·-·--··-··-Colorado •• __ .. _ •.. _ . __ .•...•• ; _ •••• __ •.. _ .......... . Massnclrnsetts ...... _ - -- . - .......•. _ •. _. _. _. ____ • _ .. . Montana ........................................... . l\.fichigan .......... -··· ...•.. ·····.·---· ···--· ....•...
.New l\'Iexico .. ---· ........................ ··--·· .•..•
1880.
135, 047
7,185
078
530
911
198
3, 558 934
1, 298
01, 261
2,5f33
209 2,038
2,404
354. 510
35, 400 32, 858
163
319
71, 705
484
4, 369
206 1, 533
2,038 2,023
1,891 1,533 1,530 1,298 1,274 1,060
978 935 934
Arkansas ......... _._ ............. -- - ...•. - .• -••.•••• Tcnncssoo __ ...... __ . _ .••••• ___ •• _. __ . ___ ..•• ___ .... _
35,614 35, 400 32,858 29,010
Nevada ---· ···--· ---·-· -··- -····· •..• ·--· ....•.. -··. 911 California .•••.••• -•...•..• - . - - ................. - - . . . 784 Iowa _ ..•.. __ - •• - .. - . - . - • • . • • . . •• - • - _. _. ,. • • • • .. • • • . 589 Nebraska ...•.... _ ....... _. -•.••••••.• _ ... --· •.. __ ... 530
Texas .............. - .... ----· --- --- .. - . -· •.....• -··. Mm·ylaml .... ___ ..... -·- •. _____ ... · ........• ·--· •. _ ..
d-Colorecl 10 to 25 per cent. of whites: 'Vashington ................ -·-·-· --··-- ··--·· --····. 484 .A.l'izona . _. __ - .. _. -. - . _ ••• -• - - -............ __ .. _. _ - - . 441 Vermont .•.... __ ..... _ ....... -••• - • _ •. _ ••• _. _ •• _ • • . . 319 Dakota .... ,. __ ,_ ..••.. ···-········--···---·-....... 301
Deln,ware ..•.• _ ......•••.• - ... __ ..... - .• • ••• ... ... •. 22, 005 Kentucky ....... ___ ............... -- __ .••... _ _._ •. .. . 19, 711
e-Colored 2 to IO per cent. of wbitcs: Oregon._ ...•• _-· _ ............. _. _ •••. _ •••••.••• _ •. _. 299 Missonri.. _. - . _ ........ _ ........... - ....... _ •... -•.. -- 7, 185 l'tfaine ... - .... ·-- - .. - ....................... - ••••••• - 224 Kansas·-·-_ •• ___ . ____ . __ ............ _. _ ••.•••... -- • _ 4,,527 "\Visconsin ..... - • --- --- .••.. ---· .••••• ·-- --- ••.• - •.. - ·206 Wost Virginia ..........•••...•• -·-·-· •....• -··-····· 4, 369 Minnesota ...... -··· .............. ·--·............... 201 New Jersey .. _ ... -·-- ........ __ •.... , .... ··--···--... 3, 558 New Hampshire .••.....•..• - .. - ..• -· .•• _ ·-· ... _ .... - 198 Ohio ................................................ 2,563 Idaho .................................... -·······--- 183 Rhode Ishtnfl. •..• _. _ ....... __ .. _. _ ..•. _ .. _ ...... _... 2, 404 Utah .•. _ ...... ---· ........ -- ....•..•........•..• - •. - 163
'l'he greatest proportion of colored to white is in South Oarolina, where three-fifths of the whole are colored. In Louisiana and Mississippi, from one-half to three-fifths are colored. In Alabama, District of Columbia., Florida, Georgia, North Oarolina, aud Virginia, the colored form one-third to one-half of the total. In Arkansas and Tennessee, from one-fourth to one-third of the total popnhttion are colored. The least proportion among the former slave states is iu West Virginia, where there are but 4,355 to 100,000 whites, and in Missouri, where there are but 7,168. .
Outside of the former slave 8tates the proportion of neg-roes is Yery small.

XXXVIII INTRODUCTION-DISCUSSION OF THE POPULATION.
TABLE XXII.-CHANGES IN THE RELA'l'IVENEGlW POPULATION IN THE DECADE BETWEEN 1870Al~D1880, THE NUMBER OF WHITES BEING ASSUMED AS 100,000.
Increase in the decade.
South Carolina·--·-· .•.•.. ------ ..•.........•............ :Mississippi.. --- ....••..• · - -·. · •• • · ·• --· · •· · · •• · ••• · • • · - · · ·Louisiana .......................... ·'-·· ..•...•.•.......•• North Carolina ........ _ .. , •......••••... _ ............... . Georgia ......... - . - - .• - • - .... - - - .. - • - - . - • - - - - .. • - · - . - - • • · Arkansa~ ..••...• - • - - . - -... - ••. - - - . - . -... - - • · • · - - -- .. - - · - · Dititrict of Columbb .............. -- ..................... . Tennessee. - ...•...••. --· ................................ . New Mexico ............................................. . Conncctictlt· .................. -••...............••......•. Indiana ...................... -----· .••.•.....•.•.....•... Illh10is .................................. ····--·----· ---·. Arizornt ................................. - .............. .. Pennsylvaufa ............................................ . Ohio .................................................... .
10,U70 9,319 5, 717 3, 5:l6 3,444 1,876 1,335
967 744 708 540 38:> 170 140 1:>11
West Virginia ........................................... . Colorado ................................................ . Iowa ........... , ........................................ -New York ............................................... . Massachusetts ..... _ ................................ -..•.. Utah .................................... -... -- .. - - ••. - -.. Rhnilo Island ..................................... --- .•.. -New .Tllrsey ........................... _ ... __ .......... __ .. Maryland ............................................... . Vormonb ................................................. · Maine .......................................... - ...... -.. . Minnesota ............................. -............ - .•••. New Hampshire, ............................... --- ..... - --"\Visconsiu.... •• • • . • . . . ................................. .
Decrease in the ileeade. 'l'exas : ................................................... 12, 029 . Virginia ................................................. .. Florida ................................................ -·· 6,613 Delaware ............................................... . Alabmntt ....... --· ........... --- ........ -- ....... - •••. - . . 57U :Missouri. .•..••.. _ .... __ .............. _ ...• __ ........... .. vV~·oming .......... ---· ................................. . 51i4 California ........................... _ .............. - ... _. Kentucky ...... -----· ................•..•..•....•.....••• 514 Nebraska •....•.•..••.• ---·--·- ....•••• --------·------- .. . "\Vashingtcm ............................................. . 44!J Oregon .................................................. -Dakota ........ - ...... ---- -- .. --- . -· .... --- - --- - ..••.. -·· - 420 Michigan ........ ---- .... .. : . ............................ . Kansas ...••..••••..••. -·---- ...... -·---- ................ - 412 Montana ................................................. . Ic1aho ................ ; _ ............ -- .... -- - - -... - --- ... - 382 Nevada ........... --·- .................... ____ .......... --
In the Unitec1 States, as fL whole, there has been a gain of 634 on an assumed basis of 100,000 whites.
129 111 104 95 94 74 G7 56 44 39 33 28 15 5
314 294 180 1G7 116
90 80 22 5
The great relative gains dming the clecacle have apparently been made in the South, tlJe former sfaveholding states. Of the nine of these states which lmve gained, eight stand at the lleacl of the list, having made relatiive gains ranging from 944 to nearl;y 11,000. It is belieYe(1 by the Oensns Office, llowever, that these apparent gains are clue, in a great measure, to the imperfections of the census of 1870. Unc1er the conditions which prevailed at that time it. is probable thi1t a much larger iwopOl'tion of negroes. were omitted than of whites. Of the former slave states which have, lost, Te.xas ancl Florida lead. Eoth these states liave received heavy white immigration from other })arts of the cmmtry, which has more than overbalanced whatever gain in colored i1opnlation may have been made. They haye been the scene of rapid de\·elo11mellt, and thus the relative decrease of blacks is to be accounted for, not by an exodus, or a tl,ring out, but by an infusion of whites. The movement of blacks in the northern and western states has apparently been of little comparative account. The migration of negroes bas not attaiued to such dimensions as to be perceptible in these comparative tables. The states from which the exodus principally took place-1\T.ississivpi, Lonisia.na, ancl North Oarolina-have all ap1Jarently gained heavilyiu relative iwoportion of blacks, while Kansas, to which the major IJart went., has lost, and Inclia.na has gained but slightly in proportion of negroes.
The :following table shows the number of Ollinese, ,Japanese, and India.us (out of tribal relations) in each state and territory. Indians under tribal relations are not included, but are the subject of a. special inquiry by tlle Cemms Office:
'r ADLE XX III.
Chinese. Japanese. Intlians, ="'-="-~~:::s"::c~:,~~itorit~:. I Chinese. I J'a1i~~cso. Indians. ! Slates and te1Titories.
-·--:-:-~-_ -·-~------~-----··-- --_-·-:~i-------· --.--1---·-----·~ --------------- ~--------Iho Un1te<1 States....................... 10u,46u
1 148 GG,407, Kansa~ .................................... l9 ............ 815
.A.Jahama .................................... ·4-
11....-.-.~~------:~cc~-213.~i K.en.t~clcy .................................. 10 ........... .
.Arizona.................................... 1,630 2 :J,403 i Lombiana................................... 480 ............ !
.Ai·lrnnsns I 133 ............ 105 i Maine...................................... 8 ........... . Cnllfo~ia:::::::::::::::::::::::::::::::::::. 75,132 so j 16,277 f 11111.ryJan<l .............. .................... .. ........ ..
Colomdo .................................... / 612 ............ 154 ! Massachusetts ............... ;............ 220
Co It C.. it 123 " 1 9:;1"; ,,1
l:IichigmL... . . . . . . .. . .. . .. . . . . .. .. . . . . . . . . . . . . . . !!7 1 n e vlCl ..... ................................ ... u _., ...
])akot.a ...................................... I 238 ............ 1,3015
i ~::::~~;;:::::::::::-.::~-.:::::.::::::::-.::-. ~-~ 1 ..... : .... ~. 1 .Dclnwaro .................................... ' 1 ·.-.·_·_·_·_·_·.·_-_4 •••. 1 1 M' . ])!strict of Columuia .... ...... .......... ... 13 5 j issonri .... ~......... .... ............ ...... Ol · .......... .
Flori<fa ...................................... 18 180 1
.Jl:(ontana ...... ............................. 1,765 ------------1 Georgia ..................................... , 17 ............ , 12•1' :N"ellraslm ...... ............................ 18 -· ....... i
l<laho ....................................... '
1
3,3791 ............ 1 105 Ncvucfo. .................................... \ 5,4161 3 \ llli11ois....................................... 209 a I !40 New Hampshire............................ 14 j ............ ! Imliaua ............ ...... ...... .............. 29 I 240 New J'et•soy ...... .................. ........ 1701· • 2 [
1Gwr1o ......................................... 1 ' 33 ::::::: :::::: ! 466 }fow ~exico .............................. __! ;7 ............ 1
50 848
625
Hi
son 7, 240 ~. 300 lt 8[17
113
1, 003
:l.15
2,80'.J 03
74
91 772

77' 75°
"'
'\' \ I I 29•
\ \ I
.1 tf> 7. __ , ______ , ___ .
7 ~,, -17 .. ~.
.17' Jti... . ..
nx
LllS.
992
807
11
85
4,405
29
3, 161
HO
Lb le
N.
--. to
~-
820
10, 812 ll,685 i7, 441
70, 005
15, 305 24, 378
7, 210
B!! 289 268
14, 089 21, 143
15,!lOS
36, 532
778
1, 094
7, 759 44,007
14, 059 981
20, 643
a, 043
44-, 548
39, 159

r
THE. POPULATION CLASSIFIED BY GENERAL NATIVITY. XXXIX
TABLE XXIII-Continncd.
States an<l territories. Chinese. I Japanese. Indians. i States and territories. Chinese. Japanese. I Indians.
NewYork................................... 900 North Carolina ........................................ .
Ohio············-·-········-··-·-·-·········· 100 Oregon....................................... 0,510
Pennsylvania .....•.... ----.................. 148
17
1
2
8
Rhode Island ---- -- ------ ------- ---- ........ . 27 ........... .
South Carolina ......................... ····--1 Tennessee ..................................... ..
9 -•••. -·· - -·· 25
~~~~~~-~~~~~~~-
819
1, 230
130
1, 694
184
Texas .......•....•......••••.........•• ···-·1 136 --~------···
~::;ii::::::::::::::::::::::::::::::-:::::::.--------~~~- : : :: : : :: :: : : Washlngt-0n ...... .......................... 3, 188 1
77 West Virginia .•.••...•...............•.•... 5 ........... ..
131 Wisconsin ..............•.•..............•.. 16
352 Wyoming ................................... ! 914
992
807
11 85
4,405
29
ll, 161
140
The following table shows the proportion of Chinese in the states and territories where they form a notable element of the population:
States and territories.
TADLB XXIV.
Number of Chinese to 100, 000 whites.
States and territories.
~~---1-~~~~~-11-~~~~~~~~~~~~ I Numb_cr of Chi
nese to 100,000 whites.
Idaho ............................... . Nevada .............................. . California ... : .........................
1
Oregon ........................................... . :Montana ............................. .
11, 647 10, 113
9, 793
5, 832
4, 988
I Washi~gton .......................... ! \V~yom1ng .............................. ..
Arizona ............................. .
Colorado ...... ---------··············\
4,741
4, 702
4, 636 320
THE POPULATION OF THE UNITED STATES CLASSIFIED AS NATIVE AND FOUEIGN BORN.
TABLE XXV.
·-~~ --Number of foreign to Number of foreign to
100,000 native. 100, 000 native. States arnl teITitodcs. Nativ". :n.,oreign. States and territories. Native. ]foreign.
1Si0. 1880, 1870. 1880.
---- ·-- -- ···- -·- ----Tho United States . 43, 475, 840 6, 070, 943 10, 875 15, 364 Mississippi ............. 1, 122, 388 U,209 1,370 8~0
- --- - - Missouri. ............ ... 1, 956, 802 211, 578 14, 827 10, 812 Alabama ...••.• --- ... - --- 1, 252, 771 o, 73·1 1, 009 776 Montana .................... 27, 638 11,521 63, 245 41, 685 Arizon11 .......... - ....... 2!, 391 10, 049 150, 922 65, 798 Nebrask11 ............... 354, 988 ll7,414 33, 333 27, 441 Arkansas'. ......•••...... 792. 175 10, 350 1, 048 1, 306 Nevada ................. 36, 613 25, 653 71l,303 70, 005 Califoruia ...... -- • - ...... 571, 820 292, 874 50, 881 51, 217
300, 607 46, 294 10, 257 15, 395 Colorado ........•........ 154, 537 89, 790 19, 838 25, 747 New Hampshire ..•..... New Jersey ............ 909, 416 221, 700 26, 346 24, 378
Connecticut ............. 492, 708 129, 992 26, 813 26, 383 Now Mexico ............ 111, 514 8,051 6,510 7, 219 Dakota .................. 83, 382 51, 795 51, 409 62, 117 NewYork .............. 8, 871, 492 1,211, 370 35, 087 al: 289 Dolawar{l ................ 137, 140 9,468 7, 884 6, 903 North Carolina ......... 1, 396, 008 3,742 284 268 District of Colmn bi11 ....
1 100, 502 17, 122 14, 079 10, 667
Ohio ....•.••••.•..•. : ... 2, 803, 119 394, 943 16, 246 14, 089 Florida ........ --- .... -··1 259, 584 9, 909 2,717 3,817
Oregon·······-·-------· 144, 265 30, 503 14, 624 21, 143 Georgia ......... ·--·· .. - . 1, 531, 616 10, 504 949 689 Pennsylvania .....•... _ .. 3, 695, 062 587, 820 18, 310 15, 908 Idaho .................... 22, 030 9, 974 110, 838 44, 062 Rhode Island ---··----- 202, 538 7:3, 993 34, 204 36, 532 Illinois .................. '2, 494, 295 583, 576 25,446 23, 396 South Carolina .......... 987, 891 7, 680 1, 158 778 Indian11 ......... - - ....... 1, 834, 123 144, 178 9,102 7, 860
1, 525, 657 16, 702 1, 559 1, 09·1 Iowa .................... 1, 362, 965 261, 650 20, 690 19, 107 Tennessee .............. Texns ...................
1
1, 477, 133 114, 616 8, 254 7, 759 Kansas ....•.... -- - -·- ... 886, 010 110, 086 15, 314 12,424 Utah ................... 99, 969 43,994 54, 743 44, 007 Kentucky ........•...... 1, 589, 173 59, 517 5, 041 s, 745 Vermont ................ 291, 327 40,950 16,039 14, 059 Louisiana ................ 885, 800 54, 146 9,296 6, 112 Virginia ................ 1, 407, 869 14, 600 1,135 981 Maino ................... 590, 053 58, 883 8,456 9, 979
Washington ............ 59, 313 15, so:i 26, 541 26, 643 Marylancl. ., ......•...... 852, 137 82, 806 11, 959 9, 717 West Virginia .......... 600, 192 18,205 4,022 3, 043
Massachusetts·-·-·· .... 1, 339, 594 443,491 32, 003 33, 106 Wisconsin .............. 910, 072 405, 425 521 813 44, 548 Michigan .....•.......... 1, 248, 429 388, 508 29, 257 31, 119 Wyoming ............... 14, 930 5, 850 02, 070 39, 159 llfJnl).osota ...•........... 513, 097 267, 676 57, 506 52, 108
XL INTHODUCTION-DISCUSSION OF THE POPULATION.
In no state or territory does the foreign element equal the native, although in many it bears a yery large proportion to the latter. The following classification shows the proportion of the two elements:
TADLE XXVI.-NUi\IBER OF FOREIGN-BORN 'l'O EACH 100,000 NATIVES.
a.-Fore·ign-born 50 per cent. or mol'e of the ncitit,e.
Novac1a ••••.•.......•.•.•.••••.•...•..••..•...•.••....... 70, 06511 Minnesota, ................................................. 52, 168 Arizona .................................................. ~?' 798 California ................................................ 51, 217 Dakota .. . . . . . . . . . • • • • . . . . . . . . • • • . . . . . . .. . . . . . . . . . . . . . . . . 62, 117
b.-Foreign-born 25 to 50 pe1' cent. of the native.
\Visconsiu...... . • . • .. .. . . • . . .. • • • . . . • • . . . . .. . . . . . .. . . • • . . 4,1, 548 Itlallo ................ · ........ .' ........................... 44, 062 Utah ..................................................... 44, 007 Montamt .................... , . . . •. . . . • . . . . . . . . . . . • . . . . . . . 41, 685 \Vyoming . . . • • . . . . . . . . . . . . . . . . • • . .. . • .. . • • . • . . . . . • • . . . . . . 39, 159 Rhode Island ............................................. 36,532 1fassacllusetts .....••••• , ..................... : ...••.•••.• 33, 106
] Now York ................................................ :n, 289 Michig:tu .....•.............•....•.. : . . . . . . . . . . . . . • • . . . . . 31, 119 Nobraska .......•••••...•..•••.....•..•.........•••....... 27, 441 \Vashington . . . . . . . . . . . . . . . . . . . • . . . . • . . . . . • • • . . . . . . . . . . . . . 26, (i<!3 Connecticut ................••..........•••..•............ 26, 3S:l Coloraclo .............. .' ...•..........•................•.. 25,747
c.-Fo1•eign-born 10 to 25 per cent. of the native.
NewJers!ly .............................................. 24,378 Ohio .•••.• · .............................. , •......•.••..... 111, OSU Illinois ................................................... 23, 396 Vermont ................................................. 14,059 Oregon ................................................... 21, 143 Kansas ................................................... 12, 424 Iowa ..................................................... 19, 197 Missouri .•.......•..............•••............•.••...... 10, 8l2 Pennsylvania ............................................ 15,908 District of Columbia ...................................... 10, 667 New Hampshir!l ......•. ~ ................................. 15, 395
d.-Foreign-born 2 to 10 pm· cent. of the native.
}.[:tine ................................................ - . .• 9, 979 liarylan(l •••••..........•••.....•••••.•••.•.....••....... 9,717 Intliana .................................................. 7,860 Texas ............................ _ . . . . . . . . . . . . . . . . . .. • . . . 7, 759 New.Jl.1cxico. •. . . . •. . . •• . .•• . . . . . . . . . . . . . . . • . . •• . .. . .••••• 7, 219
Delaware . . . . . . . . . . . . • . • . . . . . . . . . . . . . . . . . . . . . . . . . . . . . . . . . fi, 903 Louisiana.... . . . . . . . . . . . . . . . . . . . . . . . . . . . . . . . . . . . . . . . . . • • • 6, 112 Florida .......•...•.••...•......•........•.••........... il,817 Kentucky . . .. . .. . .. . • .. •.... .. •.. .. ..• . . ••••. .•.••. . . . . . . 3, 745 \Vest Virginia . . . . . . . . . . . . . . . . . . . . . . . . . • . . . • • . . . . . . . . . . . . . 3, 043
e.-Foreign-born less tlui1i 2 per cent. of the native.
Arkansas ................................................ . Tennessee .••••...•••....••..•.............•.......•.•••.. Virginia ................................................ . liississippi ............................................... .
1,306 1,094
981 820
Sout.h Carolina .......................................... . Alabama ................................................ . Georgia .......••......................................... North Carolina .......................................... .
778 77(i
689 268
It will be noticed that with three exceptions only, viz, the states of Florida, Louisiana, and Texas, the southern states are practically without any foreign element.
In those states where the foreign element is large the general· causes are apparent. In the northeastern states the moving cause is manufactures of various lrinds and the mining of coal and. iron. The immigrants are mainly Irish, German, and French Canadian, with some Welsh. In the Northwest agriculture is the principal moving force, and Germans and Scandinavians are the principal nationalities drawn from; while in the extreme western states and tenitories most of the immigration is due to gold and silver mining, although agriculture and cattleraising also play a very important part.
The following table shows the changes in the relative proportion of foreign to m1tive po1mlation which have taken place in the past clecacle, on the basis of 100,000 of the latter:
Dakota ................................................ . Oregon ................................................ .. Colorado .•....•..•....•.....••...•...••.•.•..•••........ New Hampshire ........................................ . Rhode Island ........................................... . Michigan ••..•....•.•....• : •.••...••••.••.••.•.•••••.•..•
TABLE XXVII.
lt.-Increase.
10,708 6,519 l;),909 5,138 2,328 1,862
Maino ..... : .•....•...•...•....•..•.....•.••............. Massachusetts .......................................... . Flol'ida ................................................ . New Mexico ........................................... . Arkansas .•••......•..........••...........•........•••.• Washington ............................................ .
1,523 1,103 1, 100
703 258 102

XL
prop~
Nevacl Ariz or Dakot
Wiscoi Idaho'. Utah.) Monta1 Wyomi Rhode Massac
NewJe Illinoi1:> Oregon Iowa .•. Pennsyl NewH2
Mame .• Marylar Iudiana Te:xa.g •. New' Me
.Arkansai Tennesse Virginia Mississip:
Itv states a
In 1 the mov Irish, G force, an states at raising a
The taken plr:
Dakota ..• Oregon .•.• Colorado .. New Hamr: Rhode Isla1 Michigan ••
Jl!ifJ 11l"' lll'
--U9' ll!'i{l
101' f.i:JO
l!oo
£15"
~
SC>f" 300 '.00
i i ,....,
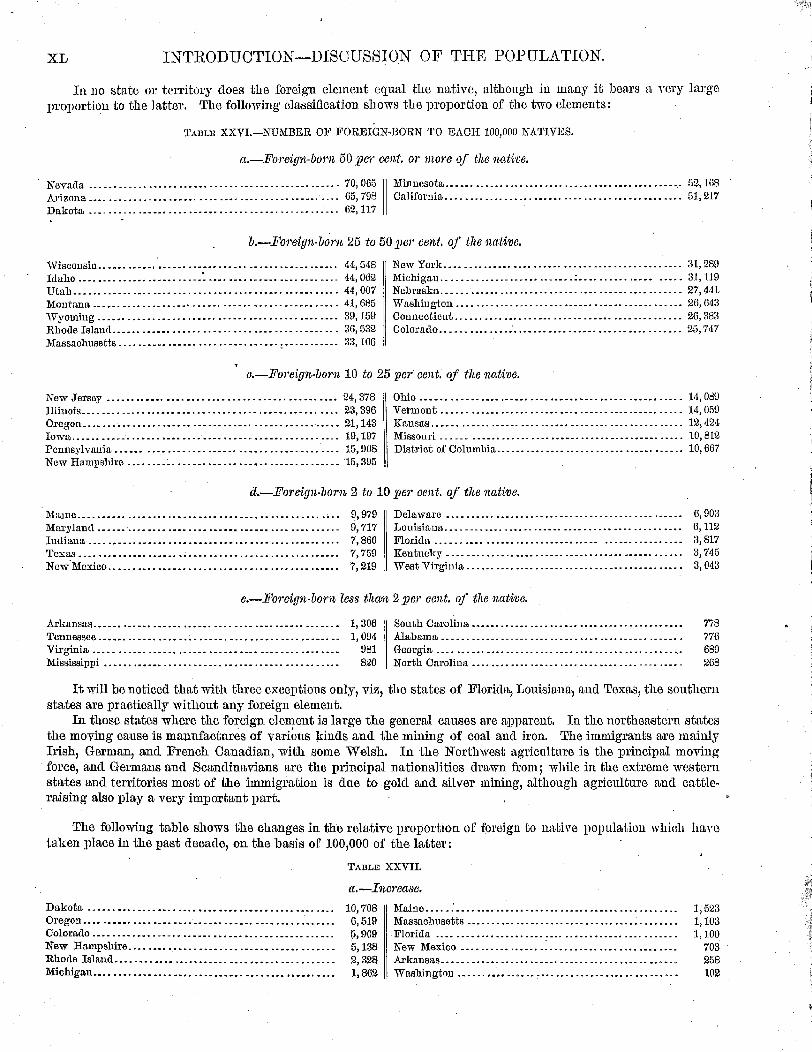
:MAP OF THE
UNITED s·TJ_'\_TE S SHOWING THE DENSITY O:F
FOREIGN POPULATION EXCLUSIVE OF TOWNS OF 8000 INifABITA'tt"TS OR OYER.
Compiled from the Returns of PopulatiDnat the Tt'nth Census, 1880.
93• m• 89° n:;a
500 ooo Miles.
85°

1·
. .r
I L I.·
l
THE PHYSICAL FEATURES OF THE COUNTRY.
Arizona ....••........•......•••..•.........•..•..•.•...• I(laho ......................... _ ............•............ Wyoming .................•.•••......................... Montaua ....................•.................•....•••.• Uttth ................................................... . Nevac111 ...............................•..•..•........... California •••....•................•..•.•.•............... Wisconsin ..•.......................••••.••••........•..• N ebraskri. .............................................. . :Minnesota ..................•.........••..••••....•..•••. Missouri. ...••.....•...•................•.••.....•. , ..... New York ..••.....•....•..•...•......•.................. District of Columbia ..••••......••••.•••....•..•.....•.. Louisi aua ...•...............................•..... -. · · -. Kansas ..••••...•....................................•.•. ·Vermont .••••....... · ..........•.••••................•... Pennsylvania .••••.. .' ....................•...........•... J.\{arylancl ................•........•....•••.....•...•••. -
b.-Deorease.
85,124 66,776 23,517 21,560 10,736 9,298 8,664 8,265 5,892 5,428 4,015 3,798 3,412 3,184 2,890 2,580 2,402 2,242
Ohio .•..........•••..•.•••••.................•.. •••····· Illinois ..••.•......••.•...............••.......••••.•.... New Jersey .......•.•...••••.......••.•..•..•••.•.•..... Iowa ............ ·--~-- .....••••......•.......••• ·•······ Indiana ................ _ ...•.........................•.. Kentucky ...........•.........•..•..•...••....•......... Delaware ............................................... . West Virginia .........•.................••.•....•...... Mississippi ............................•.••...........•.• Texas··'··· .................. ··························· Tennessee ..••....••.................•.........•...•.••.. Connecticut •.. · ...............•......•.•...•...•...••••.• South Carolina ......................................... . Georgia .......................•...............•.••...••. Alabama ...................•...•.••••.........•......••• Virginia .........•....••..••.•...••••••.......••.•.. -- . · North Carolina ..••.•.•••••••••...•..•.....•.••••.•..••.•
XLI
2,157 2,050 1,968 1, 49;3 1,332 1,296
981 979 550 495 41i5 430 380 260 233 154 16
The above table shows that in tliirty-five states and territories, including the District of Columbia, natural increase has gained upon immigration, while in but twelve is the reverse the case. In the United States, as a whole, there is a reh1tive decrease of the foreign element to the extent of 1,51G on an assumed total native i1opulation of 100,000, showing that in the whole country, as well as in a majority of the states, native increase has gained upon foreign immigration.
The increase of tlle foreign element has been.in New England, where the growth has been in the direction of • nrnnufactnres; in Dakota and in Oregon, whose wheat-field~ have invited settlement; and in Colol'a<lo aucl New Mexico, where an extraorcliuary.developrnent of the -mining iuclustry l.tas taken place since 1871.