Embed Size (px)
Citation preview

Biochem. J. (1980) 189, 541-546Printed in Great Britain
The electrophoresis of transferrins in urea/polyacrylamide gels
Robert W. EVANS* and John WILLIAMSDepartment ofBiochemistry, University ofBristol, Bristol BS8 I TD, U.K.
(Received S February 1980)
The denaturation of transferrin by urea has been studied by (a) electrophoresis inpolyacrylamide gels incorporating a urea gradient, (b) measurements of the loss iniron-binding capacity and (c) u.v. difference spectrometry. In human serum transferrinand hen ovotransferrin the N-terminal and C-terminal domains of the iron-free proteinwere found to denature at different urea concentrations.
Makey & Seal (1976) showed that partiallyiron-saturated human transferrin can be resolvedinto four bands by polyacrylamide-gel electro-phoresis in a buffer containing 6 M-urea. The slowestand fastest components represent the apoprotein andthe diferric form of the protein respectively, and thetwo intermediate components represent the twomonoferric forms of the protein. The identification ofthe two intermediate components was achieved byEvans & Williams (1978). Partial saturation ofhuman serum transferrin with iron(III) nitrilotri-acetate was found to give rise to the slowerintermediate component, and proteolytic digestion ofthis substance produced an iron-containing fragmentof mol.wt. 43000 that contained carbohydrate. Onthe other hand, partial saturation with other irondonors, including FeCl3, gave rise to the fasterintermediate component, and on proteolyticdigestion this substance yielded an iron-containingfragment of mol.wt. 36000 that was devoid ofcarbohydrate. Since the amino-acid-sequencedeterminations of MacGillivray et al. (1977) hadshown that carbohydrate is present only in theC-terminal half of the polypeptide chain, Evans &Williams (1978) inferred that the slower inter-mediate component represents the monoferric trans-ferrin with iron in the C-terminal binding site (TfFe)and that the faster intermediate band represents theN-terminal monoferric transferrin (FeTf). Partiallyiron-saturated hen ovotransferrin also gives fourbands upon polyacrylamide-gel electrophoresis inurea-containing buffers, and from similar evidencethese can be identified as corresponding to theiron-free protein, the C-terminal monoferric trans-ferrin (OTFe), the N-terminal monoferric trans-
* Present address: Department of Biochemistry andChemistry, Guy's Hospital Medical School, LondonBridge, London SE1 9RT, U.K.
Vol. 189
ferrin (FeOT) and the diferric transferrin in the orderof increasing electrophoretic mobility (Williams etal., 1978).
This method of electrophoresis has proved usefulin determining the distribution of iron between thetwo binding sites of human transferrin (Evans &Williams, 1978; Aisen et al., 1978; Leibman &Aisen, 1979; Williams & Moreton, 1980) and of henovotransferrin (Williams et al., 1978), since Aisen etal. (1978) have shown that no rearrangement ofbound iron occurs during electrophoresis.
Electrophoretic separations of transferrins bear-ing different numbers of iron atoms in non-denatur-ing buffer solutions can be obtained as a result of theincreased numbers of negative charges on moleculescarrying iron (Aisen et al., 1966). The separation ofthe different forms of transferrin in urea-containingbuffers is likely to depend on two further effects. Thefirst is the increased stability of iron-protein com-plexes to urea denaturation (Azari & Feeney, 1958).Secondly, as Makey & Seal (1976) suggested, themagnitudes of the decreases in electrophoreticmobility caused by the unfolding of the two domainsof the protein may not be equal. Although there havebeen many quantitative studies of the denaturationof transferrin by urea (e.g. Glazer & McKenzie,1963; Yeh et al., 1979), there appears to be noinformation about possible differences between theN-terminal and C-terminal domains.
Creighton (1979) showed that the denaturation ofproteins by urea can be studied by electrophoresis ofa band of protein through a slab of gel in which thereis a gradient of urea concentration perpendicular tothe direction of electrophoresis. With several pro-teins, curves were obtained that were consistent witha rapidly reversible denaturation process in whichonly the native protein and the fully unfolded proteinwere detectable.
In the present paper we describe the application of
0306-3275/80/090541-06$01.50/1 1980 The Biochemical Society
541

R. W. Evans and J. Williams
urea-gradient/polyacrylamide-gel electrophoresis toseveral transferrins and show that the unfolding ofthe two domains occurs in two distinct steps.
Materials and methods
TransferrinsHuman serum transferrin was isolated from Cohn
IV fraction as described previously (Evans &Williams, 1978). Hen and duck ovotransferrins wereisolated from the egg whites as described byWilliams (1968). Pig transferrin and horse trans-ferrin were isolated by the method of Graham &Williams (1975). Rat and rabbit transferrin sampleswere gifts from Mr. S. Heaphy of this department.Bovine transferrin was a gift from Dr. J. Brock,Department of Bacteriology, University of Glasgow,Glasgow, Scotland, U.K. The removal of iron fromtransferrin was carried out as described by Evans &Williams (1978).
Samples of human serum and orang-utan (Pongopygmaeus) serum (the latter kindly supplied by Dr.C. Pearson, Department of Veterinary Medicine,University of Bristol, Langford, Bristol, U.K.) werealso examined by the urea/polyacrylamide-gelelectrophoresis after treatment with rivanol toremove the bulk of the serum proteins (Evans &Williams, 1978).
Polyacrylamide-gel electrophoresisElectrophoresis in 6M-urea was carried out as
described by Williams et al. (1978). Urea-gradient/polyacrylamide gels were prepared essentially asdescribed by Creighton (1979). In both cases gelswere 1.5mm thick. A linear gradient from 0 to6 M-urea was produced by using a multichannelperistaltic pump. Creighton (1979) used a shallowgradient of acrylamide concentration in the oppositedirection to the urea gradient in order to compen-sate for a retardation in electrophoretic mobility dueto the urea but not associated with unfolding of theprotein. This step was not used in our experimentswhere the acrylamide and NN'-methylenebisacryl-amide concentrations were kept constant at 6.5%(w/v) and 0.172% (w/v) respectively.
Protein samples were dissolved in reservoir buffercontaining 0.01% Bromophenol Blue and 10% (w/v)glycerol to give a protein concentration of 1 mg/ml.The sample was applied to the top of the gel at10pl/cm of gel. When serum samples were used,0.1 ml of serum was mixed with 0.8ml of reservoirbuffer containing 0.375% (w/v) rivanol and 10%(w/v) glycerol. After centrifugation the supernatantsolution was applied to the gel at 50,ul/cm of gel.Electrophoresis was carried out for 17h at 1OOV,and gels were stained with Coomassie Blue R250.
Addition of iron to transferrin in the presence ofureaThe denaturation of iron-free transferrin by urea
was monitored by testing the ability of the protein toform a complex with iron(III) nitrilotriacetate in thepresence of different concentrations of urea. Theformation of complexes was detected by the A470 andby electrophoresis in polyacrylamide gels contain-ing 6 M-urea.
Iron-free hen ovotransferrin or human transferrinWere dissolved in 0.05 M-NaHCO3 containing differ-ent concentrations of freshly deionized urea. Theprotein concentration was between 3 and 10mg/mlin different experiments. A calculated amount ofiron(III) nitrilotriacetate to give 100% saturation wasadded. Samples were left overnight at 200C beforemeasuring A470 and performing polyacrylamide-gelelectrophoresis.
U.v. spectraThe denaturation of iron-free transferrin by urea
was also monitored by u.v. difference spectroscopy.The protein was dissolved in the electrophoresisreservoir buffer (Tris/EDTA/boric acid, pH 8.4) at aconcentration of 0.4 mg/ml, and a stock solution ofdeionized 8M-urea was added to give the desiredurea concentration. The difference spectrumobtained between the protein in the urea-containingbuffer and the protein in the absence of urea wassimilar to that found by Glazer & McKenzie (1963).Spectra were recorded on a Pye-Unicam SP. 8-100instrument. The height of the difference peak at292nm was used as a measure of protein unfolding.
Results
Electrophoresis of human transferrin in urea-gradient/polyacrylamide gels
Fig. 1 shows that increasing urea concentrationfrom 0 to 6 M decreases the electrophoretic mobilityof iron-free transferrin to about 43% of its originalvalue in two distinct steps. The first step occurredover a wider range of urea concentrations (approx.2.8-4.0M) than the second (approx. 4.1-4.5M), butapproximately equal amounts of retardationoccurred in each step. Thus at 4.0 M-urea themobility is 70% of the value at 2.8M-urea and at4.5 M-urea it is 65% of the value at 4.0 M-urea.
Fig. 2 shows the pattern given by a partiallyiron-saturated sample of human transferrin in whichall four forms of the protein were present. Thediferric form showed no denaturation steps over therange of urea concentration used. The monoferriccomplex, in which the single iron atom occupies theN-terminal binding site (FeTf), showed a singledenaturation step that coincided with the first of the
1980
542

Electrophoresis of transferrin in urea-containing gels
....
, (a}l -.........
.. 1 .............. k.o (b) i} ,;\.. m .. . $Bz,.gos.!fog0.,> ................... °z g0!q*& o b Si - ! z: :
...j.9_ :., W
OM[Ureal
.2
-Fe2Tf
-FeTf-TfFe
-Tf
IUreal
Fig. 1. Electrophoresis of iron-free human transferrinand hen ovotransferrin in a urea-gradient/polyacryl-
amide gelA mixture of the two proteins was electrophoresed inthe same gel. (a) Human transferrin; (b) henovotransferrin.
Fig. 3. Electrophoresis ofa fresh sample ofhuman serumafter treatment with rivanol on a urea-gradient/poly-
acrylamide gelThe transferrin bands are labelled as in Fig. 2.
cC
-Fe2Tf
-FeTf-TfFe-Tf
Ureal
Fig. 2. Electrophoresis ofpartially iron-saturated humantransferrin on a urea-gradient!polyacrylamide gelA partially iron-saturated sample of human trans-ferrin containing all four forms of the protein wasapplied to the gel. It was prepared by adding smallamounts of iron, as Fe(II)S04 and iron(III) nitrilo-triacetate, to apotransferrini (Evans & Williams,1978). The diferric protein is labelled 'Fe2Tf', theN-terminal monoferric complex 'FeTf', the C-terminal monoferric complex 'TfFe' and the apo-protein 'Tf'.
two denaturation steps for iron-free transferrin(approx. urea concentration at the midpoint of thestep, 3.4M). This suggests that this step representsthe denaturation of the iron-free C-terminal domainof the protein. The monoferric complex with an ironatom bound to the C-terminal site (TfFe) alsoshowed a single denaturation step at a slightly higherurea concentration than the second of the twodenaturation steps for the iron-free protein (approx.urea concentration at the mid-point of the step,4.8M, as compared with 4.3M). The unfolding ofTfFe complex decreased its electrophoretic mobility
Vol. 189
to about 59% of its value at urea concentrationsbelow 4.2M, causing the TfFe complex to migratemore slowly than the FeTf complex. Again it can beseen that the unfolding of the N-terminal domainoccurs over a narrower range of urea concentrationthan the unfolding of the C-terminal domain.When fresh human serum was treated with rivanol
and subjected to urea-gradient electrophoresis, thepattern obtained was essentially the same as thatgiven by purified transferrin (Fig. 3). The con-centration of the N-terminal monoferric form isgreater than that of the C-terminal monoferric form,as Leibman & Aisen (1979) and Williams &Moreton (1980) have shown recently.
Electrophoresis of hen ovotransferrin in urea-gradient/polyacrylamide gels
Fig. 1 shows that, in a urea-gradient/polyacryl-amide gel, the electrophoretic mobility of iron-freeovotransferrin is decreased to about. 39% of its valueat low urea concentrations. This decrease appears totake place as a single step that occurs at the sameurea concentration as the first step of iron-freehuman transferrin (approx. 3.4 M), although theslope of the line is steeper in the case of the henprotein.A partially iron-saturated sample in which all four
protein components were present gave the patternshown in Fig. 4. The diferric protein showed nomarked change in electrophoretic behaviour. TheC-terminal monoferric complex (OTFe) showed asingle-step decrease in mobility to 50% of its originalvalue. This step occurred at the same urea con-centration as did the retardation of the iron-freeprotein. The N-terminal monoferric complex (FeOT)showed a much smaller decrease in mobility, to 68%of its original value, and this took place at a higherurea concentration (approx. 3.8 M) than did theunfolding of the iron-free protein.
543
R. W. Evans and J. Williams
0.12 MFe2OT-
FeOT-OTFe-OT-
[Ureal
Fig. 4. Electrophoresis of partially iron-saturated henovotransferrin on a urea-gradient! polyacrylamide gelThe diferric protein is labelled 'Fe2OT', the N-terminal monoferric complex 'FeOT', the C-terminalmonoferric complex 'OTFe' and the apoprotein'OT'. This mixture was prepared by adding a smallamount of iron(III) nitrilotriacetate to ovotransferrinas prepared by the method of Williams (1968).
0.11 1
0.10 H
0.09
0.08
0.07 _
0.06 F
0.05 _
00.04 _-
0.03 _
0.02 _
0.01 _
0 1 2 3 4 5 6 7
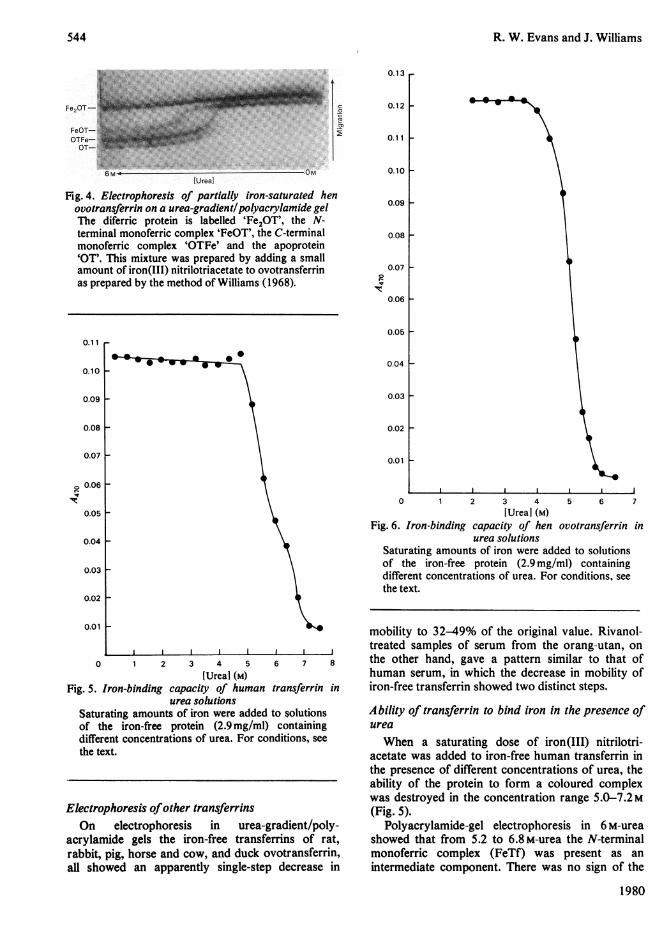
[Ureal (M)Fig. 6. Iron-binding capacity of hen ovotransferrin in
urea solutionsSaturating amounts of iron were added to solutionsof the iron-free protein (2.9 mg/ml) containingdifferent concentrations of urea. For conditions, seethe text.
0.01
0 1 2
Fig. 5. Iron-binding cap
mobility to 32-49% of the original value. Rivanol-treated samples of serum from the orang-utan, on
3 4 5 6 7 8 the other hand, gave a pattern similar to that oflUreal (M) human serum, in which the decrease in mobility of
,acity of human transferrin in iron-free transferrin showed two distinct steps.- -co. -~.- ~-~~~-o- - _ _ C s r -v-
urea solutionsSaturating amounts of iron were added to solutionsof the iron-free protein (2.9 mg/ml) containingdifferent concentrations of urea. For conditions, see
the text.
Electrophoresis ofother transferrinsOn electrophoresis in urea-gradient/poly-
acrylamide gels the iron-free transferrins of rat,rabbit, pig, horse and cow, and duck ovotransferrin,all showed an apparently single-step decrease in
Ability of transferrin to bind iron in the presence ofurea
When a saturating dose of iron(III) nitrilotri-acetate was added to iron-free human transferrin inthe presence of different concentrations of urea, theability of the protein to form a coloured complexwas destroyed in the concentration range 5.0-7.2M(Fig. 5).
Polyacrylamide-gel electrophoresis in 6 M-ureashowed that from 5.2 to 6.8M-urea the N-terminalmonoferric complex (FeTf) was present as an
intermediate component. There was no sign of the
1980
0.11 r
0.10 F
0.09 F
0.08 -
0.07 F
0.06 1
0.05 F
0.04 H
0.03 F
0.02 F
544
0.13 r
r_0
T.212
0
0

Electrophoresis of transferrin in urea-containing gels
Ur99 a 9v
0r 7 1 F; 2 0 2.4 2. A 2 3I.6 4.n 4 -4 4.8 9 0
UreBal66
54944 444i586062646.&444 S44 79 746
b)
OT-OT Fe-
IFe2OT-
Fig. 7. Electrophoresis ofovotransferrin after addition ofiron to the protein in different urea concentrationsA saturating dose of iron was added to ovotransferrin dissolved in urea solution. Electrophoresis in a polyacrylamidegel containing 6 M-urea was carried out 3 h later. 'M' denotes a marker sample containing apoprotein (OT), theC-terminal monoferric complex (OTFe) and the diferic protein (Fe2Tf). (a) Urea concentrations 0.8-5.OM; (b) ureaconcentrations 5.2-7.6 M.
130
110
100
C 90
E
80
< 701-
v 60
r 50u
.- 40
0
= 30
20
10
120
,110(a)
100
90
80
.70
60
50
40
30
20
10
0 1 I I I I I1-3 4 5 6 7 8 3 4 5 6 7
[Ureal (M)Fig. 8. U.v. difference peak of iron-free transferrin in
urea solutionsDifference spectra of transferrin in urea solutionsagainst transferrin in urea-free solutions weremeasured. The protein concentration was 0.4 mg/mi.(a) Hen ovotransferrin; (b) human transferrin.
C-terminal monoferric complex (TfFe). This showedthat the iron-binding capacity of the C-terminaldomain of human transferrin is lost before that of theN-terminal domain. Hen ovotransferrin lost itsability to bind iron in the range 4.0-6.0M-urea (Fig.6), and electrophoresis showed that, over this range,the C-terminal monoferric complex (OTFe) was
present as the sole intermediate (Fig. 7). Therefore in
this protein, despite an apparently single-stepdenaturation process (as judged by urea-gradient/polyacrylamide-gel electrophoresis and by the loss ofiron-binding capacity), the N-terminal domain isdenatured before the C-terminal domain.U.v. diference spectroscopy
Fig. 8 shows that, for both iron-free humantransferrin and iron-free hen ovotransferrin, in-crease in the height of the 292nm difference peakoccurs over a wide range of urea concentrations:aprox. 3.0-7.OM for human transferrin and 3.5-6.5 M for ovotransferrin.
Discussion
In these experiments the urea denaturation ofiron-free transferrin has been studied by u.v.measurements, gel electrophoresis and iron-bindingmeasurements. The main finding is that these threemethods reveal different aspects of the denaturationof transferrin. U.v. measurements show that un-folding of the protein occurs over a wide range ofurea concentrations (3-7M-urea for human trans-ferrin and 3.5-6.5M-urea for ovotransferrin). Thedecrease in electrophoretic mobility takes place inthe lower part of this range of urea concentrations.In human transferrin, two distinct steps occurred at2.8-4.0M-urea and 4.1-4.5 M-urea. From thebehaviour of the monoferric complexes (see below) itis suggested that the first step is due to the unfoldingof the C-terminal domain and the second step to thatof the N-terminal domain. In ovotransferrin asingle-step decrease in mobility was seen, with itsmid-point at 3.4 M-urea, and this probably re-presents the simultaneous unfolding of both do-mains. The loss of ability to bind iron, as judged byA470, takes place in the upper part of the urea
Vol. 189
OT -
OTFe-
Fe -.OT-
545
S

546 R. W. Evans and J. Williams
concentration range (5-7.2 M-urea for human trans-ferrin and 4-6 M-urea for ovotransferrin). Thusiron-binding can still occur in a concentration ofurea causing maximum decrease in electrophoreticmobility. Moreover, there is sequential loss ofiron-binding ability by the two domains in bothhuman transferrin and ovotransferrin (Fig. 7),despite the fact that, in the latter protein, the twodomains appear to denature simultaneously, asjudged by electrophoresis. In human transferrin theC-terminal domain loses its iron-binding abilitybefore the N-terminal domain does. In ovotrans-ferrin the order is reversed.
In the denaturation of the monoferric transferrincomplexes the unfolding of the iron-free domain isassumed to be responsible for the decrease inelectrophoretic mobility, since the diferric proteincomplexes appear completely to resist unfolding asjudged by this method. Fig. 2 shows that FeTfdenatures at the same urea concentration as the firststep for iron-free Tf. It is likely, therefore, that inboth cases this step is due to the unfolding of theC-terminal domain. There is also evidence (Figs. 2and 4) that, for some monoferric complexes, theiron-free domain received some protection againsturea denaturation from the presence of an iron atomin the other domain. Thus, for human transferrin, theN-terminal domain in the monoferric complex TfFeunfolds at a higher urea concentration than does theN-terminal domain in the iron-free protein. Inovotransferrin the C-terminal domain is more stablein the monoferric complex FeOT than in theiron-free protein. On the other hand, there appears tobe no protection of the C-terminal domain in FeTf orof the N-terminal domain in OTFe. The chemicalbasis for this asymmetrical effect is completelyunknown. The resolution of the two monoferriccomplexes during electrophoresis in 6M-urea/poly-acrylamide gels depends on the fact that, in bothhuman transferrin and hen ovotransferrin, theunfolding of the N-terminal domain causes a greaterdecrease in mobility than does the unfolding of theC-terminal domain.
Structural differences that might explain thedifferent stabilities of the two domains towards theeffects of urea are unknown. Disulphide bridges arethought to be important in maintaining stability, butin ovotransferrin the half-cystine contents of the N-and C-terminal domains are approximately equal(Williams, 1975), whereas, in human transferrin,MacGillivray et al. (1977) found sixteen half-cystineresidues in the C-terminal half of the polypeptidechain and only eight in the N-terminal half.However, Evans & Williams (1978) found nearlyequal half-cystine contents for the N-terminal andC-terminal fragments ofhuman transferrin.
Differential calorimetry has been used to obtaininformation on the thermal denaturation of trans-
ferrin. Donovan & Ross (1976) found that iron-freehuman transferrin showed two peaks of thermaldenaturation, at 62 and 720C, and suggested thatthese represented the denaturation of the twodomains of the protein. It is not known whichdomain corresponds to each peak of thermaldenaturation. On the other hand, iron-free henovotransferrin gave a single peak of denaturation at630C (Donovan & Ross, 1975). These results aresimilar to those on urea denaturation reported here.Evans et al. (1977) studied the thermal denatur-ation of the N-terminal and C-terminal iron-bindingfragments obtained from ovotransferrin by partialproteolysis. They found that the N-terminal frag-ment denatured at 56.5 °C and the C-terminalfragment at 600C. Although data on fragmentscannot be compared directly with data on the wholeprotein, the calorimetry is consistent with the findingthat the N-terminal domain of the ovotransferrindenatures before the C-terminal in urea solutions.
We are grateful to Mrs. Kathleen Moreton for herskilled and enthusiastic assistance, and to Prof. N. D.Chasteen for valuable suggestions. We acknowledgefinancial support from the Medical Research Council.
References
Aisen, P., Leibman, A. & Reich, H. A. (1966) J. Biol.Chem. 241, 1666-1671
Aisen, P., Leibman, A. & Zweier, J. (1978)J. Biol. Chem.253, 1930-1937
Azari, P. R. & Feeney, R. E. (1958) J. Biol. Chem. 232,293-302
Creighton, T. E. (1979)J. Mol. Biol. 129, 235-264Donovan, J. W. & Ross, K. D. (1975)J. Biol. Chem. 250,
6026-6031Donovan, J. W. & Ross, K. D. (1976) Fed. Proc. Fed.Am. Soc. Exp. Biol. 35, 1608
Evans, R. W. & Williams, J. (1978) Biochem. J. 173,543-552
Evans, R. W., Donovan, J. W. & Williams, J. (1977)FEBS Lett. 83, 19-22
Glazer, A. N. & McKenzie, H. A. (1963) Biochim.Biophys. Acta 71, 109-123
Graham, I. & Williams, J. (1975) Biochem. J. 145,263-279
Leibman, A. & Aisen, P. (1979) Blood 53, 1058-1065MacGillivray, R. T. A., Mendez, E. & Brew, K. (1977) in
Proteins ofIron Metabolism (Brown, E. B., Aisen, P.,Fielding, J. & Crichton, R. R., eds.), pp. 133-141,Greene and Stratton, New York
Makey, D. G. & Seal, V. S. (1976) Biochim. Biophys.Acta 453, 250-256
Williams, J. (1968) Biochem. J. 108, 5 7-67Williams, J. (1975) Biochem. J. 149, 23 7-244Williams, J. & Moreton, K. (1980) Biochem. J. 185,
483-488Williams, J., Evans, R. W. & Moreton, K. (1978)
Biochem. J. 173,535-542Yeh, Y., Iwai, S. & Feeney, R. E. (1979) Biochemistry 18,
882-889
1980

![Sodium Dodecyl Sulfate-PolyacrylAmide gel Electrophoresis [SDS-PAGE] Experiment 7 BCH 333[practical]](https://img.dokumen.tips/doc/110x75/5a4d1acb7f8b9ab05996f6d2/sodium-dodecyl-sulfate-polyacrylamide-gel-electrophoresis-sds-page-experiment.jpg)