Embed Size (px)
Citation preview
8
The Electrocardiogram – Waves and Intervals
James E. Skinner, Daniel N. Weiss and Edward F. Lundy Vicor Technologies, Inc,
USA
1. Introduction
To understand the Electrocardiogram, one must understand both the origin of the waves
(PQRST) and intervals between them (PQRST to PQRST or R-R). The waves are intrinsically
generated within the heart, with some regulation by the cardiac nerves, but the intervals are
extrinsically controlled primarily by the brain, through projections to both the auricular
pacemakers and the ventricular tissues. That is, the intervals are regulated by the brain, as
mediated through the autonomic effectors. To understand the R-R interval variations, one
must understand the neural mechanism(s) that underlie changes in the T to P segments,
which are lengthened and shortened in time to create the R-R variation.
The Society for Neuroscience does not pay substantive attention to Cardiology, and the
various societies of Cardiology do not pay much attention to Neuroscience. This two-way
neglect has forced the formation of a new society devoted to both fields of inquiry. The
Society for Heart-Brain Medicine was formed in 2007, and the plenary talks that established
the field on its own foundation included two by the current authors (Skinner, 2007a; 2007b).
A paradigm is a way of thinking, and a new one is a way of “thinking outside the box.” Two
new paradigms were presented by us at the first SHBM Meeting and each was based on
pivotal new discoveries. First, we showed that only nonlinear algorithms are appropriate for
analysis of physiological data, because the data themselves are nonlinear--- a nonlinear
algorithm is thus a more sensitive measure of the heartbeat dynamics (e.g., of R-R
variability) than all previous stochastic measures, such as the, mean, standard deviation,
power spectrum, and so on. Secondly, small proteins and peptides are known to regulate
physiology in parallel with the nervous system--- that is, the “state” (behavioral / neural)
determines the outputs of these two types of physiological effectors. Hibernation, for
example, in which the cold eventually shuts off the nervous system, continues to be
regulated by neuroendocrine molecules, some of which were indicated in a similar state
(REM sleep) to have salutary effects on the ischemic heart (suppression of arrhythmogenesis
in the electrocardiogram). This analogy between the similar states enabled conventional
proteomics to be used in the other state (e.g., in hibernation) and thus formed the basis for a
new way to discover drugs, “state-dependent proteomics.” With the method a new (anti-
infarction) drug candidate was actually discovered (Skinner, 2007a).
The realization that the heartbeat intervals in the electrocardiogram are primarily regulated by the brain provides us with an entirely new way to look at the electrocardiogram – the intervals are not intrinsically regulated by currents and pacemakers within the heart, as are the waves, but rather are under extrinsic control by the brain, mediated of course through the autonomic
www.intechopen.com
Advances in Electrocardiograms – Methods and Analysis
150
nervous system. The time between P-waves, which, in turn, affects the time between QRS’s, is mediated by the slow inward pacemaker current present in the sinus node and other atrial and ventricular tissues, called If or the “funny current”, a mixed Na and K slowly depolarizing inward current. In order for the cardiac-projecting nerves to alter the RR-interval it must be via this current. Also, the intra-QRS complex intervals (PR, QRS, QT) are certainly regulated by all of the currents, which are under external and intrinsic cardiac nervous system influences. Since the brain is so highly involved in regulating the RR-intervals, the initial studies of the electrocardiogram, mostly carried out in the anesthetized dog, must be carried out anew, but in the unanesthetized animal in a controlled behavioral state. The pig is the animal of choice, as it has endocardial distributions of the arteries and nerves that are homologous to humans, and furthermore the animal is born and raised in a standardize manner and has not been a pet or a mongrel, either of which would of course make their behavioral control less certain. The neurophysiology of the brain (electrophysiology and neurochemistry) of defined behavioral states and their impact on the electrocardiogram of the ischemic heart (in both animals and humans) are the topics of this manuscript.
2. Background - Role of the brain in the regulation of the waves and intervals in the electrocardiogram
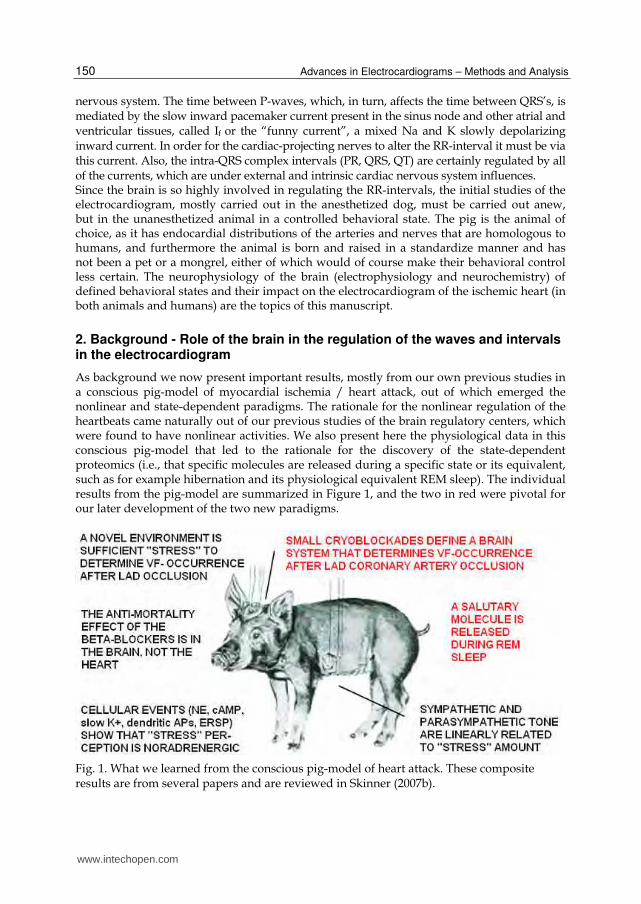
As background we now present important results, mostly from our own previous studies in a conscious pig-model of myocardial ischemia / heart attack, out of which emerged the nonlinear and state-dependent paradigms. The rationale for the nonlinear regulation of the heartbeats came naturally out of our previous studies of the brain regulatory centers, which were found to have nonlinear activities. We also present here the physiological data in this conscious pig-model that led to the rationale for the discovery of the state-dependent proteomics (i.e., that specific molecules are released during a specific state or its equivalent, such as for example hibernation and its physiological equivalent REM sleep). The individual results from the pig-model are summarized in Figure 1, and the two in red were pivotal for our later development of the two new paradigms.
Fig. 1. What we learned from the conscious pig-model of heart attack. These composite results are from several papers and are reviewed in Skinner (2007b).
www.intechopen.com

The Electrocardiogram – Waves and Intervals
151
At the beginning of the conscious animal studies, we were guided by Walter Cannon’s theory of a “Cerebral Defense System.” He postulated in his 1932 book, “The Wisdom of the Body,” that the focus for natural selection that led to the higher evolution of the brain was a cerebral “orchestrator” that simultaneously regulated the sensory input channels (e.g., of attended objects) and the autonomic output channels (e.g., for increasing the heart rate) in a moment of crisis. We already knew from our previous neurophysiological studies that the frontal cortex was the likely site of this hypothesized orchestrator, for we had found that it regulated the sensory input by a mechanism of selective neural inhibition at the thalamic level (Skinner, 1982). We then later stereotaxically implanted cryoneedles along a pathway that extends from the frontal cortex, through the hypothalamus, through the Fields of Forel, through the medulla, and then onward to the motor neurons that give rise to the cardiac nerves. Collateral branches are given off to the various nuclei all along this descending pathway. We found that cryoblockade anywhere within this anatomically interconnected system would prevent the lethal consequence of total occlusion of the left anterior descending (LAD) coronary artery (Skinner and Reed, 1981). A similar effect was reported after surgically cutting the cardiac nerves (Ebert et al, 1970).
Fig. 2. Reversible cryoblockade in the brain of a conscious animal. From Skinner & Lindsley, 1968. See Skinner (1970) for a simple method.
The cryogenic method illustrated in Figure 2 is actually very easy to master (Skinner & Lindsley, 1968; Skinner, 1970) and enables the conscious animal to serve as its own control. Specific blockades in the brain (i.e., stereotaxic implantation followed by postmortem reconstruction) were found to prevent lethal arrhythmogenesis up to the maximum 25-min period of reversible myocardial ischemia. After recovery from the cryoblockade and reversal of the ischemia, the same animal (pig) could then be used again for the control procedure. The results of this within-subjects as well as between-subjects experimental design is demonstrated in Figure 3 (Skinner & Reed, 1981). Figure 3 shows the composite results of the various cryoblockades made in the conscious pig-model of heart attack. The cryoprobe tips (always implanted bilaterally) are shown
www.intechopen.com

Advances in Electrocardiograms – Methods and Analysis
152
reconstructed on four coronal sections of the pig brain. The locations shown in red are for the 2x4 mm cryoprobe tips that, when cooled (but not when at brain temperature), prevented VF after LAD coronary artery occlusion (i.e., in unadapted or laboratory “stressed” subjects). Also shown (blue) are the locations of control tip-sites that, when cooled bilaterally, had no effect on VF after coronary occlusion. The collected red loci mark the trajectory along a pathway that interconnects the known cardiac regulatory nuclei each of which receive and send information between one another.
Fig. 3. Composite cryoblockade loci that either prevented VF after LAD occlusion (red) or did not (blue). From Skinner & Reed, 1981; Skinner, 1985.
This neurocardiac system is located between the frontomesial (Figure 3, red with white dots) and orbital cortex at one end and the motor nuclei that project to the heart on the other. Electric stimulations were done in the frontomesial cortex (Figure 4) by our laboratory and these produced cardiac arrhythmias, proving their participation in the system that regulates cardiac vulnerability to arrhythmias. The arrhythmogenic effect of the electric stimulation of each of the other structures in this neuro-cardiac system has been reported by others (reviewed in Skinner, 1985). Thus, a single brain system composed of hierarchically-interconnected telencephalic-, diencephalic-, mesencephalic-, and myelencephalic-loci terminates in the autonomic effectors already shown to control the vulnerability of the heart to lethal VF during an experimental heart attack (i.e., in the mildly-stressed pig). Once having a conscious animal model, we turned to study the behavioral regulation of this newly discovered neurophysiological system. We found that gradual systematic reduction of laboratory “stress,” through learned adaptation to the unfamiliar surroundings, ultimately had the same salutary effect as denervation--- i.e., no VF after LAD occlusion (Skinner, Lie, Entman, 1975). We then showed that the same systematic reduction of stress linearly decreased sympathetic drive on the myocardium, i.e., as measured precisely by phosphorylase activation, using yield-independent cryosamples obtained through a throacic window (Skinner, et al, 1983). This sympathetic effect must have been accompanied by a simultaneous reduction in parasympathetic tone, because the resting heart rate and blood pressure remained the same. The point to be underscored is that behavioral stress-reduction leads to a loss of autonomic drive. We next studied the neuronal responses in the frontal cortex to defined stressors (e.g., novel
stimuli, aversive conditioned stimuli, mild noxious stimuli) and found that they all
www.intechopen.com

The Electrocardiogram – Waves and Intervals
153
produced the same electrochemical effects: norepinephrine was released from presynaptic
terminals, postsynaptic cyclic AMP was activated (as the second messenger) that then
controlled a slow outward potassium current, leading to increased excitability in the
dendrites of the neurons and the generation of an extracellular event-related slow potential.
Each of these data types is learning-dependent and, therefore, is nonlinear in time. So the
Cannon-controller of the heartbeats is itself nonlinear. This feature is also supported
independently by noting that the biophysics of the neuronal action potentials is nonlinear,
as modeled by the Hodgkin-Huxley (nonlinear) equations.
These collected cellular responses of the cerebral neurons to transient stressor-events
suggested to us that an intracerebral beta-blocker may dampen these mediating neurons
and thus have an anti-VF effect in the conscious pig-model similar to that of the
cryoblockades. We showed that, indeed, this noradrenergic cerebral system was the site of
action for the anti-mortality effect of the beta-blocker drugs, and not the noradrenergic
cardiac receptors. Intracerebral injections of levo-propranolol prevented VF after LAD
occlusion, whereas intravenous injections did not (Skinner, 1985; Parker et al, 1993). This
interpretation of a cerebral anti-mortality mechanism is supported by clinical studies
reported by Aoke Hjalmarson (2000), who showed that the anti-mortality efficacy of the
various beta-blocker drugs was related to their lipophilicity. The lipophilic drugs get into
the brain at a higher level and thus may explain their greater efficacy in preventing
arrhythmic death in post-MI patients.
As shown In Figure 4, electric stimulation (2 sec, 30 Hz) of the mesial frontal cortex (inset,
filled, but not unfilled sites) will increase heart rate, reverse the R-waves (as occurs in
ischemia), and result in premature beats (arrhythmias) that eventually end in VF if the
stimulus is strong and long enough. In contrast to the cryoblockade, the direct electrical
stimulation of the frontocortical-brainstem system will evoke malignant cardiac arrhythmias
in a normal heart. The same effects seen for the mesofrontal cortical stimulation have been
shown for stimulation of the other subcortical loci of the structured system indicated in
Figure 3 by the red sites (Skinner, 1985). The blockade and stimulation studies together
suggest a necessary and sufficient (i.e., causal) role for this cerebral system to play in VF
occurrence. The same cannot be said of the heart as the system, for after cardiac denervation
LAD occlusion will not lead to VF (Ebert et al, 1970). Natural regulation of the brain by REM sleep (Figure 4, lower traces) has a salutary effect on ectopic arrhythmias that result from a previous myocardial infarction. The seconds-long latency between REM onset and the salutary effect (double-headed arrow) suggests mediation by a neurohumoral molecule. Hibernation appears to be a good steady-state model for REM sleep, as both states have the same uncommon features: 1) complete muscle atonia, 2) complete turn-off of both sympathetic and parasympathetic tone (Baust and Bonnert, 1969; Skinner et al, 1975), and 3) multiple endocrine secretions. Using the state of hibernation in which it is easier to collect molecules from fluids, we were able to isolate, identify, synthesize and then inject (IV) a molecule that would prevent tissue damage after 45 minutes of coronary artery occlusion (heart attack) or 1 hour of cerebral artery occlusion (stroke). This anti-infarction effect is illustrated for the stroke model in Figure 5. More details of the state-dependent proteomics methods are provided in Skinner (2007a). Where the salutary molecule is released is not yet known, but it appears to be from the brain because of the seconds-long latency between the time it is released and the time it is effective in the heart (Figure 4, two-way arrow). A neuroendocrine system is all that is left to
www.intechopen.com

Advances in Electrocardiograms – Methods and Analysis
154
Fig. 4. Effect on the heartbeats produced by a brief electric stimulus to the mesofrontal cortex (upper trace and inset), and an effect of REM sleep on the suppression of arrhythmias in an infarcted heart. From Skinner (1985; 2007a,b).
operate the life-support physiologies during hibernation, because the nervous system is gradually turned off by the cold. Such dual regulation between neuroendocrine and neurophysiological systems is also apparent during other behavioral states, such as the cerebral defensive state (e.g., neural increase in heart rate followed by adrenal gland secretions to increase heart rate). This same dual parallel regulation may also apply to the state of “learned adaptation to stressors,” in which state lethal arrhythmogenesis is prevented--- that is, the newly discovered anti-infarction molecule released during REM sleep may be involved in equivalent waking states as well. Figure 5 shows the mouse model of middle cerebral artery occlusion followed by reflow. The middle cerebral artery is completely occluded, as documented by laser-Doppler flow in the parietal cortex. After 1-hr, the occlusion is then reversed (i.e., a model of thrombolysis in a modern hospital procedure). Immediately after reflow is established, either the control molecule (Figure 5, left) or the synthesized anti-infarction molecule based on a naturally occurring neuropeptide (Figure 5, right) is injected in the tail vein. 24-hrs later the animal’s behavior is observed for limb paralysis and its brain is extracted, sliced, and incubated with Tri-Tetrazolium Chloride (TTC), a stain for viable tissue (it binds to functioning mitochorndria). The anti-infarction molecule was found to result in 100% tissue savings in many of the model cases, with no tissue saving effect ever occurring in the controls. The controls manifested hemiplegia associated with the usual lack of TTC staining in the infarcted tissue (Figure 5, left, white). It was concluded from this study that the parallel physiological actions by the neurons and the neuroendocrine secretions exerted during the natural state of REM sleep would then be found to be the same as those exerted during an equivalent model state (hibernation). The important technical discovery was that the neurosecretory molecules collected more easily during the hibernation model could then be found to operate in the more natural state with the same effect--that is, the salutary action on the ischemic heart that occurs during REM sleep (Skinner, 2007a). Who knew that the
www.intechopen.com

The Electrocardiogram – Waves and Intervals
155
new “state-dependent proteomics” paradigm would lead to such a powerful molecule as the anti-infarction drug candidate so compellingly presented in Figure 5?
Fig. 5. Mouse model of 1-hr occlusion of the middle cerebral artery, followed by recirculation and IV injection of control (left) or synthesized anti-infarction molecules (right). From Skinner 2007a.
3. Some leading questions about heart rate variability
The following five questions and their simple answers will be further explained by the text, tables, and figures in the sections below. These particular Q & A’s are intended to cover some of the common ones raised by physicians and researchers concerning the medical assessment of the heart by studying its rate variability (HRV). 1. Q. Why should brain physiology tell you anything about cardiac vulnerability to VF, as
assessed by HRV? A. Both HRV and VF-initiation involve the exact same brain structures; that is, the frontocortical-brainstem system simultaneously controls heart rate and vulnerability to VF.
2. Q. The use of measures of HRV is an old warn-out area in cardiology--- they sort of work, but have a lot of false negative and false positive predictions; so, why should a new measure be expected to be any better? A. The PD2i uses nonlinear analysis of the heartbeats and is, therefore, better able to extract information from the signal, with the result that it accurately predicts arrhythmic death in chest-pain patients with unprecedented Sensitivity and Specificity compared to the other algorithms.
3. Q. What is the nonlinear PD2i algorithm and how is it calculated? A. This computerized algorithm uses simple pair-wise comparisons of multi-dimensional vectors made from brief RR-intervals sampled throughout the data, and it reveals how many independent variables (degrees of freedom) are responsible for the heartbeat regulation at that one moment in time; when PD2i indicates reduced degrees of freedom (as measured in dimensions), it means a lot of physiological cooperation is going on among the independent brain regulators (neural centers) that control the heartbeats and VF-vulnerability.
www.intechopen.com

Advances in Electrocardiograms – Methods and Analysis
156
4. Q. How does PD2i compare to all of the other HRV algorithms out there? A. It is superior in both its discriminability between experimental and control groups (p<0.0006) and its ability to analyze noisy, non-stationary data (see Figure 11 below)
5. Q. T-wave Alternans (TWA) was once the hot new heartbeat technology in cardiology that recently fell from grace (Cleland et al, 2008); why would PD2i be any different? A. The PD2i measures what is going on in the brain (i.e., neural regulation of the heartbeat intervals) and TWA measures what is going on in the heart (i.e., recovery from refractoriness, which tends to oscillate if the myocardium is ischemic), and as the new field of heart-brain medicine attests, Sudden Cardiac Death is now considered a brain physiological problem, not an intrinsic heart problem. Although TWA is responsive to neural signals (e.g., the heart reacts to cerebreal defensive neural input), its etiology is derived from the physiology of the heart--- i.e., the refractory cycle of the cardiac cells.
4. The degrees of freedom in the heartbeat intervals
The diagram of the Brain-Heart system in Figure 6 indicates the lower (1) to higher (6) cerebral hierarchy of the structures that regulate the heartbeats. The sensory and motor neurons of the lowest component (1) actually lie within the heart itself, and are capable of performing the same chemo- and stretch- reflexes characteristic of the higher centers above it. The fronto-cortical to brainstem system that controls vulnerability to VF (Figure 3) is isomorphic with these well known sensory-motor loops that control the heartbeats, including the intrinsic afferent-interneuron-efferent loop (Skinner et al, 1996) and the vago-frontocortical-brainstem loop (Chase et al, 1966). This isomorphism led to the rationale for examination of the various measures of heartbeat dynamics in the conscious pig-model that might predict vulnerability to VF. The heartbeats are well known to be regulated by the six afferent-efferent neural loops shown in Figure 6, each of which competes with the others to
Fig. 6. Brain – heart system thought to simultaneously regulate heart rate and vulnerability to VF. From Skinner (2007b).
www.intechopen.com

The Electrocardiogram – Waves and Intervals
157
control the heartbeat intervals. The close examination of the anatomical structure of each loop shows them all to be highly interconnected, either by sensory collateral branches, bifurcating interneurons, or descending efferent fibers. There really are six independent regulators of the heartbeats during the resting state. A way was discovered to count them using a nonlinear measure of the degrees of freedom in the heartbeat series. During quiet wakefulness, each of the loops in Figure 6 makes an independent contribution to the regulation of the RR-intervals and this results in a rather “jittery” RR-interval series from which the degrees of freedom can then be calculated. This concept of degrees of freedom and its variation is simply illustrated in Figure 7.
Fig. 7. Illustration of degrees of freedom in a data time series.
Figure 7 illustrates an example of persons turning the crank of an AC generator to light a
bulb. A single person turning the crank makes a smooth sinusoid at the output, as shown in
the upper trace. In this case the measured degrees of freedom are 1. When three persons
attempt to turn the crank, they make a more “jittery” sinusoid (middle trace). The nonlinear
measure correctly shows that his output trace has precisely 3 degrees of freedom. If,
however, an orchestrator comes by and instructs the crankers to cooperate with his baton,
then they can, momentarily, make a smooth sinusoid with the degrees of freedom dropping
back to 1 (bottom trace; still 3 crankers, but they are cooperating). So the “degree of
cooperation” as well as the maximum “number” of independent generators together
determine the amount of time-dependent “jitter” in the data series. The next figure shows
how this nonlinear algorithm actually works.
In Figure 8, part A., a “jittery” data series is shown. Part B. illustrates a step in making the calculation of the degrees of freedom for the Point Correlation Dimension (PD2i), by gathering two “i” and “j” samples of the data (e.g., R to R heartbeat intervals) and then comparing them by their multi-dimensional vectors (in the illustrated case, m = 3) and then finding the vector difference lengths (VDLs) for all VDLij. The “i” and “j” represent values that are incremented throughout the data series and the VDLs are repetitively calculated
www.intechopen.com

Advances in Electrocardiograms – Methods and Analysis
158
Fig. 8. Making the vector difference lengths to calculate the Point Correlation Dimension (PD2i).
until the end of the data stream is reached for both i and j. Values where i = j are omitted, as
they will always be equal to zero; the end of the data stream is not N (number of data
points), but N minus the number of data points needed to make the last of the vectors,
where m is the number of dimensions of the vectors (m is called the “embedding
dimension”). Part C. shows that once the VDLij values are made and collected together for
each fixed value of i compared and all j, they are then rank ordered. Imagine that all of the
ranked VDLij for a fixed value of i are soldiers ranked by height, with those of the same
height being placed behind the one at the front. Now a general takes a series of small to
large steps, R1 through R6, with each step starting at the same place just before the small
soldier column. With each first step, small to large, the general counts the total number of
soldiers in all of the rank columns that are crossed in that step. That is, the general counts
(C) the VDL’s that increase in number as he systematically increases the range (R) of his step
size, and steps across all ranks. Shown in Part D., there will be a new exponent value for
each point (“P”) in the data series; the “i” in “PD2i” is added to emphasize that PD2i is time-
dependent, and the “D2” means that the PD2 approaches the correlation dimension (D2) as
N goes to infinity.
As shown at the top of Figure 9, PD2i is the slope of the log-log plot of C vs R. For large data
length (Ni approaches infinity) there will be a first long linear scaling region (1) followed by
a shorter one (2) that eventually disappears as Ni gets very large. For Ni = 10PD2i there will
www.intechopen.com

The Electrocardiogram – Waves and Intervals
159
Fig. 9. Log-log plot of C vs R (also called the correlation integral) for each value of m.
be more scaling regions (1-3) because of the finite data length. The minimum Ni-value is experimentally determined according to Kostilich and Swinney (1989), and is required to capture all of the lobes of a physical attractor. This criterion for Ni should be adopted for physiological data, too, as with this data-length there is clear convergence of slope vs m by the 9th embedding dimension (bar above lower right curve for m = 9 to m = 12). In summary, PD2i is measured as a function of its location in the data series (i), which means that for each i-sample of data it is compared to all possible j-samples. Then position-i is incremented and again compared to all j-samples for the next PD2i. In the left panels of Figure 9 are shown for a given i-sample the log-log plots for embedding dimensions m = 1 (top most data points) through m = 12 (bottom); remember, the embedding dimension is related to the number of selected data points (e.g., RR-intervals) used as coordinates to make the pairwise vectors. Note that slope increases with m, as shown in the upper right plot of Figure 9. After 9 embedding dimensions, the slope (PD2i) is no longer increased with each new embedding dimension and stays the same value; this is the point at which the slope “converges” with embedding dimension. After convergence, m does not have to be increased any more. The first part of this slope, or scaling region, will contain very few contributions of VDL’s made from j-vectors located in non-stationary data with respect to that of the i-vector (i.e., the VDLs will be large), and that is why the scaling region for the PD2i algorithm is restricted--- it makes the PD2i calculation insensitive to the data non-stationarities. In data of smaller total length (Figure 9, bottom two panels), but following the rule that Ni must be greater than 10 to the PD2i power, a “floppy tail” (FT, left) appears. The FT is caused by the
www.intechopen.com
Advances in Electrocardiograms – Methods and Analysis
160
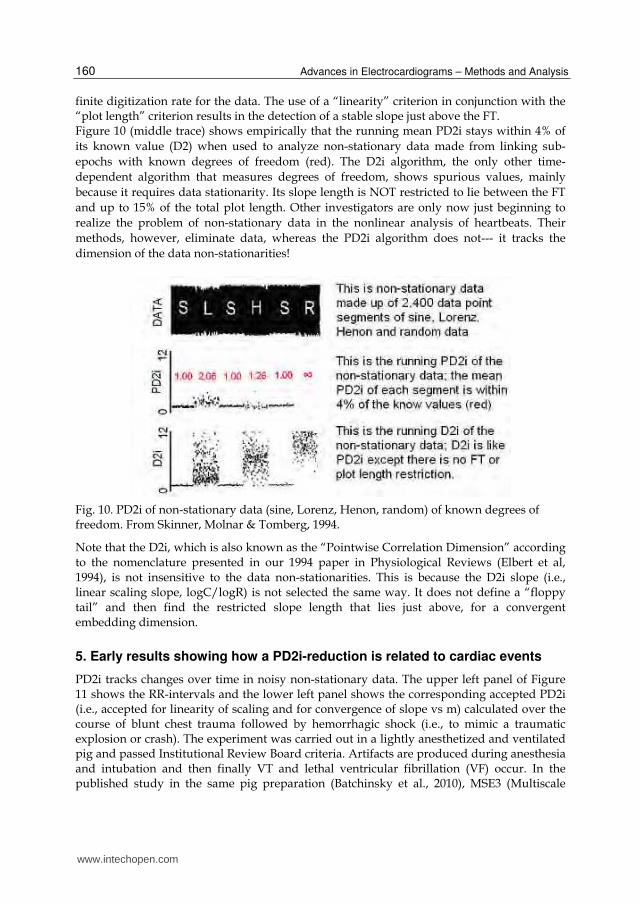
finite digitization rate for the data. The use of a “linearity” criterion in conjunction with the “plot length” criterion results in the detection of a stable slope just above the FT. Figure 10 (middle trace) shows empirically that the running mean PD2i stays within 4% of
its known value (D2) when used to analyze non-stationary data made from linking sub-
epochs with known degrees of freedom (red). The D2i algorithm, the only other time-
dependent algorithm that measures degrees of freedom, shows spurious values, mainly
because it requires data stationarity. Its slope length is NOT restricted to lie between the FT
and up to 15% of the total plot length. Other investigators are only now just beginning to
realize the problem of non-stationary data in the nonlinear analysis of heartbeats. Their
methods, however, eliminate data, whereas the PD2i algorithm does not--- it tracks the
dimension of the data non-stationarities!
Fig. 10. PD2i of non-stationary data (sine, Lorenz, Henon, random) of known degrees of freedom. From Skinner, Molnar & Tomberg, 1994.
Note that the D2i, which is also known as the “Pointwise Correlation Dimension” according to the nomenclature presented in our 1994 paper in Physiological Reviews (Elbert et al, 1994), is not insensitive to the data non-stationarities. This is because the D2i slope (i.e., linear scaling slope, logC/logR) is not selected the same way. It does not define a “floppy tail” and then find the restricted slope length that lies just above, for a convergent embedding dimension.
5. Early results showing how a PD2i-reduction is related to cardiac events
PD2i tracks changes over time in noisy non-stationary data. The upper left panel of Figure 11 shows the RR-intervals and the lower left panel shows the corresponding accepted PD2i (i.e., accepted for linearity of scaling and for convergence of slope vs m) calculated over the course of blunt chest trauma followed by hemorrhagic shock (i.e., to mimic a traumatic explosion or crash). The experiment was carried out in a lightly anesthetized and ventilated pig and passed Institutional Review Board criteria. Artifacts are produced during anesthesia and intubation and then finally VT and lethal ventricular fibrillation (VF) occur. In the published study in the same pig preparation (Batchinsky et al., 2010), MSE3 (Multiscale
www.intechopen.com

The Electrocardiogram – Waves and Intervals
161
Entropy) and PD2i were compared along with other algorithms. Continuous 200-beat samples of clean and relatively stationary data were used, as MSE3 requires such selection of clean data to be accurate in short files. It is impossible to have such clean noise-free data when recording ECGs in the field, for they resemble the artifact-riddled ECGs observed during intubation. Note that accepted PD2i could be recorded during this intubation period.
Fig. 11. Effects of trauma (chest thumper) and blood-loss on the RR-intervals (upper left) and corresponding accepted PD2i (lower left) in the anesthized pig. RRi vs PD2i is shown at the upper right and the PD2i histogram is shown at the lower right, along with the accepted PD2i statistics.
Fig. 12. The PD2i of the RR intervals of two Emergency Department patients presenting with chest pain. The patient with the PD2i between 0 and 3 (right) died of VF within a few days, and the other (left), with similar SDNN and power spectra, lived for at least one year of follow up. The RR interval scale is 600 to 1000 msec.
www.intechopen.com

Advances in Electrocardiograms – Methods and Analysis
162
Figure 12 shows RRi and PD2i data for two typical patients presenting in the Emergency
Room with chest pain. Figures 13 and 14 show the same RRi and PD2i results for larger
numbers of patients. Table 1 shows the comparison of various HRV algorithms used on the
same RRi intervals to predict risk of arrhythmic death. Only the PD2i algorithm is
statistically significant for all patient subgroups. These multi-centered studies (Skinner et al,
2008; 2009) were carried out in a total of 918 Emergency Department patients and the results
were highly statistically significant for all subgroups, unlike the results for the other
comparison algorithms.
Fig. 13. The PD2i of the RR intervals of 18 consecutive Emergency Department patients presenting with chest pain, who manifested VF within the 1-year of follow-up. The red line is the criterion cut-point of 1.4 indicated by previous studies (Skinner et al,1991; 1993; Vybiral & Skinner, 1993) to separate subjects that would later manifest VF from those that would not. From Skinner et al, 2008a.
T-wave alternans (TWA or Microvolt TWA) was once a popular algorithm for predicting
risk of sudden death. Medicare’s CMS Committee even approved its use to stratify risk in
patients who would receive an ICD (implantable cardiac defibrillator). Unfortunately the
MASTER Trial did not show microvolt TWA to identify patients at increased risk of life-
threatening ventricular arrhythmias (Cleland et al, 2008). Shown in Figure 15, panels A-C ,
are the heartbeat intervals (RRi), degrees of freedom (PD2i) and T-wave lability (L; very
similar to TWA) for three patients who manifested AD at different times after their ECG was
recorded. The T-wave lability is indicated by the range of variation of the T-waves when 5
successive heartbeats are superimposed by alignment of the PQ-intervals. The ECG samples
were obtained at the three different times indicated by the numbers above the PD2i trace (1-
3). There is an apparent lability (L) in the T-waves in those patients who manifested AD,
www.intechopen.com

The Electrocardiogram – Waves and Intervals
163
Fig. 14. The PD2i of the RR intervals of 18 Emergency Department patients presenting with chest pain, who were matched to the clinical data of the 18 patients in the previous figure, who did not manifest VF within the 1-year of follow-up. From Skinner et al, 2008a.
either immediately or within a few days (A. and B.). In the patient in B., the lability of the T-
waves did not begin until the PD2i temporally descended to the vicinity of 1.4 (horizontal
line), a finding which indicates some relationship between PD2i and the lability of
refractoriness in this subject. In part C. the patient showed no T-wave lability, yet there still
was a minimum PD2i (min PD2i) ≤ 1.4 that predicted the later AD.
The Relative Risk statistic is shown in all cells for the same ED patients (** means p ≤ 0.01; * means p ≤ 0.05). Subgroups: AMI = acute myocardial infarction; non-AMI = no acute MI; post-MI is greater than 6 months post MI; non-post-MI = no post MI. Algorithms: PD2i = Point D2; DFA = detrended fluctuation analysis; 1/f Slope = 1/f power spectrum; ApEn = Approximate Entropy; SDNN = standard deviation of normal to normal R-R intervals; MNN = mean of normal to normal R-R intervals; LF/HF = low frequency/high frequency power spectra; LF (ln) = normalized by natural log of low frequency data. From Skinner et al, 2007a; 2009.
Table 1. Comparison of PD2i with other HRV algorithms in various sub-groups
www.intechopen.com

Advances in Electrocardiograms – Methods and Analysis
164
Fig. 15. Comparison of TWL (T-wave lability, similar to TWA) with PD2i of RRi in chest pain patients who manifested arrhythmic death (AD) at different times after the ECG recording. Five successive QRST complexes, sampled at the times shown in the left panels, were superimposed after alignment of the P to Q intervals; the lability of the T-wave is seen as the range of the trace ends at the right. From Skinner (2007a).
It would seem, however, that PD2i predicts AD at a time when TWA does not (Figure 15, part C). This might be because TWA is a measure of a “bad heart” (i.e., lability of refractoriness due to myocardial ischemia) and PD2i is a measure of a “bad brain” (i.e., autonomic cooperativity). As we have seen in the pig-model of heart attack, any T-wave lability produced by myocardial ischemia (complete coronary artery occlusion) is not sufficient to lead to a VF outcome. It takes a “bad brain,” i.e., the cooperativity projected out of the autonomic nervous system, to generate the physiological dynamics suitable to underlie the initiation of VF--- ischemia alone will not do it! From the studies listed in Figure 1, it would appear that this cooperation among the heartbeat controllers occurs at a time when sympathetic (and reflexive parasympathetic) tone is high. As will be seen in the next section on the electrogenesis of the waves in the electrocardiogram, these cerebral effects must somehow cause alterations in the wavefront and refractory period and bend the wavefront until it forms a rotating spiral wave (rotor), the immediate cause of VF. The rotor is self-sustaining, splits into other rotating spiral waves and thus becomes VF. The rotor itself seems to result, in nearly all physiological cases of VF ever observed, from a sequellae of arrhythmic events: first a premature beat, followed by ventricular tachycardia and then by VF.
www.intechopen.com

The Electrocardiogram – Waves and Intervals
165
6. Electrogenesis of the waves and intervals in the electrocardiogram
In the previous section we showed that reduction in the degrees of freedom in the
variations of the brain-controlled heartbeat intervals is associated with later lethal
arrhythmogenesis in Emergency Room patients presenting with chest pain. The rather flat
part of the electrocardiogram is where the RR-interval is lengthened or shortened by the
brain projections to the heart. The “funny” current (If, Brown et al, 1979) controls sodium
and potassium channels during the diastolic depolarization phase of each heartbeat,
shortening it to increase heart rate and lengthening it to decrease heart rate. The intrinsic
pacemaker potential is generally thought to initiate the heartbeat, but If determines when
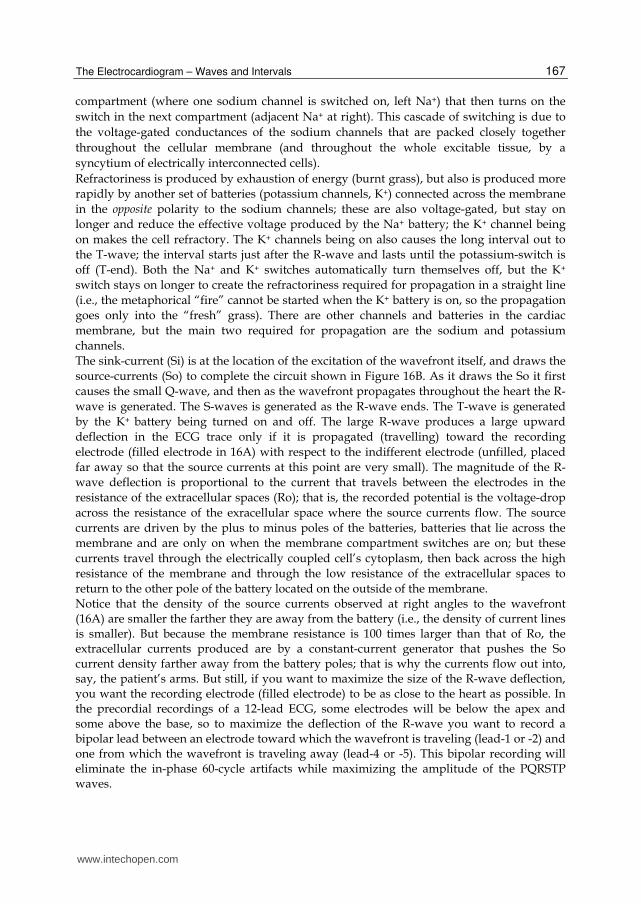
that will occur. Nerve fibers project not only to the pacemaker and Purkinje cells to evoke If, and thus control heart rate, but there are also projections to the cardiac arteries and to large interstitial spaces in the ventricular tissues. These latter fibers have terminals that release molecules that can evoke severe vasoconstriction (ischemia) and alter local conduction, propagation and refractoriness so as to produce the various types of ECG anomalies and arrhythmias seen in Figure 4 that result from direct electrical stimulation of the brain. The neural effects of the nerves can no longer be considered to be simple cholinergic and noradrenergic effects that speed up or slow down the oscillatory pacemaker cells. The P-wave (Figure 16B) is produced during the contractions of the atria that load blood into the ventricles. The contractions of the ventricles force blood through the lungs (right ventricle) and then into the aorta (left ventricle) to pressurize the circulation of the blood. The atrial contractions are initiated at the atrial pacemaker sites. Propagation leads to the spread of excitation to the ventricular surface via the sub-surface and high-speed conduction medium of the Purkinje fibers. The Purkinje fibers end in and first activate the apex (point) of the heart. This initial point of ventricular excitation and contraction then further spreads throughout the heart causing an efficient squeeze that forces blood to move smoothly through the lungs and out into the aorta. The initial apical surface wavefront and its spread throughout the heart produces the QRST-waves. The electrical properties of the cellular membrane potentials that underlie the excitation, propagation and refractoriness mechanisms were each worked out in the 1950’s, in the giant squid axon, by the classical papers of Hodgkin & Huxley (1952). These propagation properties interact with the “funny” current (If, Brown et al, 1979), injected primarily into the atrial pacemaker cells to regulate heart rate. But other nerve terminals project directly into the ventricular tissues and release broadly various molecules that can control propagation velocity and direction in the excitable medium. The overall neural effects not only control heart rate at the pacemakers, but also the propagation of wavefronts in the ventricles. These latter controls can bend the wavefronts into curves, that can ultimately lead to rotating waves that can catch their own tails and become self-sustaining “rotors.” Figure 16 shows how the complex of waves is generated during the propagation of an electric wavefront through excitable tissue, such as the wall of a cardiac atrium, cardiac ventricle, cardiac Purkinje-fiber, or a giant squid axon. The atrial tissues containing the sinoatrial and atrioventricular nodes (pacemaker tissues) are innervated by the autonomic nerves and through a complex mechanism cause the P-wave. The wavefront of depolarization of the nerve cells causes a similar action on the atrial pacemaker tissue. A few milliseconds later the R-wave is initiated at the point of the heart (apex) by the Purkinje fibers that rapidly conduct excitation from the AV node to the apex, but in a subsurface
www.intechopen.com
Advances in Electrocardiograms – Methods and Analysis
166
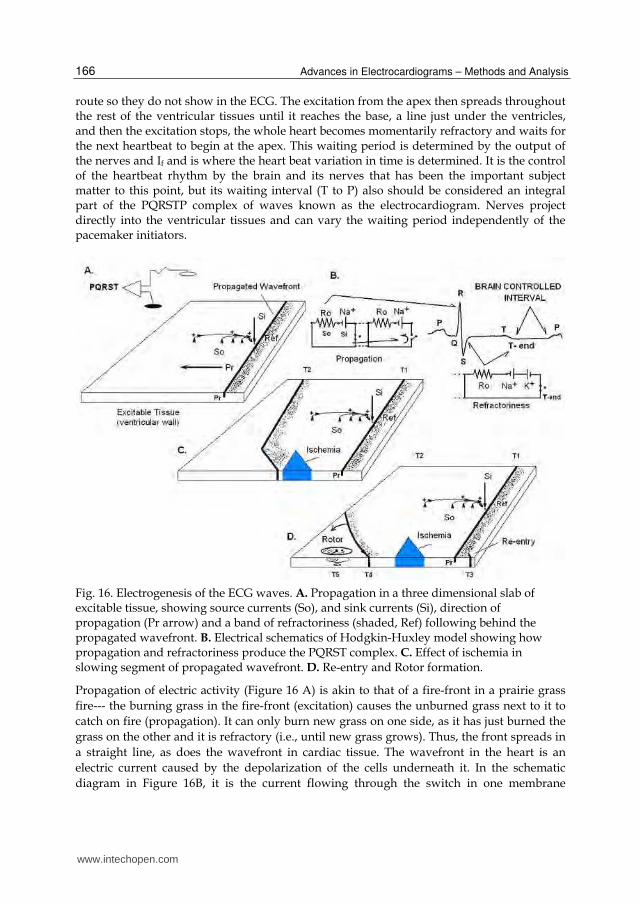
route so they do not show in the ECG. The excitation from the apex then spreads throughout the rest of the ventricular tissues until it reaches the base, a line just under the ventricles, and then the excitation stops, the whole heart becomes momentarily refractory and waits for the next heartbeat to begin at the apex. This waiting period is determined by the output of the nerves and If and is where the heart beat variation in time is determined. It is the control of the heartbeat rhythm by the brain and its nerves that has been the important subject matter to this point, but its waiting interval (T to P) also should be considered an integral part of the PQRSTP complex of waves known as the electrocardiogram. Nerves project directly into the ventricular tissues and can vary the waiting period independently of the pacemaker initiators.
Fig. 16. Electrogenesis of the ECG waves. A. Propagation in a three dimensional slab of excitable tissue, showing source currents (So), and sink currents (Si), direction of propagation (Pr arrow) and a band of refractoriness (shaded, Ref) following behind the propagated wavefront. B. Electrical schematics of Hodgkin-Huxley model showing how propagation and refractoriness produce the PQRST complex. C. Effect of ischemia in slowing segment of propagated wavefront. D. Re-entry and Rotor formation.
Propagation of electric activity (Figure 16 A) is akin to that of a fire-front in a prairie grass
fire--- the burning grass in the fire-front (excitation) causes the unburned grass next to it to
catch on fire (propagation). It can only burn new grass on one side, as it has just burned the
grass on the other and it is refractory (i.e., until new grass grows). Thus, the front spreads in
a straight line, as does the wavefront in cardiac tissue. The wavefront in the heart is an
electric current caused by the depolarization of the cells underneath it. In the schematic
diagram in Figure 16B, it is the current flowing through the switch in one membrane
www.intechopen.com
The Electrocardiogram – Waves and Intervals
167
compartment (where one sodium channel is switched on, left Na+) that then turns on the
switch in the next compartment (adjacent Na+ at right). This cascade of switching is due to
the voltage-gated conductances of the sodium channels that are packed closely together
throughout the cellular membrane (and throughout the whole excitable tissue, by a
syncytium of electrically interconnected cells).
Refractoriness is produced by exhaustion of energy (burnt grass), but also is produced more
rapidly by another set of batteries (potassium channels, K+) connected across the membrane
in the opposite polarity to the sodium channels; these are also voltage-gated, but stay on
longer and reduce the effective voltage produced by the Na+ battery; the K+ channel being
on makes the cell refractory. The K+ channels being on also causes the long interval out to
the T-wave; the interval starts just after the R-wave and lasts until the potassium-switch is
off (T-end). Both the Na+ and K+ switches automatically turn themselves off, but the K+
switch stays on longer to create the refractoriness required for propagation in a straight line
(i.e., the metaphorical “fire” cannot be started when the K+ battery is on, so the propagation
goes only into the “fresh” grass). There are other channels and batteries in the cardiac
membrane, but the main two required for propagation are the sodium and potassium
channels.
The sink-current (Si) is at the location of the excitation of the wavefront itself, and draws the
source-currents (So) to complete the circuit shown in Figure 16B. As it draws the So it first
causes the small Q-wave, and then as the wavefront propagates throughout the heart the R-
wave is generated. The S-waves is generated as the R-wave ends. The T-wave is generated
by the K+ battery being turned on and off. The large R-wave produces a large upward
deflection in the ECG trace only if it is propagated (travelling) toward the recording
electrode (filled electrode in 16A) with respect to the indifferent electrode (unfilled, placed
far away so that the source currents at this point are very small). The magnitude of the R-
wave deflection is proportional to the current that travels between the electrodes in the
resistance of the extracellular spaces (Ro); that is, the recorded potential is the voltage-drop
across the resistance of the exracellular space where the source currents flow. The source
currents are driven by the plus to minus poles of the batteries, batteries that lie across the
membrane and are only on when the membrane compartment switches are on; but these
currents travel through the electrically coupled cell’s cytoplasm, then back across the high
resistance of the membrane and through the low resistance of the extracellular spaces to
return to the other pole of the battery located on the outside of the membrane. Notice that the density of the source currents observed at right angles to the wavefront (16A) are smaller the farther they are away from the battery (i.e., the density of current lines is smaller). But because the membrane resistance is 100 times larger than that of Ro, the extracellular currents produced are by a constant-current generator that pushes the So current density farther away from the battery poles; that is why the currents flow out into, say, the patient’s arms. But still, if you want to maximize the size of the R-wave deflection, you want the recording electrode (filled electrode) to be as close to the heart as possible. In the precordial recordings of a 12-lead ECG, some electrodes will be below the apex and some above the base, so to maximize the deflection of the R-wave you want to record a bipolar lead between an electrode toward which the wavefront is traveling (lead-1 or -2) and one from which the wavefront is traveling away (lead-4 or -5). This bipolar recording will eliminate the in-phase 60-cycle artifacts while maximizing the amplitude of the PQRSTP waves.
www.intechopen.com

Advances in Electrocardiograms – Methods and Analysis
168
As shown in Figure 16 C., time T2, myocardial ischemia will slow down the propagation of the wavefront; this delay is caused by many tortuous pathways of conduction through the ischemic zone and/or by the circulatory loss of high energy phosphates which energize the polarization process (i.e., make the batteries work). The delay may have other causes (e.g., neurally-induced ischemia and conduction losses), and the refractory period in and around the ischemic zone can become quite complex. In part D, T3, the delay causes the next wavefront to occur in the excitable tissue just behind the refractory period; thus a beat is created that is either shorter or longer than that of the previous beat depending on exactally where it occurs. A shorter beat leads to a reflexive compensatory pause in its next beat (i.e., seen in the ECG as a two-beat, premature, ventricular complex, PVC). The ischemic zone may cause more severe delays (Figure 16, D., T4), and can lead to the severe bending of the wavefront and the development of a rotating spiral wave (rotor) spinning around a pivot point in which the rotating wavefront constantly re-enters marginally recovered tissue; this spinning rotor is observed in the standard-lead electrocardiogram as ventricular tachycardia (VT). The pivot point meanders randomly, like that of a spinning top, and the rotor will eventually enter an area with a non-conductive piece of tissue, such as a coronary artery or infarcted tissue, and then split into two rotors; these rotors split, and so on, until the electrocardiogram manifests ventricular fibrillation (VF). A sequellae of waveforms in the ECG occurs in most cases of VF--- first PVCs, then VT, then VF. Arthur Winfree (1987) has seen these rotors in a three dimensional computer model that uses the Hodgkin-Huxley (nonlinear) equations. Instead of a delay in conduction that leads to a re-entrant beat, he simply injects the re-entrant wavefront current near the T-wave. But injection of current on top of a T-wave, or its equivalent through an ischemia-caused delay in propagation, are not the only ways to cause VF, for as was shown in Figure 4 (top ECG), electric stimulation in the brain can also cause VF in a normal heart. How this happens is not known, but the same sequellae of arrhythmias occur--- PVCs, VT and VF, so the underlying patterns of excitation and refractoriness must be equivalent to those associated with ischemia. Note that in Figure 6, the diagrammed efferent nerve fibers project not only to the pacemaker sites, but also directly into the ventricles where they can influence excitation, propagation, and refractoriness in the cardiac tissue. If one is interested in saving the life of a patient, then the rhythm of the heart should be the focus. That is not to say that the PQRST waves of the electrocardiogram are not important, but they are more directly related to the intrinsic properties of excitation, propagation and refractoriness dictated by the heart cells, properties which cannot explain the onset of lethal arrhythmias. We will now show that the consideration of the extrinsic properties of the nonlinear rhythm of the heartbeats imposed on the heart by the brain is best able to accurately predict risk of VF onset in a variety of clinical patient groups.
7. Clinical results of PD2i tests
Table 2 presents results of 3 independent studies of the heartbeat intervals (Skinner et al, 1993; 2008a; 2008b) showing that one or more PD2i ≤ 1.4 is a statistically significant (p ≤ 0.001) predictor of lethal arrhythmias (VF) in hospitalized patients: 1) in patients admitted to the Cardiology floor having episodes of non-sustained ventricular tachycardia; 2) in patients presenting in the Emergency Room with chest pain; 3) in patients with various types of arrhythmias placed in the public Physiobank website. The Sensitivity and Specificity of prediction in each study were about the same, and the few cases of rejection-
www.intechopen.com

The Electrocardiogram – Waves and Intervals
169
from-study were mostly due to high arrhythmia rates (>10% of beats), of either sinus or ventricular origin. High arrhythmia rates tend to randomize the remainder of RR-intervals and make their PD2i infinite. These 3 studies listed below are confirmed by an independent one in 24 patients with anterior wall infarctions compared to normal controls (Nashishoni et al, 2004a) In Table 2 Sensitivity = TP/(TP+FN), Specificity = TN/(TN+FP); Negative Predictive Value
= TN/(TN+FN); Positive Predictive Value = TP/(TP+FP); Relative Risk = TP/FN x
(TP+FN)/(FN+FP). Relative Risk is the more important contingency table statistic, as it is
most sensitive to the highly undesireable FNs (i.e., cases where the physician tells the
patient “you are OK” and then the patient goes home from the hospital and dies). Each of
the statistics in Table 2 is highly statistically significant (p < 0.001) by the Fisher Exact Test
for contingency tables. Relative Risk may be even higher because the number of FN’s
approaches zero.
Table 2. Sensitivity and Specificity of PD2i prediction of VF in cardiac patients with non-sustained ventricular tachycardia (1), presentation with chest pain (2), or having various types of arrhythmias (3).
The majority of deaths in patients with diabetes mellitus (DM) is arrhythmic death. The
minimum PD2i at rest in young type-1 DM patients having no signs of neuropathy is
statistically significantly lower than that in their age-matched controls (p ≤ 0.001). Table 3
shows the contingency table for the first study, and Table 4 shows the same effects in
another type-1 DM study, but one including recovery from exercise with and without
atropine.
www.intechopen.com

Advances in Electrocardiograms – Methods and Analysis
170
Table 3. PD2i < 2.0 identifies type-1 Diabetes Mellitus (DM) patients without signs of neuropathy mixed together with age-matched normal controls (From Skinner et al, 2011).
Table 4. Min PD2i of Heartbeats in type-1 diabetic patients (DM) and Controls after recovery from exercise.
It is well known that immediately after recovery from exercise, the remaining increase in HR due to sympathetic drive is strongly countered by a rise in vagal (parasympathetic) tone to restore the HR to pre-exercise levels. This fast recovery effect can be blocked by atropine, leaving HR increased well into recovery. This same atropine effect is observed in the type-1 DM patients with respect to minimum PD2i, and suggests an association with sympathetic drive. Sympathetic stimulation or parasympathetic blockade lowers PD2i, whereas parasympathetic stimulation or sympathetic blockade raises PD2i. This study (Vicor, in progress) already has around 50 subjects, so the alpha-statistics shown in the lower panel of Table 3 also have high beta-power.
www.intechopen.com

The Electrocardiogram – Waves and Intervals
171
Hemorrhage causes an immediate reduction in PD2i from baseline in the lightly anesthetized animal (Skinner, Nester, Dalsey, 2000). When bleeding is started after blunt chest trauma, to mimic an explosion, it immediately causes a larger and more extreme reduction in PD2i (Figure 11; Batchinsky et al, 2010). Table 5 shows that a small loss of blood (1 pint), after voluntary donation at a blood bank, causes a significant PD2i reduction (p = 0.0011; Jett et al, 2010). It is noted that more than half of the subjects, however, may have had a low resting min PD2i score; that is, they were all lower than the mean of the normal controls seen in Table 4 or of most of the values seen for the hospitalized controls in Figure 14.
Table 5. Reduction of the min PD2i in normal subjects after donation of 1 pint of blood.
Table 6. Comparison of Baseline Hemodynamic Variables to Predict Postspinal Hypotension.
www.intechopen.com

Advances in Electrocardiograms – Methods and Analysis
172
It would appear then that the rather novel environment of “hypodermic needles and
hanging bags of blood” may have had a sympathomimetic effect on the heart similar to that
of, say, the “unfamiliar laboratory” in the pig, in which case the sympathetic tone was
measured quantitatively (Skinner, Lie, Entman, 1975; Skinner, Beder, Entman, 1983). In
normal humans performing simple psychological “stress” tasks, Shubert et al (2009) showed
that the heartbeat PD2i is statistically significantly reduced from baseline. They also found
the same stress-related reduction in PD2i for chronic-stress subjects compared to non-
stressed subjects, where stress was assessed by a chronic stress scale.
Spinal anesthesia often results in a hypotensive crisis ended clinically by injection of
catecholamines. In women about to give birth at term, it is desirable to know in advance
whether or not they are likely to manifest the hypotensive crisis so that prophylactic
measures can be taken to prevent any untoward affects on the mother or fetus. It seems that
the peak PD2i of the heartbeats observed prior to the spinal injection is able to predict the
hypotensive crisis (Chamchad et al, 2004). Table 6 shows that if peak PD2i (pPD2i) at rest lies
below 3.90, then the manifestation of a hypotensive crisis is highly likely following the
spinal injection. Neither blood pressure nor heart rate has any predictive value, whereas the
sensitivity and specificity of peak PD2i < 3.9 are both 100% (p = 0.001). Again a “novel
environment” stress-effect may be differentially causing the reduction of the baseline PD2i
scores in the women at risk. But in this case, it is the maximum value of the resting range
that is lower, not the minimum value.
Table 7. Comparison of algorithms used on the heartbeats of wounded soldiers (N=70) to predict a prehospital life-saving intervention (LSI). (Vicor, unpublished data). (Cancio & Skinner, unpublished).
Comparison of PD2i with other nonlinear “complexity” algorithms has recently been done
by the Army in a cohort of wounded soldiers, as shown in Table 7. Several measures
reached statistical significance. Notable, though, was the fact that the data set of 70 patients
was culled from a larger set of 132 patients. Whereas all 132 could be analyzed by PD2i, only
these current 70 could be analyzed by the other methods, due to their more restrictive ECG
length requirements and their intolerance of extrasystoles and noise. The performance of
PD2i when applied to the entire 132 patient data set was similar to that shown here, while
the other measures tended to lose their predictability (Cancio and Skinner, 2011).
www.intechopen.com

The Electrocardiogram – Waves and Intervals
173
For Multi Scale Entropy (MSE), the scale of 1 to 4 is selected after the analyses to determine
which one is the most discriminating. This type of post hoc selection is not really allowed
when making a statistical inference. Computationally this selection of scale is like selecting
the embedding dimension (m = 1 to 4) for the PD2i. MSE with a scale of 1 is the same as
Sample Entropy (SampEn), which is not a statistically significant discriminator.
Very recently, PD2i analysis has been used in a large cohort of 651 chronic heart failure
(CHF) patients (Zareba et al., 2011). The study population was observed for 44 months on
average with total mortality as primary endpoint and cardiac mortality, sudden cardiac
death, and heart failure death as secondary endpoints. The PD2i was computed based on 20-
minute supine high-resolution Holter recording and was categorized as positive (PD2i≤1.4)
or negative (PD2i>1.4) based on prespecified criteria. Among the 651 chronic heart failure
patients, 537 had successful PD2i analyses resulting in 144 (27%) patients showing positive
results and 393 (73%) negative results. The multivariate results are shown below.
Table 8. Prognostic significance of PD2i for predicting total mortality in heart failure patients.
Table 8 shows that after adjustment for clinical covariates (Zareba et al, 2011) PD2i, was
found predictive for total mortality by the Hazards Ratio (HR=1.55; p=0.026). Predictive
value of PD2i was observed in heart failure patients with left ventricular ejection fraction
≤35% (HR=1.95; p=0.004), whereas not in patients with >35% (HR=0.87; p=0.716). Further
analyses revealed that among patients with ejection fraction ≤35%, PD2i was also predictive
for cardiac death and for heart failure death. The conclusion was that the PD2i is predictive
for total mortality, cardiac death and heart failure death in heart failure patients with left
ventricular ejection fraction ≤35%.
PD2i has also recently been applied to all patients presenting to the intensive care unit (ICU) to stratify the risk of mortality at 30 days (Vicor, ongoing study). A min PD2i ≤ 1.4 was found to have a relative risk of death of 8.9 (p = 0.003) at ICU discharge and 11.1 at 30 days (p < 0.001). Thus the PD2i of the heartbeats has been found useful in another defined cohort. A low PD2i of the heartbeats has also been shown to detect cardiac allograft transplant
rejection (Izrailtyn et al., 2000). The partially intact nervous system apparently can continue
to distinguish between a new muscular pump that is good and one that is failing.
www.intechopen.com

Advances in Electrocardiograms – Methods and Analysis
174
Interestingly, a low PD2i of the heartbeats has also been found in major depression in
human subjects (Nahshoni, Aravot, et al., 2004b). These same authors showed in an animal
model that the neuronal spike-intervals thought to give rise to depressive behavior also
show a reduction in PD2i compared to controls (Dremencov, Nahshoni et al, 2004;
Friedman, Deri et al, 2007). The fact that there is an elevated rate of adverse cardiac events in
patients with major depression (Glassman, Bigger, Gafney, 2009) leads to the intriguing
speculation that it is due to autonomic derangements, which are detected by the low PD2i of
the heartbeats. The PD2i of the heartbeats may provide psychiatrists with a physiological
end-point for use in evaluating therapies.
8. Discussion
It has long been known that mostly the hyper “type A” personalities are the ones who die
from heart attacks (Friedman and Rosenman, 1974). Death of a spouse dramatically
increases the risk of death of the surviving partner (Rees and Lutkins, 1967). We have all
heard the statement that he/she died of a broken heart or of marital strife or job insecurity
(Rahe et al, 1973). A salient characteristic of people who live to 100 years of age is a positive
and optimistic view of life (Rozanski and Kubzansky, 2005). Despite the examples being all
around us, this obvious connection between the conscious mind and the heart/body has
been underappreciated and poorly studied by the medical community. One of the major
reasons for scientific based western medicine’s failure to understand, study and appreciated
this connection is that, up until now, it has been difficult to objectively identify and quantify
the underlying physiology. The PD2i has changed all that by giving physicians and scientists
an easily administered, reproducible, quantifiable, and sensitive test of how this conscious
state exerts it influence on the body.
The connection of the conscious mind to the body is primarily mediated through the
autonomic nervous system. It is becoming apparent that the status of and the relative balance
of the sympathetic and parasympathetic nervous systems’ input to all of the organs has a
profound impact on outcomes in a multitude of diseases and pathological conditions. Heart
rate variability has served for almost 40 years as a window to the autonomic nervous system,
but no real advances were made because the measurements were too inaccurate. Heart rate
variability is determined not only by the balance of the sympathetic and parasympathetic
components of the autonomic nervous system, which may be caused by unconscious
compensatory actions, but also by the nonlinear phase relationships between and within the
two types of effectors (i.e., the “cooperativity” among the brain centers that controls the
degrees of freedom in the autonomic output). Using an advanced algorithm (PD2i) that detects
the nonlinear information lost by the conventional measures used over the past decades,
biologists can now accurately quantify the autonomic output in a more meaningful way. The
influence of the attentive and conscious Cerebral Defense System combined with the
unconscious respiratory, blood-pressure, and temperature controllers is now subject to a
composite integrated measure of the output of the nerves to one of its target organs.
Trauma, blood loss and heart failure are states in which the sympathetic nervous system
increases its activity in an attempt to maintain homeostasis. But there is something more
than sympathetic tone that needs to be considered. For example, in the two patients shown
in Figure 12, the heart rates are about the same (same sympathetic drive), but the PD2i is
www.intechopen.com

The Electrocardiogram – Waves and Intervals
175
much lower in the one who later died (more autonomic “cooperation” occurring). As would
be expected, it has been found in trauma patients, critically ill ICU patients, patients who
have lost blood, and heart failure patients, that a low PD2i score--- indicating a higher level
of compensatory output--- identifies the “more stressed patient,” the one who is sicker,
losing more blood, or is more traumatized and trying harder to compensate and, thus, more
likely to die or require a life saving intervention.
In certain chronic disease processes, such as diabetes, it is not the reaction of the autonomic
nervous system to the acute or chronic disease that affects the heart rate variability signal
but, rather, damage to the autonomic nervous system itself, which may, in turn, prove to be
a major cause of the end-organ damage. A multitude of studies have found that if
autonomic dysfunction is present the outcomes of patients with diabetes and renal disease
are far worse; for example, the adverse cardiac event rate is doubled in diabetic patients
with autonomic dysfunction (Vinjk et al, 2003). The contribution of autonomic nervous
dysfunction to metabolic syndrome and sleep apnea are only now being considered, but the
driving hypotheses are quite rational in view of recent discoveries.
The clinical and research implications of being able to easily measure and quantify the
nonlinear status of the autonomic nervous system are far reaching and profound. To be able
to identify patients with “high sympathetic tone” and/or high autonomic “cooperativity,”
which correlate with a “more stressed and sicker patient,” would obviously be very helpful
in anesthesia monitoring during surgery, monitoring of critically ill patients in the ICU, and
in the triage and monitoring of trauma patients. At present, identifying occult class I blood
loss (<15%) is a diagnostic dilemma. The PD2i’s ability to noninvasively identify such low
level blood loss would thus be helpful in a multitude of medical situations. Being able to
predict and identify which patient will have a more malignant course from their chronic
illnesses of heart failure, diabetes and renal disease would clearly also be very helpful to the
physicians, the health care providers, and the health care systems who care for them. Finally
having a more sensitive and specific “test” of the autonomic nervous system will facilitate
research on the contributions of the underlying systems to a wide range of medical
conditions. In the years to come the PD2i will help expand our understanding of the
autonomic nervous system and its profound contribution to a variety of disease processes
and medical conditions.
9. Summary and conclusions
The same loci of cerebral centers that control vulnerability of the ischemic heart to lethal
arrhythmogenesis overlaps precisely with the quantified six loci of cerebral centers known
to control resting heart rate, thus providing the rational for the hypothesis that patterns in
the heartbeat series may be related to the physiological conditions that enable ventricular
fibrillation to occur. This hypothesis has been tested and shown to be true in a number of
studies in animals and in human patients. The PD2i is a nonlinear measure well suited to
extracting signals from any physiological data series (RRi, ECG, EEG, etc.), because all such
physiological data are themselves nonlinear. With this new metric it is possible to extract
information, even in non-stationary data, that has been hidden to measurement by
conventional algorithms that are based on a linear stochastic model—e.g., the mean,
standard deviation, power spectra, and so on.
www.intechopen.com
Advances in Electrocardiograms – Methods and Analysis
176
With rather spectacular sensitivity, the PD2i, compared to the other linear and nonlinear
algorithms, has been shown to outperform them all in the prediction of future risk of lethal
arrhythmias (Table 1). The prediction comes with sufficient sensitivity, specificity, relative
risk and low p-values so as to be medically useful in a variety of medical situations. Peer-
reviewed and recently published studies illustrating this medical utility are presented in
Tables 1 to 8 for various well-defined cohorts with various medical disorders: multiple
hospitalized cardiac cohorts (ER-, Cardiology-floor, Physiobank- archive, and ICU); young
diabetics without neuropathy; blood-donors and bleeders with or without chest trauma;
pre-hospital wounded-soldiers requiring life-saving intervention; patients with chronic
(congestive) heart failure.
In cerebral states of short-term stress (public speaking), long-term stress (anxiety scales), or
major depressive disorder, the PD2i of the heartbeats is significantly reduced compared to
controls, and these negative affective states are also known to be related to an increased
incidence of death in both animal models and patients. In contrast, salutary brains states,
such as occur in animals during REM sleep, or after adaptation to an unfamiliar
environment, appear to be related to neuroendocrine secretions operating in parallel with
neural activations. Through the new paradigm of equivalent state-dependent proteomics,
new drugs candidates can be isolated, identified, synthesized and tested in biological
models. One such candidate is a neuroendocrine molecule that has a potent anti-infarction
effect in a model of stroke or heart attack (Figure 5).
The neglected part of the electrocardiogram, the flat and uninteresting T to P interval,
appears to be controlled in time by the brain. Modern cardiologists and physicians must
take notice of the new extrinsic underpinnings of the electrocardiogram, for there is a wealth
of new medical utility and discovery to be unfolded.
10. Acknowledgements
The first author, James E. Skinner, would like to acknowledge Donald B. Lindsley, his
mentor during graduate training in Neuroscience at the Brain Research Institute, and
Michael E. DeBakey, the Chancellor of Baylor College of Medicine, who first hired him as an
Assistant Professor, built him a magnificent laboratory, and supported him throughout his
25-year career research into the Role of the Brain in Cardiovascular Disorders. It was Dr.
DeBakey who challenged Skinner “to get his science to the bedside,” which meant founding
Vicor Technologies, Inc., in 2000, to commercialize his collected science. Skinner would also
like to acknowledge the high clinical expertise of his co-authors, Drs Daniel N Weiss
(Electrocardiologist) and Edward F Lundy (Thoracic Surgeon), who each have a keen
interest in innovative medicine. Skinner would finally like to thank the National Institutes of
Health for the many millions of dollars of NS RO1 and PO1 research grants that supported
his career work and the SBIR Fast Track grant that help him get Vicor started. The authors
disclose that they are employees of Vicor and shareholders.
11. References
Batchinsky AI, Skinner JE, Necsoiu C, Jordan BS, Weiss D, Cancio LC. New measures of
heart-rate complexity: effect of chest trauma and hemorrhage. J Trauma. 68:1178-85,
2010.
www.intechopen.com

The Electrocardiogram – Waves and Intervals
177
Baust W and Bonnert B. Regulation of heart rate during sleep. Exp Brain Res 7:169-180,
1969.
Brown HF, DiFrancesco D, Noble SJ. How does adrenaline accelerate the heart? Nature,
280:235-236, 1979.
Cancio L and Skinner JE. PD2i of 200 heartbeats predicts life saving interventions in
wounded soldiers. (unpublished data of Vicor Technologies, Inc and the Army
Institute of Surgical Research) 2011.
Cannon WB. The Wisdom of the Body. Norton, New York, 1932. Chamchad D, Arkoosh VA, Horrow JC, Buxbaum JL, Izrailtyan I, Nakhamchik L, Hoyer D,
Kresh JY. Using heart rate variability to stratify risk of obstetric patients
undergoing spinal anesthesia. Anesth Analg. 99:1818-21, 2004.
Chase MH, Sterman MB, Clemente CD. Cortical and subcortical patterns of response to
afferent vagal stimulation. Exp Neurol; 16;36-49, 1966.
Cleland JG, Coletta AP, Abdellah AT, Cullington D, Clark AL, Rigby AS. Clinical trials
update from the American Heart Association 2007: CORONA, RethinQ, MASCOT,
AF-CHF, HART, MASTER, POISE and stem cell therapy. Eur J Heart Fail. 10:102-8,
2008.
Dremencov E, Nahshoni E, Levy D, Mintz M, Overstreet DH, Weizman A, Yadid G,
Dimensional complexity of the neuronal activity in a rat model of depression
NeuroReport, Vol 15 No 12, 2004.
Ebert PA, Vanderbeek RB, Allgood RJ, Sabiston DC Jr. Effect of chronic cardiac
denervation on arrhythmias after coronary artery ligation. Cardiovasc Res.
4:141-7, 1970.
Elbert, T., Ray, W.J., Kowalik, Z.J., Skinner, J.E., Graf, K.E., and Birbaumer, N. Chaos and
Physiology: deterministic chaos in excitable cell assemblies. Physiological Reviews
74:1-47, 1994.
Friedman M and Rosenmen RH. Type A Behavior and Your Heart. Knopf, NY, 1974
Friedman A, Deri I, Friedman Y, Dremencov E, Goutkin S, Kravchinsky E, Mintz M, Levi D,
Overstreet DH, Yadid G. Decoding of dopaminergic mesolimbic activity and
depressive behavior. J Mol Neurosci, 32:72-9. 2007.
Glassman AH, Bigger JT Jr, Gaffney M. Psychiatric characteristics associated with long-term
mortality among 361 patients having an acute coronary syndrome and major
depression: seven-year follow-up of SADHART participants. Arch Gen Psychiatry;
66:1022-9, 2009.
Hjalmarson A. Cardioprotection with beta-adrenoceptor blockers:Does lipophilicity matter?
Basic Res Cardiol; 95:I41–I45, 2000.
Hodgkin AL and Huxley AF. A quantitative description of ion currents and its applications
to conduction and excitation in nerve membranes. J. Physiol. (Lond.), 117:500-544,
1952.
Izrailtyan I, Kresh JY, Morris RJ, Brozena SC, Kutalek SP, Wechsler AS, Early detection of
acute allograft rejection by linear and nonlinear analysis of heart rate variability. J
Thorac Cardiovasc Surg; 120:737-745, 2000.
www.intechopen.com
Advances in Electrocardiograms – Methods and Analysis
178
Jett PL, Skinner JE, Anchin JM, Weiss DN, Parsell DE, Hughes JJ. Blood donation
results in observable changes in heart rate variability pattern. Abstract AABB,
2010.
Kostelich EJ, Swinney HL. Practical considerations in estimating dimension from time series
data. Physica Scripta. 40: 436–441, 1989.
Nahshoni E, Strasberg B, Adler E, Shula Imbar S, Sulkes J, Weizman A. Complexity of the
dynamic QT variability and RR variability in patients with acute anterior wall
myocardial infarction: a novel technique using a non-linear method. J
Electrocardiology; 37:173-179, 2004a.
Nahshoni E, Aravot D, Aizenberg D, Sigler M, Zalsman G, Strasberg B, Imbar S, Adler E,
Weizman A. Heart rate variability in patients with major depression.
psychosomatics; 45:129-134, 2004b.
Parker GW, Michael LH, Hartley CJ, Skinner JE and Entman ML. Central beta-adrenergic
mechanisms may modulate ischemic ventricular fibrillation in pigs. Circ Res,
66:259-270, 1990.
Rahe RH, Bennett L, Romo M, Seltanen P, Arthur RS. Subject’s recent life changes and
coronary heart disease in Finland. Am J Psychiat, 130:1222, 1973.
Rees WD, Lutkins SG, Mortality of bereavement Br Med J 4:13, 1967
Rozanski A, Kubzansky LD. Psychologic functioning and physical health: a paradigm of
flexibility. Psychosom Med. 67 Suppl 1:S47-53, 2005.
Schubert C, Lambertz M, Nelesen RA, Bardwell W, Choi JB, Dimsdale JE. Effects of stress on
heart rate complexity-a comparision between short-term and chronic stress. Biol
Psychol 80:325-332, 2009.
Skinner, J. E. A cryoprobe and cryoplate for reversible functional blockade in the brains of
chronic animal preparations. Electroencephalogr Clin Neurophysiol, 29: 204-205,
1970.
Skinner, J.E. The role of the brain in ventricular fibrillation and hypertension: from animal
models to early human studies. Clev Clin J Med. 74:S73-S78, 2007a.
Skinner, J.E. New paradigms in heart-brain medicine: nonlinear physiology and state-
dependent proteomics. Clev Clinc J Med. 74:S79-S85, 2007b.
Skinner, J. E. Regulation of cardiac vulnerability by the cerebral defense system. In:
Electrophysiological Mechanisms Underlying Sudden Cardiac Death, edited by B.
E. Sobel, J. V. Dingell, and M. B. Mock. New York: Futura Publishing Company; p.
131-146, 1982.
Skinner JE and Lindsley DB. Reversible cryogenic blockade of neural function in the brain of
unrestrained animals. Science, 161: 595-597, 1968.
Skinner JE, Mohr DN, and Kellaway P. Sleep-stage regulation of ventricular arrhythmias in
the unanesthetized pig. Circ. Res., 37: 342- 349, 1975.
Skinner JE, Lie JT, and Entman ML. Modification of ventricular fibrillation latency following
coronary artery occlusion in the conscious pig: the effects of psychological stress
and beta- adrenergic blockade. Circulation, 51: 656-667, 1975.
Skinner JE and Reed JC. Blockade of a frontocortical- brainstem pathway prevents
ventricular fibrillation of the ischemic heart in pigs. Am J Physiol, 240: H156-H163,
1981.
www.intechopen.com

The Electrocardiogram – Waves and Intervals
179
Skinner JE, Beder SD, and Entman ML. Psychologic stress activates phosphorylase in the
heart of the conscious pig without increasing heart rate and blood pressure. Proc
Nat Acad Sci, 80: 4513-4517, 1983.
Skinner JE The regulation of cardiac vulnerability by the cerebral defense system. J Amer
Coll Cardiol, 5:88B-94B, 1985.
Skinner JE, Pratt CM, Vybiral TA. Reduction in the correlation dimension of heart beat
intervals precedes imminent ventricular fibrillation in human subjects. Am Heart J,
125:731-743, 1993.
Skinner JE, Molnar M, and Tomberg C. The Point Correlation Dimension: Performance
with non-stationary surrogate data and noise. Integr Physiol Behav Sci, 29:217-
234, 1994.
Skinner JE, Wolf SG, Kresh JY, Izrailtyn I, Armour JA, Huang M-He. Application
of chaos theory to a model biological system: evidence of self-organization
in the Intrinsic Cardiac Nervous System. Integ Physiol Behav Sci, 31:122-146,
1996
Skinner JE, Nester BA, Dalsey WC. Nonlinear dynamics of heart rate variability during
experimental hemorrhage in ketamine-anesthetized rats. Am J Physiol: Heart Circ
Physiol. 279:H1669-78, 2000.
Skinner JE, Meyer M, Dalsey WC, Nester, BA, Ramalanjaona G, O’Neil, BJ, Mangione A,
Terregino C, Moreyra A, Weiss DN, Anchin JM, Geary U, Taggart P. Risk
stratification for arrhythmic death in an emergency department cohort: a new
method of nonlinear analysis of RR-intervals. Therap and Clin Risk Manag, 4:1-9,
2008a.
Skinner, J.E., Anchin, J. M., Weiss, D. Nonlinear analysis of the heartbeats in public patient
ECGs using an automated PD2i algorithm for risk stratification of arrhythmic
death. Therap and Clin Risk Manag, 4:549-557, 2008b.
Skinner JE, Meyer M, Nester BA, Geary U, Taggart P, Mangione A, Ramalanjaona G,
Terregino C, Dalsey WC. Comparison of linear-stochastic and nonlinear-
deterministic algorithms in the analysis of 15-minute clinical ECGs to predict risk of
arrhythmic death. Therap and Clin Risk Manag 5:671-82; 2009.
Skinner JE, Weiss DN, Anchin JM, Turianikova Z, Tonhajzerova I, Javorkova J, Javorka K,
Baumert M, Javorka M. Nonlinear PD2i heart rate complexity algorithm detects
autonomic neuropathy in patients with type 1 diabetes mellitus. Clin
Neurophysiol. Jan 20, [Epub ahead of print], 2011.
Vinik AI, Maser RE, Mitchell BD, Freeman R: Diabetic autonomic neuropathy (Technical
Review). Diabetes Care 26:1553–1579, 2003.
Vybiral, T., Skinner, J.E. The Point Correlation Dimension of R-R intervals predicts
Sudden Cardiac Death among high risk Patients. Computers in Cardiology, 257-
260, 1993.
Winfree A T. When Time Breaks Down: The Three-Dimensional Dynamics of
Electrochemical Waves and Cardiac Arrhythmias. Princeton University Press. ISBN
0-691-02402-2, 1987.
www.intechopen.com

Advances in Electrocardiograms – Methods and Analysis
180
Zareba W, Cygankiewicz I, McNitt S, Bayes de Luna A. Prognostic significance of PD2i,
novel risk marker in heart failure patients. Abstract: 11-A-8315-ACC, J Amer Colleg
Cardiol. 2011.
www.intechopen.com

Advances in Electrocardiograms - Methods and AnalysisEdited by PhD. Richard Millis
ISBN 978-953-307-923-3Hard cover, 390 pagesPublisher InTechPublished online 25, January, 2012Published in print edition January, 2012
InTech EuropeUniversity Campus STeP Ri Slavka Krautzeka 83/A 51000 Rijeka, Croatia Phone: +385 (51) 770 447 Fax: +385 (51) 686 166www.intechopen.com
InTech ChinaUnit 405, Office Block, Hotel Equatorial Shanghai No.65, Yan An Road (West), Shanghai, 200040, China
Phone: +86-21-62489820 Fax: +86-21-62489821
Electrocardiograms are one of the most widely used methods for evaluating the structure-functionrelationships of the heart in health and disease. This book is the first of two volumes which reviews recentadvancements in electrocardiography. This volume lays the groundwork for understanding the technicalaspects of these advancements. The five sections of this volume, Cardiac Anatomy, ECG Technique, ECGFeatures, Heart Rate Variability and ECG Data Management, provide comprehensive reviews ofadvancements in the technical and analytical methods for interpreting and evaluating electrocardiograms. Thisvolume is complemented with anatomical diagrams, electrocardiogram recordings, flow diagrams andalgorithms which demonstrate the most modern principles of electrocardiography. The chapters which formthis volume describe how the technical impediments inherent to instrument-patient interfacing, recording andinterpreting variations in electrocardiogram time intervals and morphologies, as well as electrocardiogram datasharing have been effectively overcome. The advent of novel detection, filtering and testing devices aredescribed. Foremost, among these devices are innovative algorithms for automating the evaluation ofelectrocardiograms.
How to referenceIn order to correctly reference this scholarly work, feel free to copy and paste the following:
James E. Skinner, Daniel N. Weiss and Edward F. Lundy (2012). The Electrocardiogram – Waves andIntervals, Advances in Electrocardiograms - Methods and Analysis, PhD. Richard Millis (Ed.), ISBN: 978-953-307-923-3, InTech, Available from: http://www.intechopen.com/books/advances-in-electrocardiograms-methods-and-analysis/the-electrocardiogram-waves-and-intervals