Embed Size (px)
Citation preview
The elasticity of tobacco products in BiH – macro data analysis
Authors: Dragan Gligorić, Saša Petković, Anđela Pepić, Jovo Ateljević, Borislav Vukojević
Abstract: Tobacco consumption continues to be behavior engaged in by a large percentage of
Bosnia&Herzegovina (BiH) citizens. According to the official statistics, nearly half of the state’s
adults, that is about 1,200,600 people, consume tobacco product on a daily bases. The state
excise policy is one of the main available tool for reducing smoking prevalence because the
cigarette prices are under direct impact of this policy. The specific excise on cigarettes
introduced in BiH in 2009 and have increased every year so it was the main driver of cigarettes
price growth. In order to provide research-based evidence for more effective tobacco taxation
policies in BIH, in this paper we estimate price elasticity of demand for cigarettes using the
macro level data for the period 2008 to 2017, on a semi-annual basis. The results have shown
that increase in prices of cigarettes have statistically significant impact on cigarettes
consumption, at significance level of 1%. The estimated price elasticity coefficient is in the range
from -0.71 to -0.83, depends on the selected control variables used in the model. It means that
increase in real cigarettes prices for 10% led to the decrease in cigarettes consumption in the
range from 7.1% to 8.3%.
Keywords: smoking prevalence, price elasticity of demand for cigarettes, specific excise on
cigarettes, cigarettes prices.
Introduction
Smoking is an endemic problem in Bosnia and Herzegovina (BiH). Smoking prevalence in BiH
is close to 40% with a significant difference between men (46.9%) and women (28.5%), yet, the
gender gap has been diminished over time, as the smoking prevalence is increasing among
women. Among youth, tobacco use prevalence among girls (9.7%) is significantly lower than
among boys (15.5%). BiH is among the top 10 countries in the world for cigarettes consumption
(World Atlas, 2018). Level of tolerance towards smoking in BiH, like in the neighboring
countries, is relatively high yet with a tendency to decline. Available evidence also suggests that
there is growing disparities in cigarette smoking by social classes, and the narrowing of
differences in smoking by gender.
Research evidence shows that smoking is among the leading preventable cause of death
worldwide. Bosnia and Herzegovina is not an exception. Based on the current percentage of
people smoking in BiH, premature deaths attributable to smoking are projected to be as high as
600,000 (World Health Organization, 2016).

The state excise policy is one of the main available tool for reducing smoking prevalence (by
reducing smoking initiation and increasing smoking cessation) because the cigarette prices are
under direct impact of this policy. The effects of tobacco taxation on smoking prevalence depend
on the price elasticity of demand for cigarettes. Research indicates that the price elasticity of
demand for cigarettes in high-income countries is, on average, -0.4 among adults (Chaloupka et
al., 2000). An even larger effect can be expected among countries and socio-economic groups
with lower levels of income, and among youth (Al-Sadat, N., 2005). Previous research,
conducted in low and middle-income countries (such as BiH), found that price elasticity of
demand for cigarettes is in the range between -0.5 and -1 (Selvaraj et al., 2015). This implies that
state excise policy in this countries can be effective in reducing tobacco consumption.
Nevertheless, only a few low and middle-income countries have calculated their country-specific
estimates of the price responsiveness of the cigarette market. Lack of data or research capacity is
often the reason why this information is not available (Ross & Al-Sadat, 2007).
The specific excise on cigarettes introduced in BiH in 2009 and have increased every year. Ad
valorem excise, calculated on the retail price of cigarettes, stayed at the same level of 42% retail
price. Specific excise increased, from an initial level of 3.83 EUR per 1000 cigarettes stick in
the 2009 to 34.5 EUR per 1000 cigarettes stick in 2017. This is the main reason for the increase
in the cigarettes prices for about 175%, in the period 2008-2017. However, given the low
industry price, retail cigarette prices in BiH are among the lowest in Europe. At the same time,
budget revenues from specific and ad valorem excise were constantly increasing, despite a
significant drop in consumption of cigarettes. Regardless of observed the positive trends in
cigarettes consumption, smoking prevalence and budget revenues since introduction and
continuous increasing of specific excise, policy makers are often in a dilemma whether or not to
continue with the trend of increasing specific excise tax.
In order to provide research-based evidence for more effective tobacco taxation policies in BIH,
it is necessary to estimate prices’ elasticity. In this study, we developed the econometrics model
of cigarettes demand based on the macro level data. To our best knowledge, this is the first
estimate of the price elasticity of cigarettes demand for BiH.
Following this introduction, the second section presents the data related to cigarettes
consumption in BiH, the short descriptive analysis and methodology. The third section presents
and discusses the results of the regression analysis, while the fifth section concludes the paper.
Data and Method
To estimate the impact of an increase in the price of tobacco product on tobacco consumption,
we use data for consumption and price of cigarettes. Consumption of cigarettes accounts for over

97% of total tobacco products in BiH in 2017 (Indirect Taxation Authority of BiH, 2018)1 and
conclusions based on the analysis of consumption of cigarettes are valid and representative.
Data related to cigarettes consumption and prices in BiH are available for the very short period
(2008-2017). We have collected data for the last ten years on the semi-annual level, to have
sufficient data for implementing time-series analysis. This period of analysis is relevant for BIH,
taking into account that specific excise on cigarettes was introduced in 2009.
The time-series data for the period 2008-2017 are summarized in Table 1. The per-capita
consumption of domestic and imported cigarettes is calculated based on the semi-annually data
of the number of issued excise stamps on tobacco and cigarettes sticks, provided by Indirect tax
Authority of BiH and the size of the adult population (aged 15 years or older). The excise stamp
is issued for each cigarettes pack, and therefore, the number of issued excise stamps is equal to
the number of cigarettes pack. Consumption of cigarettes in the sticks is derived from the
number of cigarettes per pack which mainly contain 20 sticks, but there exist packs with 18 and
24 sticks as well2. The Indirect Tax Authority of BiH provided us with detail semi-annual data,
so we were able to calculate the exact number of cigarette sticks sold.
The real tobacco consumer price index (CPI) we calculated using the average price of cigarettes
and general CPI in BIH. Calculation of average price of cigarettes is based on the total value of
issued excise stamps for domestic and imported cigarettes and the number of cigarettes
(value/quantity), on the semi-annually basis, declared for sale in BiH3. Hence, we used official
data, provided by Indirect Taxation Authority, on the number of cigarettes and the total value of
cigarettes to calculate average prices of cigarettes. Then, based on the average prices of
cigarettes, we created nominal tobacco price index. The average price of cigarettes pack in the
first period (2008p1) is used as a base value and tobacco CPI index (2008p1=100) for the first
period got value 100. For each next period, we calculated index as the ratio between the average
price per pack for that period and the average price per pack in the base period, multiplied by
100. To obtain real tobacco CPI, we deflated it using general CPI in BIH4.
The purchasing power is one of the main determinants of aggregate demand and demand for a
particular product. The most often used measure for purchasing power in the country is real
income measured by real gross domestic product (GDP) per capita. We have also used real GNI
1 This estimate is based on only reported consumption. All informal sales, such as of cut tobacco on the street or in
the farmers market, is not part of this estimation due to the lack of a reliable and unique assessment of the illicit
market. 2 Until second half of 2014, every cigarette pack contained 20 cigarettes stick. Since then, cigarette packs with either
18 or 24 cigarette sticks accounted on average only 0.66% of all sold cigarettes. Therefore, the difference in number
of cigarettes stick in cigarettes pack (two below and four above) has not statistically significant influence on tobacco
CPI, during the calculation average price of cigarettes pack. 3 Indirect Taxation Authority provided us with detailed data of the value and the number of issued excise stamps,
number of cigarettes sticks (corresponding to the particular excise stamps) on semi-annual basis. 4 We calculated semi-annual general CPI (2008p2=100) using monthly inflation rates which are available on
http://www.bhas.ba.
per capita as a proxy for real income. BiH has the significant amount of unilateral transfers from
abroad, and it means that GNI per capita (GDPpc + unilateral transfers pc) could be a better
approximation of income for the estimation demand for cigarettes. The data on real income is
available in the online publication of the Agency of Statistics of BiH on a quarterly basis and we
recalculate it on semi-annual basis. Data on unilateral transfer is available in the balance of
payments statistic in Central Bank of BiH database also on quarterly basis and we recalculate it
on semi-annual basis. Also, as a proxy for purchasing power, we used real net average wages,
provided by the national statistics agency.
Tobacco control policies other than cigarette taxes can also be an important determinant of
demand for cigarettes (Ross & Al-Sadat, 2007). We created two variables related to tobacco
control environment in BiH between 2008-2017. First tobacco control variable is “tlaw”, which
is related to the introduction of Law on Tobacco of Bosnia and Herzegovina in 2010. Law on
Tobacco has introduced stricter conditions in the field of tobacco production and trade. Variable
tlaw takes the value of 0 for the period 2008p1 – 2010p1 and value of 1 for the period 2010p2-
2017p2, because it came into the force in may 2010 5. Second tobacco control variable is “aban”,
and it reflect the adoption of Code on Commercial Communications in december 2015 6. This
code prohibited all forms of commercial communications related to cigarettes and other tobacco
products, guns, firearms and pyrotechnical means, as well as opium drugs. Variable aban takes
value of 0 for the period 2008p1 – 2015p1 and value of 1 for the period 2015p2-2017p2. This
two variables, “tlaw” and “aban” are summarized in tobacco control index “tcindex”. Therefore,
“tcindex” is the sum of two dichotomus indicators “tlaw” and “aban” (Ross & Al-Sadat, 2007).
Therefore, variable tcindex takes value 0, for the period 2008p1-2010p1, value 0 for the period
2010p1-2015p1 and value 2 for the period 2015p2-2017p2.
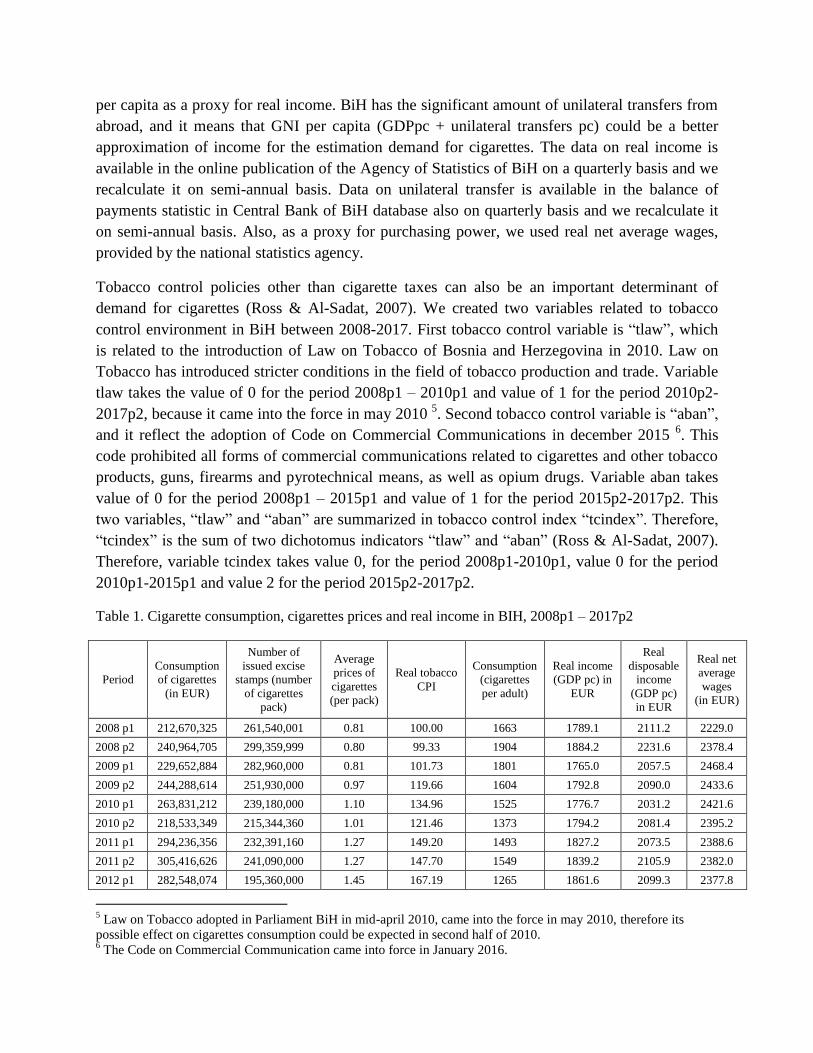
Table 1. Cigarette consumption, cigarettes prices and real income in BIH, 2008p1 – 2017p2
Period
Consumption
of cigarettes
(in EUR)
Number of
issued excise
stamps (number
of cigarettes
pack)
Average
prices of
cigarettes
(per pack)
Real tobacco
CPI
Consumption
(cigarettes
per adult)
Real income
(GDP pc) in
EUR
Real
disposable
income
(GDP pc)
in EUR
Real net
average
wages
(in EUR)
2008 p1 212,670,325 261,540,001 0.81 100.00 1663 1789.1 2111.2 2229.0
2008 p2 240,964,705 299,359,999 0.80 99.33 1904 1884.2 2231.6 2378.4
2009 p1 229,652,884 282,960,000 0.81 101.73 1801 1765.0 2057.5 2468.4
2009 p2 244,288,614 251,930,000 0.97 119.66 1604 1792.8 2090.0 2433.6
2010 p1 263,831,212 239,180,000 1.10 134.96 1525 1776.7 2031.2 2421.6
2010 p2 218,533,349 215,344,360 1.01 121.46 1373 1794.2 2081.4 2395.2
2011 p1 294,236,356 232,391,160 1.27 149.20 1493 1827.2 2073.5 2388.6
2011 p2 305,416,626 241,090,000 1.27 147.70 1549 1839.2 2105.9 2382.0
2012 p1 282,548,074 195,360,000 1.45 167.19 1265 1861.6 2099.3 2377.8
5 Law on Tobacco adopted in Parliament BiH in mid-april 2010, came into the force in may 2010, therefore its
possible effect on cigarettes consumption could be expected in second half of 2010. 6 The Code on Commercial Communication came into force in January 2016.
2012 p2 317,968,842 218,854,500 1.45 166.37 1417 1848.1 2133.8 2362.2
2013 p1 293,572,563 180,221,775 1.63 186.88 1175 1878.8 2114.2 2358.0
2013 p2 245,014,137 148,870,000 1.65 191.16 971 1974.4 2289.2 2407.8
2014 p1 251,223,010 142,299,500 1.77 205.45 935 1925.4 2175.6 2406.6
2014 p2 290,028,786 159,298,000 1.82 212.48 1047 1979.7 2305.5 2419.2
2015 p1 290,416,345 147,811,500 1.96 229.96 978 2019.3 2267.3 2423.4
2015 p2 301,082,405 151,360,000 1.99 235.08 1000 2070.3 2339.5 2449.8
2016 p1 271,521,809 127,055,000 2.14 254.04 841 2024.3 2251.9 2473.2
2016 p2 294,837,486 137,330,000 2.15 254.46 909 2224.0 2482.4 2489.4
2017 p1 272,084,486 118,815,000 2.29 269.58 788 2052.8 2299.7 2490.0
2017 p2 293,329,175 124,440,000 2.36 275.89 826 2349.1 2612.3 2493.6
Source: World Bank data; Indirect Taxation Authority of BiH, (2008)
To generate “per person” measures we used a number of inhabitants from the World Bank
database, due the poor quality of population data from the national statistics agency. Also, the
lack of official population statistics in BiH have prevented us from using other control variables
(such as male to female ratio, education, etc.).
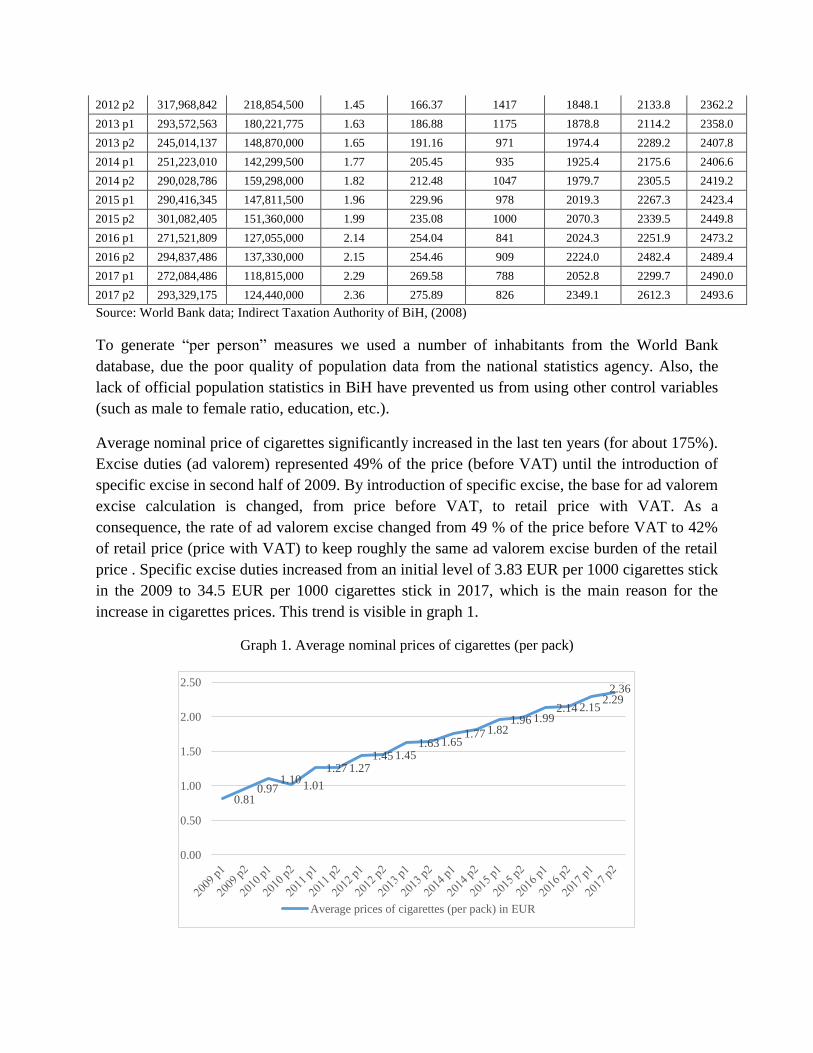
Average nominal price of cigarettes significantly increased in the last ten years (for about 175%).
Excise duties (ad valorem) represented 49% of the price (before VAT) until the introduction of
specific excise in second half of 2009. By introduction of specific excise, the base for ad valorem
excise calculation is changed, from price before VAT, to retail price with VAT. As a
consequence, the rate of ad valorem excise changed from 49 % of the price before VAT to 42%
of retail price (price with VAT) to keep roughly the same ad valorem excise burden of the retail
price . Specific excise duties increased from an initial level of 3.83 EUR per 1000 cigarettes stick
in the 2009 to 34.5 EUR per 1000 cigarettes stick in 2017, which is the main reason for the
increase in cigarettes prices. This trend is visible in graph 1.
Graph 1. Average nominal prices of cigarettes (per pack)
0.81 0.97
1.10 1.01
1.27 1.27 1.45 1.45
1.63 1.65 1.77 1.82
1.96 1.99 2.14 2.15
2.29 2.36
0.00
0.50
1.00
1.50
2.00
2.50
Average prices of cigarettes (per pack) in EUR
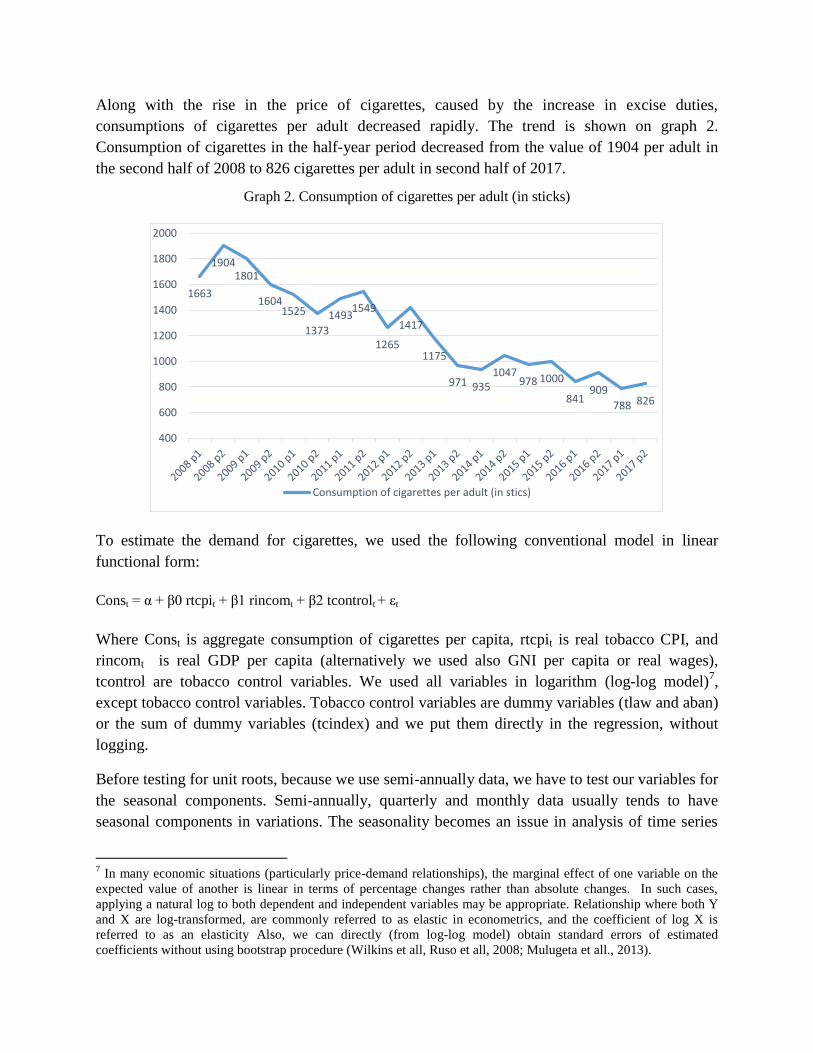
Along with the rise in the price of cigarettes, caused by the increase in excise duties,
consumptions of cigarettes per adult decreased rapidly. The trend is shown on graph 2.
Consumption of cigarettes in the half-year period decreased from the value of 1904 per adult in
the second half of 2008 to 826 cigarettes per adult in second half of 2017.
Graph 2. Consumption of cigarettes per adult (in sticks)
To estimate the demand for cigarettes, we used the following conventional model in linear
functional form:
Const = α + β0 rtcpit + β1 rincomt + β2 tcontrolt + εt
Where Const is aggregate consumption of cigarettes per capita, rtcpit is real tobacco CPI, and
rincomt is real GDP per capita (alternatively we used also GNI per capita or real wages),
tcontrol are tobacco control variables. We used all variables in logarithm (log-log model)7,
except tobacco control variables. Tobacco control variables are dummy variables (tlaw and aban)
or the sum of dummy variables (tcindex) and we put them directly in the regression, without
logging.
Before testing for unit roots, because we use semi-annually data, we have to test our variables for
the seasonal components. Semi-annually, quarterly and monthly data usually tends to have
seasonal components in variations. The seasonality becomes an issue in analysis of time series
7 In many economic situations (particularly price-demand relationships), the marginal effect of one variable on the
expected value of another is linear in terms of percentage changes rather than absolute changes. In such cases,
applying a natural log to both dependent and independent variables may be appropriate. Relationship where both Y
and X are log-transformed, are commonly referred to as elastic in econometrics, and the coefficient of log X is
referred to as an elasticity Also, we can directly (from log-log model) obtain standard errors of estimated
coefficients without using bootstrap procedure (Wilkins et all, Ruso et all, 2008; Mulugeta et all., 2013).
1663
1904 1801
1604 1525
1373
1493 1549
1265
1417
1175
971 935 1047
978 1000
841 909
788 826
400
600
800
1000
1200
1400
1600
1800
2000
Consumption of cigarettes per adult (in stics)

stationarity, as typical unit root tests do not deal with possibility of seasonal integration.
Autocorrelation function is an useful tool for analysis of presence of seasonality in time series.
High value of autocorrelation coefficient at season lag s indicates presence of additive
seasonality, while high and slowly declining autocorrelation coefficients on seasonal lags s, 2s,
3s, etc. indicate multiplicative seasonality. In addition, very high (close to one) and slowly
declining autocorrelation coefficients on seasonal lags s, 2s, 3s, etc. of the time series after
removing trend component (i.e. using first difference) also indicate high probability of seasonal
integration (Mladenovic et all.,2005). In order to analyze presence of seasonality, we estimate
autocorrelation of up to forth order of logged time series (recommended level is at least 2s lags),
both for level and first difference as shown in the table below:
Table 2. Autocorrelation coefficients
Level First difference
AC(1) AC(2) AC(3) AC(4) AC(1) AC(2) AC(3) AC(4)
lcons 0.832 0.659 0.515 0.376 -0.371 -0.003 -0.117 -0.057
lrtcpi 0.851 0.707 0.546 0.411 -0.617 0.235 -0.211 0.335
lrincome 0.598 0.688 0.43 0.37 -0.626 0.354 -0.124 0.066
lrdincom 0.466 0.682 0.313 0.39 -0.697 0.536 -0.378 0.324
lrwage 0.44 0.114 0.083 0.025 0.316 -0.144 -0.127 -0.119
The estimated values of the autocorrelation function for the first differences reveals that time
series most likely are not seasonally integrated, but lrtcpi, lrincome and lrdincom likely have
seasonal component. As type of seasonality is hard to identify solely on the basis of
autocorrelation in case of semi-annual data, we run autoregressive regressions up to second
order, including also seasonal dummy to identify presence of the additive seasonality and
seasonal autoregressive component to identify presence of the multiplicative seasonal
component. The results of estimation for seasonal dummy and seasonal autoregressive
component (coefficients for constant, trend and common autoregressive components are omitted)
shows that logged price index has additive seasonality, while real income and real disposable
income have multiplicative seasonality, as shown in the table below.
Table 3. Seasonal dummy and seasonal autoregressive component
original lcons lrtcpi lrtcpi_sa lrincome lrincome_sa lrdincom rdincom_sa lrwage
S_2 0.0565 -0.0564** -0.001 0.0557 -0.000 0.0617 -0.000 0.0014
(0.0328) (0.0189) (0.0110) (0.0497) (0.0023) (0.0397) (0.0021) (0.0026)
SAR(2) -0.0541 -0.4518 -0.454 0.5969*** -0.520* 0.4050** -0.354 0.1944
(1.4259) (0.3080) (0.3023) (0.1565) (0.2786) (0.1720) (0.3140) (0.3318)

We use Tramo/Seats statistical tool, being the only software solution that supports seasonal
adjustment of the semi-annual time series, to eliminate seasonality from price index and income
variables. Then we rerun autoregressive regressions on the seasonally adjusted data for these
three variables (in the table indicated with sa suffix). After adjusting, seasonal components have
been removed from price index and real disposable income, while seasonality still remained in
real income, but statistical significance declined.
Table 4. Seasonally adjusted variables
Period/
Variable 2008 p1 2008 p2 2009 p1 2009 p2 2010 p1 2010 p2 2011 p1 2011 p2 2012 p1 2012 p2
rincom 1842.61 1836.41 1800.14 1777.33 1784.55 1796.51 1824.70 1845.69 1855.49 1857.71
rdincom 2187.18 2163.17 2107.86 2060.66 2055.53 2066.30 2086.21 2097.52 2111.85 2114.26
rtcpi 96.43 103.20 98.12 124.33 130.00 126.35 143.96 152.97 162.17 171.39
Period/
Variable 2013 p1 2013 p2 2014 p1 2014 p2 2015 p1 2015 p2 2016 p1 2016 p2 2017 p1 2017 p2
rincom 1876.43 1975.24 1931.36 1976.55 2030.42 2043.45 2084.36 2134.18 2160.64 2230.49
rdincom 2160.37 2226.28 2235.58 2263.51 2303.41 2294.52 2327.28 2379.85 2416.93 2484.73
rtcpi 182.26 195.87 201.31 216.94 225.91 239.56 249.93 258.95 265.57 280.53
Having two variables with no seasonal component and three variables with seasonal component,
we proceed further analysis with seasonally adjusted data for price index, real and real
disposable income to avoid effects of seasonality on results of regression. We applied the
Dickey-Fuller test for unit root on a logarithmic data (Ateriou&Hall, 2016, p.361).
Table 5. Unit root test
Variable Dickey-Fuller test for levels
Test statistics Results
Consumption (lcons) -4.224 Integrated at zero order I (0)
Real tobacco CPI (lrtcpi), seasonally adjusted -3.170 Integrated at zero order I (0)
Real GDP pc (lrincom), seasonally adjusted -2.282 Integrated at first order I (1)
Real GNI pc (lrdincom), seasonally adjusted -2.898 Integrated at first order I (1)
Real wages (lrwage) -3.914 Integrated at zero order I (0)
Dickey-Fuller test indicates that real income and real disposable income have unit roots in levels,
but not in the first differences, so we can conclude that these three time series are first order
integrated.
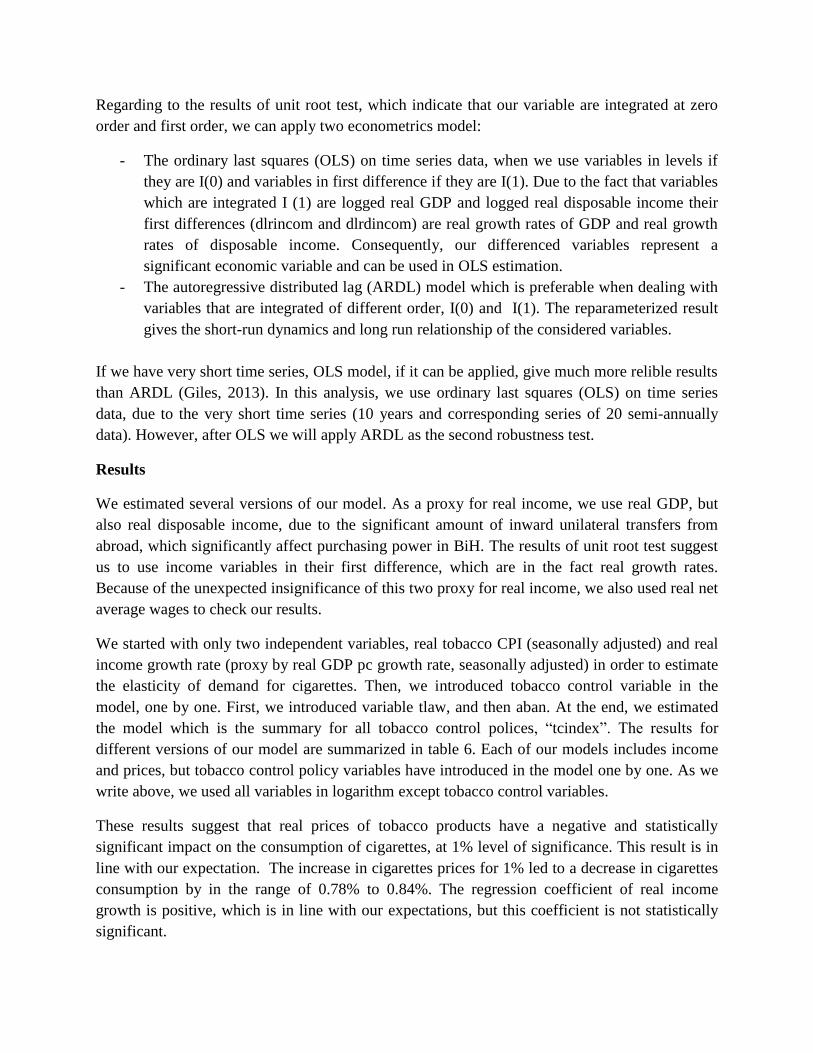
Regarding to the results of unit root test, which indicate that our variable are integrated at zero
order and first order, we can apply two econometrics model:
- The ordinary last squares (OLS) on time series data, when we use variables in levels if
they are I(0) and variables in first difference if they are I(1). Due to the fact that variables
which are integrated I (1) are logged real GDP and logged real disposable income their
first differences (dlrincom and dlrdincom) are real growth rates of GDP and real growth
rates of disposable income. Consequently, our differenced variables represent a
significant economic variable and can be used in OLS estimation.
- The autoregressive distributed lag (ARDL) model which is preferable when dealing with
variables that are integrated of different order, I(0) and I(1). The reparameterized result
gives the short-run dynamics and long run relationship of the considered variables.
If we have very short time series, OLS model, if it can be applied, give much more relible results
than ARDL (Giles, 2013). In this analysis, we use ordinary last squares (OLS) on time series
data, due to the very short time series (10 years and corresponding series of 20 semi-annually
data). However, after OLS we will apply ARDL as the second robustness test.
Results
We estimated several versions of our model. As a proxy for real income, we use real GDP, but
also real disposable income, due to the significant amount of inward unilateral transfers from
abroad, which significantly affect purchasing power in BiH. The results of unit root test suggest
us to use income variables in their first difference, which are in the fact real growth rates.
Because of the unexpected insignificance of this two proxy for real income, we also used real net
average wages to check our results.
We started with only two independent variables, real tobacco CPI (seasonally adjusted) and real
income growth rate (proxy by real GDP pc growth rate, seasonally adjusted) in order to estimate
the elasticity of demand for cigarettes. Then, we introduced tobacco control variable in the
model, one by one. First, we introduced variable tlaw, and then aban. At the end, we estimated
the model which is the summary for all tobacco control polices, “tcindex”. The results for
different versions of our model are summarized in table 6. Each of our models includes income
and prices, but tobacco control policy variables have introduced in the model one by one. As we
write above, we used all variables in logarithm except tobacco control variables.
These results suggest that real prices of tobacco products have a negative and statistically
significant impact on the consumption of cigarettes, at 1% level of significance. This result is in
line with our expectation. The increase in cigarettes prices for 1% led to a decrease in cigarettes
consumption by in the range of 0.78% to 0.84%. The regression coefficient of real income
growth is positive, which is in line with our expectations, but this coefficient is not statistically
significant.

Table 6: Linear demand model for cigarettes – (real income growth is proxied by GDP pc growth rate)
(1) (2) (3) (4)
VARIABLES lcons lcons lcons lcons
lrtcpi -0.827*** -0.778*** -0.839*** -0.790***
[0.077] [0.133] [0.101] [0.097]
dlrincome 0.250 0.342 0.189 0.215
[1.404] [1.454] [1.479] [1.431]
tcindex -0.029
[0.064]
tlaw 0.015
[0.076]
aban -0.043
[0.066]
Constant 11.355*** 11.131*** 11.408*** 11.173***
[0.392] [0.635] [0.482] [0.487]
Observations 19 19 19 19
R-squared 0.913 0.914 0.913 0.916
F statistic (prob.) 0.000 0.000 0.000 0.000
D-W d-statistic 2.061 1.928 2.120 2.002
Breusch-Pagan / Cook-Weis.
test for heter. (Prob > chi2) 0.809 0.832 0.763 0.769
JB test (Prob.) 0.890 0.921 0.876 0.916
Ramsey RESET test (Prob.) 0.763 0.721 0.741 0.823
Multicolinearity test (vif) 1.50 3.28 2.06 1.83
Standard errors in brackets
*** p<0.01, ** p<0.05, * p<0.1
Our control variables, which represent implemented tobacco control policy in BiH, are not
significant. Their introduction in the model did not improve the model, which is shown by
adjusted R-square. Including different control variables in our model did not lead to significant
changing in the value of price elasticity coefficient and we can conclude that our estimated
coefficient of elasticity is stable. The validity of the overall regression was confirmed by F
statistics whose probability is 0.000, or less than 0.01, and at the level of 1% of significance, we
can say that the estimated model is statistically significant. Independent variables explain more
than 91% variance in the dependent variable, which shows adjusted R-squared.
A lot of BIH residents are employed or were employed in western Europe. As a result, unilateral
transfers from abroad significantly contribute to the domestic purchasing power of BIH
household. In the last ten year, the share of unilateral transfers in real GDP is about 15%, which
is visible from the table 1 if we compare GDP pc and GNI pc. Taking into account this fact, we
suspected that the insignificance of real income growth rate measured by real GDP pc growth
rate is the result of using the wrong variable for the measuring purchasing power. Therefore, we
dropped GDP per capita growth rate from the model (variable dlrincom) and introduced GNI per
capita growth rate in the model (first difference of logarithm of real disposable income -
dlrdincome), also seasionally adjusted.
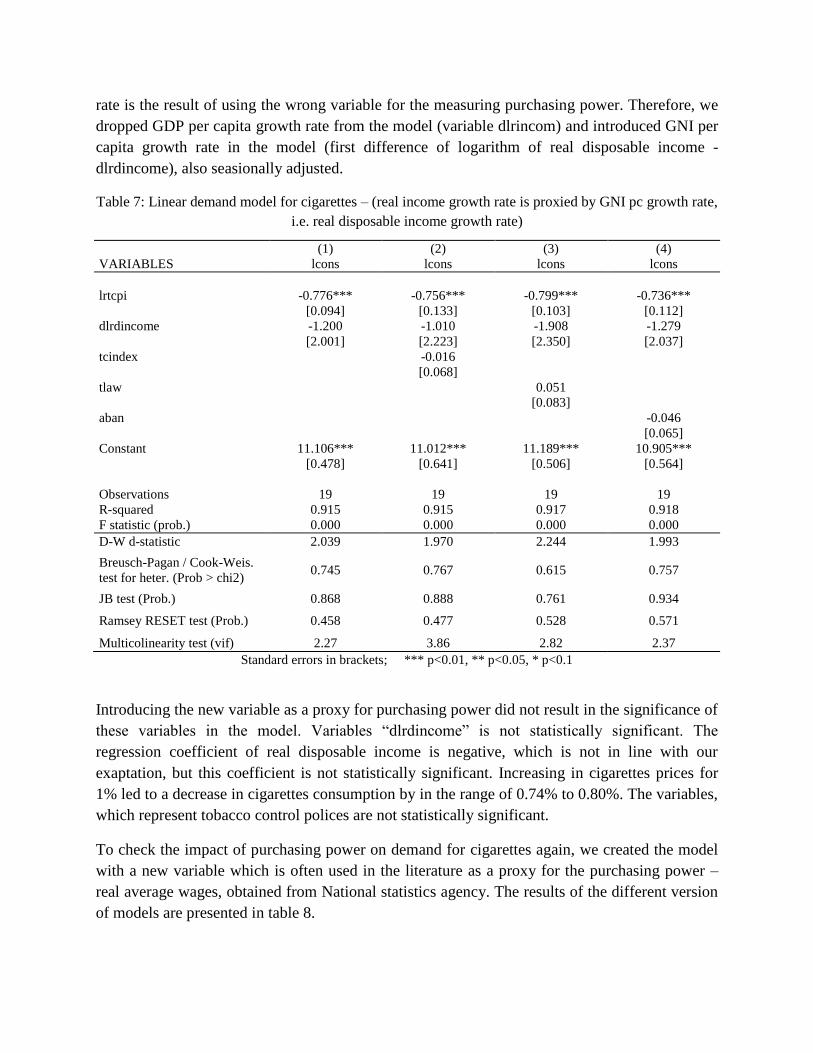
Table 7: Linear demand model for cigarettes – (real income growth rate is proxied by GNI pc growth rate,
i.e. real disposable income growth rate)
(1) (2) (3) (4)
VARIABLES lcons lcons lcons lcons
lrtcpi -0.776*** -0.756*** -0.799*** -0.736***
[0.094] [0.133] [0.103] [0.112]
dlrdincome -1.200 -1.010 -1.908 -1.279
[2.001] [2.223] [2.350] [2.037]
tcindex -0.016
[0.068]
tlaw 0.051
[0.083]
aban -0.046
[0.065]
Constant 11.106*** 11.012*** 11.189*** 10.905***
[0.478] [0.641] [0.506] [0.564]
Observations 19 19 19 19
R-squared 0.915 0.915 0.917 0.918
F statistic (prob.) 0.000 0.000 0.000 0.000
D-W d-statistic 2.039 1.970 2.244 1.993
Breusch-Pagan / Cook-Weis.
test for heter. (Prob > chi2) 0.745 0.767 0.615 0.757
JB test (Prob.) 0.868 0.888 0.761 0.934
Ramsey RESET test (Prob.) 0.458 0.477 0.528 0.571
Multicolinearity test (vif) 2.27 3.86 2.82 2.37
Standard errors in brackets; *** p<0.01, ** p<0.05, * p<0.1
Introducing the new variable as a proxy for purchasing power did not result in the significance of
these variables in the model. Variables “dlrdincome” is not statistically significant. The
regression coefficient of real disposable income is negative, which is not in line with our
exaptation, but this coefficient is not statistically significant. Increasing in cigarettes prices for
1% led to a decrease in cigarettes consumption by in the range of 0.74% to 0.80%. The variables,
which represent tobacco control polices are not statistically significant.
To check the impact of purchasing power on demand for cigarettes again, we created the model
with a new variable which is often used in the literature as a proxy for the purchasing power –
real average wages, obtained from National statistics agency. The results of the different version
of models are presented in table 8.
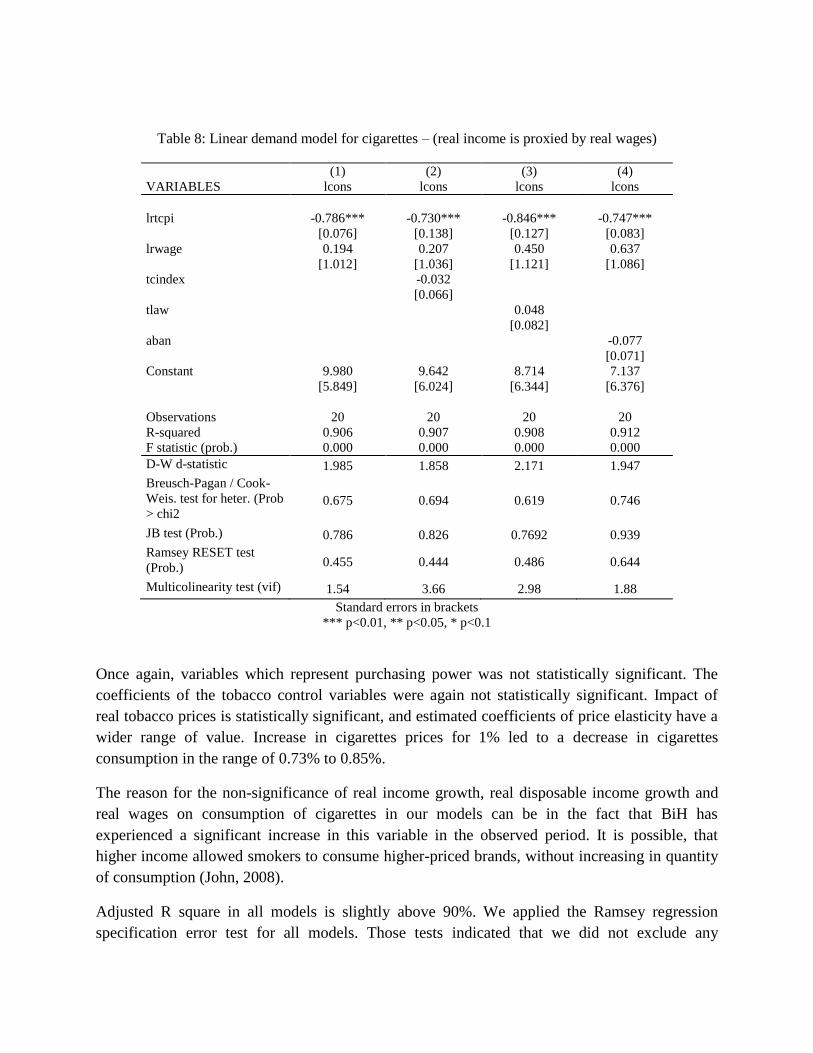
Table 8: Linear demand model for cigarettes – (real income is proxied by real wages)
(1) (2) (3) (4)
VARIABLES lcons lcons lcons lcons
lrtcpi -0.786*** -0.730*** -0.846*** -0.747***
[0.076] [0.138] [0.127] [0.083]
lrwage 0.194 0.207 0.450 0.637
[1.012] [1.036] [1.121] [1.086]
tcindex -0.032
[0.066]
tlaw 0.048
[0.082]
aban -0.077
[0.071]
Constant 9.980 9.642 8.714 7.137
[5.849] [6.024] [6.344] [6.376]
Observations 20 20 20 20
R-squared 0.906 0.907 0.908 0.912
F statistic (prob.) 0.000 0.000 0.000 0.000
D-W d-statistic 1.985 1.858 2.171 1.947
Breusch-Pagan / Cook-
Weis. test for heter. (Prob
> chi2 0.675 0.694 0.619 0.746
JB test (Prob.) 0.786 0.826 0.7692 0.939
Ramsey RESET test
(Prob.) 0.455 0.444 0.486 0.644
Multicolinearity test (vif) 1.54 3.66 2.98 1.88
Standard errors in brackets
*** p<0.01, ** p<0.05, * p<0.1
Once again, variables which represent purchasing power was not statistically significant. The
coefficients of the tobacco control variables were again not statistically significant. Impact of
real tobacco prices is statistically significant, and estimated coefficients of price elasticity have a
wider range of value. Increase in cigarettes prices for 1% led to a decrease in cigarettes
consumption in the range of 0.73% to 0.85%.
The reason for the non-significance of real income growth, real disposable income growth and
real wages on consumption of cigarettes in our models can be in the fact that BiH has
experienced a significant increase in this variable in the observed period. It is possible, that
higher income allowed smokers to consume higher-priced brands, without increasing in quantity
of consumption (John, 2008).
Adjusted R square in all models is slightly above 90%. We applied the Ramsey regression
specification error test for all models. Those tests indicated that we did not exclude any

important variables from our model. Such exclusion would result in biased estimates. The
Durbin–Watson test assessed the autocorrelation of OLS model residuals. If residuals are
correlated, OLS estimates are unbiased. We found the values of the reported d - statistic to be
closer to the value two which implies that the residuals from linear regression are uncorrelated in
all estimated models.
The Breusch–Pagan/Cook–Weisberg test showed that residuals of the OLS model have constant
variance. Therefore, no heteroscedasticity exists that would reduce the reliability of our
hypothesis testing and cause OLS estimators to be inefficient. The assumption about the
normality of the residual in our models is satisfied, which has been verified using Jarque – Bera
normality test. Value of variance inflation factor suggests that out models don’t suffer from the
multicollinearity problem.
Robustness test
As the second robustness test, we used the ARDL model to estimate responsiveness of cigarettes
consumption to income and price changes.
The estimated models which included consumption of cigarettes per adult (lcons), real tobacco
cpi index (lrtcpi), real income (lrincome) and different control policy variables (tcindex, aban,
tlaw) confirmed statistically significant and negative impact of the real tobacco CPI on the
consumption of cigarettes. The long run estimated price elasticity coefficients were negative and
statistically significant with value in the range between -0.58 and -0.77. Other variables were not
statistically significant. The error correction coefficient was also statistically significant and
negative with value in the range between - 0.91 and - 0.99, which implies that more than 90%
deviation from long run relationship between variables are corrected in the current semi-annual
period. But this estimations are not reliable because of our model did not pass Jarque – Bera
normality test and bound test could not reject null hypothesis of no levels relationship at the 5%
of significance.
The estimated model with real disposable income as independent variable also confirmed the
existance of long run relationship between price of cigarettes and cigarettes consumption. The
estimated coefficients were in range between -0.51 and -0.66 and statistically significant. Also,
the estimated model with real wage as independent variable confirmed existence of the long-run
impact of the increasing in cigarettes price on the decline in cigarettes consumption, but the
estimated coefficients were significantly higher than in other tested models (between -0.76 and -
0.99). Due to the similar problems as in the models with real income, results of estimated ARDL
models with real disposable income and real wages as dependent variable must be taken with
caution. Nevertheless, all ARDL models, regardless of which proxy for income we used, and
regardless of the tobacco control variables we used, have confirmed statistically significant
impact increase in cigarettes price on decrease in cigarettes consumption. The very short time
series is the main cause of the problems that followed our ARDL models.
Conclusion
In this paper, we use macro data to analyze the impact of prices of cigarettes on the demand for
cigarettes in BiH. Due to the lack of data to create a sufficiently long data series that is necessary
for reliable time series analysis, we collected data for semi-annual level. The period of analysis
was 2008p1-2017p2. In this period, average prices of cigarettes increased by about 175%, while
consumption of cigarettes decreased for more than 50%. The main reason for an increase in
prices of cigarettes was continuous increasing of specific excise duties.
We developed three models, with three different measures of income, and estimated them in
several versions. The only variable, which has significant impact on demand for cigarettes, was
real tobacco CPI. Value of estimated coefficients was in the range of -0.73 to -0.85, and the
estimated coefficient was stable across different models and different versions of a particular
model. This implies that an increase in prices of cigarettes for 1% led to a decrease in the
consumption of cigarettes in the range of 0.73% to 0.85%.
Results of our analysis suggest that the state excise policy is an effective tool for reducing
smoking prevalence in BiH. If policy-makers in BiH continue with the policy of increasing
excise taxes, the consumption of cigarettes will decrease.
References
Agency for Statistics of BiH. (2018). Data obtained on request of the BiH research team.
Agency for Statistics of BiH. (2018). Economics Statistics. Retrieved from
http://www.bhas.ba/?option=com_publikacija&id=2&lang=sr.
Asteriou, D. & Hall, S. G. (2016). Aplied Econometrics. 3rd Edition. Palgrave MacMilan
Central bank of BiH. (2008). Data acces – Statistic web portal. retrieved from
http://statistics.cbbh.ba/Panorama/novaview/SimpleLogin_en_html.aspx
Chaloupka, FJ., Hu, TW., Warner, KE., Jacobs, R., Yurekli, A. (2000). The taxation of tobacco
products. In: Jha P, Chaloupka FJ (eds). Tobacco control in developing countries. Oxford and
New York: Oxford University Press, pp. 237–72. Retrieved form
http://citeseerx.ist.psu.edu/viewdoc/summary?doi=10.1.1.542.8248

Giles, D. (2013). ARDL Models.Part II Bounds Tests. Retrieved from
https://davegiles.blogspot.com/2013/06/ardl-models-part-ii-bounds-tests.html
ITA. (2018). Data obtained on request of the BiH research team
John, R.M. (2008). Price Elasticity Estimates for Tobacco Products in India. Health Policy and
Planning, Volume 23, Issue 3, 1 May 2008, Pages 200–209.
Al-Sadat, N., 2005. Demand Analysis of Tobacco Consumption in Malaysia. Southeast Asia
Tobacco Control Alliance. Retrieved from
https://seatca.org/dmdocuments/Demand%20Analysis%20of%20Tobacco%20Consumption%20i
n%20Malaysia.pdf
Ross, H., and Al-Sadat, N. (2007). Demand analysis of tobacco consumption in Malaysia.
Nicotine &Tobacco Research, 9(11), pp. 1163-1169.
Selvaraj, S., Srivastava, S., Karan, A. (2015). Price elasticity of tobacco products among
economic classes in India, 2011–2012. BMJ Open 2015;5:e008180. doi:10.1136/bmjopen-2015-
008180. Retrieved from https://bmjopen.bmj.com/content/bmjopen/5/12/e008180.full.pdf
World Health Organization. (2016). Tobacco control fact sheet for Bosnia and Herzegovina.
Retrieved from http://www.euro.who.int/__data/assets/pdf_file/0012/312600/Tobacco-control-
fact-sheet-BosniaHerzegovina.pdf
The World Atlas.(2018). Which Countries Smoke The Most Cigarettes? Retrieved from:
https://www.worldatlas.com/articles/countries-that-smoke-the-most-cigarettes.html
Mladenovic Z, Nojkovic A, (2005). Analiza vremenskih serija: primeri iz srpske privrede.
Beograd: Ekonomski fakultet
Mulugeta, D., Greenfield, J., Bolen, T., Conley, L. (2013). Price- and Cross-Price Elasticity
Estimation using SAS, Cardinal Health, Pricing Analytics Team, Dublin, Ohio 43017, USA.
Retrieved from: http://support.sas.com/resources/papers/proceedings13/425-2013.pdf
Russo, C., Green, R., Howitt R. (2008) Estimation of Supply and Demand Elasticities of
California Commoditie, sUniversity of California, Davis Working Paper No. 08-001. Retrieved
from https://ageconsearch.umn.edu/bitstream/37629/2/08-001a.pdf
Wilkins, N., Yurekli, A., Hu., T-W. (2007) . Analysis of Tobacco Demand, World Bank,
Economics of tobacco toolkit. Retrevied form:
http://siteresources.worldbank.org/INTPH/Resources/3Demand.pdf


![PAU - PERI-1 Ferrocarril [201806] - v1€¦ · Title: Microsoft Word - PAU - PERI-1 Ferrocarril [201806] - v1.doc Author: Aj3user Created Date: 8/6/2018 10:18:17 AM](https://img.dokumen.tips/doc/110x75/5f06ccf67e708231d419ccd5/pau-peri-1-ferrocarril-201806-v1-title-microsoft-word-pau-peri-1-ferrocarril.jpg)