Embed Size (px)
Citation preview

The Eight Key Questions on the 2004 Pension Reforms in Japan
To be presented at the RIETI International Symposium on the Evaluation of the 2004 Pension Reforms and the
Direction of Future ReformsBy
Dr. Kazutoshi KOSHIROVice-chair, the Sub-committee on PensionThe Social Security Deliberation Council
Emeritus Professor, Yokohama National University
December 15~16, 2005Research Institute of Economy, Trade and Industry Japan

Q1 By What Measures Is the Pension System Made Financially Sustainable?
1. The contribution rate should be increased every year until 2017 to the ceiling 18.30%.2. National government subsidy for the Basic Pension should be increased from 1/3 to
1/2 by 2009. 3. The Pension Reserve Funds be invested to earn a 3.2% (nominal, inflation at 1.0%)
return.4. Pension benefit should be restrained within the financial resources available by above
1~3 through (a) the automatic balancing mechanism, and (b) drawing out to one year’s reserve by 2100 (see Table 1).
5. Thus, the Replacement Rate can be maintained at 50%
Provided that(A) The TFR is to be restored to 1.39 in the future. Not easy task, but possible.(B ) The economy continues to grow so as to maintain
(a) an annual 1.1% growth of real wages (inflation rate:1.0%), (b) the reserves should produce a 2.2% (real) return.
If not, further remedies will become necessary. The financial balance should bereviewed every five years.

The Automatic Balancing Mechanism through Modified Indexation
• The Initial Pension Benefit Determination for a New Retiree=The Annual Rate of Increase of Real Wages( 1.1% ) minus Modifiers
Modifiers = Decrease in the Labor Force (the number of the active participants in the pension schemes) = - 0.6% and the Extension of the Life Expectancy beyond 65= - 0.3% The total deduction = 0.9%
The Period of Adjustment = until 2023(p)
• The Pension Benefit of Current RetireesThe Inflation rate minus 0.9%
If the inflation rate remains below 0.9%, no further decrease below zero%If the prices decline, pension benefits also be decreased proportionately.

Table 1 Annual Balances, Revenues, Expenditure, and Reserves of Employees Pension Insurance, 2005~2100
of which
Premiums Investment Returns
% ofInvestmentReturns
NationalSubsidy
% trillino yen trillino yen trillino yen % trillino yen trillino yen trillino yen trillino yen %
2005 14.288 28.3 20.8 3.0 10.6 31.9 11.1 -3.6 163.9 5.2 58.8
2010 16.058 37.6 25.5 4.9 13.6 37.5 13.0 0.0 156.0 4.2 56.3
2020 18.300 49.2 34.8 5.8 11.8 43.3 16.5 5.9 186.3 4.2 51.5
2030 18.300 58.2 40.0 8.3 14.3 49.5 19.4 8.7 266.3 5.2 50.2
2040 18.300 66.2 43.1 10.3 15.5 62.9 25.4 3.3 330.1 5.2 50.2
2050 18.300 73.5 47.2 10.6 14.4 74.8 31.4 -1.3 335.0 4.5 50.2
2070 18.300 87.0 58.4 9.0 10.3 90.8 39.3 -3.7 284.4 3.2 50.2
2100 18.300 115.2 84.5 3.7 3.2 121.5 53.3 -6.4 115.1 1.0 50.2
ReplacementRatio
Contrubution Rate
Fiscal Year Revenues
of which
Expenditure Balance
Amount ofResevesat the endof FY
ReseveRatio
Basic Assumptions:The final contribution rate 18.3% by 2017National subsidy for the Basic Pension Benefit ½ by FY2009
TFR after FY2050 is 1.39Macroeconomic slide is put in effect until FY2023Final replacement rate at 50.2%
Source: Mathematics Department, Pension Bureau, the MHLW, March 2005, p.249
(Replacement ratio is estimated by author based on MHLW’s report.)

Q2 How will the Net Pension Liabilities Affect the Future Contribution Rates and the Replacement Rate?
• Even under the PAYG system with a stable population, a certain amount of Net Pension Liabilities arises conceptually. But that is a conceptual artifice.
・ In Japan, due to the very aged population as well as the historical leftovers, “Net Pension Liabilities” are calculated as 570 trillion yen (Figure1). That will be financially covered by the proposed increase of the contribution rates together with the increased government subsidy, the drawing out of the reserve funds, and the introduction of the ABM.

Q2 Continued
・ Some economists suggest that the “Pension Debts” (Net Liabilities) may become unendurable by the future generations under the decreasing population.
• An Alternative Idea to Reduce “Pension Debts” in the Course of Decreasing Population:
• Freezing the Contribution Rate at the Previous 13.58%,• Keeping the 1/3 Government Subsidy to the Basic Pension (not
increasing to ½).• Thus, Reducing the Replacement Rate to 35%.
(T.Oshio, 2005:129~139)
• Which Choice is better depends on Value Judgment on the Political Stability and Feasibility.

Figure 1. “Net Pension Liabilities”of the End of the FY 2004
Based on the Rate of Investment Return, 3.2%(Based on the Increasing Rate of Nominal Wages, 2.1%)
Net PensionLiabilities
=¥570 (¥640)
Net PensionLiabilities
Balance Sheets under Swedish System
No balance sheet for the future period
Future Contributions
Reserve Fund
Past Liabilites
Gov. Subsidy for future Liabilities=¥190(¥340)
Gov. Subsidy for Past Liabilities=¥150 (¥190)
Future Contributions=¥1,200 (¥1,830)
of which attributable to 13.58%=¥920(¥1,390)
=
Pension Benefits¥1,710 trillion
(¥2,630 trillion)
Revenue from Reserve Fund(Drawing out and Investment Returns)
=¥160(¥260)
Financial Resources¥1,710 trillion
(¥2,630 trillion)
Future Liabilities=¥970 (¥1730)
of which the 2nd Floor=¥600 (¥1050)
and Basic Pension=¥370 (¥680)
Past Liabilities=¥740 (¥900)
of which the 2nd Floor=¥430 (¥520)
and Basic Pension=¥310 (¥380)

Figure 2. The Balance Sheet of the EPSAs of the End of the FY 2004
Based on the Rate of Investment Return, 3.2%(Based on the Increasing Rate of Nominal Wages, 2.1%)
=
Gov. Subsidy for PastLiabilities
=¥150 (¥190)
Gov. Subsidy for futureLiabilities
=¥190(¥340)↑2004 ↑2004
* : Numbers in blackets are as in the case of increase rate of nominal wage (2.1%) as discount rate** : 13.58% is contribution rate up to the point of 2004. Thus ¥220 (1200-920) tri is axxociated with raising contribution rate.
Past Liabilities=¥740 (¥900)
of which the 2ndFloor
=¥430 (¥520)and Basic Pension
=¥310 (¥380)
Future Liabilities=¥970 (¥1730)
of which the 2nd Floor=¥600 (¥1050)
and Basic Pension=¥370 (¥680)
Pension Benefits¥1,710 trillion
(¥2,630 trillion)
Government Subsidy=¥340 (¥540)
Future Contributions=¥1,200 (¥1,830)
of which attributable to 13.58% =¥920(¥1,390)**
Revenue from Reserve Fund(Drawing out and Investment Returns)
=¥160(¥260)
Financial Resources¥1,710 trillion
(¥2,630 trillion)*
Source: MHLW, The Results of the Financial Revaluation of the EPS and the NPS, 2005, p.296

Figure 3 A Comparison of Different Pension Contribution SystemsContributionrate
PAYG system
Step-wise contribution(Quasi-funding) System
Level ContributionFinancing Method
TimeThe degree of pension maturation
generations with low contribution
Generations with Balanced contributions and benefit
Generations withHigh contributions

Table 2 The Difference of Contributions and Benefits of the Employees Pension Insurance By the Year of Birth (Men)
ExcludingInterests
Initial Payment Amount in 2002
1965 97 20 14 10 14.84 0.1 1.0 8.4
1969 93 24.4 30 20 15.20 0.2 2.0 11.2
1973 89 27 62 41 15.93 0.5 5.2 19.4
1976 86 28 111 74 17.38 0.8 9.0 21.0
1980 82 30 233 154 17.38 1.8 13.6 22.7
1985 77 32 502 303 18.31 3.7 17.3 23.0
1989 73 35 836 466 19.34 5.9 19.5 23.4
1994 68 37 1411 742 20.01 9.8 22.0 22.5
1999 63 40 2329 1176 20.30 16.1 22.0 22.0
Model Pension(monthly, 10,000 yen)The Year
at Age 60Age in 2002 Insured Year
Total PaidContributionswith Interest(10,000 yen)
LifeExpectancyat Age 60
Monthly Pension BenefitOut of Own Contributions
Including Employers'Contributionsand Interest
MHLW, Pension Mathematics Department.

Q3 Will not the ABM Reduce the Basic Pension below the Subsistence Level?
The ABM is applied also to the Basic Pension.The Monthly Amount of Basic Pension for a Retired Couple: ¥132,000• The Minimum Subsistence Level: ¥122,000• The Nominal Wages Increase=2.1%• The Modifiers = - 0.9 %• The Basic Pension Benefit be increased by 1.2%
(2.1 – 0.9 = 1.2% > inflation rate 1.0%)• Therefore, the real value of the basic pension benefit will be maintained above the subsistence
level even under the ABM. <However, (Basic Pension Benefit )/( Average Wage) will declineduring the ABM applying period.>
• The Amount of the Basic Pension in the Future:For those who were 65 years old in 2004: ¥66,000(16.6%for average earnings of active
generation). Will be increased to ¥69,000 by 2024(11.4%).For those who were 45 years old in 2004:Will start at ¥81,000 in 2024(13.4%), and will become ¥99,000 by 2044(10.8%).
・ For those who have not paid full contributions, their basic pension may become less than the subsistence level. They should be relieved by the welfare programs. The role of social insurances differs from that of the welfare programs.
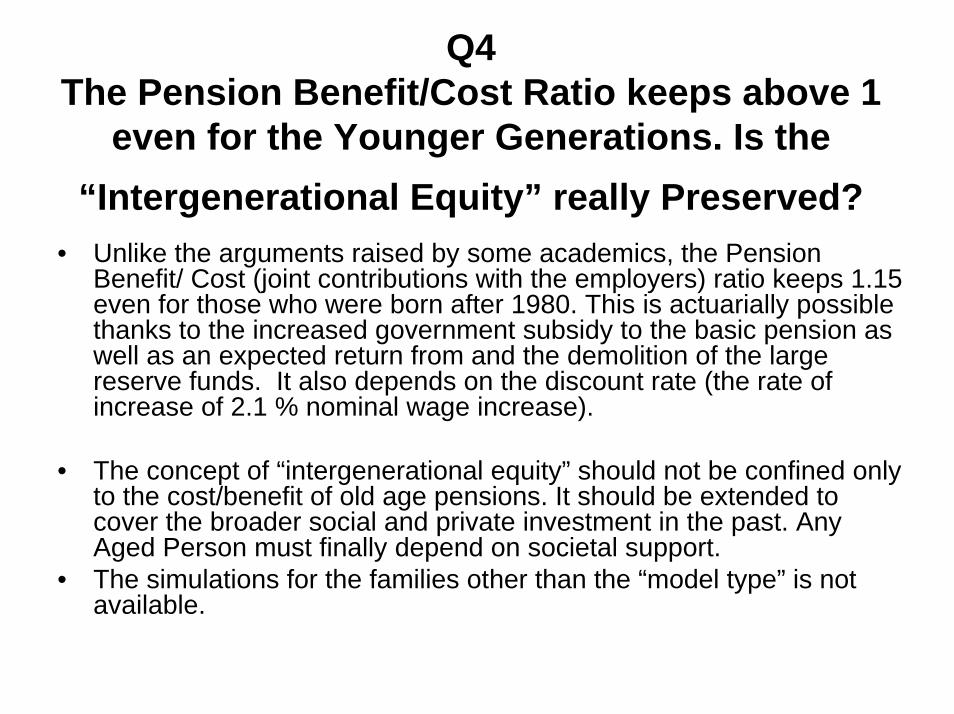
Q4The Pension Benefit/Cost Ratio keeps above 1
even for the Younger Generations. Is the “Intergenerational Equity” really Preserved?
• Unlike the arguments raised by some academics, the Pension Benefit/ Cost (joint contributions with the employers) ratio keeps 1.15 even for those who were born after 1980. This is actuarially possible thanks to the increased government subsidy to the basic pension as well as an expected return from and the demolition of the large reserve funds. It also depends on the discount rate (the rate of increase of 2.1 % nominal wage increase).
• The concept of “intergenerational equity” should not be confined only to the cost/benefit of old age pensions. It should be extended to cover the broader social and private investment in the past. AnyAged Person must finally depend on societal support.
• The simulations for the families other than the “model type” is not available.

Figure 4 “Intergenerational Inequity” among Generations under the PAYG Employees Pension System
Source: Oguchi & Hatta (1999), pp.4~5.
Year of birth
25.89 million yen
48.95Million yen
The present value of lifetime contribution
The present value of lifetime benefit
TenThousand Yen

Table 3 The Intergenerational Differentials of Cost and Benefit of the Employees Pension Insurance System
Year of Birth 1935 1945 1955 1965 1975 1985 1995 2005
Age at 2005 70 60 50 40 30 20 10 0
Total Contributions(10,000 yen)
680 1,200 1,900 2,800 3,900 5,100 6,500 8,000
Total Benefit(10,000 yen)
5,600 5,400 6,000 7,600 9,600 12,000 14,900 18,300
B/C Ratio(excluding employer's
contributons)8.3 4.6 3.2 2.7 2.4 2.3 2.3 2.3
B/C Ratio(including employer's
contributons)4.15 2.3 1.6 1.35 1.2 1.15 1.15 1.15
Total Contributions(10,000 yen)
830 1,500 2,500 3,700 5,100 6,600 8,300 10,300
Total Benefit(10,000 yen)
5,200 4,900 5,500 6,800 8,600 10,700 13,300 16,400
B/C Ratio(excluding employer's
contributons)4.7 2.6 2 1.9 1.7 1.6 1.6 1.6
B/C Ratio(including employer's
contributons)2.35 1.3 1 0.95 0.85 0.8 0.8 0.8
Dis
count
Rat
e : Incre
ase R
ate o
fN
om
inal
Wag
e
(2.1
%)
Dis
count
Rat
e : R
ate o
f R
etu
rn o
fIn
vest
ment
(3.2
%)
Source: MHLW, The Summary of the Proposed 2004 Pension Reforms, January 2005

Q5 To What Extent the Adversarial Effects of Pension Systems on the Labor Market Be Alleviated?
• The 3rd Category Insured still exceeds 11.2 million. Polls split on the problem “Whether they should pay their own contributions?” The principle of “Pay as You Earn” vs. the economic theory of “the Imputed Income” from household work.
• The Extension of the Pension rights to Part-time Workers who work more than 20 hours a week?
• About 4 million more workers will be covered by the EPS.

Q5 continued
• The Partial Pension for Aged Workers after the Mandatory Retirement Age. The 20% cut was deleted (from April 2005).
• Pension Benefit of the Aged Workers between 65 and 69 who earn more than a certain amount be reduced (from April 2002).
• The 2nd Floor Pension benefit of the Rich Aged Workers above 70 shall be reduced to some extent (from April 2007).

Q6 Other Remaining Problems
1) The consolidation of the public pension schemes. Discussed since 1984. Consolidation of the EPS and the Mutual Aid Associations be achieved by 2007.
2) The DP bill to consolidate all the public pension schemes including the NPS is unrealistic because (a) incomes of the self-employed should be confirmed first by the tax-number for all citizens; (b) How much are the thresholds for the guaranteed pension benefit? (c) Most of the Rengo union members will not be able to receive the GPB despite their payment for the increased sales tax. Is such an idea politically feasible?
3) How to find out the financial resources to be appropriated for the increased government subsidy for he basic pension? Out of necessary 2.6 trillion yen, only a few hundred billion yen was appropriated from the increased tax for pension benefits. The remaining amount should be raised through tax reforms including the increase of sales tax.

Q6 Continued4) Easy Understandable Formula
• The Formulas of Pension Benefit have become so complicated as a result of successive reforms that more simplified and understandable formulas are needed.
• The Point system be introduced in 2008.• The Pension Points be informed to all the
contributors individually.

Q7 Why not the NDC in Japan?
• The Reasons: (a) The Degree of Ageing is more serious in Japan; (b) The Swedish NDC is applied only to Old Age Pension (excluding survivors and disability pensions); (c) The Swedish pension system does not have a flat-rate benefit.
• As a result, the “Turnover Duration”, an essential mathematical element for establishing the NDC system, can not be defined in Japan (see B.D. Mikula, 2001).Instead, the ABM was introduced.

Q8 The Increasing Supplementary Role of Corporate Pensions to Maintain the
Reasonable Replacement Rate
Cash earnings
Corporate pensions
Total Labor Cost of Major Companies, 2003
73.7
5.0
4.5
3.6
1.2
5.76.3
Cash Earnings
Employees Pension Insurance
Other Legally Required B enefits
Voluntary Fringe B enefits
Commuting & Transportaion Allowances
Lump Sum Retirement Allowance
Corporate Pensions
Source: Nippon Keidanren, Annual Survey of Fringe Benefits in the Fiscal Year 2003,
Table 2, January 2005.

Figure 6 The Percentage Share of Corporate Retirement Benefits In the Total Labor Costs
of Major Companies Affiliated to the Nippon Keidanren, 1960~2002
総労働費用のなかの退職金の割合の推移 1960-2003年度
0.0
2.0
4.0
6.0
8.0
10.0
12.0
14.0
1960 1963 1966 1969 1972 1975 1978 1981 1984 1987 1990 1993 1996 1999 2002
年度
%
日本経団連「2003年度福利厚生費調査」による