Embed Size (px)
Citation preview
The Efficacy of Prescribed Casual Video Games in Reducing Clinical Depression and Anxiety©
Carmen V. Russoniello, PhD*1, Matthew Fish, MS (c)*, Kevin O'Brien, PhD*, Vadim Pougatchev, MD** & Eugene Zirnov, MD, PhD**
* East Carolina University** Biocom Technologies 1 Corresponding Author [email protected]
This study was underwritten by PopCap Games, Inc

The Cost of Depression
According to the World Health Organization (2011) depression is a common diagnosable disorder, affecting approximately 121 million people worldwide. Depression was the leading cause of disability and the 4th leading contributor to the global burden of disease in 2000. By the year 2020, depression is projected to reach 2nd place of the ranking of burden for diseases for all ages and both sexes. Depression is currently the 2nd cause of disability in the age category 15-44. Unfortunately, fewer than 25 % of those affected have access to effective treatments.

The Cost of Depression
In the United States an estimated 20.9 million American adults (9.5% of the U.S. population age 18 or older) suffer from a mood disorder, and more than two thirds of those (14.8 million U.S. adults) are cases of major depression. Depression is the leading cause of disability in the U.S. for people aged 15 to 44. Depressive disorders often co-occur with anxiety disorders, and approximately 40 million American adults (about 18 percent of all U.S. adults) have an anxiety disorder (National Institute of Mental Health 2011).

Participants
Participants were Adults (=>18) that signed an Institutional Review Board approved informed consent agreeing to participate and met the criteria score for inclusion (PHQ9 score=>5).

Participants
Qualifying participants then completed the POMS, State/Trait Anxiety Inventory, psychological assessments, demographic profile sheet, and the remaining components of the Patient Health Questionnaire (PHQ). The participants also gave a small saliva sample for biochemical testing. At this point participants opened an envelope containing a random assignment to the control or experimental groups.

Experimental Group
If the participant was assigned to the experimental group they were given a choice of three popular casual video games to play. Research has demonstrated that freedom to choose is an important precursor to experiencing the full benefits of recreation participation. The participant then played the games of their choice for 30 minutes while being recorded.

Experimental Group
In addition to the two lab sessions scheduled one month apart, the experimental group was instructed to play the casual video game of their choice at home for at least 30 minutes 3x per week (At least 24 hours between sessions) for one month. Participants were asked to keep a log of the amount of time spent playing the game during the month. The average game playing time for the experimental group was minimum 30 max 68 minutes and the mean 40.7 minutes.

Control Group
If the person was assigned to the control group biosensors were placed by the researcher and baseline psychophysiological data was recorded for 6 minutes.
The control participant was then instructed to surf the National Institutes of Mental Health consumer web site on depression for 30 minutes while psychophysiology data was being recorded. http://www.nimh.nih.gov/health/topics/depressionindex.shtml

MethodsAll sessions were conducted in a room with
minimal distractions (blank walls, no outside view, minimal noise). The researcher administered psychological assessments and connected the participants to physiological monitoring equipment following the same procedure for both groups. All participants sat in the same chair in front of the same computer.

Methods
If randomized to the control group the participants was brought to the NIMH web site and instructed to surf the page for 30 minutes. If randomized into the prescribed game group the participants preferred game was brought up on the screen and they were instructed to play for 30 minutes. In both cases the researcher stayed in the room monitoring all physiological signals for integrity on a separate monitor.

Data Collection Data was collected from participants on 4 occasions
Time 1 Pre Session 1 (the initial baseline)Time 2 Post Session 1Time 3 Pre Session 2 (one month after the initial
baseline)Time 4 Post Session 2

Psychological Measurement of Depression
To quantify changes in depression symptoms participants completed the PHQ-9 a self administered health questionnaire at the beginning to establish baseline and end of the study one month later. The Patient Health Questionnaire-9 (PHQ-9) is a nine-item depression scale and a component of the PHQ that was originally a component of the Primary Care Evaluation of Mental Disorders (PRIME-MD) a widely used diagnostic screening tool in Primary care. The PHQ-9 has since been validated and widely used as a brief diagnostic and severity measure for depression in participant populations with different disorders.

PHQ-9
The PHQ-9 has demonstrated the ability to detect depression symptoms and change over time. In one study the PHQ-9 scores discriminated well between participants with any versus no depressive disorder, as well as between participants with and without major depression. A PHQ-9 score > or =10 had 91% sensitivity and 89% specificity for major depression, and 78% sensitivity and 96% specificity for any depression diagnosis. Since then the PHQ -9 has been validated as a screening tool as well as an outcome indicator.

PHQ-9 The PHQ-9 uses check marks in a Likert type scale and is Interpreted as
follows:
0-4 None
5-9 Mild depression
10-14 Moderate depression
15-19 Moderately severe depression
20-27 Severe depression

Physiological Measurement of Depression
Heart rate variability (HRV) provides an accurate assessment of autonomic nervous system functioning based upon variability in the inter-beat interval of heart beats. A robust HRV is associated with balance between the sympathetic and parasympathetic branches of the autonomic nervous system (ANS).

Physiological Measurement of Depression
In people who are depressed heart rate variability is negatively affected and can be assessed using a power spectrum analysis. In this study HRV changes were used as a measure of ANS change to determine the effectiveness of the intervention on the ANS. HRV was recorded during the entire session using a small ear clip sensor using photoplethesmography technology. Analysis followed international HRV standards for measurement.

Physiological Measurements of Depression
Changes in the Brain function were recorded using a 10 channel electroencephalography device. EEG symmetry has been extensively used to study the effects of different stimuli on the brain and it is now generally accepted that hypoactivity in the left hemisphere is associated with negative affect and stress while increases in right hemisphere alpha power are associated with mania states, euphoria and excitement.

Physiological Measurements of Depression
It was hypothesized that casual video games would also result in increased left and right frontal activity and overall symmetry when compared to controls.
A software computer screen was developed that automatically collected 6 minutes of baseline and 30 minutes of intervention providing normative data and R/L brain alpha ratio scores.

Participants
There a total of 59 participants included in the study. Twenty-nine participants served as controls surfing the National Institutes of Mental Health’s Web Page on Depression. The experimental group consisted of 30 participants with eighteen choosing to play Bejeweled 2; seven participants choosing to play Peggle and five participants choosing to play Bookworm Adventures (BWA).

Participants
There were 30 females and 29 males in the study. Participants ranged in age from 18 to 74 with average age calculated at 30. Sixty three percent were gamers and thirty one percent were not. Twenty three percent were on antidepressant medications and seventy three percent were not.

Participants
65% of the participants were European-Americans; 23% percent were African Americans, 3.3. % Hispanic Americans, 1.6 % Asian Americans and 3.3% other.

RESULTS PHQ-9 Differences between Experimental and Control Groups
Time Mean Diff Std. Err Sig 1 -.345 1.33 .7972 3.13 1.36 .0243 2.85 1.23 .0244 3.13 1.08 .005
PHQ-9 scores did not differ at time 1 (the initial baseline) but did so after time 2 or post session one; time 3 or baseline for session two obtained 1 month after initial data collection and time 4 or post second session.

(PHQ-9) Score Minimal Minor Moderate Severe TotalPre Study Control Count 12 9 6 2 29
Percent 41.4% 31.0% 20.7% 6.9% 100.0%Post Study Control Count 18 9 1 1 29
Percent 62.1% 31.0% 3.4% 3.4% 100.0%
Minimal Minor Moderate Severe TotalPre Study Experimental Count 14 9 3 4 30
Percent 46.7% 30.0% 10.0% 13.3% 100.0%Post Study Experimental Count 26 4 0 0 30
Percent 86.7% 13.3% 0% 0% 100.0%
Changes in Clinical Depression Pre-Post Study


Minimal Mild Moderate Severe
PHQ pre 42.9 50 7.1 0
PHQ post 100 0 0 0
5
15
25
35
45
55
65
75
85
95
PHQ pre
PHQ post
Changes in Clinical Depression within CVG GroupPH
Q S
CORE
S

Summary of Changes in Clinical Depression
The experimental group saw significant reductions in depression across the board, with all seven subjects previously classified as suffering from moderate to severe depression moving to the minor or minimal depression categories. At the same time, the number of subjects classified as having minor depression dropped from nine to four. Further analyses revealed changes between males and females as well as in younger and older participants.

Changes in Depression Symptoms in Females Pre Post Prescribed Game Play

Minimal Mild Moderate Severe
PHQ pre 42.9 50 7.1 0
PHQ post 100 0 0 0
5152535455565758595
PHQ pre
PHQ postChan
ges
in C
lini
cal D
epre
ssio
nChanges in Depression Symptoms in Males Pre-Post Study
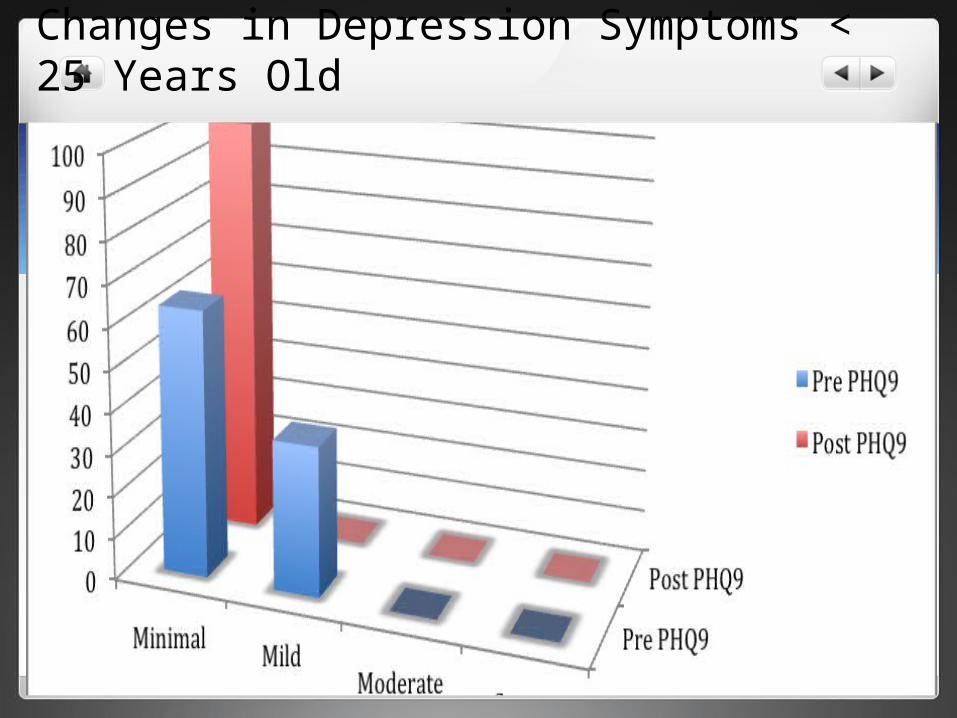
Changes in Depression Symptoms < 25 Years Old

Changes in Depression Symptoms => 25 Years Old

Measurement of Overall Mood
To quantify overall mood changes participants completed a self administered psychological assessment of mood using the Profile of Mood States (POMS) assessment. The POMS is a factor analytically derived inventory that measures six subscales: tension, depression, anger, vigor, fatigue, and confusion and can be used with “Last Week” and “Right Now.” administrations. Internal consistency for the POMS has been reported at .90 or above. Test re-test reliability is reported between .68 and .74 for all factors. Construct and predictive validity have been established in four areas: brief psychotherapy, controlled outpatient drug studies, studies of response to emotional conditions and studies of concurrent validity coefficients and other POMS correlates.

Overall mood during game play was also measured. The POMS measures Psychological Tension, Anger, Depression, Vigor, Fatigue and Confusion. Cumulatively, these six aspects of mood are combined to form “Total Mood Disturbance,” (TMD)
Time Mean Diff Std. Err Sig 1 .252 11.2 .982 2 24.4 7.4 .002 3 24.0 10 .020 4 29.6 7.7 .000 A decrease in TMD indicates a positive change in mood. In terms of TMD during game play the experimental group experienced a 65% reduction in TMD and this was significant from control after each measure except for the initial baseline
Profile of Mood States (POMS)

Changes in POMS Categories
The following slides depict the differences between the video game group and the six categories of the POMS.
In general there were Decreases in: Tension: 49.6% Anger: 55% Depression: 50% Fatigue: 58% Confusion: 50% and a 33% Increase in Vigor

pre Sess1 post Sess1 pre Sess2 post Sess2
Video Game 15.1 4.6 7.8 2.2
Control 13.4 8.3 10.8 6.6
1
3
5
7
9
11
13
15
Reductions in TensionsPO
MS
SCO
RES
Video game group differed from control p=.396; p=.009; p=.091; p=.001

pre Sess1post Sess1
pre Sess2post Sess2
Video Game 16.9 4.6 8.5 2
Control 18.5 8.8 14.1 7
1
3
5
7
9
11
13
15
17
19
Depressed MoodPO
MS
SCO
RES
Video game group differed from control p=.673; p=.090; p=.063; p=.044

pre Sess1 post Sess1 pre Sess2 post Sess2
Video Game 12.8 1.1 7 0.73
Control 13.5 3 10 3.2
1
3
5
7
9
11
13
Changes in AngerPO
MS
SCO
RES
Video game group differed from control p=.778; p=.082; p=.161; p=.065

1 2 3 4
Video Game 12.5 13.7 16.1 17.1
Control 12.6 8.5 11.5 8.6
1
3
5
7
9
11
13
15
17
Changes in VigorPO
MS
SCO
RES
Video game group differed from control p=.970; p=.012; p=.016; p=.000

pre Sess1 post Sess1 pre Sess2 post Sess2
Video Game 11.7 3.9 6.8 2.4
Control 13 9.1 10.6 8.3
1
3
5
7
9
11
13
Changes in FatiguePO
MS
SCO
RES
Video game group differed from control p=.475; p=.002; p=.025; p=.000
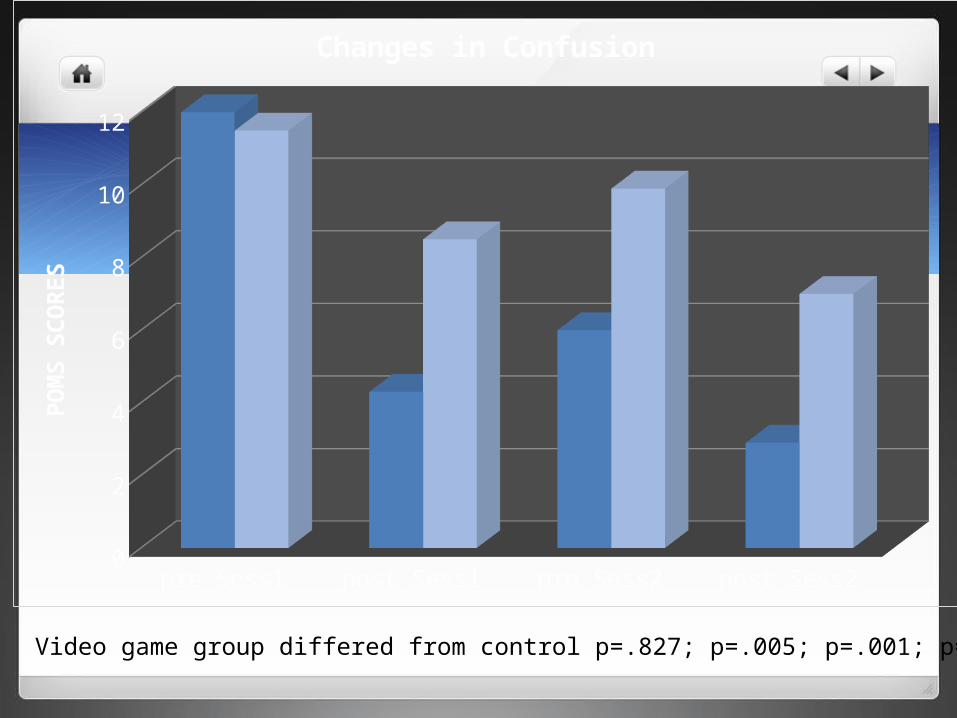
pre Sess1 post Sess1 pre Sess2 post Sess2
Video Game 12 4.3 6 2.9
Control 11.5 8.5 9.9 7
1
3
5
7
9
11
Changes in ConfusionPO
MS
SCO
RES
Video game group differed from control p=.827; p=.005; p=.001; p=.001

Changes in Anxiety
The experimental group saw significant reductions in both state and trait anxiety. Subjects in the experimental group experienced a significant decrease in their state anxiety score between Time 1 (session 1 baseline) and Time 3 (session 2 baseline). Likewise, subjects also experienced a significant decrease in their trait anxiety score from Time 1 and Time 3. Subjects within the control group did not experience any significant change in their anxiety levels.

RESULTSSTAI-S Differences between Experimental and Control Groups
Time Mean Diff Std. Err Sig 1 3.28 2.98 .2752 8.48 2.72 .0033 8.34 3.06 .0094 11.64 2.72 .000
STAI-S scores did not differ at time 1 (the initial baseline) but did so after time 2 or post session one; time 3 or baseline for session two obtained 1 month after data collection and between time 2 and time 4 or post second session were statistically significant.

Time Mean Diff Std. Err Sig 1 3.14 3.22 .3332 7.86 3.24 .019
STAI-T scores did not differ at time 1 (the initial baseline) but did so at time 2 or baseline for session two obtained 1 month after data collection.
RESULTSSTAI-T Differences between Experimental and Control Groups

STAI-S Pre-Post Study Control Group
Non-Clinical Anxiety Clinical Anxiety0
5
10
15
20
25
30
Pre Study STAI-S
Post Study STAI-S
Pre Study STAI-SPost Study STAI-S

STAI-S Pre-Post Study Experimental Group
Non-Clinical Anxiety Clinical Anxiety0
5
10
15
20
25
30
Pre Study STAI-S
Post Study STAI-S
Pre Study STAI-SPost Study STAI-S

STAI-T Pre-Post Study Control Group
Non-Clinical Anxiety Clinical Anxiety0
5
10
15
20
25
30
Pre Study STAI-T
Post Study STAI-T
Pre Study STAI-TPost Study STAI-T

STAI-T Pre-Post Study Experimental Group
Non-Clinical Anxiety Clinical Anxiety0
5
10
15
20
25
30
Pre Study STAI-T
Post Study STAI-T
Pre Study STAI-TPost Study STAI-T

STAI-S Pre-Post Study Control Group
Time 1 Time 2 Time 3 Time 40
5
10
15
20
25
30
35
40
45
50 STAI-S Control Group
STAI-S Control Group
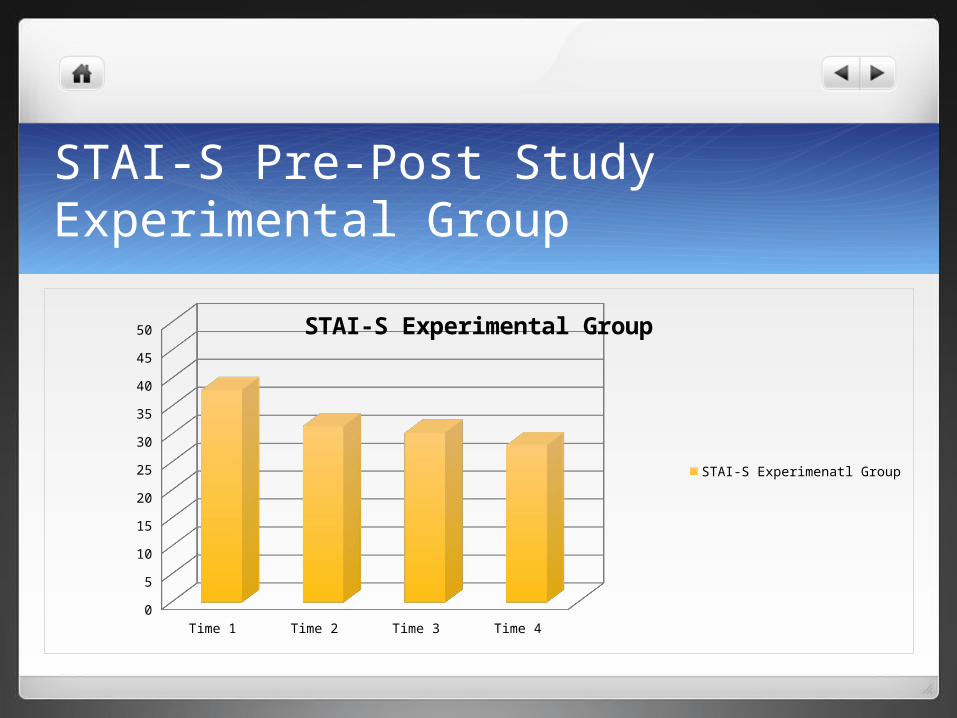
STAI-S Pre-Post Study Experimental Group
Time 1 Time 2 Time 3 Time 40
5
10
15
20
25
30
35
40
45
50 STAI-S Experimental Group
STAI-S Experimenatl Group

STAI-S Experimental and Control Comparison
Time 1Time 2
Time 3Time 4
20
25
30
35
40
45
Experimental Group
Control Group
Experimental GroupControl Group

STAI-T Pre-Post Study Control Group
Time 1 Time 20
5
10
15
20
25
30
35
40
45
50
STAI-T Control Group
STAI-T Control Group

STAI-T Pre-Post Study Experimental Group
Time 1 Time 20
5
10
15
20
25
30
35
40
45
50
STAI-T Experimental Group
STAI-T Experimental Group

STAI-T Experimental and Control Comparison
Time 1
Time 2
20
25
30
35
40
45
50
Experimental Group
Control Group
Experimental GroupControl Group

Discussion
The results of this randomized clinical study clearly demonstrate the intrinsic value of certain casual games in terms of significant, positive effects on depression and anxiety symptoms. In our opinion these findings support the use of prescribed casual video games for treating depression and anxiety as an adjunct to, or even replacement for, standard therapies including medication.

Discussion
Equally important, the data supports the hypothesis that video game play provokes physiological and biochemical changes consistent with positive changes in mood and anxiety.

Discussion
Finally, given the fact that significant changes were demonstrated before and after game play as well as before and after the month long study, the data supports both the short and long term efficacy of prescribed game play.