Embed Size (px)
Citation preview

The Effects of Organized Upstream Convection on Downstream Precipitation:
Implications for missed forecasts and false alarms
Kelly Mahoney
WAS-IS
14 August 2008
Analyzed precip

2
Precipitation forecasting and upstream convection…What’s the problem?
• Quantitative precipitation forecasting: weakest forecast parameter
– Large public impact, e.g.:
• Flooding
• Winter storms
• Agriculture
11/19/03 Boone, NC (a big Eta (NAM) model miss!)
• Convection (thunderstorms) an even greater challenge
– Convection often accompanied by:
• Flash flooding
• Severe wind
• Lightning
• Tornadoes…

3
Precipitation forecasting and upstream convection…What’s the problem?
• Deep convection upstream hypothesized to degrade downstream precipitation forecast
Low level flow
Decreaseddownstreamprecipitation
Upstreamconvection
• Particular problem in southeast US when convection present over the Gulf of Mexico (as well as over the Gulf Stream) (Nat’l Weather Service)
4
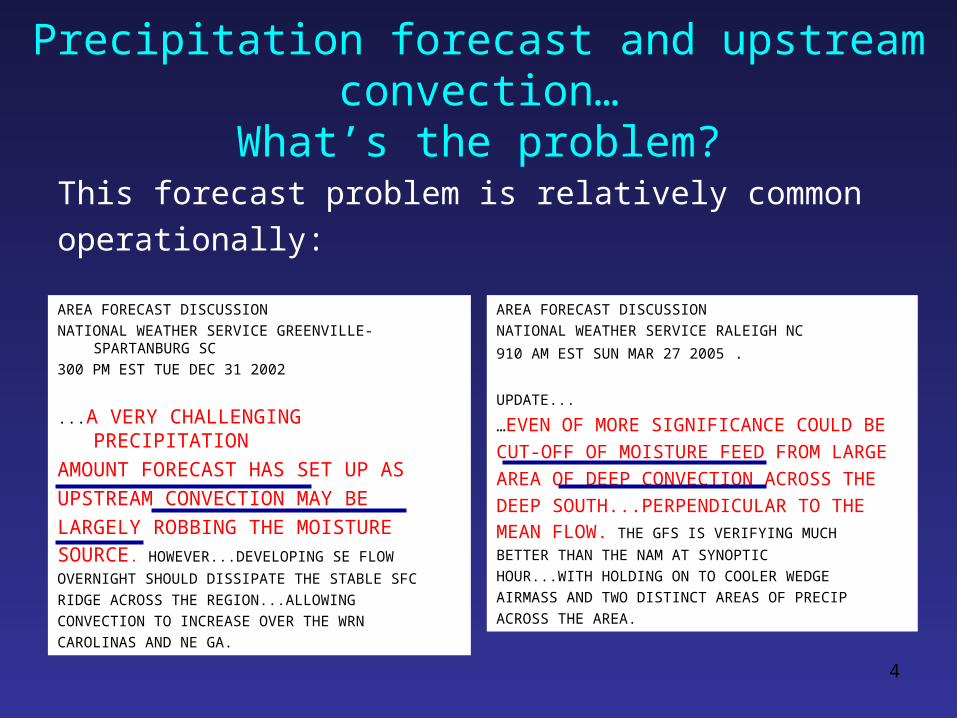
Precipitation forecast and upstream convection…What’s the problem?
This forecast problem is relatively common
operationally:AREA FORECAST DISCUSSIONNATIONAL WEATHER SERVICE GREENVILLE-
SPARTANBURG SC300 PM EST TUE DEC 31 2002
...A VERY CHALLENGING PRECIPITATION AMOUNT FORECAST HAS SET UP ASUPSTREAM CONVECTION MAY BE LARGELY ROBBING THE MOISTURESOURCE. HOWEVER...DEVELOPING SE FLOW
OVERNIGHT SHOULD DISSIPATE THE STABLE SFCRIDGE ACROSS THE REGION...ALLOWING CONVECTION TO INCREASE OVER THE WRN CAROLINAS AND NE GA.
AREA FORECAST DISCUSSION
NATIONAL WEATHER SERVICE RALEIGH NC
910 AM EST SUN MAR 27 2005 .
UPDATE...
…EVEN OF MORE SIGNIFICANCE COULD BE
CUT-OFF OF MOISTURE FEED FROM LARGE
AREA OF DEEP CONVECTION ACROSS THE
DEEP SOUTH...PERPENDICULAR TO THEMEAN FLOW. THE GFS IS VERIFYING MUCH
BETTER THAN THE NAM AT SYNOPTIC
HOUR...WITH HOLDING ON TO COOLER WEDGE
AIRMASS AND TWO DISTINCT AREAS OF PRECIP
ACROSS THE AREA.
5
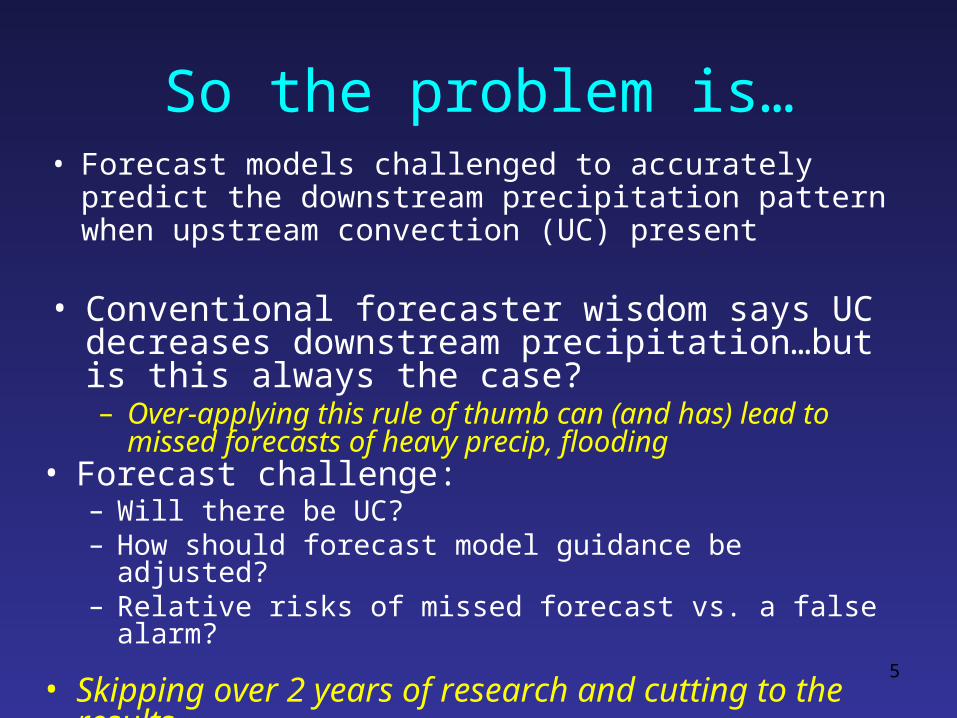
So the problem is…• Forecast models challenged to accurately predict
the downstream precipitation pattern when upstream convection (UC) present
• Forecast challenge:– Will there be UC?– How should forecast model guidance be adjusted? – Relative risks of missed forecast vs. a false alarm?
• Skipping over 2 years of research and cutting to the results…
• Conventional forecaster wisdom says UC decreases downstream precipitation…but is this always the case? – Over-applying this rule of thumb can (and has) lead to
missed forecasts of heavy precip, flooding

6
Upstream Convection Results: Two Scenarios
Scenario 1: Fast convection (FC)
UC oriented parallel to flow.
Propagates quickly relative to main synoptic system, perpendicular to flow.
Scenario 1: “Fast” convection
Model forecast bias: S1: Decreased downstream
precipitation
Flow direction
Scenario 2: “Slow” convection
Flow direction
Scenario 2: Slow convection (SC)
UC oriented parallel to flow.
Propagating slowly, or not at all, relative to main synoptic system
Model forecast bias:S2: Increased downstream
precipitation
Great! We have all the answers* – now we can just apply to the forecast process and save lots of people’s lives, time, and money!
How hard can it be?!
Mahoney, K.M., and G.M. Lackmann, 2007: The effects of upstream convection on downstream precipitation. Wea. Forecasting, 22, 255–277.

7
Forecasting implications• Feb 13, 2007: An example of the complexity of UC “rules”
and the risks of missed forecasts and false alarms• Feb 12: Email thread started on
CSTAR email list; asking what this UC feature meant for various offices in the SE US.
• Different offices ended up forecasting different implications…
8
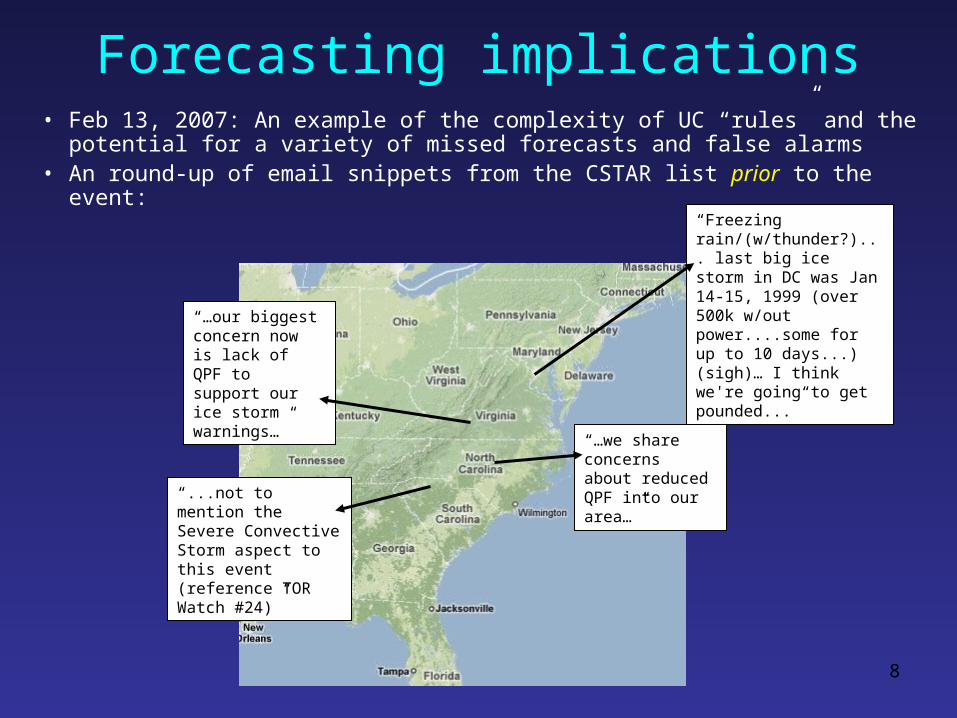
Forecasting implications• Feb 13, 2007: An example of the complexity of UC “rules” and the
potential for a variety of missed forecasts and false alarms• An round-up of email snippets from the CSTAR list prior to the
event:
“…our biggest concern now is lack of QPF to support our ice storm warnings…”
“…we share concerns about reduced QPF into our area…”
“Freezing rain/(w/thunder?)... last big ice storm in DC was Jan 14-15, 1999 (over 500k w/out power....some for up to 10 days...) (sigh)… I think we're going to get pounded...”
“...not to mention the Severe Convective Storm aspect to this event (reference TOR Watch #24)”
9
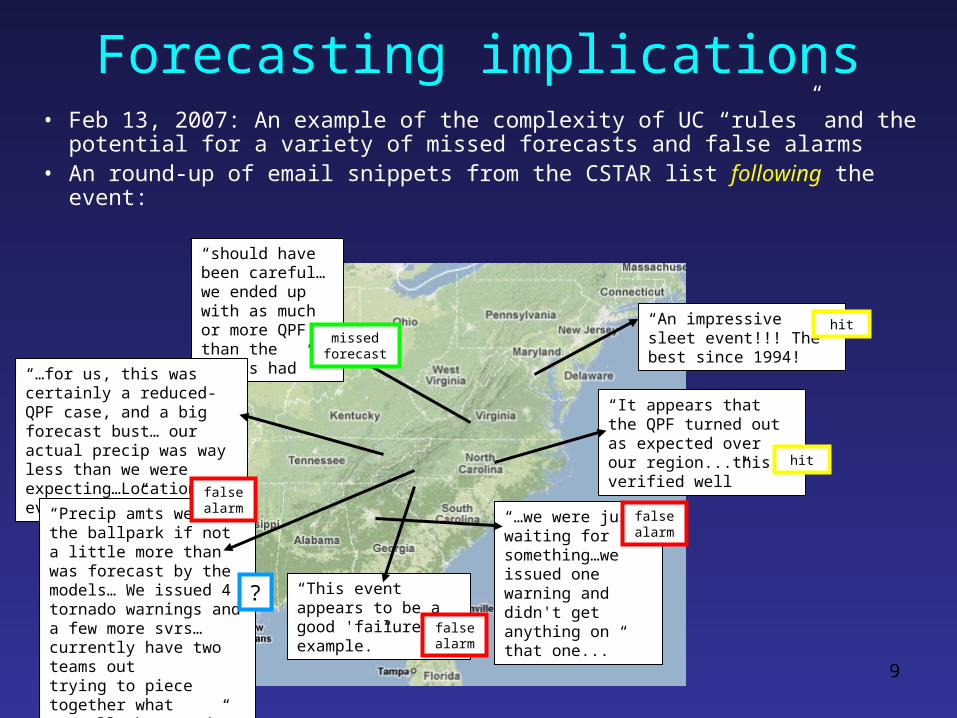
Forecasting implications• Feb 13, 2007: An example of the complexity of UC “rules” and the
potential for a variety of missed forecasts and false alarms• An round-up of email snippets from the CSTAR list following the
event: “should have been careful…we ended up with as much or more QPF than the models had”
“…we were just waiting for something…we issued one warning and didn't get anything on that one...”
“An impressive sleet event!!! The best since 1994!”
“…for us, this was certainly a reduced-QPF case, and a big forecast bust… our actual precip was way less than we were expecting…Location is everything!”
“It appears that the QPF turned out as expected over our region...this verified well”
“This event appears to be a good 'failure' example.”
“Precip amts were in the ballpark if not a little more than was forecast by the models… We issued 4 tornado warnings and a few more svrs…currently have two teams out trying to piece together what actually happened”
false alarm
false alarm
false alarm
?
missed forecast
hit
hit

10
Forecasting implications• So…this wasn’t so cut and dry after all! • What we know:
– Computer forecasts often poor for downstream precipitation in the presence of upstream convection, and bias varies by scenario (oh and we know why too…but that doesn’t help the public much!)
– Complex decision-making tree; forecasters challenged to recognize type of event, type of error, when to correct
• What we don’t know: – How to make good use of the findings – Which type of model or human forecast error costs people more? (In “currency” of
lives, time, environmental impacts, etc)
Examples of precipitation forecast errors (they’re big!)
Examples of each scenario…very different impacts!
11
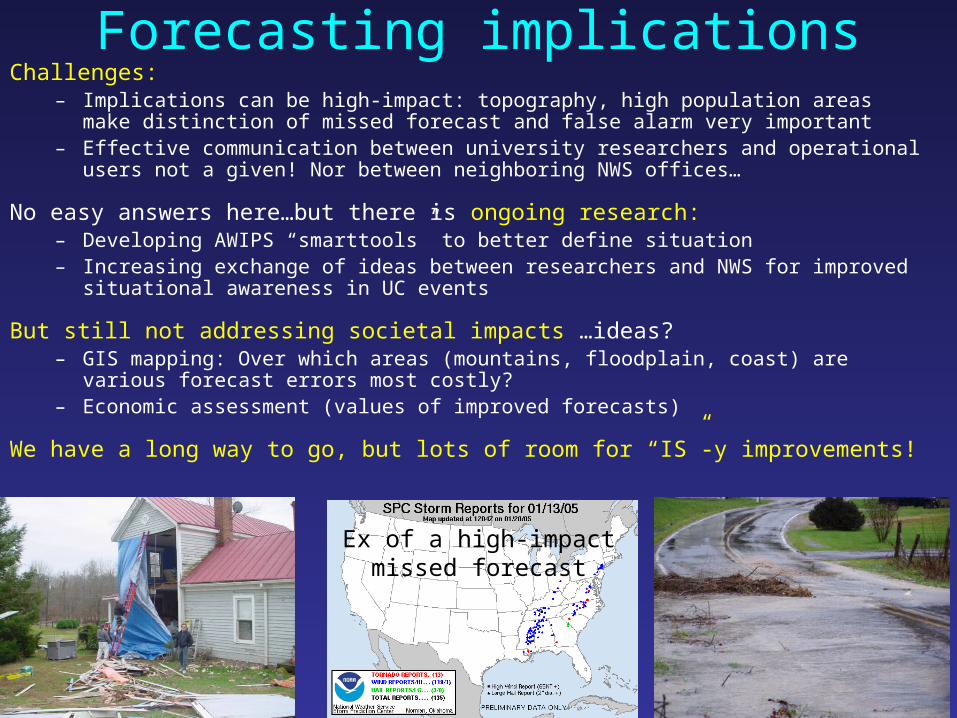
Forecasting implicationsChallenges:
– Implications can be high-impact: topography, high population areas make distinction of missed forecast and false alarm very important
– Effective communication between university researchers and operational users not a given! Nor between neighboring NWS offices…
No easy answers here…but there is ongoing research:– Developing AWIPS “smarttools” to better define situation– Increasing exchange of ideas between researchers and NWS for improved situational
awareness in UC events
But still not addressing societal impacts …ideas?– GIS mapping: Over which areas (mountains, floodplain, coast) are various forecast
errors most costly?– Economic assessment (values of improved forecasts)
We have a long way to go, but lots of room for “IS”-y improvements!
Ex of a high-impact missed forecast


![Car Alarms & Smoke Alarms [Monitorama]](https://img.dokumen.tips/doc/110x75/54b6cdf94a7959d84d8b45a5/car-alarms-smoke-alarms-monitorama.jpg)


