Embed Size (px)
Citation preview

The Effects of Lead Poisoning
on African-American and Low-Income Families
in Toledo, Ohio
March 2016
This report was prepared on behalf of the
Toledo Lead Poisoning Prevention Coalition
1 March 2016
I. INTRODUCTION
The Toledo Lead Poisoning Prevention Coalition is a community group organized around the principle that community residents are effective agents of change when they are provided with information and resources. Information about primary prevention is the most effective means to maintain a long-term lead safe community. Leadership, commitment and resources are required to establish lead safe environments for our children and families. Based on these principles the Toledo Lead Poisoning Prevention Coalition is committed to advocating for local policies and laws that will truly protect children and their families from environmental health hazards by identifying hazards and taking corrective and preventive action before harm occurs. This report was prepared to support the Coalition’s goal of eliminating the lead poisoning of children in Toledo.
Childhood lead poisoning remains a serious problem in the United States, even though average blood lead levels are significantly lower than those in the middle-to-late 20th century. Evidence of irreversible damage to a child’s developing brain resulting in both psychological and cognitive deficits can occur at lead levels much lower than previously believed. No amount of lead is safe. Eliminating all lead exposure in our environment is our best course of action.1
Young children become exposed to the lead dust or paint chips when they crawl on the floor and engage in normal hand-to-mouth behaviors, which are highly prevalent between ages 9 and 24 months. Although there are certainly concerns regarding homes with chipping paint, many children are exposed to lead through the dust that comes off of friction surfaces (doors, door frames, windows, window frames) painted with lead-based paint. A very small amount of dust distributed around the floor of a home may significantly raise a child’s lead level. 2, 3
The prediction is that 25.9 percentage of children aged 1–2 years living in housing constructed before 1950 have a blood lead levels of 5 micrograms or greater, which the CDC now recognizes as lead poisoning.4 Childhood lead poisoning is one of many negative health conditions related to poor home conditions. Many low-income and minority families live in poorly built or substandard homes and are disproportionately impacted by lead exposure. These families often do not have the opportunity to live in healthy environments that promote a safe quality of life. Children living in lead-safe housing are over four times less likely to have higher blood-lead levels than children living in homes with lead hazards.
1 http://www.niehs.nih.gov/health/topics/agents/lead/ 2 American Academy of Pediatrics, Council on Environmental Health. Lead. In: Etzel RA, Balk SJ, eds. Pediatric
Environmental Health. 3rd ed. Elk Grove Village, IL: American Academy of Pediatrics; 2012:439-449. 3 Levin R, Brown MJ, Kashtock ME, et al. Lead exposures in U.S. children, 2008: implications for prevention. Environ Health
Perspect. 2008;116(10):1285-1293. 4 http://www.cdc.gov/mmwr/preview/mmwrhtml/su6302a6.htm#Tab2

2 March 2016
Removing disparities in access to healthy, safe, and affordable homes is essential to improving the quality of life for minority and low-income families. This creates sustainable communities and supports the principles of environmental justice.5
The city of Toledo has the opportunity to enact an ordinance that, if adopted, would require a residential rental property to be lead-safe before a family with young children moves in. The goal of this proposed ordinance is to address the dangers of lead for families who are residential rental property tenants. African Americans and low-income residents are at a much greater risk for lead poisoning than other populations. The minority and low-income populations of Toledo are concentrated in ZIP Codes identified by the Ohio Department of Health (ODH) as high-risk for lead poisoning. The dangers posed to children by lead poisoning fall disproportionately on Toledo’s low-income and African American populations.
The proposed Toledo ordinance would require that every owner of residential rental property constructed prior to 1978 must have the property inspected for lead hazards and maintain such property free from presumed lead hazards. If an inspection of the residential rental property shows the existence of lead hazards, the owner must have the lead hazard corrected before the property can be rented. The ordinance would further require that every owner of residential rental property constructed prior to 1978 within the City of Toledo obtain certification from the Toledo–Lucas County Health Department that the rental property is lead-safe before letting or otherwise permitting the occupancy of such residential rental property.
II. BACKGROUND ON LEAD POISONING
A. Lead-Based Paint: Still the Primary Source of the Lead that Poisons Young Children
Lead toxicity in children was first described by Dr. John Lockhart Gibson in 1892 when he reported children with severe neurologic disease that was associated with exposure to deteriorating white lead paint. 6, 7 Although the toxic effects of lead were well known for millennia, sale of lead-based residential paint was not banned in the United States until 1978.8 Additionally, the sale and use of leaded gasoline nationally in automobiles was gradually phased out over 25 years until its complete elimination in 1996.9
5 http://www.cdc.gov/healthyhomes/ej/ej_1page_english.pdf 6 Needleman H. Low level lead exposure: history and discovery. Ann Epidemiol. 2009;19(4):235-238. 7 Rabin R. Warnings unheeded: a history of child lead poisoning. Am J Public Health. 1989;79(12):1668-1674. 8 Lanphear BP. Childhood lead poisoning prevention: too little, too late. JAMA. 2005;293(18):2274-2276. 9 Needleman HL. The removal of lead from gasoline: historical and personal reflections. Environ Res. 2000;84(1):20-35.

3 March 2016
Lead in various forms has been used in the U.S. as a pigment in paint since colonial times, its use peaking in the 1920s. In addition to lead’s pigment qualities, the toxic metal also facilitates drying and helps paint to form a flexible, durable, water-resistant coating for walls, equipment and toys. Despite the advent of alternatives based on safer metals like zinc and titanium, lead-based paint remained in use until the early 1970s. In 1978 the Consumer Product Safety Commission banned the residential use of lead-based paint altogether.10
Unfortunately, the ban did nothing to address the millions of homes built before 1978 that likely contain lead-based paint. As this paint deteriorates, it can chip and peel or further degrade into lead dust. Small children can ingest paint chips or lead dust on their hands, and anyone can breathe in lead dust, posing a significant health hazard to children and families.
Nationally, approximately 24 million housing units have deteriorated lead-based paint and elevated levels of lead-contaminated house dust. More than 4 million of these dwellings are home to one or more young children.11 In Ohio, about 40% of the housing units were built prior to 1970;12 about 11% of the housing
10 “CPSC Announces Final Ban on Lead-Containing Paint,” Consumer Product Safety Commission, Release # 77-096
(September 2, 1977): accessed on October 20, 2015, http://www.cpsc.gov/en/recalls/1977/cpsc-announces-final-ban-on-lead-containing-paint/.
11 “Lead,” Center for Disease Control and Prevention, last modified October 26, 2015, http://www.cdc.gov/nceh/lead/.
12 “Selected Housing Characteristics: 2008-2013 American Community Survey 5-Year Estimates,” United States Census Bureau, accessed November 05, 2015, http://factfinder2.census.gov/faces/tableservices/jsf/pages/productview.xhtml?pid=ACS_12_5YR_DP04.

4 March 2016
in the state was constructed before 1950.13 The Ohio Department of Health estimates that up to 3.7 million Ohio housing units contain some lead-based paint on interior or exterior surfaces, or both.14
In Toledo there are 108,689 housing units constructed prior to 1970 when lead paint was still being used in housing construction.15
B. Effects of Lead Poisoning in Children
Lead poisoning occurs when lead builds up in the bloodstream over time. Lead poisoning is largely preventable if the source of lead is identified and contained or removed, but it often goes untreated, leaving children to suffer its negative effects. Lead poisoning imposes devastating personal harms on children. Symptoms of lead poisoning in children may include:
Developmental delay Weight loss Vomiting
Learning difficulties Sluggishness and fatigue Constipation
Irritability Abdominal pain Hearing loss
Loss of appetite16
Young children are particularly vulnerable to lead poisoning because their bodies are developing quickly, and the effects can last throughout their lives. The CDC estimates that approximately half a million children in the U.S. between the ages of 1 and 5 have blood lead levels (BLLs) higher than 5 μg/dL.17 And lead can cause problems even before birth if a woman is exposed to lead paint or dust while pregnant, sometimes resulting in fetal abnormalities.18
Possible neuropsychological problems associated with lead exposure include:
Delayed language or motor milestones (infant, toddler)
Poor speech articulation
13 “Data and Statistics on Lead Poisoning – Children,” Ohio Department of Health, last modified August 08, 2015, https://www.odh.ohio.gov/odhprograms/eh/lead_ch/lead_data.aspx.
14 “Data and Statistics on Lead Poisoning – Children.” 15 Data from the 2010 Census American Factfinder. 16 http://kidshealth.org/en/parents/lead-poisoning.html 17 http://www.cdc.gov/nceh/lead/ 18 Ibid.
5 March 2016
Poor language understanding or usage
Problems maintaining attention in school or home
High activity level (hyperactivity)
Problems with learning and remembering new information
Rigid, inflexible problem-solving abilities
Delayed general intellectual abilities
Learning problems in school (reading, language, math, writing)
Problems controlling behavior (e.g., aggressive, impulsive)
Problems with fine or gross motor coordination19
Despite the very real and measurable impacts of lead poisoning on children, their families, and society at large, children who are lead poisoned often exhibit few or no obvious symptoms at the time when intervention is most effective: when the child is young. A blood test is the only sure way to confirm a case of lead poisoning.
The Centers for Disease Control and Prevention (CDC) has set 5 micrograms of lead per deciliter of blood (5 μg/dL) as the “blood lead level of concern”.20 The CDC adopted this standard in May 2012, changing the level of concern from 10 μg/dL to reflect improvements in lead detection technology and to address the lasting effects that even a small amount of lead exposure can have on small children.21 Parents of children with blood lead levels (BLLs) of 5 μg/dL or above are advised to check the home and other places that the child frequents (for example, a day care facility or the home of a caretaking relative) for sources of lead exposure. A child whose BLL equals or exceeds 45 μg/dL requires medical intervention in the form of chelation therapy.22 A recent study showed an adverse effect on children’s academic performance at school in those with a history of BLLs below 5 micrograms of lead per deciliter of blood (5 μg/dL) in early childhood. 23
19 http://www.mwph.org/programs/lead-treatment/effects 20 “Blood Lead Levels in Children,” Center for Disease Control and Prevention, accessed October 20, 2015,
http://www.cdc.gov/nceh/lead/ACCLPP/Lead_Levels_in_Children_Fact_Sheet.pdf . 21 Ibid. 22 Ibid. 23 Zhang N, Baker HW, Tufts M, Raymond RE, Salihu H, Elliott MR. Early childhood lead exposure and academic achievement:
evidence from Detroit public schools, 2008-2010. Am J Public Health. 2013;103(3):e72-e77.

6 March 2016
III. LEAD POISONING IN OHIO
The Ohio Department of Health estimates that approximately 19,000 Ohio children have lead poisoning (2014 estimates).24 While lead poisoning rates have declined in Ohio over the last decade, rates in Lucas County have remained consistently higher than the state average. According to ODH reports, 0.8% of Ohio children who were tested for lead25 were positive for elevated blood-lead levels of 10 μg/dL or higher.26 The rate in Lucas County was higher than the statewide rate, with 1.35% of tested children testing positive.27 The city of Toledo was even higher – nearly double the statewide rate, with 1.57% of tested children testing positive for lead poisoning.28 (These reported rates use the outdated 10 μg/dL standard for a positive test for lead. Ohio has adopted the more stringent 5 μg/dL BLL of concern recommended by CDC, and so reported rates for more recent data years can be expected to be higher.)
24 Ibid. 25 It is very important when discussing rates for lead poisoning to note the denominator used. Rates reported here are percentages
of children with elevated BLLs with respect only to the number of children TESTED; they are NOT rates for all children. For example, it is correct to say that 0.8% of children tested were positive for an elevated BLL. It is NOT correct to say that 0.8% of Ohio children had an elevated BLL.
26 “Data and Statistics on Lead Poisoning – Children.” 27 Ibid. 28 Ibid.
7 March 2016
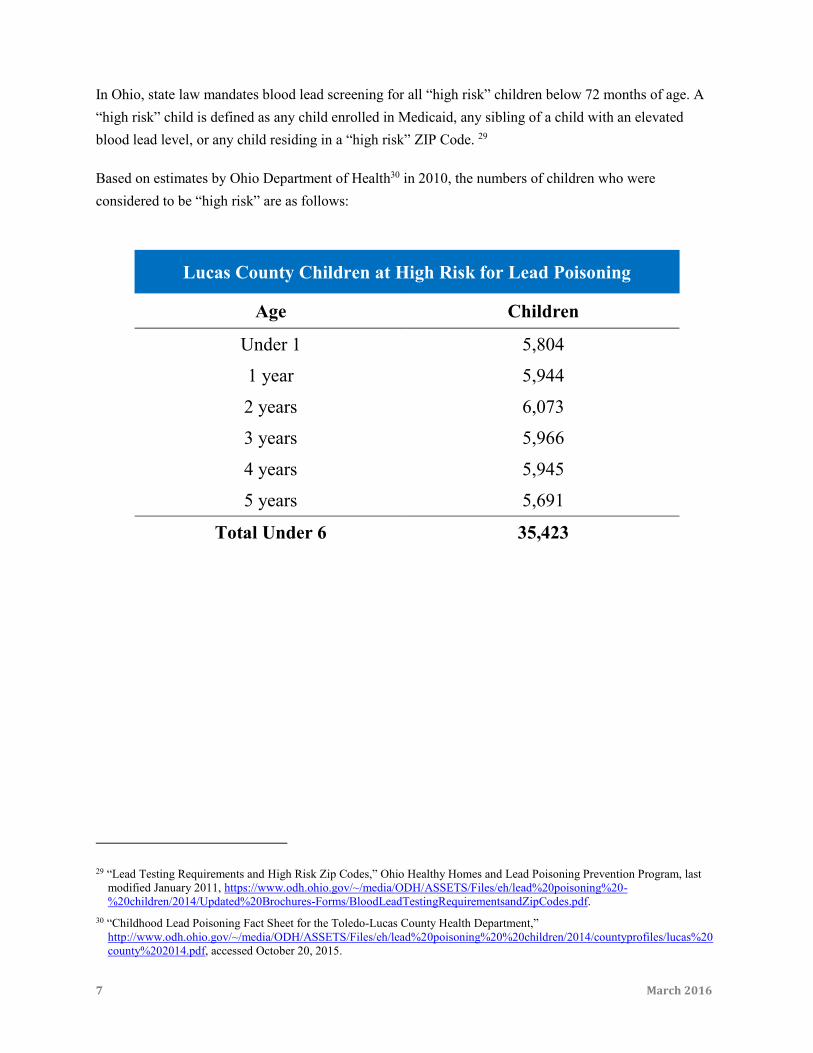
In Ohio, state law mandates blood lead screening for all “high risk” children below 72 months of age. A “high risk” child is defined as any child enrolled in Medicaid, any sibling of a child with an elevated blood lead level, or any child residing in a “high risk” ZIP Code. 29
Based on estimates by Ohio Department of Health30 in 2010, the numbers of children who were considered to be “high risk” are as follows:
Lucas County Children at High Risk for Lead Poisoning
Age Children
Under 1 5,804
1 year 5,944
2 years 6,073
3 years 5,966
4 years 5,945
5 years 5,691
Total Under 6 35,423
29 “Lead Testing Requirements and High Risk Zip Codes,” Ohio Healthy Homes and Lead Poisoning Prevention Program, last modified January 2011, https://www.odh.ohio.gov/~/media/ODH/ASSETS/Files/eh/lead%20poisoning%20-%20children/2014/Updated%20Brochures-Forms/BloodLeadTestingRequirementsandZipCodes.pdf.
30 “Childhood Lead Poisoning Fact Sheet for the Toledo-Lucas County Health Department,” http://www.odh.ohio.gov/~/media/ODH/ASSETS/Files/eh/lead%20poisoning%20%20children/2014/countyprofiles/lucas%20county%202014.pdf, accessed October 20, 2015.

8 March 2016
IV. LEAD POISONING IN TOLEDO’S AFRICAN AMERICAN COMMUNITY
A. Where in Toledo do African Americans live?
To determine whether Toledo’s African American population is disproportionately affected by lead poisoning, we first need to establish where in Toledo the larger proportion of African Americans live.
In this analysis, we define the Environmental Justice (EJ) population of concern as the group of Toledo census tracts that have a percentage African American population higher than that of the City of Toledo overall (27.2%).31
31 All population data in this report is taken from the 2010 Decennial Census, SF1 100% Data, Tables PCT12A,B,H,I,J (race and ethnicity counts) and PCT12 (total population). Decennial data were chosen over the more recent American Community Survey 2010-2014 5-Year Estimates because the decennial data are available in single-year estimates, allowing to aggregate population data for the 0-5 age range. ACS data are pre-aggregated into age groups 0-4 and 5-9 and cannot be disaggregated to the 0-5 age range.
Geographic Area
Population (2010 Census)
Black Population
Percent Black
EJ Area 98,254 57,050 58.1%
Rest of Toledo 188,078 20,883 11.1%
All Toledo Tracts 286,332 77,933 27.2%

9 March 2016

10 March 2016
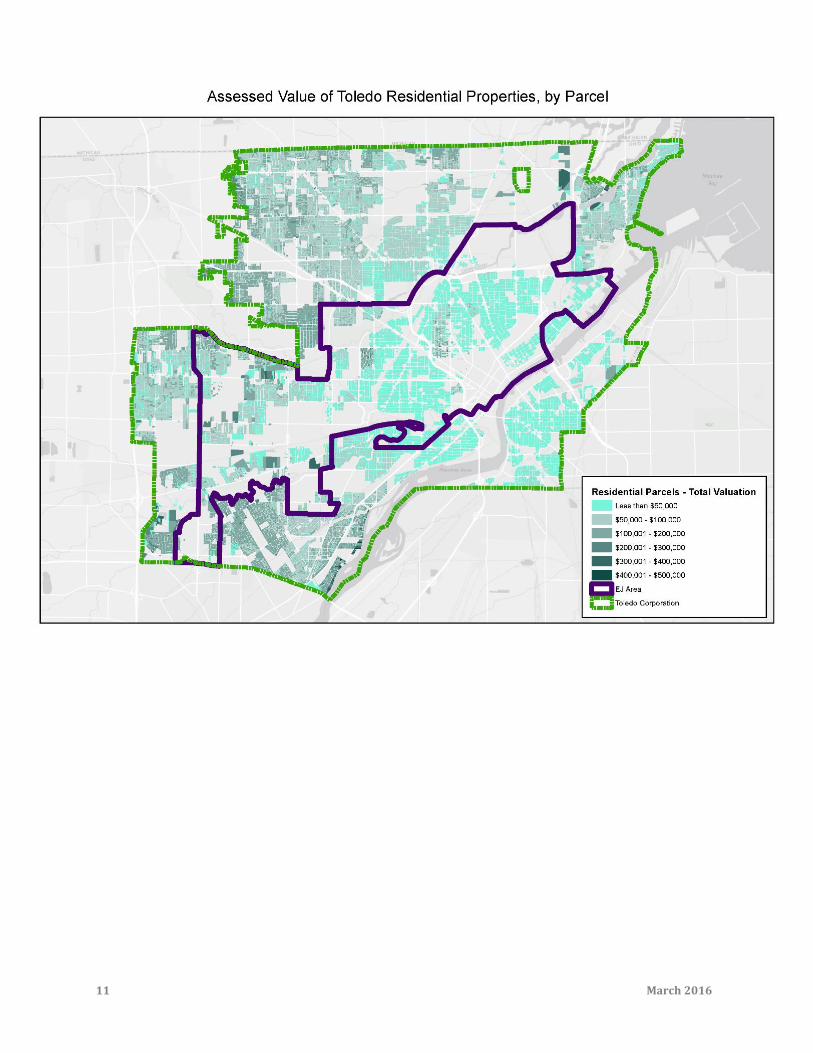
B. What is the quality of housing stock where African Americans live?
As was previously discussed, both the age of a home and the likelihood that the home has been renovated or maintained bear on the risk of lead exposure. Older housing, particularly housing built before 1970, has a higher risk of the presence of lead-based paint. Lower-value housing is less likely to have been renovated to address lead hazards.
The following two maps show residential parcels in the City of Toledo classified according to the age of the residential structure on the property and the property’s assessed value. Each map is overlaid with the outline of the EJ area. As can be seen on the maps, the housing stock in the EJ area is both older and lower-valued than that in the remainder of Toledo—both conditions that increase the likelihood of a lead hazard.
11 March 2016

12 March 2016
C. Which areas of Toledo have been identified by the Ohio Department of Health as high-risk for lead poisoning?
The Ohio Department of Health has designated 15 Lucas County ZIP Codes areas, shown below, as high-risk for lead poisoning:32
As can be seen from the map, the entire city of Toledo—including, but not limited to, the EJ area—is defined as “high risk” for compliance with ODH lead testing requirements.
32 ODH Blood Lead Testing Requirements, accessed from https://www.odh.ohio.gov/odhprograms/eh/lead_ch/leadch1.aspx

13 March 2016
Not all ZIP Code areas present equal risk of lead exposure, however. In designating these ZIP Codes as high risk, ODH relied upon a statistical analysis conducted by the Ohio State University Statistical Consulting Service. The resulting Final Report on Targeted Testing Plan for Childhood Lead Poisoning33
provides census tract level estimates of the probability of a child residing in each tract being lead-poisoned. The higher the probability, the higher the risk, and the more likely a child living in that tract will be lead poisoned.34 A map of these probabilities shows that risk is not evenly distributed across ZIP Codes; instead, the higher risk census tracts are located in the center of Toledo, largely concentrated in the EJ area.
33 Available from Ohio Healthy Homes and Lead Poisoning Prevention Program, Ohio Department of Health. Submitted 13 April 2013.
34 Because ZIP Code and census tract boundaries rarely coincide, a direct conversion of tracts to ZIP Codes cannot be done. Out of an abundance of caution, ODH elected to define any ZIP Code as “high risk” if the ZIP Code overlaps any census tract with a greater than 10% probability that a child’s BLL is 5 µg/dL or greater. (ibid., pp. 37-38, and email correspondence between Norris and ODH).

14 March 2016
15 March 2016
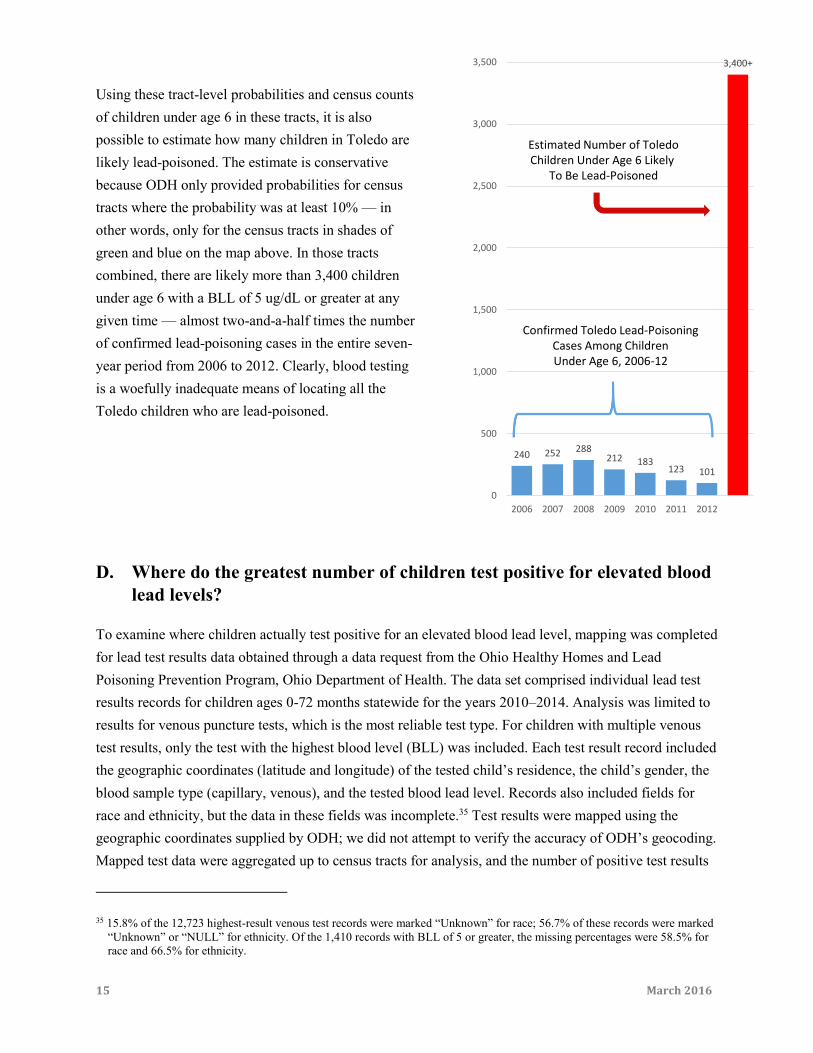
Using these tract-level probabilities and census counts of children under age 6 in these tracts, it is also possible to estimate how many children in Toledo are likely lead-poisoned. The estimate is conservative because ODH only provided probabilities for census tracts where the probability was at least 10% — in other words, only for the census tracts in shades of green and blue on the map above. In those tracts combined, there are likely more than 3,400 children under age 6 with a BLL of 5 ug/dL or greater at any given time — almost two-and-a-half times the number of confirmed lead-poisoning cases in the entire seven-year period from 2006 to 2012. Clearly, blood testing is a woefully inadequate means of locating all the Toledo children who are lead-poisoned.
D. Where do the greatest number of children test positive for elevated blood lead levels?
To examine where children actually test positive for an elevated blood lead level, mapping was completed for lead test results data obtained through a data request from the Ohio Healthy Homes and Lead Poisoning Prevention Program, Ohio Department of Health. The data set comprised individual lead test results records for children ages 0-72 months statewide for the years 2010–2014. Analysis was limited to results for venous puncture tests, which is the most reliable test type. For children with multiple venous test results, only the test with the highest blood level (BLL) was included. Each test result record included the geographic coordinates (latitude and longitude) of the tested child’s residence, the child’s gender, the blood sample type (capillary, venous), and the tested blood lead level. Records also included fields for race and ethnicity, but the data in these fields was incomplete.35 Test results were mapped using the geographic coordinates supplied by ODH; we did not attempt to verify the accuracy of ODH’s geocoding. Mapped test data were aggregated up to census tracts for analysis, and the number of positive test results
35 15.8% of the 12,723 highest-result venous test records were marked “Unknown” for race; 56.7% of these records were marked “Unknown” or “NULL” for ethnicity. Of the 1,410 records with BLL of 5 or greater, the missing percentages were 58.5% for race and 66.5% for ethnicity.
240 252 288212 183
123 101
3,400+
0
500
1,000
1,500
2,000
2,500
3,000
3,500
2006 2007 2008 2009 2010 2011 2012
Confirmed Toledo Lead-PoisoningCases Among ChildrenUnder Age 6, 2006-12
Estimated Number of ToledoChildren Under Age 6 Likely
To Be Lead-Poisoned

16 March 2016
per 1,000 children under age 6 was calculated for each tract to account for differences in population between tracts.
Geographic Area
Percent Black
Positives: Venous Tests w/ BLL of 5
ug/dL or greater, 2010-14
Children Under Age 6
Positives per 1,000 Children Under 6
EJ Area 58.1% 797 8,737 18.2
Rest of Toledo 11.1% 613 16,338 7.5
All Toledo Tracts 27.2% 1,410 25,075 11.2

17 March 2016
As the map above clearly shows, tracts with the highest rates of positive lead test results are again concentrated in the EJ area.
E. Are the positive test rates significantly different inside the EJ area versus the rest of Toledo?
The maps presented thus far provide compelling visual evidence of a difference in lead poisoning risk and occurrence between the EJ area and the rest of Toledo. A statistical comparison of positive test rates between these two areas confirms that a statistically significant difference in rates exists, and that the rate is significantly higher in EJ area tracts.
A Mann-Whitney test was chosen to compare the EJ and non-EJ lead testing results. The Mann-Whitney is a nonparametric statistical test to compare two sample medians. The Mann-Whitney assumes two

18 March 2016
sample sets of data are independent and come from distributions that are similar. The test also assumes that the two samples have equal variances.36 Statistical analysis was conducted in Minitab v. 16.2.4.
The data set consisted of the calculated rate per 1,000 children of positive elevated BLL test results for all EJ tracts (EJ_AA, N = 40 tracts) and for all non-EJ tracts (Non_EJ_AA, N = 55 tracts). The calculated median values for the two groups of census tracts were 20.840 positive tests per 1,000 children for the EJ tracts and 3.488 positive tests per 1,000 children for the non-EJ tracts. The statistical test, then, was to determine if the difference between these two medians is statistically significant.
Details of the Mann-Whitney test results are below.
To be significant, the calculated point estimate for the difference between the medians of the EJ and non-EJ distributions (15.598) must lie within the 95% confidence interval (CI) for the difference; that is, it must be between 8.670 and 19.514. In fact, that is the case, meaning that difference between the positive test rates in the two areas is statistically significant, the EJ area having a significantly higher positive elevated BLL test rate.
36 We also ran a Welch’s t-Test, a variation on a two-sample t-Test that does not assume equal variances. That test also showed a statistically significant difference in the two groups, EJ and non-EJ.
Mann-Whitney Test and CI: EJ_AA, Non_EJ_AA
N Median
EJ_AA 40 20.840
Non_EJ_AA 55 3.488
Point estimate for ETA1-ETA2 is 15.598
95.0 Percent CI for ETA1-ETA2 is (8.670,19.514)
W = 2653.5
Test of ETA1 = ETA2 vs ETA1 not = ETA2 is significant at 0.0000
The test is significant at 0.0000 (adjusted for ties)

19 March 2016
Comparison of the Distributions of Positive Elevated BLL Results for EJ and Non-EJ Tracts

20 March 2016
F. Where are the highest rates of positive venous tests? (BLL of 5 μg/dL or greater)?
The previous analysis, was concerned with the number of positive tests per 1,000 children (i.e., the rate per child), normalizing the COUNT of positives to the population of children.
Here, the question is: Of the venous tests administered, what percentage showed an elevated BLL (5 μg/dL or greater)? Put another way, where does venous testing yield the highest rate of positives?
Results are shown on the map below. Statistical analysis showed that rates are significantly higher in EJ census tracts compared to non-EJ tracts (analysis not shown).37
37 The entire statistical analysis of venous lead test results described here for the EJ area as defined by the African
American population was also conducted for an EJ area including all minorities in Toledo (i.e., all but White non-Hispanics). That analysis also showed a statistically significant difference in elevated BLL’s for predominantly minority versus White non-Hispanic areas of Toledo (results not shown).

21 March 2016
V. IMPLICATIONS AND POLICY RECOMMENDATIONS
Lead poisoning is a serious problem in the city of Toledo, and the problem is clearly concentrated in the low-income and African American communities, where most of the housing stock was built prior to 1950. The data collected and analyzed in this report establishes that there is a disparate impact of lead poisoning on low-income, primarily African American families living in an area defined by data as an Environmental Justice area.
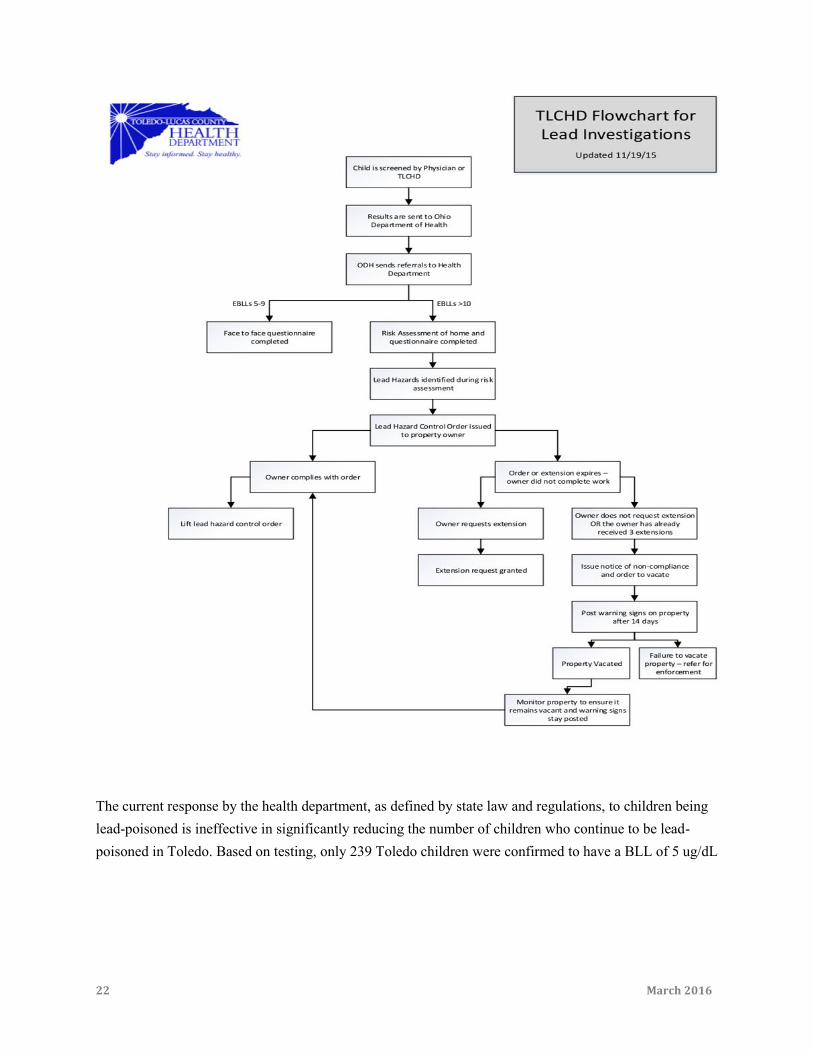
Under the current regulatory structure to address lead poisoning in Ohio, the response to lead poisoning is triggered by a child being lead poisoned. In other words, we use children as “lead detectors” in order to initiate an investigation to determine the existence and location of lead hazards.
The first step in this process is a venous test for an elevated blood leads level. All 12- and 24-month-old Medicaid-eligible children must have a blood lead screening test, regardless of ZIP Code or exposure to lead.
A confirmed positive test for lead (BLL = 5 μg/dL or greater) can trigger several actions, depending on the child’s blood lead level and age.
1. If the child is under 6 years of age, a public health lead investigation is ordered to determine the source of the lead hazard.
a. For children with a blood lead level of 5 μg/dL or greater but less than 10 μg/dL, the county health department shall cause the completion of a comprehensive questionnaire, which must be completed or reviewed by a public health lead investigator.
b. The public health lead investigator shall be responsible for any follow-up actions deemed necessary (e.g., provide educational materials to the family, conduct a public health lead risk assessment).
c. For children with a blood lead level of 10 μg/dL or greater, the director shall conduct an on-site risk assessment of a residential unit, child care facility or school.
d. The assessment shall be performed by a public health lead investigator.38
2. If the child is between 6 and 16 years of age, a public health lead investigation may be conducted to determine the source of the lead hazard.
The complete process is laid out in the flow chart.
38 Ohio Administrative Code 3701-30-07, “Public Health Lead Investigations,” LawWriter, accessed October 20, 2015,
http://codes.ohio.gov/oac/3701-30-07.
22 March 2016
The current response by the health department, as defined by state law and regulations, to children being lead-poisoned is ineffective in significantly reducing the number of children who continue to be lead-poisoned in Toledo. Based on testing, only 239 Toledo children were confirmed to have a BLL of 5 ug/dL

23 March 2016
or greater in 2014.39 By comparison, the Ohio Department of Health estimates that 35,423 children under age 6 are at high risk for lead poisoning in Toledo.40 The difference between the number of children being identified as being lead poisoned and the number who are at high risk for being lead poisoned in Toledo is due to the fact that Ohio has only recently reduced the BLL from 10 ug/dL to 5 ug/dL. The second contributing factor is that an estimated screening rate for lead poisoning of children aged 1–2 years is 33.4%.41
When one examines the location of the high-risk zip codes, predicted high blood lead levels, and housing built before 1950 in the City of Toledo, one can see that these variables geographically coincide with communities of color. African American children are concentrated in the areas of Toledo with the oldest housing and the highest predicted blood lead levels. The failure to take a preventative approach to lead poisoning has had a disparate impact on low-income communities and children of color.
Toledo could help to ensure fair access to opportunity by requiring that residential lead hazards be addressed, protecting children who reside in high-risk housing from the damaging, permanent effects of lead poisoning which decrease the chances for a full, productive life. A major step in significantly reducing lead poisoning of children in central Toledo would be to adopt and fully implement a primary preventive policy that addresses lead poisoning before a child is poisoned.
The poisoning of a child should not be the event that initiates action to remove lead hazards from the child’s home. An ordinance to require residential rental property owners to fully inspect for, and correct, lead hazards before the property is rented to a family with children can prevent lead poisoning from occurring in the first place.
39 If unconfirmed test results over 5 µg/dL are included, the number of Toledo children with an elevated BLL increases to 405.
https://www.odh.ohio.gov/odhprograms/eh/lead_ch/lead_data.aspx 40 “Childhood Lead Poisoning Fact Sheet for the Toledo-Lucas County Health Department,”
http://www.odh.ohio.gov/~/media/ODH/ASSETS/Files/eh/lead%20poisoning%20-%20children/2014/countyprofiles/lucas%20county%202014.pdf, accessed October 20, 2015. See also Table, p. 6.
41 http://www.cdc.gov/mmwr/preview/mmwrhtml/su6302a6.htm#Tab2

24 March 2016
VI. PROPOSED LEAD POISONING PREVENTION ORDINANCE
The Ordinance would require that every owner of a residential rental property constructed prior to 1978 must have the property inspected for potential lead hazards and maintain such property free from potential lead hazards. If an inspection of the residential rental property shows the existence of potential lead hazards, the owner must have the potential lead hazard corrected, before the property can be rented. The Ordinance would further require the owner to obtain a Certification from the Toledo–Lucas County Health Department that the rental property is Lead Safe, before letting or otherwise permitting the occupancy of such residential rental property.
The proposed Toledo Ordinance is closely modeled after an approach that was adopted by Rochester, New York in 2004. Rochester’s lead law targets high-risk housing to cost-effectively control lead hazards before children are poisoned. The policy integrates a visual inspection for deteriorated paint into the existing certificate of occupancy inspection system for pre-1978 rental housing. Under the lead law, property owners must correct any identified lead hazard violations before receiving a certificate of occupancy. To reduce compliance costs, the law allows owners or workers who have training in lead-safe work practices to complete repair work, rather than requiring U.S. Environmental Protection Agency (EPA)–certified abatement workers. The law allows the use of interim controls to address hazards. Interim controls such as repainting are less expensive than full lead abatement (permanent encapsulation or removal of lead).
As a result of the Rochester, NY initiative, the number of children under 6 newly diagnosed with elevated levels of lead in their blood has dropped 85 percent over the past decade.42 With the same level of commitment towards implementation of the proposed Ordinance, the City of Toledo could produce similar results in significantly reducing lead poisoning of our children.
The city of Toledo has the opportunity to enact an ordinance requiring that residential rental properties be lead-safe before a family with young children moves in. The goal of this proposed ordinance is to address the dangers of lead for families who are residential rental property tenants. African American and low-income families are concentrated in the high-risk ZIP Codes in the City of Toledo and are at a much greater risk for lead poisoning than other families. Without a preventative approach to reducing exposure to lead as set forth in the proposed Toledo Ordinance, the dangers posed by lead poisoning will continue to fall disproportionately on Toledo’s on low-income and African American children.
42 http://rochesterenvironment.com/Issues/Lead_Poisoning_NewsLinks.htm
25 March 2016
This report has been prepared jointly by:
David Norris Senior Researcher
The Kirwan Institute for the Study of Race and Ethnicity The Ohio State University 33 West 11th Avenue Columbus, OH 43210
(614) 292-2430 [email protected] http://kirwaninstitute.osu.edu
Robert Cole Managing Attorney, Meaningful Access to Education Practice Group
Advocates for Basic Legal Equality, Inc. 525 Jefferson Ave., Ste. 300 Toledo, OH 43604
(419) 930-2503 [email protected] www.ablelaw.org